Strong Negative Electrothermal Feedback in Thermal Kinetic Inductance Detectors
Abstract
We demonstrate strong negative electrothermal feedback accelerating and linearizing the response of a thermal kinetic inductance detector (TKID). TKIDs are a proposed highly multiplexable replacement to transition-edge sensors and measure power through the temperature-dependent resonant frequency of a superconducting microresonator bolometer. At high readout probe power and probe frequency detuned from the TKID resonant frequency, we observe electrothermal feedback loop gain up to 16 through measuring the reduction of settling time. We also show that the detector response has no detectable non-linearity over a 38% range of incident power and that the noise-equivalent power is below the design photon noise.
I Introduction And Motivation
We present observations of strong negative electrothermal feedback in a thermal kinetic inductance detector (TKID). TKIDs are cryogenic bolometers that detect minute power fluctuations by measuring the temperature fluctuations of a suspended absorber Ulbricht et al. (2015); Quaranta et al. (2013); Arndt et al. (2017); Timofeev et al. (2014); Dabironezare et al. (2018); Wernis (2013). The suspended absorber is connected to a thermal bath with a weak thermal link so that the incident power and the suspended absorber temperature are related approximately linearly. In a TKID, the temperature rise is measured through the temperature dependence of the kinetic inductance effect in a superconducting inductor on the suspended absorber. The inductor is coupled to a capacitor to form a superconducting microresonator, such that the incident power is measured by the change in the resonant frequency. The resonant frequency is measured through the phase shift of a readout probe signal, which normally is at a low enough power (much less than the incident power which is being measured) such that the TKID dynamics are not altered by the probe.
Negative electrothermal feedback occurs in bolometers when the power dissipated in the temperature sensor has a negative temperature dependence. Strong electrothermal feedback through Joule heating reduces non-linearities and resolution limitations in voltage-biased transition-edge sensors Irwin (1995). Feedback reduces Johnson noise in bolometers using resistive sensors Mather (1982). In a detector with negative electrothermal feedback, dissipated readout power decreases rapidly with increasing temperature, such that temperature deviations from the operating point return to the mean more rapidly. Total power flux is held nearly constant, as readout power compensates for changes in incident power, which increases the linearity of the bolometer. In the strong electrothermal feedback regime with transition-edge bolometers, this effect reduces the time constant of the detector by an order of magnitude Irwin and Hilton (2005). These benefits have led to numerous applications for transition-edge sensors, where strong electrothermal feedback produces fast, linear, and photon noise limited sensors for millimeter-wave detection Anderson et al. (2020); Zhang et al. (2020); Koopman et al. (2018) and X-ray calorimeters with eV energy resolution Szypryt et al. (2019).
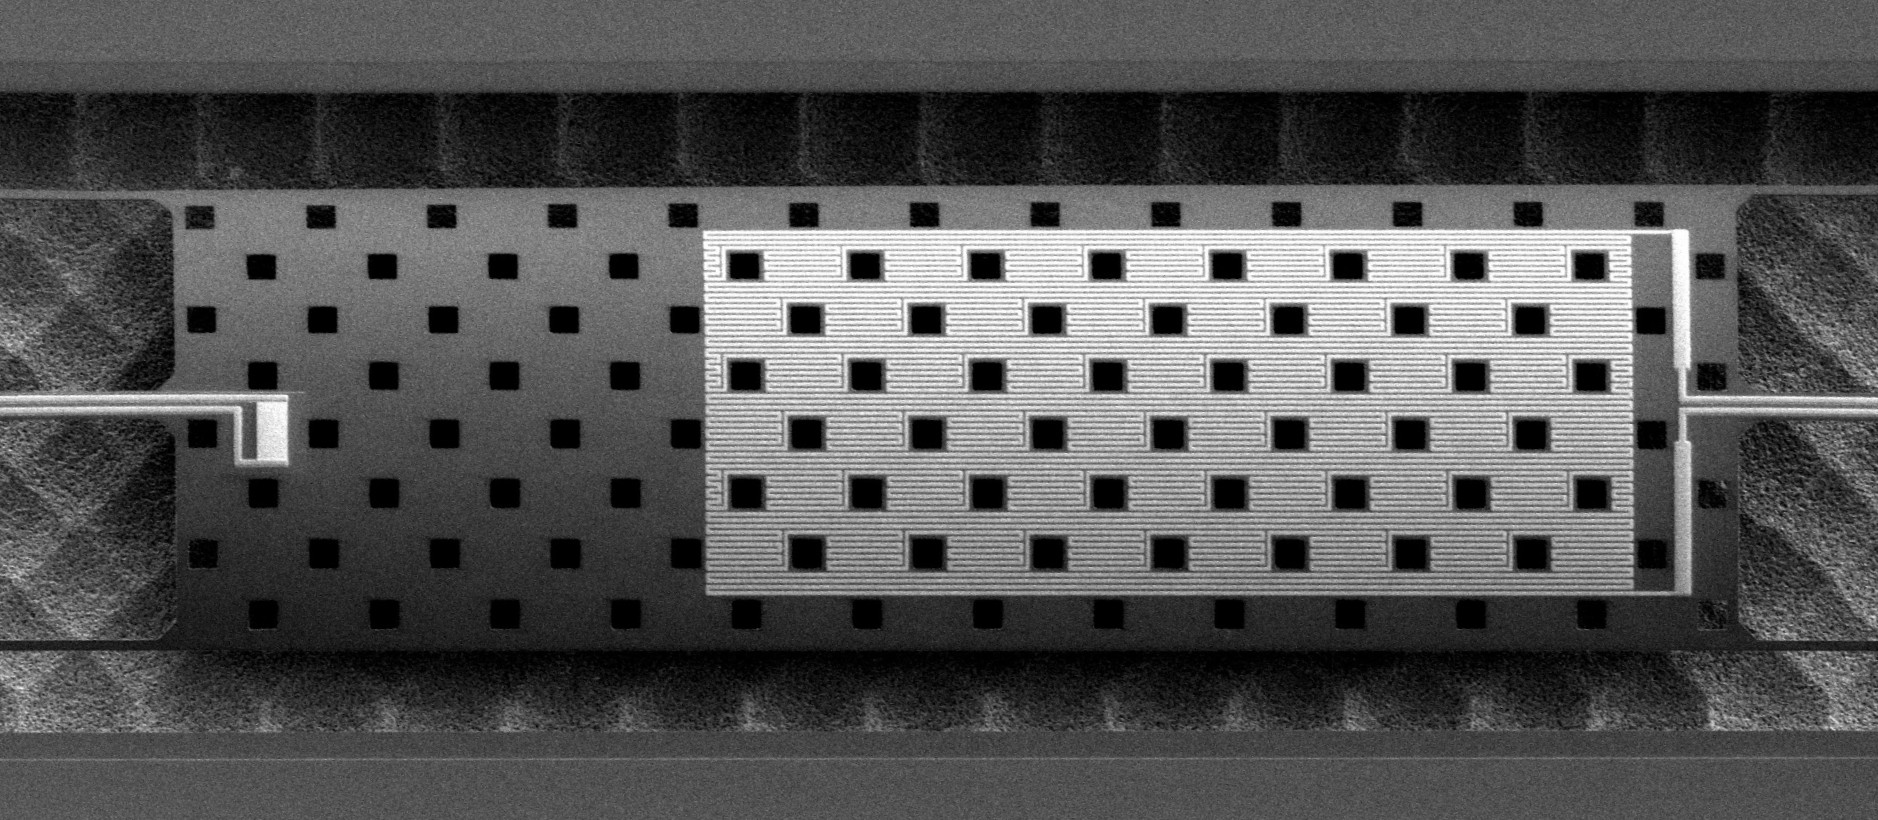
Lindeman Lindeman (2014) proposed a mechanism through which electrothermal feedback would occur in a TKID when the frequency of the readout probe signal was detuned from the resonant frequency. Detuning the probe frequency above the TKID’s resonant frequency, an increase in temperature of the suspended absorber decreases the resonant frequency due to an increase in kinetic inductance, moving the resonant frequency further from the probe frequency. This decreases the electrical power dissipated by the probe in the resonator, which in turn decreases the temperature of the suspended absorber, resulting in negative electrothermal feedback. The feedback can be strong in resonators with high quality factors, as there is a large change in absorption of power from the probe signal for a small change in resonant frequency. We demonstrate that this feedback occurs in a TKID device of the design previously presented and characterized at low readout power in Wandui et al Wandui et al. (2020) and shown in Fig. 1.
I.1 Modeling
We model the response of a TKID to probe signals of high power following the schematic in Fig. 2. Probe power enters port 1 of the transmission line and is modulated by the resonant circuit, and some phase-shifted fraction of it exits at port 2. Strong electrothermal feedback manifests as a non-linear response to high probe powers reminiscent of the Duffing oscillator. Similar behavior is observed in traditional hot quasiparticle kinetic inductance detectors due to the non-linearity of kinetic inductance near the superconducting critical current Swenson et al. (2013). To determine the non-linear behavior of a TKID, we first solve for the stable non-linear operating temperatures of the suspended absorber and then calculate the strength of the electrothermal feedback from the relation between probe power dissipation and absorber temperature.
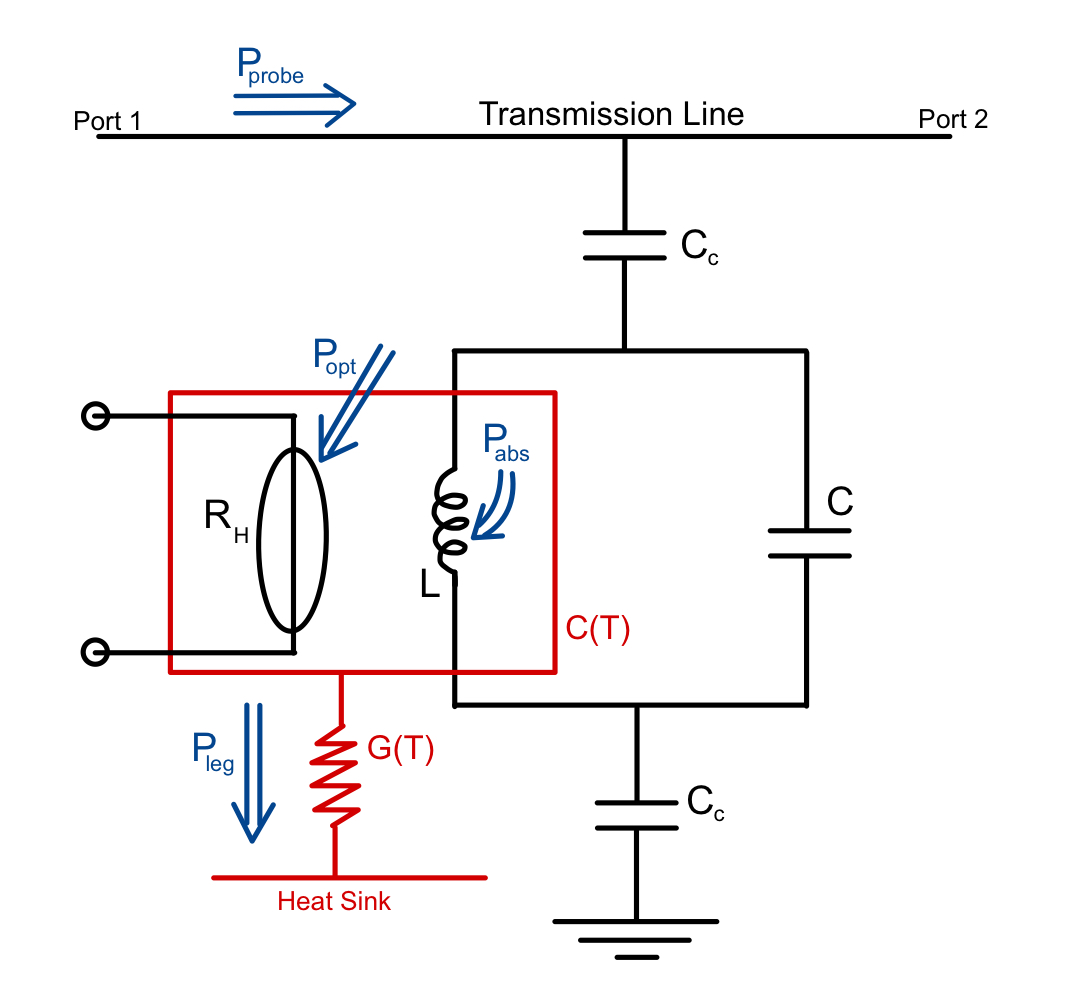
Incident power plus the readout probe power dissipated in the resonator heat the suspended absorber. is a fraction of the probe power ,
| (1) |
The dissipated probe power is limited by the coupling efficiency of the resonator to the transmission line, and the detuning efficiency of the resonator to the probe frequency. We generalize to complex coupling quality factors with complex angle for asymmetric resonances Khalil et al. (2012), where is the fractional frequency detuning and and are the internal and total quality factors,
| (2) |
The fractional energy loss per cycle from the resonator is a reciprocal sum of the absorption in the inductor and loss to the transmission line ,
| (3) |
At low temperature, the resonant frequency is . As the temperature rises, the frequency shifts to due to the temperature dependence of the kinetic inductance effect. We assume the superconductor follows Mattis-Bardeen theory for a thin film in its frequency shift and internal quality factor ,
| (4) |
| (5) |
where and are the Mattis-Bardeen derived absorption and frequency responses for a superconducting microresonator Zmuidzinas (2012). is the equilibrium quasiparticle density for a BCS superconductor at suspended absorber temperature with gap and density of states . For our aluminum films with critical temperature , we use 1.75 = 0.00015 eV/K and µm-3 eV-1. We use low temperature approximations to the Mattis-Bardeen integrals for , and ,
| (6) |
| (7) |
| (8) |
The suspended absorber has a heat capacity and is connected to a heat sink at temperature through a thermal conductance = = . The power transferred between the suspended absorber and the heat sink is = .
The thermal energy in the suspended absorber changes at a rate equal to net power entering and leaving the suspended absorber,
| (9) |
The steady-state solutions for the temperature thus satisfy + = . In order to be a stable solution, we additionally require , as otherwise a small perturbation in temperature will grow exponentially away from equilibrium. We show predicted stable temperature solutions for a range of probe powers in Fig. 3.
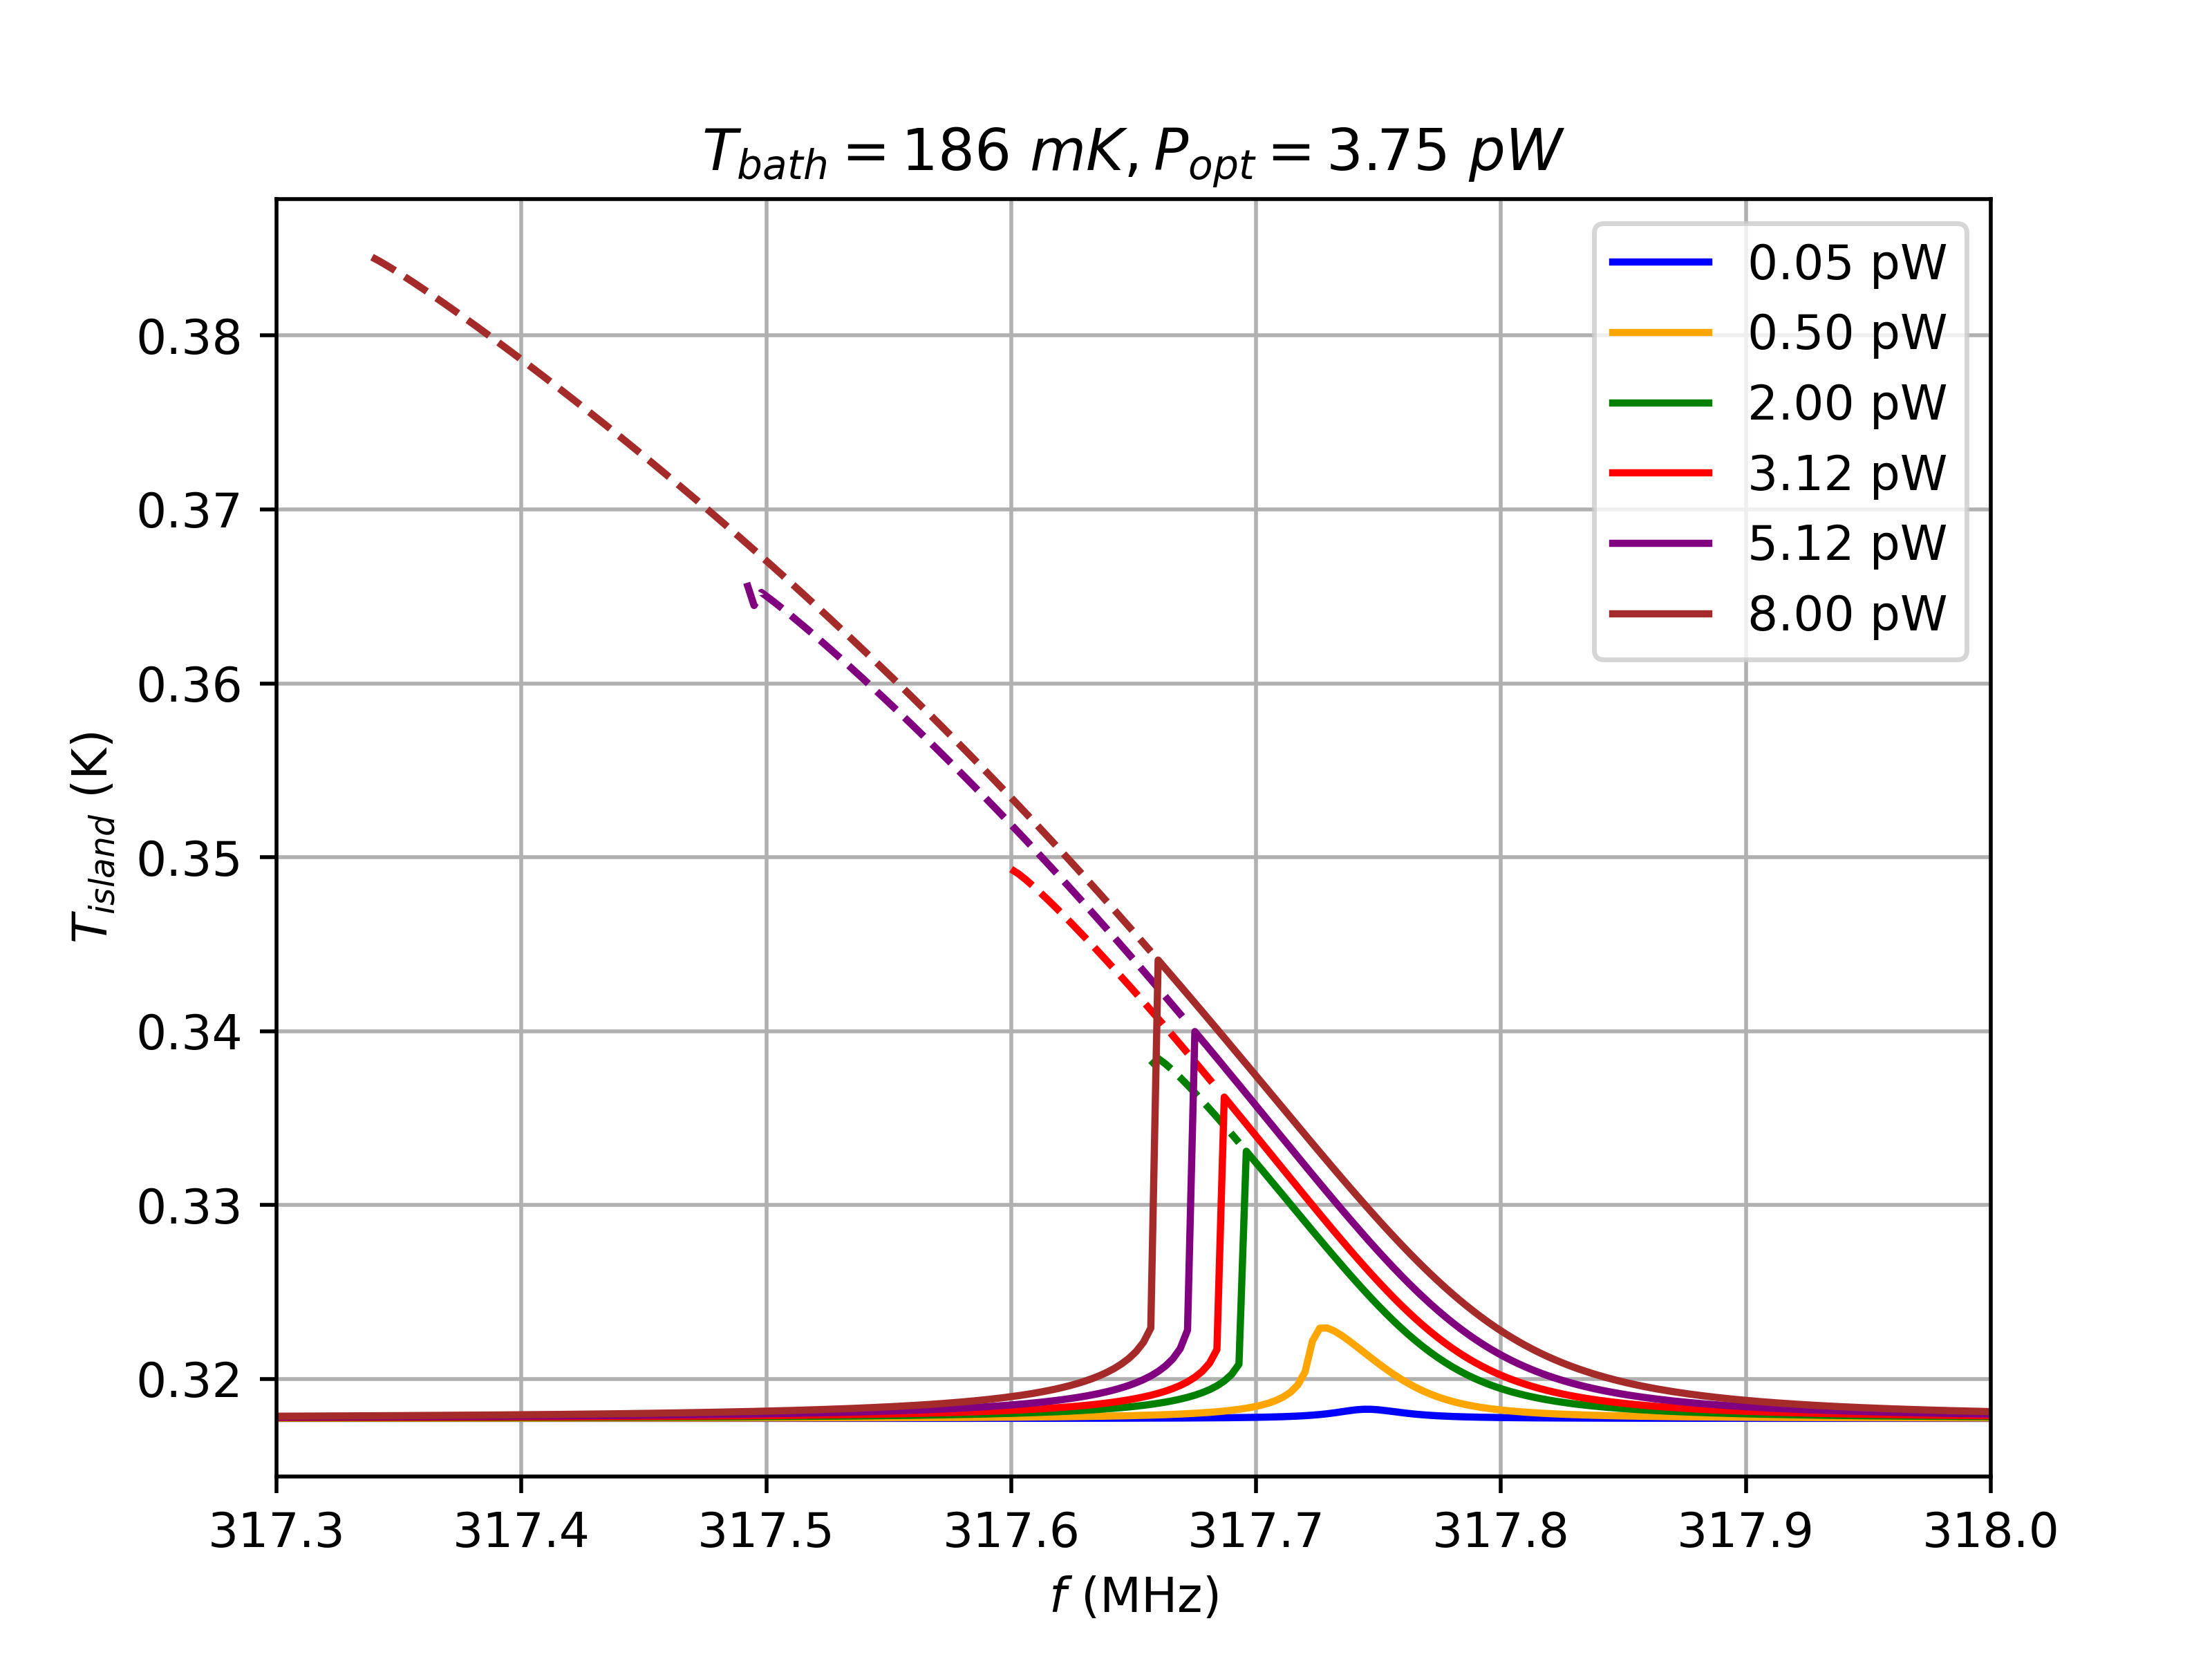
Like the Duffing oscillator, at high probe powers, the response to probe frequency sweeps splits into two stable branches. The stable branches are a cold branch with weak positive electrothermal feedback and a hot branch with strong negative electrothermal feedback. A third unstable branch exists at an intermediate temperature and experiences strong positive electrothermal feedback, so small perturbations grow rapidly away from equilibrium. We neglect this unstable solution, which is inaccessible to our experimental setup.
Qualitatively, we explain the extended hot branch and the lower bifurcation frequency in Fig. 3 as follows. If the probe frequency starts above the resonant frequency, we dissipate a small amount of power in the resonator that pushes its frequency slightly down. As we lower the probe frequency and have it approach the resonant frequency, the dissipated power grows, so the resonant frequency is further pushed down. The frequency gap must continue to close for the dissipated power to grow, so increases. Eventually, the frequency gap shrinks to zero, and the dissipated power is maximized. At this point, any further decrease in probe frequency decreases the dissipated power, and the resonant frequency begins rising and bifurcates back to the cold branch, leaving the probe frequency well below the resonant frequency.
We term these sweeps described above, where the probe frequency is stepped down slowly in small decrements, as “down sweeps”. “Up sweeps” are where we step the probe frequency up slowly in small increments, and these exhibit positive electrothermal feedback. In up sweeps, the probe frequency starts lower than the resonance frequency, and as power is dissipated in the resonator and positive electrothermal feedback becomes significant, the resonant frequency is pulled down and bifurcates to below the probe frequency.
Non-linear kinetic inductance Swenson et al. (2013) and quasiparticle heating Thomas, Withington, and Goldie (2015); Guruswamy et al. (2017) could produce similar non-linearities in our devices, without producing useful electrothermal feedback that speeds up the time constant or linearizes the response. In the case of non-linear kinetic inductance, as the current in the inductor approaches the critical current, the inductance increases, and the resonant frequency decreases, mimicking electrothermal feedback from the perspective of the probe. We minimize the impact of non-linear kinetic inductance in our setup by operating the TKID at higher temperatures, where it has strong responsivity, and therefore relatively low quality factors ( 10,000) and low current densities in the superconducting film.
Quasiparticle heating can also produce electrothermal feedback internal to the quasiparticle population, but without any useful reduction in the time constant. Quasiparticle heating is reduced due to our large volume inductor, which maximizes the thermal conductance between the quasiparticles and the phonons in the superconducting film. The quasiparticle to phonon thermal conductance also benefits from high temperatures, where the quasiparticle density is high and the quasiparticle lifetime is short.
I.2 Loop Gain and Time Constant
We model the dynamics of small perturbations in temperature by linearizing Eq. 9. We Taylor expand where , , where , and where now refers to a small perturbation in temperature from the equilibrium. With these substitutions the linearized version of Eq. 9 becomes
| (10) |
Following the convention for transition-edge sensors Irwin and Hilton (2005), we define loop gain as . Loop gain measures how strongly electrothermal feedback forces the temperature of the bolometer back to equilibrium, relative to the forcing due to the thermal link. Negative electrothermal feedback corresponds to positive loop gain due to the minus sign in the definition of . Solving the step response of Eq. 10 leads to the time constant for the bolometer
| (11) |
where is the intrinsic bolometer thermal time constant.
The effective electrothermal feedback is the derivative of with temperature, which from Eq. 1 is
| (12) |
To estimate loop gain in the strong negative electrothermal feedback regime, the term can be neglected, because it is temperature-dependent only through the internal quality factor, while is temperature-dependent through resonator frequency shifts. At the low probe frequencies of interest for TKIDs, the frequency shift effects are more significant than quality factor shifts by typically about an order of magnitude. We additionally assume that is zero in . Then, the temperature dependence of is contained in
| (13) |
The fractional frequency offset between probe and resonator that maximizes is
| (14) |
At this detuning (where the probe is between one-quarter and one-third of a linewidth above the resonant frequency), the power absorbed is
| (15) |
The loop gain at optimal detuning can be expressed in terms of , . We additionally define , in order to put the expression of the loop gain of a TKID into the same form as the loop gain of a transition-edge sensorIrwin and Hilton (2005):
| (16) |
I.3 Noise Model
The intrinsic noise of a TKID contains contributions from three sources: thermal fluctuations in the suspended absorber due to the exchange of phonons in the weak thermal link, quasiparticle number density fluctuations in the superconductor due to thermal generation and recombination of quasiparticles, and readout noise from the low noise amplifier Wandui et al. (2020). When the TKID is operated in the strong electrothermal feedback regime, we expect a significant change in the phonon noise and small changes in generation recombination noise and readout noise. We expect our devices to be strongly phonon noise limited. The phonon noise contribution to the noise-equivalent power of the detector,
| (17) |
includes , a factor that accounts for the lower temperature of the thermal bathMather (1982). Phonon noise will generally increase due to an increase in the total thermal power in the legs. A typical operating condition for transition-edge sensors is setting dissipated readout power equal to the incident power; for this setup, the phonon noise increases by a factor of if the detector thermal conductance is re-optimized to fix the suspended absorber temperature.
Changes in the quasiparticle generation recombination noise should be limited by the large volume of our inductor, as the quasiparticle population is in thermal equilibrium with the phonons in the suspended absorber. The readout noise should not vary much, because the decrease in coupling efficiency from detuning is compensated for by the increase in readout power, such that the absolute responsivity is only weakly dependent on probe power in the strong electrothermal feedback regime.
We also expect an additional source of frequency-dependent noise due to finite thermal conductance within the suspended absorber and distributed heat capacity. This effect is observed in transition-edge sensors at high loop gains Lee et al. (1998), manifesting as a rise in noise beyond the intrinsic thermal bandwidth of the suspended absorber. Our suspended absorber is approximately 300 nm thick, much thinner than the 1000 nm thick absorbers where we have observed this effect in transition-edge sensors Kernasovskiy (2020). This reduces the thermal conductance within the absorber which is limited by the cross-sectional area of the suspended absorber, due to the phonon analog of the Stefan-Boltzmann law.
II Results and Discussion
We studied a single TKID at high readout probe powers using the cryostat described in Wandui et al Wandui et al. (2020) and the software-defined radio system described in Minutolo et al Minutolo et al. (2019). To deposit incident power that is free of photon noise, we supplied DC to the gold heater resistor visible in Fig. 1 on the suspended absorber. The nominal incident power used in our experiments is = 3.75 pW which brings the aluminum inductor to a temperature where it has useful responsivity.
II.1 TKID Characterization
To characterize the TKID resonator at low readout probe power, we obtained transmission measurements by biasing the detector at a fixed probe power = pW and sweeping the probe frequency over 2001 equally-spaced points between MHz and MHz. We repeated this for 10 different values of bath temperature between 114 mK and 439 mK. A least-squares fit of the curves to Eq. 18 gives us the resonant frequency dependent on , which when fitted using Eqs. 4, 6, and 7, estimates 13500, 0.3, = 1.32 0.01 K, and = 0.50 0.03.
With the resonator now calibrated as a thermometer, we characterize the weak thermal link by sweeping the incident power in 31 steps between 0 and 23.4 pW with 186 mK. Least-squares fits to the responses determines the dependence of on . The approximation in Eqs. 9 and 1 gave us = 317.889 0.005 MHz, = 185 3 pW / Kn, and = 3.23 0.02. Our value of is consistent with similar bolometers with thin silicon nitride support legs used in BICEP/Keck Wandui et al. (2020).
II.2 Non-linear curves
We measured non-linear by biasing the detector at a range of fixed probe powers and performing both up and down sweeps, over 3000 equally-spaced probe frequencies between MHz and MHz. The bath temperature was regulated to 186 mK, and we fixed the incident power at 3.75 pW. The predicted is given by
| (18) |
where and are determined by solving for the stable suspended absorber temperature as described in Section I.1.
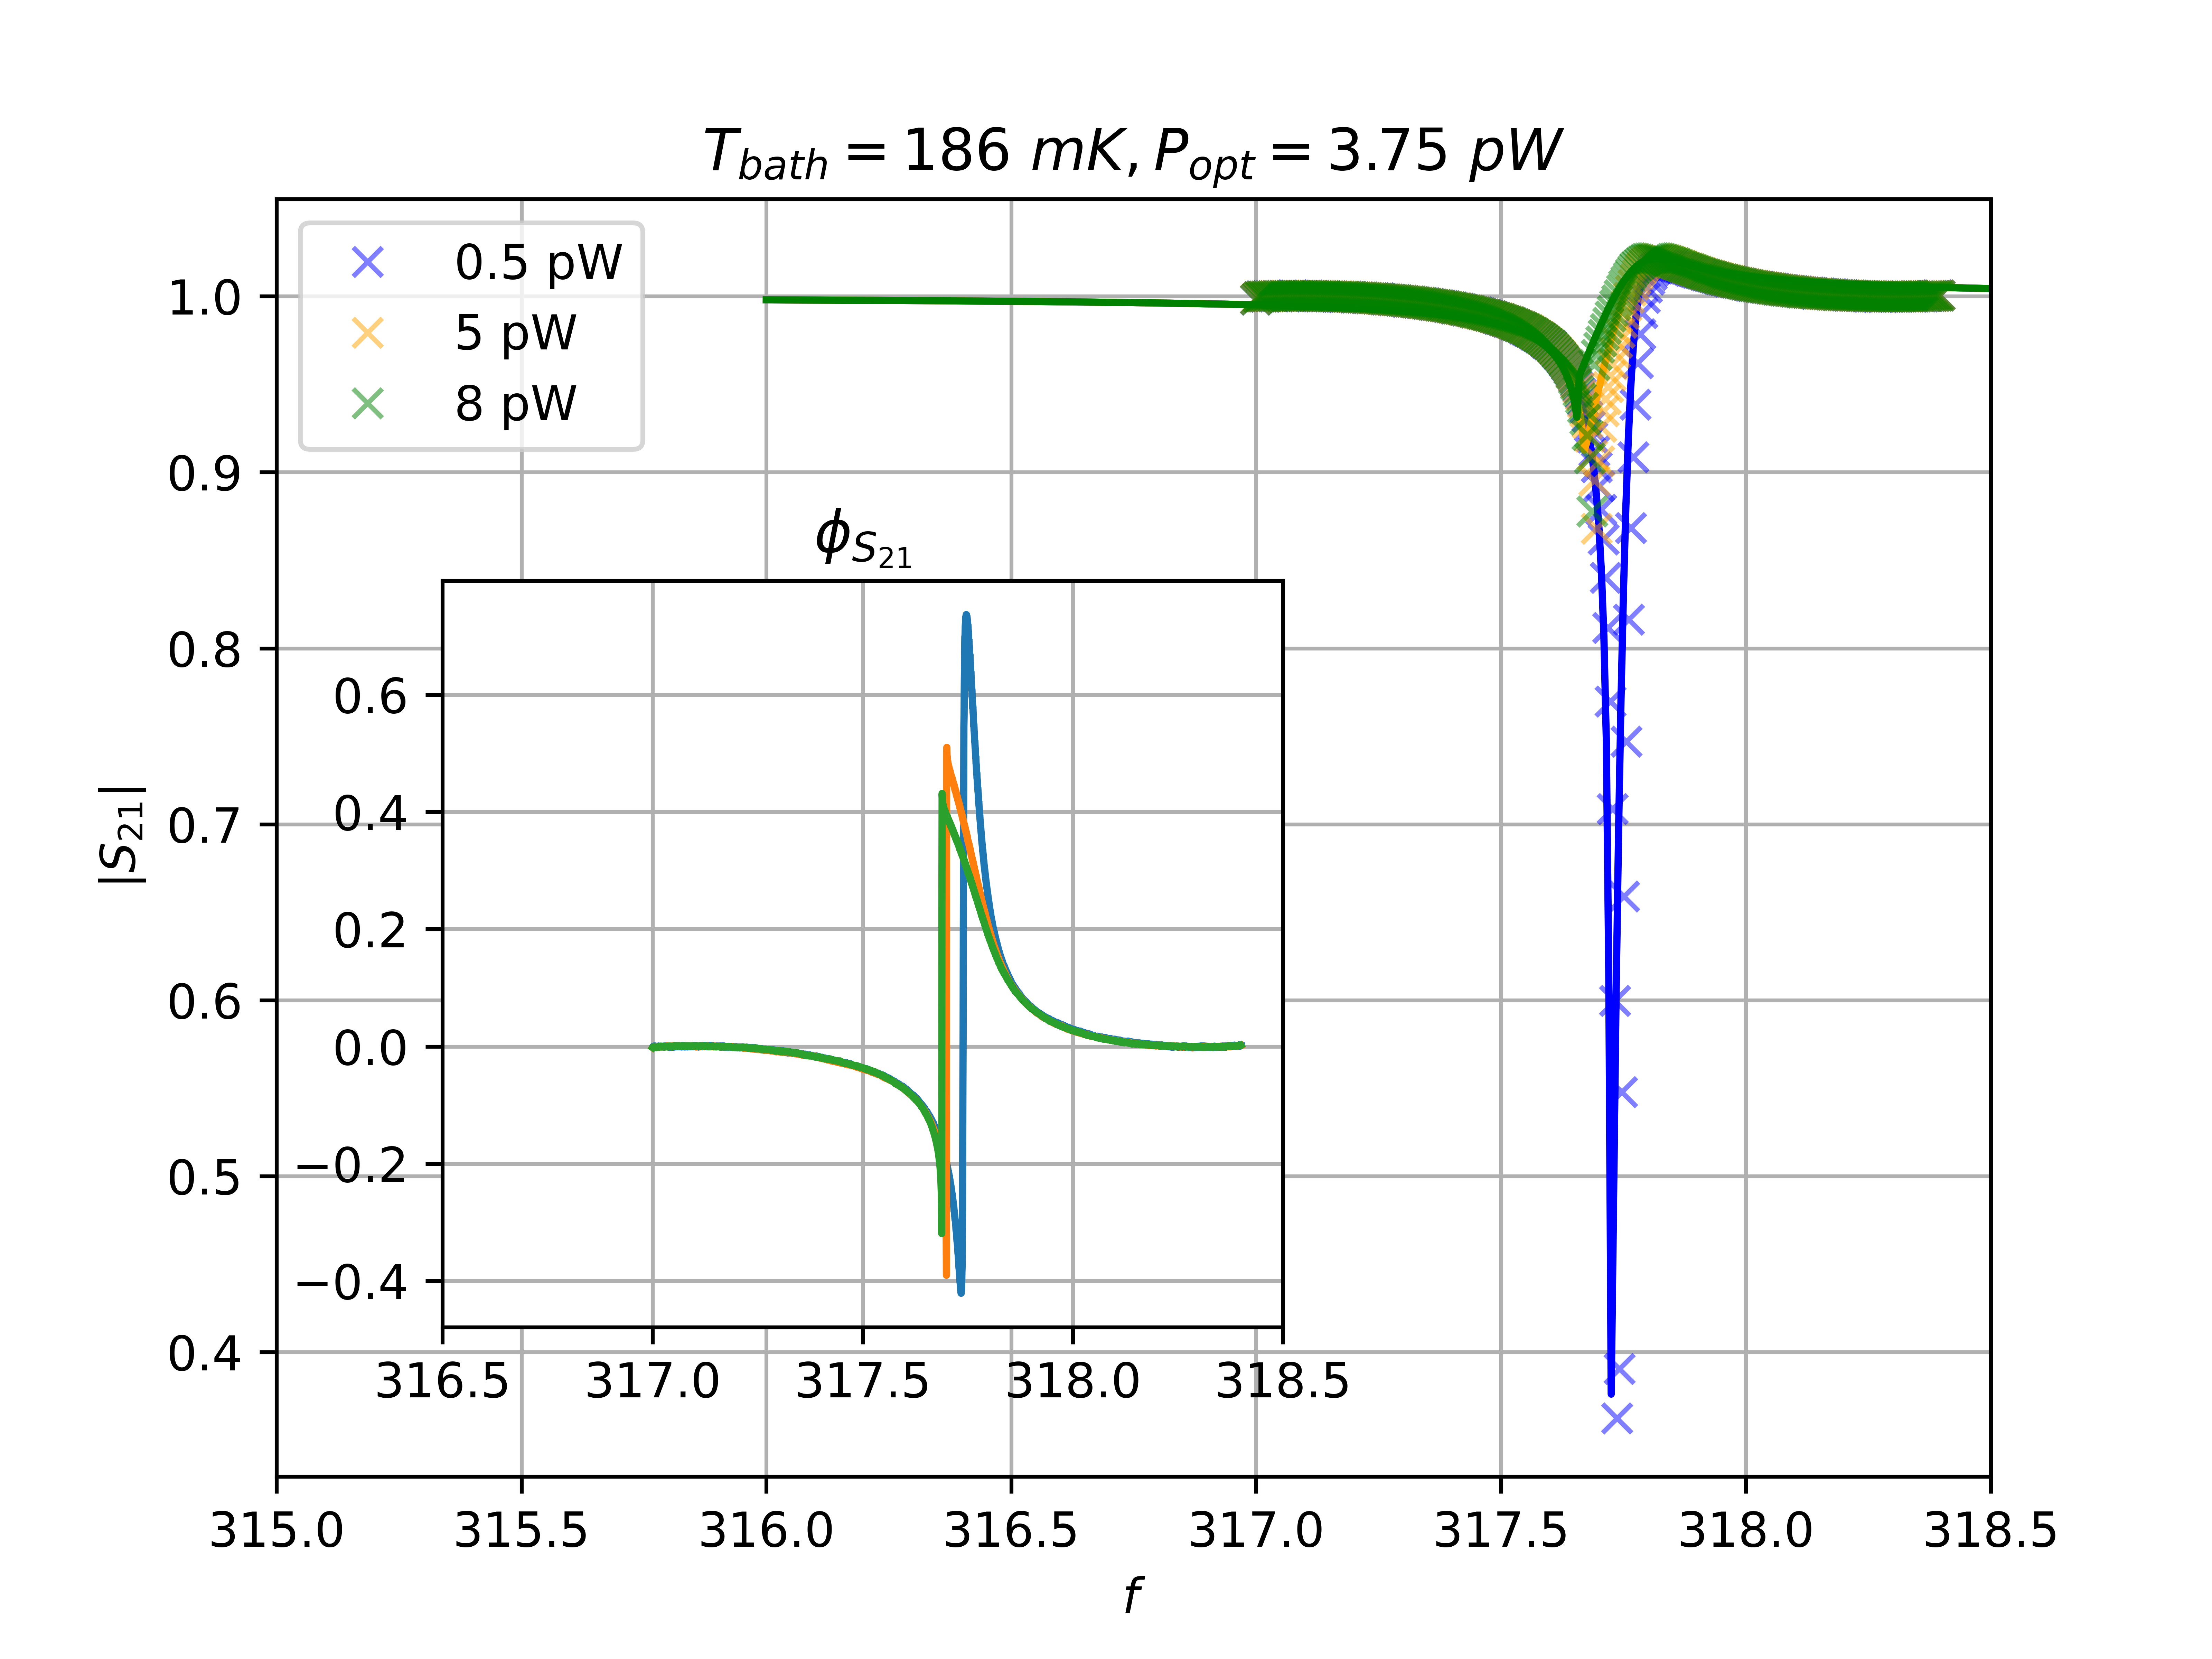
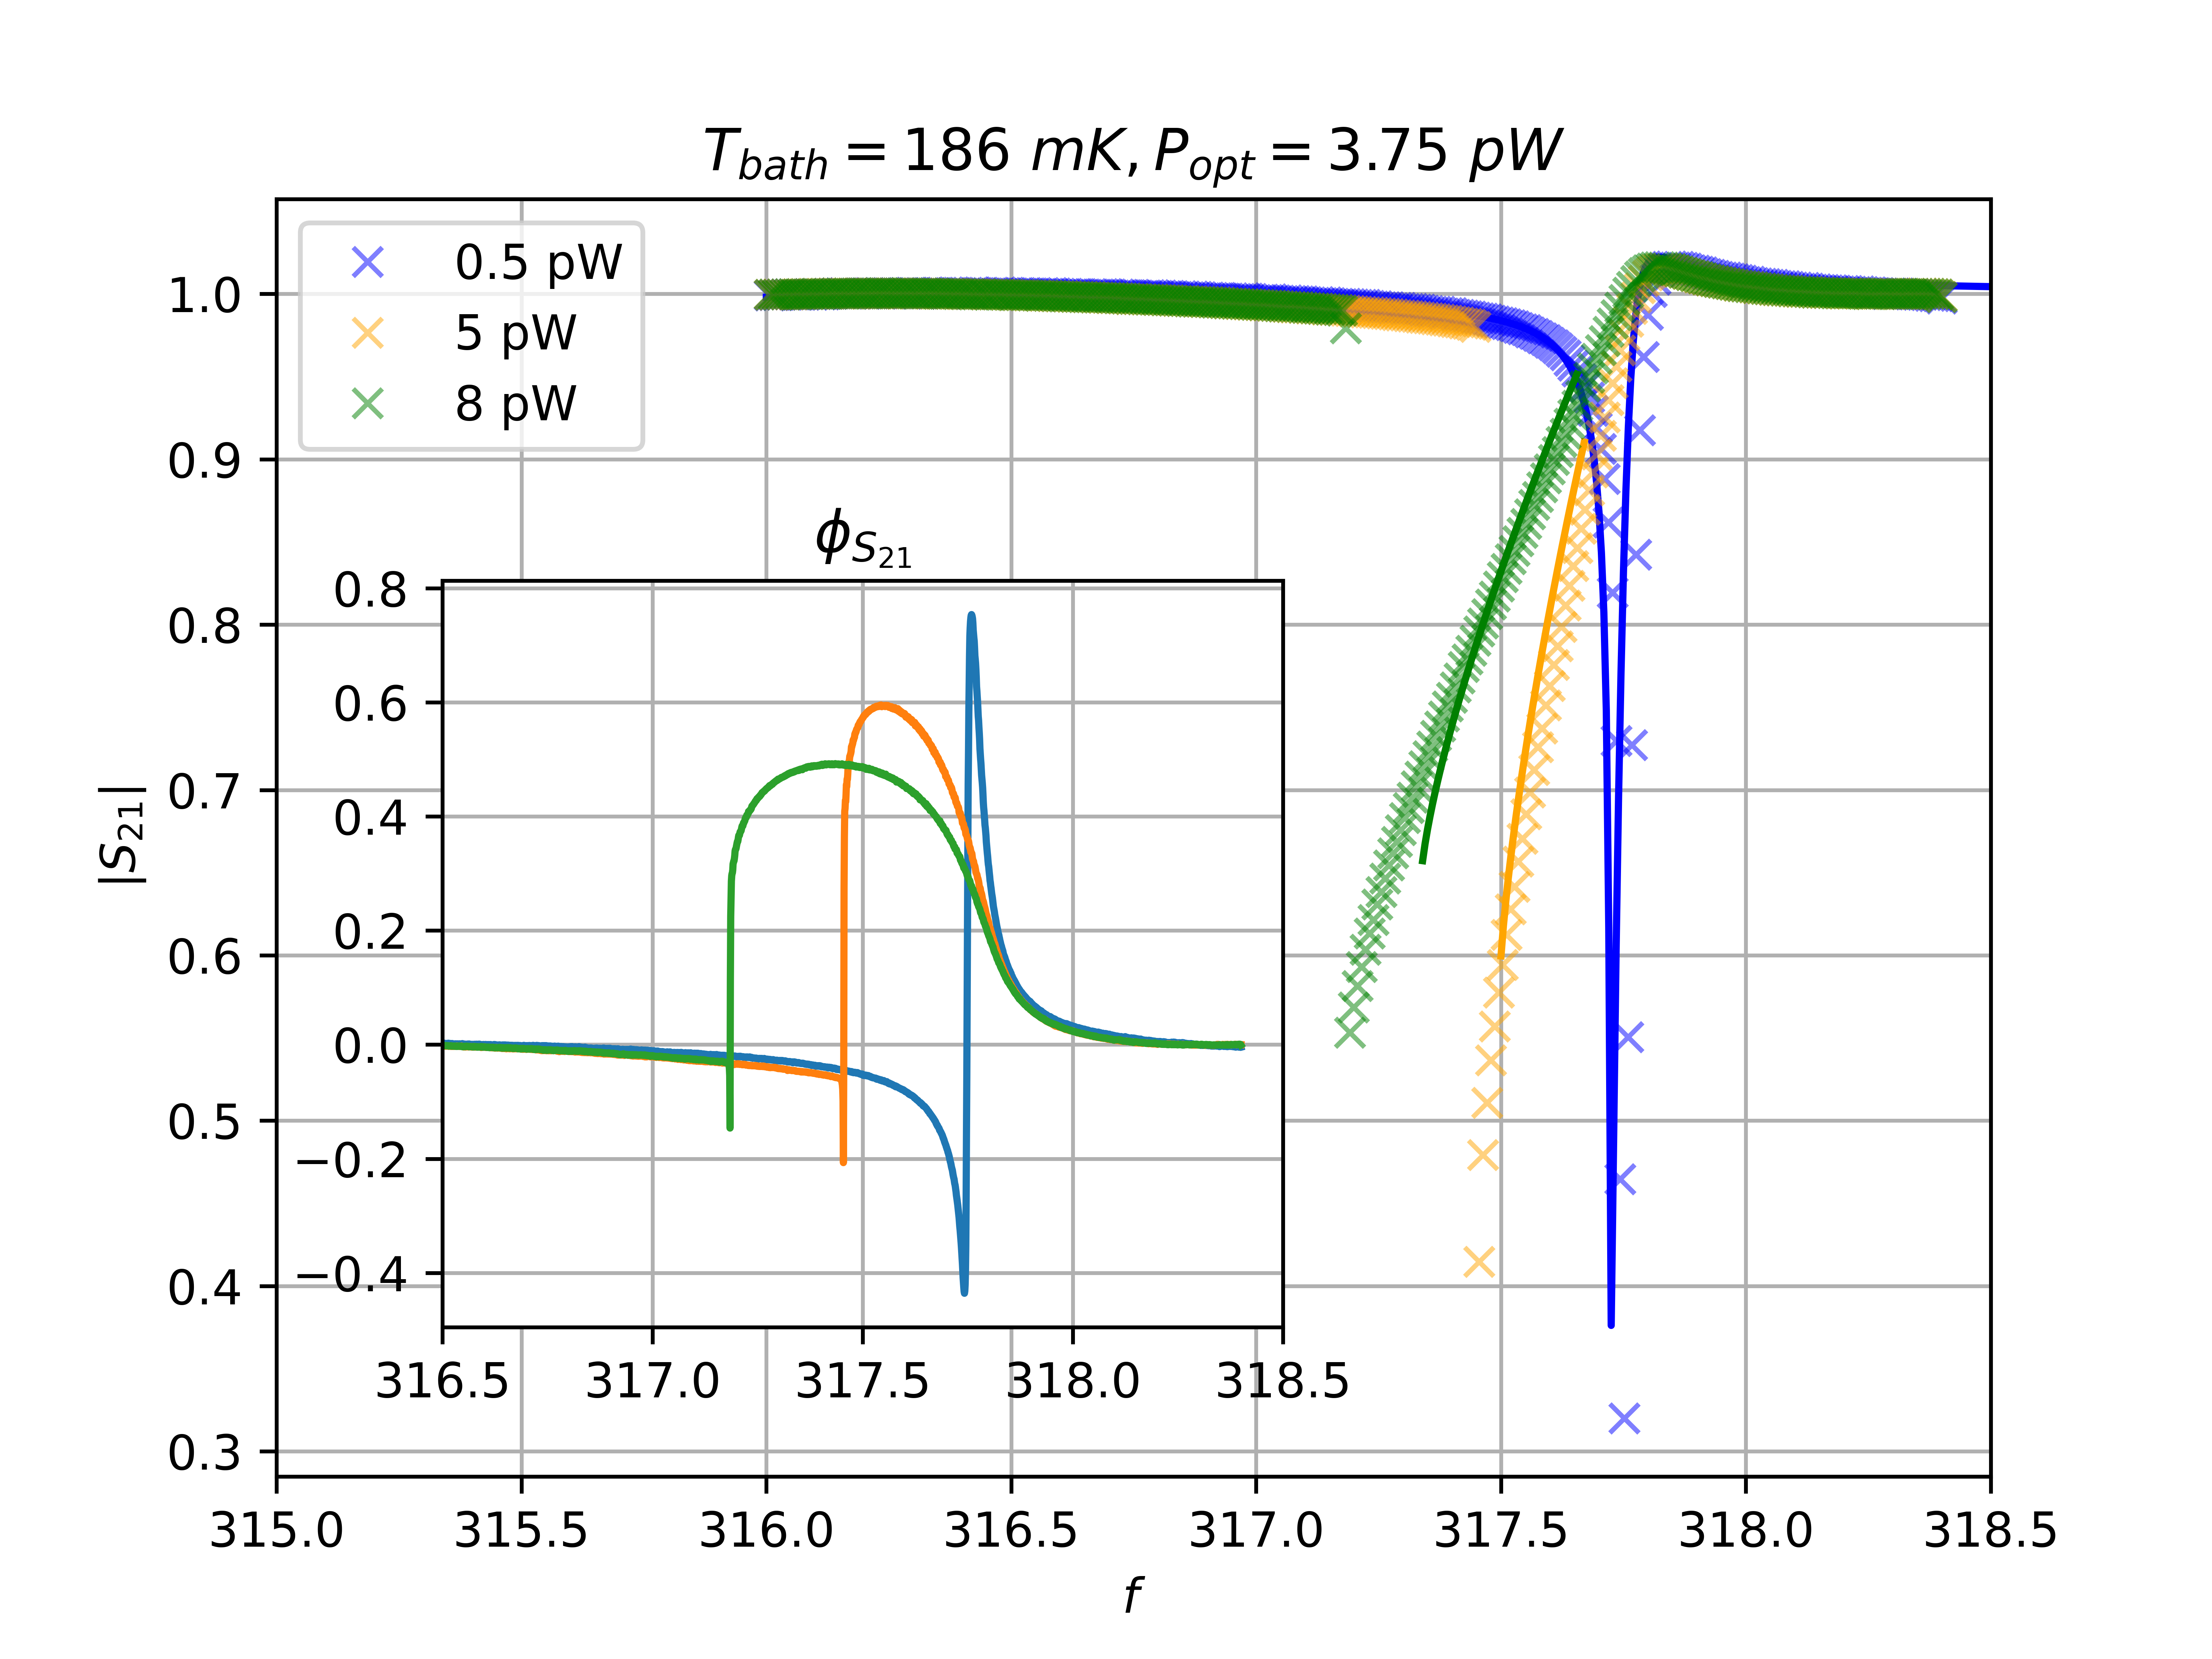
Fig. 4 shows the measured and predicted frequency sweeps when probe power at the chip is pW, pW, and pW. Directional hysteresis is absent at 0.5 pW but shows up strongly at 5 and 8 pW. For frequency down sweeps at the higher probe powers, the resonance frequency is pushed down as predicted by the negative electrothermal feedback model. At the highest probe power setting with = 8 pW, we observed that the lower bifurcation frequency of the hysteresis branch deviates by a few MHz from the resonance frequency obtained at low probe power.
II.3 Speed of Response
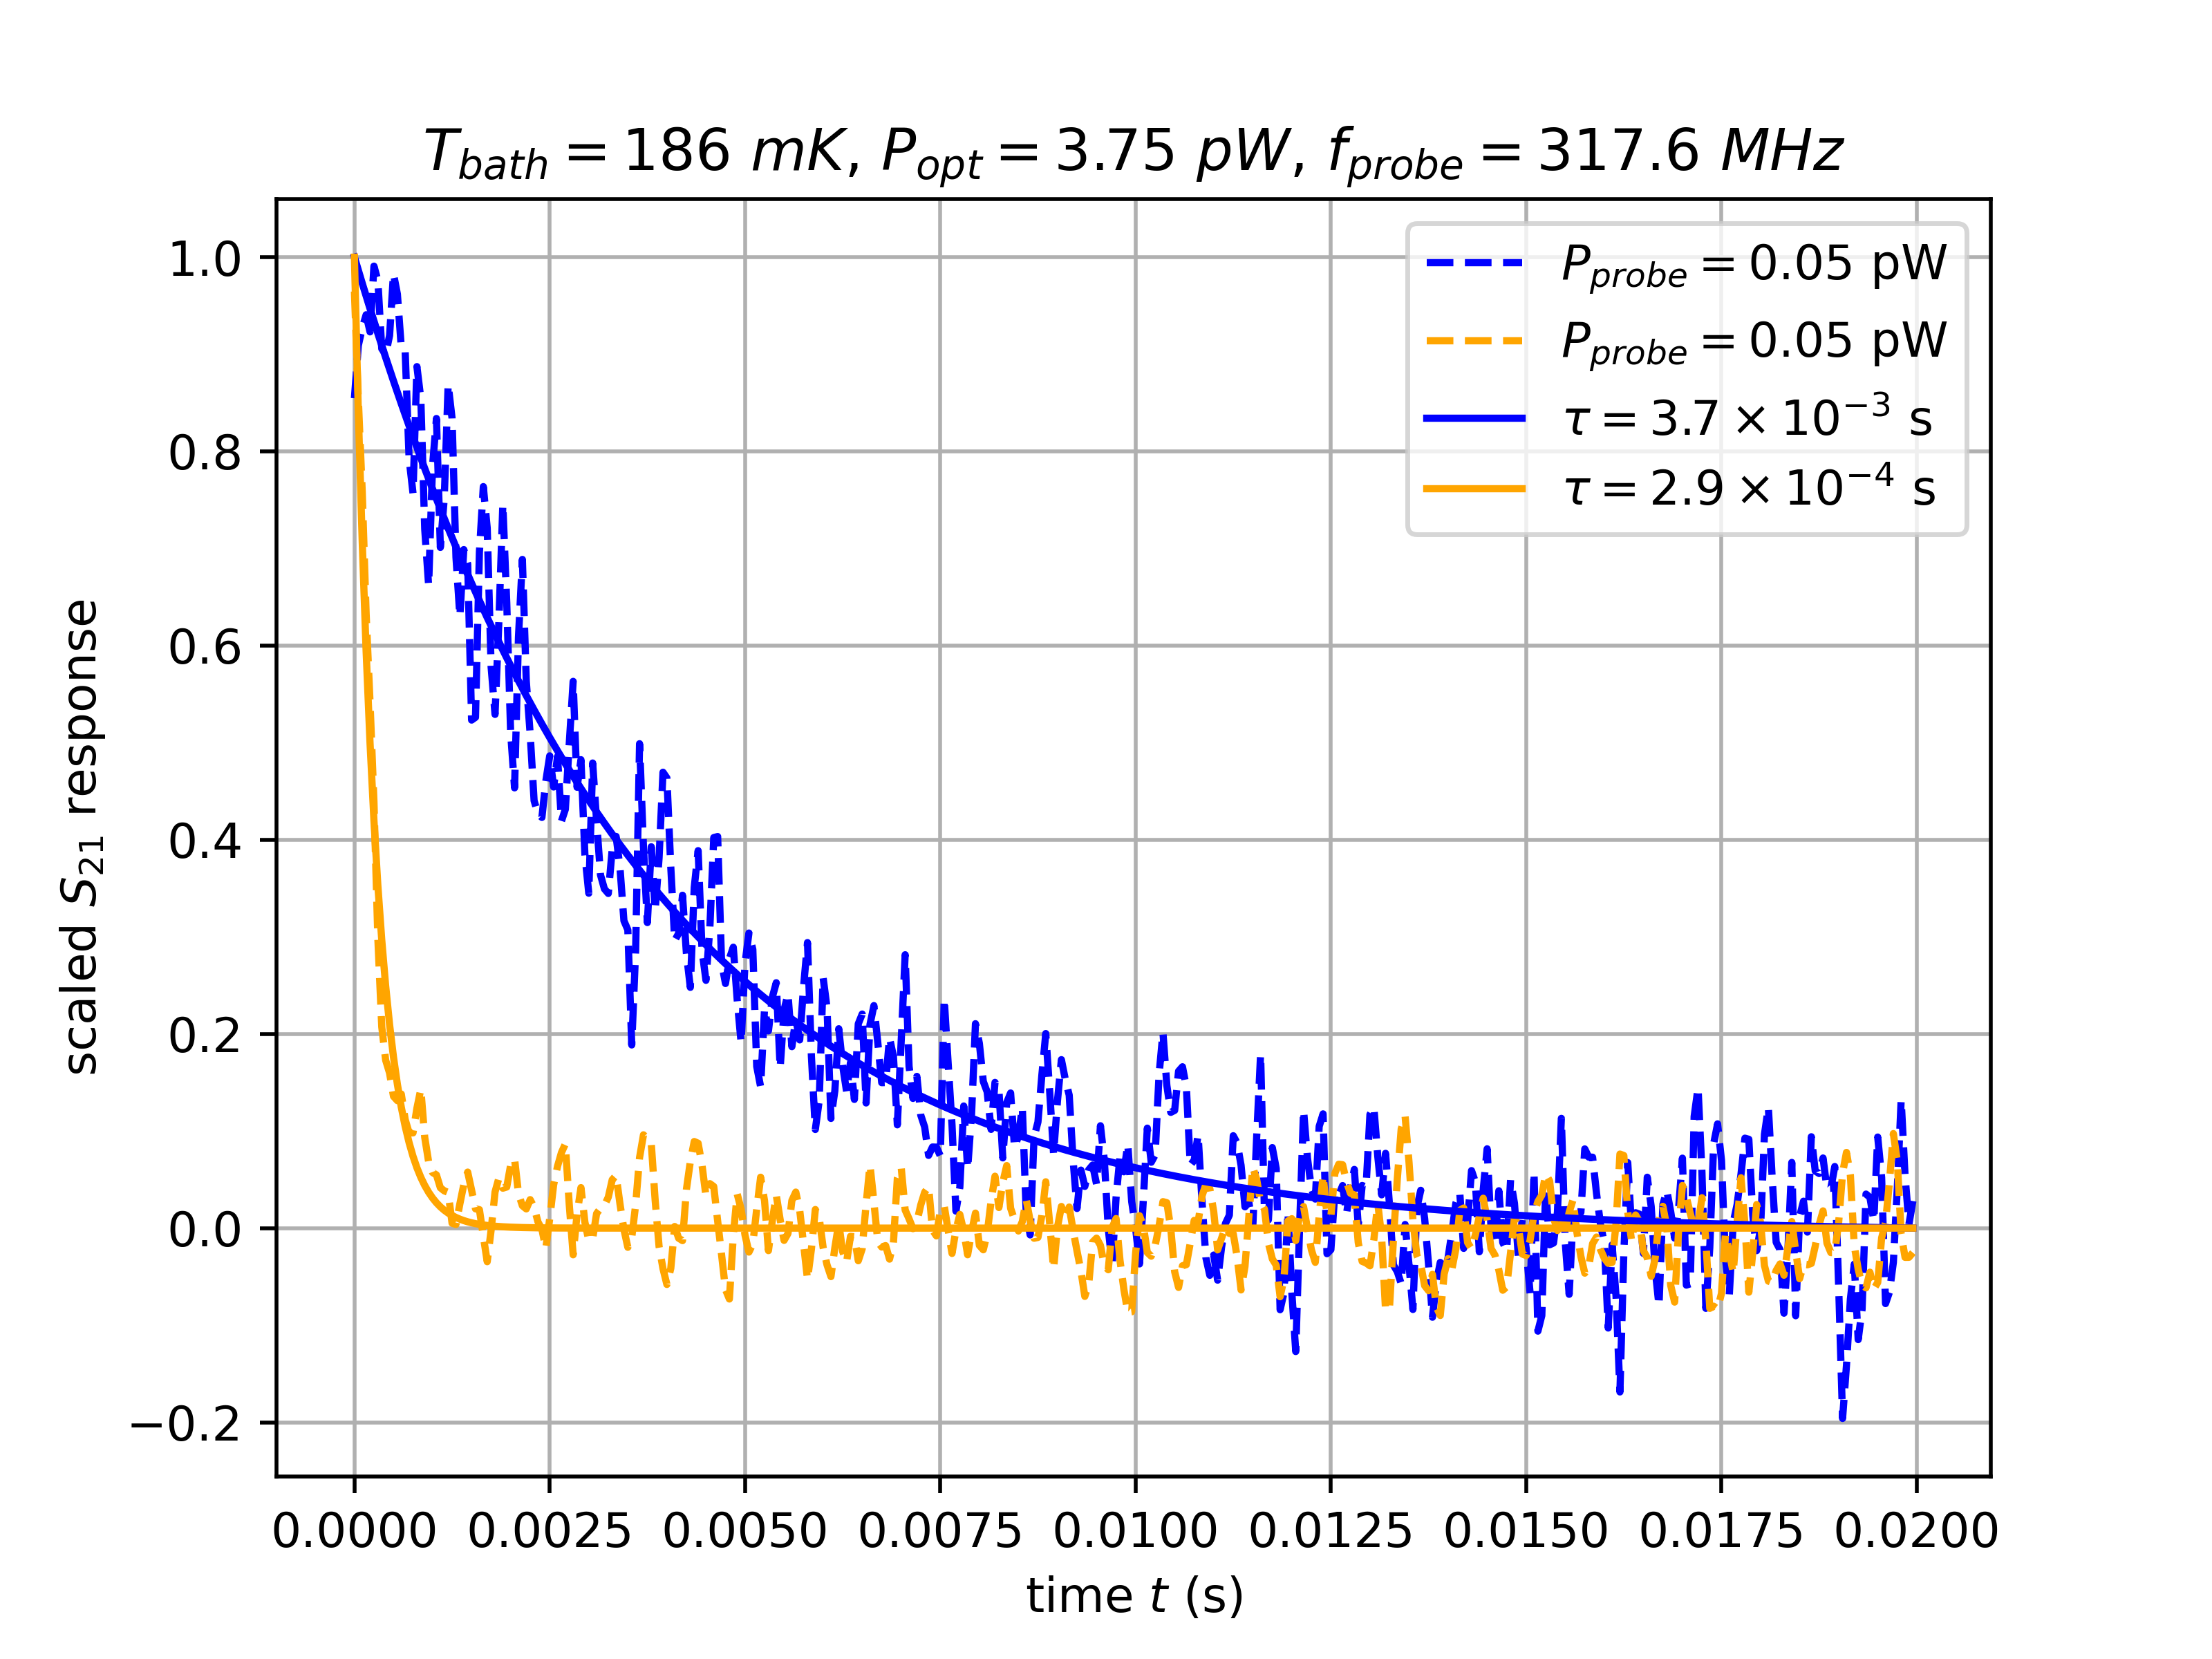
We measured bolometer time constants on the hot branch at probe powers ranging from 0.05 pW to 8 pW. We applied probe signals at frequencies between 317.0 MHz and 318.0 MHz spaced by 50 kHz to the detector with bath temperature regulated to = 186 mK. The incident power pulses with a 34 pW square impulse several time constants wide (0.05 s) to bias the detector into the hot branch. After the pulse, the incident power oscillates in a 1.92 Hz square wave between 3.65 and 3.85 pW. We recorded for 5 s intervals at a sample rate of 20 kHz. Stacked traces at low and high negative electrothermal feedback are shown in Fig. 5. Fitting the exponential decay of detector response at the edge of the applied square wave estimates the time constant . This gives us the loop gain by Eq. 11.
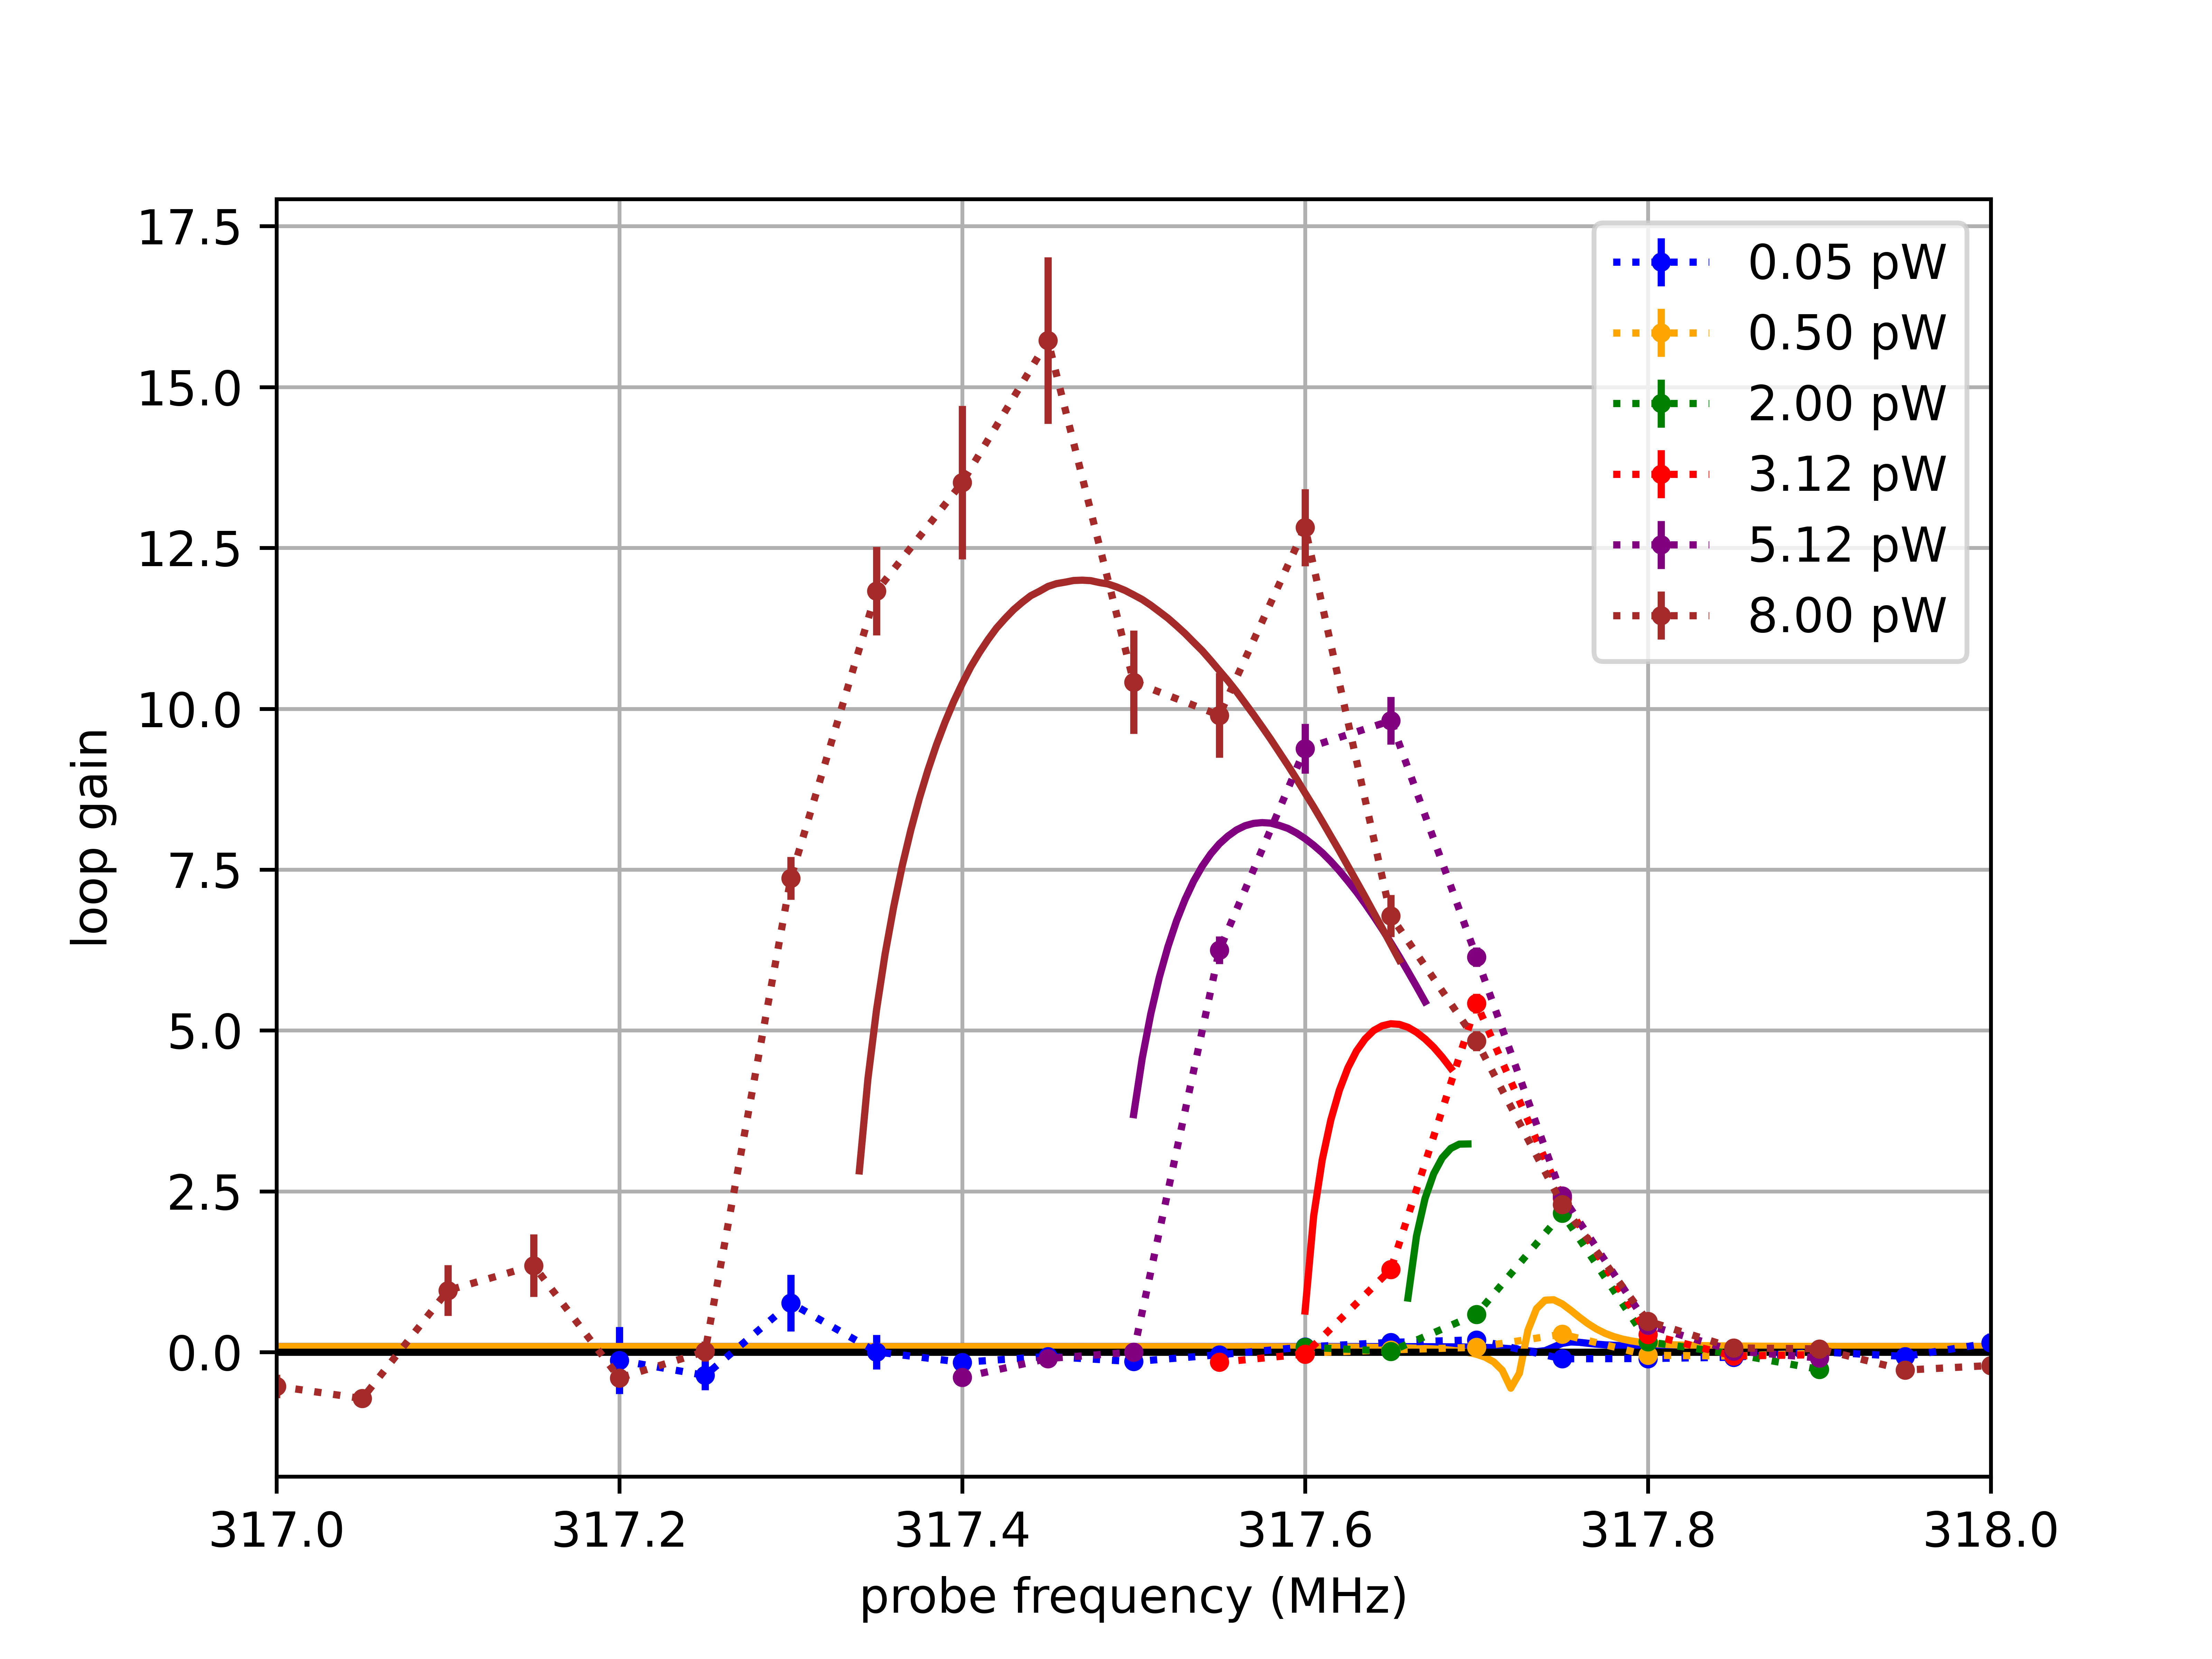
We show the observed loop gain as a function of probe frequency and power, along with our model predictions, in Fig. 6. The highest value = 15.7 1.3 observed was at = 8 pW and = 317.45 MHz. Our model slightly underestimates the speed up of the bolometer time constant, which will be investigated in future work.
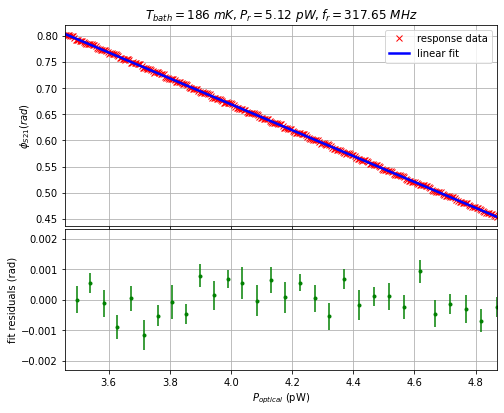
II.4 Linearity of Response
To measure linearity in the strong negative electrothermal feedback regime, we biased the TKID with = 5.12 pW, = 317.65 MHz while regulating the bath temperature to = 186 mK, where loop gain was previously measured to be 10 at = 3.75 pW. We swept incident power over a wide range, from which we select a region from 3.5 pW to 4.9 pW (or 8% below and 30% above the nominal 3.75 pW) where the response is highly linear. The top panel of Fig. 7 shows the detector response to the incident power sweep in phase. We fitted this response to a linear model, as shown in the two panels of Fig. 7. The residuals (lower panel) are dominated by measurement noise and indicate linearity better than 0.1% in this operational range.
II.5 NEP Measurements
We measured the noise-equivalent power (NEP) of the TKID over a range of probe frequencies and powers. As in the time constant measurements, we biased the detector into the hot branch by pulsing the incident power after applying the probe signal. The NEP amplitude spectrum, shown in Fig. 8 for = 5.12 pW and = 317.65 MHz, rises at kHz frequencies, suggestive of internal thermal resistance and multiple decoupled heat capacities discussed in Section I.3.
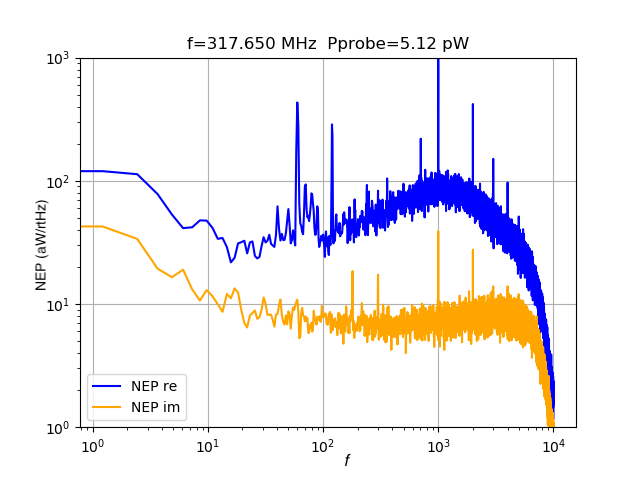
We suspect common-mode environmental noise, likely from thermal fluctuations or RF-interference susceptibility that are detector-detector correlated, to be responsible for the higher noise amplitude between 10 - 30 Hz and the 1/ knee at 10 Hz Wandui et al. (2020). We did not implement a pair differencing scheme that would remove common-mode noise to obtain the results shown in Fig. 8. These methods have been previously proven effective on a small array of detectors, achieving phonon-limited NEPs with a 1/ knee at 0.1 Hz for the same design Wandui et al. (2020).
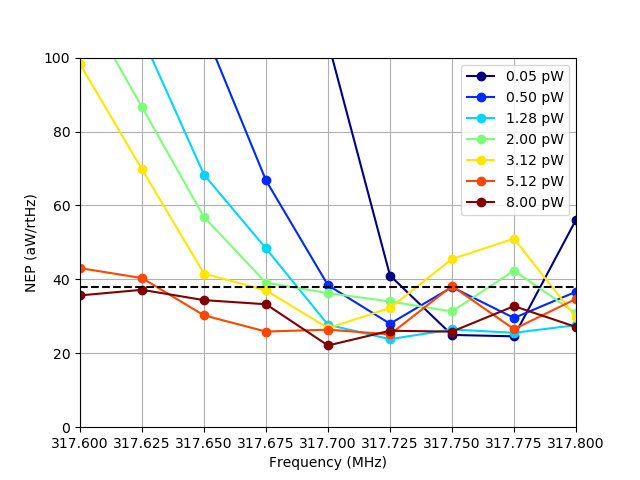
Fig. 9 shows the NEP at all measured probe powers and frequencies. The NEP is averaged over 10 - 30 Hz to minimize the impact of the excess low-frequency noise and the rise in kHz high-frequency noise. There is a probe frequency at all probe powers that achieves a NEP of 25 aW/rtHz. This is below the intended photon noise of 38 aW/rtHz, but well above the expected phonon noise of 14 aW/rtHz. We believe that the NEP is limited by environmental noise, as we have observed phonon-limited noise with much lower 1/ knees in a TKID of the same design in a different testbed Wandui et al. (2020).
III Conclusion
We have demonstrated negative electrothermal feedback in a TKID biased at readout probe powers comparable to the design incident power through the speed-up in bolometer response time. The maximum speed-up we observed was a factor of = 16.7 1.3 at = 8 pW and = 3.75 pW.
At a bias of = 5.12 pW, we observed a highly linear response in phase for = 3.5 - 4.9 pW. We also provide noise-equivalent power (NEP) measurements of the detector which demonstrate that the noise performance remains comparable to nominal TKID values when they are biased at low probe powers. Our NEP measurements do not reach the phonon noise floor, so we cannot yet rule out whether high probe power operation introduces additional noise at the 15 aW/rtHz level.
In this work, we operated only a single detector in the negative electrothermal feedback regime. As the TKID is intended to be a multiplexable detector, it remains to be seen what the practical implication of high probe power operation is on multiplexing. We anticipate an increase in the dynamic range requirement of the readout due to the decrease in responsivity relative to the probe power. Additionally, moving resonators with probe power can impact resonator collisions.
We see hints of the internal thermal structure to the detector in our NEP measurements, manifesting as a characteristic rise at high frequency. We intend to measure the incident power to transfer function in the frequency domain to clarify the internal thermal structure of the TKID. The results presented here indicate that operating the detector with high electrothermal feedback does not degrade the noise in single devices; we leave further noise performance tests using common-mode noise removal to future work.
The increase in speed due to negative electrothermal feedback could allow TKIDs to be practical in low incident power applications such as in narrow bandwidth line intensity mapping spectrometers, where low thermal conductance would lead to the TKID being otherwise too slow. The increase in speed could also be useful in calorimeters, where energy resolution is inversely proportional to the square root of the loop gain Irwin and Hilton (2005).
Acknowledgements.
Our work was carried out at the Jet Propulsion Laboratory, Caltech, under contract from the National Aeronautics and Space Administration. We thank Mark Lindeman and Jonas Zmuidzinas for insightful discussion. Shubh Agrawal’s work was supported by the Dr. Gary Stupian SURF Fellowship.Data Availability
The data that support the findings of this study are available from the corresponding author upon reasonable request.
References
- Ulbricht et al. (2015) G. Ulbricht, B. A. Mazin, P. Szypryt, A. B. Walter, C. Bockstiegel, and B. Bumble, Applied Physics Letters 106, 251103 (2015), publisher: American Institute of Physics.
- Quaranta et al. (2013) O. Quaranta, T. Cecil, L. Gades, B. Mazin, and A. Miceli, Superconductor Science and Technology 26, 105021 (2013), arXiv: 1304.3387.
- Arndt et al. (2017) M. Arndt, S. Wuensch, C. Groetsch, M. Merker, G. Zieger, K. Peiselt, S. Anders, H.-G. Meyer, and M. Siegel, IEEE Transactions on Applied Superconductivity 27, 1 (2017).
- Timofeev et al. (2014) A. V. Timofeev, V. Vesterinen, P. Helistö, L. Grönberg, J. Hassel, and A. Luukanen, Superconductor Science Technology 27, 025002 (2014).
- Dabironezare et al. (2018) S. O. Dabironezare, J. Hassel, E. Gandini, L. Grönberg, H. Sipola, V. I. Vesterinen, and N. Llombart, IEEE Transactions on Terahertz Science and Technology 8 (2018), 10.1109/TTHZ.2018.2873973.
- Wernis (2013) R. A. Wernis, Characterizing a Resonator Bolometer Array, Senior Thesis (Major), California Institute of Technology (2013).
- Irwin (1995) K. D. Irwin, Applied Physics Letters 66, 1998 (1995).
- Mather (1982) J. C. Mather, Applied Optics 21, 1125 (1982), publisher: Optical Society of America.
- Irwin and Hilton (2005) K. D. Irwin and G. C. Hilton, Cryogenic Particle Detection 99, 63 (2005), iSBN: 9783540201137.
- Anderson et al. (2020) A. J. Anderson, P. A. R. Ade, Z. Ahmed, J. S. Avva, P. S. Barry, R. B. Thakur, A. N. Bender, B. A. Benson, L. Bryant, K. Byrum, J. E. Carlstrom, F. W. Carter, T. W. Cecil, C. L. Chang, H.-M. Cho, J. F. Cliche, A. Cukierman, T. de Haan, E. V. Denison, J. Ding, M. A. Dobbs, D. Dutcher, W. Everett, K. R. Ferguson, A. Foster, J. Fu, J. Gallicchio, A. E. Gambrel, R. W. Gardner, A. Gilbert, J. C. Groh, S. T. Guns, R. Guyser, N. W. Halverson, A. H. Harke-Hosemann, N. L. Harrington, J. W. Henning, G. C. Hilton, W. L. Holzapfel, D. Howe, N. Huang, K. D. Irwin, O. B. Jeong, M. Jonas, A. Jones, T. S. Khaire, A. M. Kofman, M. Korman, D. L. Kubik, S. Kuhlmann, C.-L. Kuo, A. T. Lee, E. M. Leitch, A. E. Lowitz, S. S. Meyer, D. Michalik, J. Montgomery, A. Nadolski, T. Natoli, H. Nguyen, G. I. Noble, V. Novosad, S. Padin, Z. Pan, P. Paschos, J. Pearson, C. M. Posada, W. Quan, A. Rahlin, D. Riebel, J. E. Ruhl, J. T. Sayre, E. Shirokoff, G. Smecher, J. A. Sobrin, A. A. Stark, J. Stephen, K. T. Story, A. Suzuki, K. L. Thompson, C. Tucker, L. R. Vale, K. Vanderlinde, J. D. Vieira, G. Wang, N. Whitehorn, V. Yefremenko, K. W. Yoon, and M. R. Young, Journal of Low Temperature Physics 199, 320 (2020).
- Zhang et al. (2020) C. Zhang, P. a. R. Ade, Z. Ahmed, M. Amiri, D. Barkats, R. B. Thakur, C. A. Bischoff, J. J. Bock, H. Boenish, E. Bullock, V. Buza, J. Cheshire, J. Connors, J. Cornelison, M. Crumrine, A. Cukierman, M. Dierickx, L. Duband, S. Fatigoni, J. P. Filippini, G. Hall, M. Halpern, S. Harrison, S. Henderson, S. R. Hildebrandt, G. C. Hilton, H. Hui, K. D. Irwin, J. Kang, K. S. Karkare, E. Karpel, S. Kefeli, J. M. Kovac, C. L. Kuo, K. Lau, K. G. Megerian, L. Moncelsi, T. Namikawa, H. T. Nguyen, R. O’Brient, S. Palladino, N. Precup, T. Prouvé, C. Pryke, B. Racine, C. D. Reintsema, S. Richter, A. Schillaci, B. Schmitt, R. Schwarz, C. D. Sheehy, A. Soliman, T. S. Germaine, B. Steinbach, R. V. Sudiwala, K. L. Thompson, C. Tucker, A. D. Turner, C. Umiltà, A. G. Vieregg, A. Wandui, A. C. Weber, D. V. Wiebe, J. Willmert, W. L. K. Wu, E. Yang, K. W. Yoon, E. Young, and C. Yu, Journal of Low Temperature Physics 199, 968 (2020).
- Koopman et al. (2018) B. J. Koopman, N. F. Cothard, S. K. Choi, K. T. Crowley, S. M. Duff, S. W. Henderson, S. P. Ho, J. Hubmayr, P. A. Gallardo, F. Nati, M. D. Niemack, S. M. Simon, S. T. Staggs, J. R. Stevens, E. M. Vavagiakis, and E. J. Wollack, Journal of Low Temperature Physics 193, 1103 (2018).
- Szypryt et al. (2019) P. Szypryt, G. C. O’Neil, E. Takacs, J. N. Tan, S. W. Buechele, A. S. Naing, D. A. Bennett, W. B. Doriese, M. Durkin, J. W. Fowler, J. D. Gard, G. C. Hilton, K. M. Morgan, C. D. Reintsema, D. R. Schmidt, D. S. Swetz, J. N. Ullom, and Y. Ralchenko, Review of Scientific Instruments 90, 123107 (2019), publisher: American Institute of Physics.
- Lindeman (2014) M. A. Lindeman, Journal of Applied Physics 116, 024506 (2014).
- Wandui et al. (2020) A. Wandui, J. Bock, C. Frez, M. Hollister, L. Minutolo, H. Nguyen, B. Steinbach, A. Turner, J. Zmuidzinas, and R. O’Brient, Journal of Applied Physics 128, 044508 (2020), arXiv: 2001.08887.
- Swenson et al. (2013) L. J. Swenson, P. K. Day, B. H. Eom, H. G. Leduc, N. Llombart, C. M. McKenney, O. Noroozian, and J. Zmuidzinas, Journal of Applied Physics 113, 104501 (2013).
- Khalil et al. (2012) M. S. Khalil, M. J. A. Stoutimore, F. C. Wellstood, and K. D. Osborn, Journal of Applied Physics 111, 054510 (2012).
- Zmuidzinas (2012) J. Zmuidzinas, Annual Review of Condensed Matter Physics 3, 169 (2012).
- Thomas, Withington, and Goldie (2015) C. N. Thomas, S. Withington, and D. J. Goldie, Superconductor Science and Technology 28, 045012 (2015), publisher: IOP Publishing.
- Guruswamy et al. (2017) T. Guruswamy, C. N. Thomas, S. Withington, and D. J. Goldie, Superconductor Science and Technology 30, 064006 (2017), publisher: IOP Publishing.
- Lee et al. (1998) S.-F. Lee, J. M. Gildemeister, W. Holmes, A. T. Lee, and P. L. Richards, Applied Optics 37, 3391 (1998), publisher: Optical Society of America.
- Kernasovskiy (2020) S. Kernasovskiy, Measuring the polarization of the cosmic microwave background with the Keck Array and BICEP2, Ph.D. thesis, Stanford University (2020).
- Minutolo et al. (2019) L. Minutolo, B. Steinbach, A. Wandui, and R. O’Brient, IEEE Transactions on Applied Superconductivity 29, 1 (2019).