The evolving radio jet from the neutron star X-ray binary 4U 182030
Abstract
The persistently bright ultra-compact neutron star low-mass X-ray binary 4U 182030 displays a 170 d accretion cycle, evolving between phases of high and low X-ray modes, where the 3 – 10 keV X-ray flux changes by a factor of up to . The source is generally in a soft X-ray spectral state, but may transition to a harder state in the low X-ray mode. Here, we present new and archival radio observations of 4U 182030 during its high and low X-ray modes. For radio observations taken within a low mode, we observed a flat radio spectrum consistent with 4U 182030 launching a compact radio jet. However, during the high X-ray modes the compact jet was quenched and the radio spectrum was steep, consistent with optically-thin synchrotron emission. The jet emission appeared to transition at an X-ray luminosity of erg s-1. We also find that the low-state radio spectrum appeared consistent regardless of X-ray hardness, implying a connection between jet quenching and mass accretion rate in 4U 182030, possibly related to the properties of the inner accretion disk or boundary layer.
keywords:
accretion — stars: neutron — radio continuum: transients — X-rays: binaries — sources, individual: 4U 1820301 Introduction
There is an observed phenomenological relationship between jet production and the accretion process in all accreting compact objects, however, at present the exact nature of the coupling remains to be determined. Neutron star (NS) and black hole (BH) low mass X-ray binary (LMXB) systems act as useful observational laboratories to study this coupling as they allow for the properties of the in-flowing accretion flow and out-flowing jets to be observed on human timescales. Changes in the accretion flow are typically observed in the X-rays, while corresponding changes in the jet emission are generally seen in the radio band. In particular, NS LMXBs offer an important observational tool allowing for the role that stellar surface, spin, and magnetic field play on jet production to be tested. However, due to the relative radio faintness of NS LMXBs (e.g., Gallo et al., 2018), our understanding of jet launching in NS LMXBs is generally less evolved than their BH counterparts (e.g., Migliari & Fender, 2006).
Jets from accreting NS LMXBs show a diverse range of behaviour (e.g., Migliari & Fender, 2006; Migliari, 2011; Tudor et al., 2017; Gusinskaia et al., 2017; Gallo et al., 2018; Russell et al., 2018; Gusinskaia et al., 2020), and there has been some debate as to whether NS LMXB jets show a similar pattern of behaviour to BH systems (see, e.g., Migliari & Fender, 2006; Marino et al., 2020). NS and BH LMXBs can launch two types of jets depending on the state of the source: a steady compact jet or a bright transient jet (e.g., Migliari & Fender, 2006), depending on the mass accretion rate () and structure of the accretion flow. At lower during the harder X-ray spectral states the compact jet is characterised by optically-thick synchrotron emission exhibiting a flat to inverted radio spectrum (, where the radio flux density, , is proportional to the observing frequency, , such that ; Blandford & Königl 1979). At higher , when the source is softer, the compact jet emission can be quenched (Migliari et al., 2003; Tudose et al., 2009; Miller-Jones et al., 2010; Gusinskaia et al., 2017) and a transient jet is launched, although jet quenching is sometimes not observed (Rutledge et al., 1998; Kuulkers et al., 2003; Migliari et al., 2004; Migliari, 2011). Recent results from BH LMXBs suggest that jet quenching at radio frequencies results as the jet spectral break, which is the break from optically-thick to optically-thin synchrotron emission for the highest energy synchrotron spectra, evolves below the radio band (e.g., Russell et al., 2020), implying that the jet acceleration region shifted away from the compact object (e.g., Markoff et al., 2001, 2005). A similar evolution of the jet spectral break is thought to occur in NS systems (Díaz Trigo et al., 2018). Around this time the short-lived, rapidly-flaring transient jet can be launched, exhibiting a steep radio spectrum () originating from ejected discrete (optically-thin) synchrotron emitting plasma (e.g., Fender, 2006). Later, as the accretion rate reduces the source transitions back to the hard state and the compact jet re-establishes.
4U 182030 is an ultra-compact NS LMXB located in the globular cluster NGC 6624, at kpc (Kuulkers et al., 2003). This persistently X-ray bright object displays a 170 d accretion cycle (e.g., Priedhorsky & Terrell, 1984; Chou & Grindlay, 2001), where the X-ray luminosity evolves between L erg s-1 and L erg s-1 (3–10 keV) (e.g., Priedhorsky & Terrell, 1984; Šimon, 2003; Wen et al., 2006), which we refer to as low and high X-ray modes, respectively. Generally in a soft X-ray state, 4U 182030 can sometimes transition to a hard state at its lowest mass accretion rates (during low modes, e.g., Tarana et al., 2007; Titarchuk et al., 2013).
Here, we present broadband radio observations of 4U 182030 taken during its high and low X-ray modes. Observations and analysis are given in Section 2. Section 3 reports the results from the radio observations and connecting the observed changes to the accretion flow. Conclusions are in Section 4.
2 Observations
2.1 Radio
All radio results are given in Table 11.
2.1.1 VLA
In total, we present eight radio observations of 4U 182030 from the Karl G. Jansky Very Large Array (VLA). The VLA observed 4U 182030 on 2018-12-09 (MJD 58461; project code 18A-194) and 2020-07-07 (MJD 59037; project code 20A-255), with data taken at L-band (1–2 GHz), C-band (4.5–5.5 and 7–8 GHz), and K-band (18–19 and 25–26 GHz), where all bands were observed within a 2-hour window but not simultaneously. For these radio observations 3C286 was used for bandpass and flux calibration, and J18202528 was used for phase calibration. The VLA also observed NGC 6624 five times between 2018 May 22 – 28 (MJDs 58260, 58261, 58262, 58265, and 58266) under project code 18A-081 (Shishkovsky et al., 2020). Those data were recorded at X-band (8 – 12 GHz), with durations of 1 or 2 hours. Flux and bandpass calibration were done using either 3C286 or 3C48 and phase calibration used J18202528. Due to flaring of 3C48 at the time of these VLA observations a 10% uncertainty was added in quadrature to the measured errors for those epochs.
Using the Common Astronomy Software Application (casa version 5.1.2; McMullin et al. 2007), data were edited for radio frequency interference (RFI) and systematics, before being calibrated following standard procedures. L-band and C-band observations were imaged with a Briggs robust parameter of 0 to balance sensitivity and resolution. K- and X-band data were imaged with natural weighting to maximise sensitivity. To characterise the radio spectral behaviour the L- and C-band observations were separated into and MHz sub-bands, respectively. The X-band observations were separated into 41 GHz sub-bands. The radio flux density of the target was determined by fitting for a point source in the image plane using a Gaussian with a full width half maximum set to the synthesised beam of the observation.
2.1.2 ATCA
The Australia Telescope Compact Array (ATCA) observed NGC 6624 on 2006-07-05 (MJD 53921), 2006-07-23 (MJD 53939), and 2006-08-08 (MJD 53955) under project code C1559. These observations were recorded simultaneously at 4.80 and 8.64 GHz, with 104 MHz of bandwidth at each central frequency. ATCA also observed the target field on 2015-04-24 (MJD 57136) and 2015-04-25 (MJD 57137) under project code C2877 (see Tremou et al., 2018, Tudor et al. in prep.). These two later observations were carried out at central frequencies of 5.5 and 9 GHz, and recorded using the Compact Array Broad-band Backend (CABB; Wilson et al. 2011) providing an increased bandwidth of 2 GHz at each central frequency. All ATCA observations used PKS 1934638 for primary calibration and 182236 for phase calibration. Data were edited, calibrated, and imaged (using a natural weighting) as described above.
2.2 X-ray
2.2.1 MAXI, Swift-BAT, and RXTE-ASM
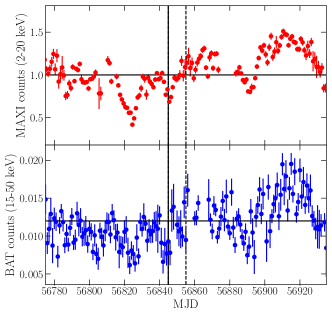
Daily count rates in the 2–20 keV band were obtained from the Monitor of All-sky X-ray Image (MAXI) X-ray telescope (Matsuoka et al., 2009) website111http://maxi.riken.jp/top/index.html. To estimate the X-ray flux at the time of the radio observations, we downloaded the X-ray spectral and rmf files from the MAXI website. The data were then analysed using xspec (version 12.8; Arnaud 1996) from the heasoft software package (version 6.21). Wilms et al. (2000) and Verner et al. (1996) were used to account for line-of-sight abundances and photoionisation cross sections. The 2 – 20 keV X-ray spectra were modelled with an absorbed power-law (tbabs powerlaw) within xspec. The was fixed to cm-2 (Bloser et al., 2000). The photon index was left free, resulting in best fits of for all epochs (in agreement with results presented by Titarchuk et al., 2013). While more complex models are required to understand the accretion geometry of NS LMXBs, the low-sensitivity of the MAXI data and small changes in the X-ray spectrum over this energy range meant that the data are reasonably well fit by a simple absorbed power-law ( with 685 degrees of freedom), such that they provided reasonable estimates on the 2 – 20 keV flux. More complex models provided similar fluxes.
Swift Burst Alert Telescope (Swift-BAT) Hard X-ray Transient Monitor (Krimm et al., 2013) daily count rates (15–50 keV) were obtained from the Swift-BAT website222https://swift.gsfc.nasa.gov/results/transients/.
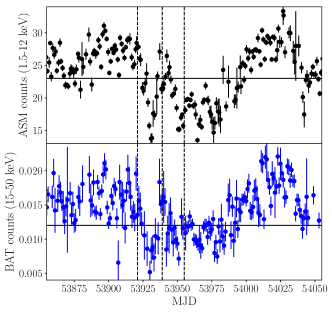
X-ray count rates from 2006 could not be obtained from MAXI as it was not yet employed. For these times, the Rossi X-ray Timing Explorer All-Sky Monitor (RXTE-ASM) 2–12 keV light curve was extracted from the ASM Light Curves webpage333http://xte.mit.edu/ASM_lc.html.
3 Results and discussion
4U 182030 cycles between its high and low X-ray modes every 170 days (e.g., Priedhorsky & Terrell, 1984; Šimon, 2003). The changes in the X-ray brightness are a consequence of an evolving mass accretion rate and accretion flow structure (Wijnands et al., 1999; Cornelisse et al., 2003; Zdziarski et al., 2007). This source is also a known radio emitter (e.g., Fruchter & Goss, 2000; Migliari et al., 2004; Díaz Trigo et al., 2017). In this work, we report on radio observations of 4U 182030 taken during both its high and low X-ray modes showing a dramatic change in the observed jet emission.
3.1 X-ray modes and origin of the radio emission
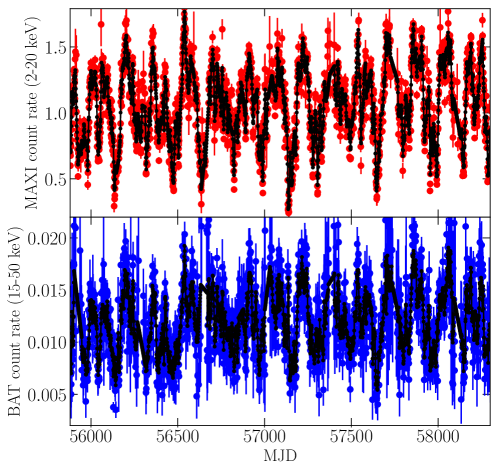
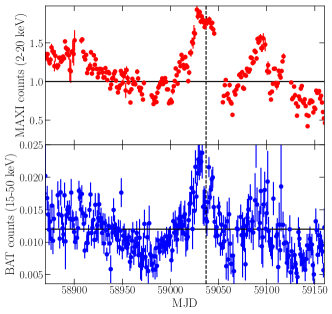
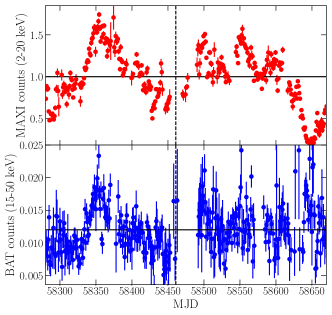
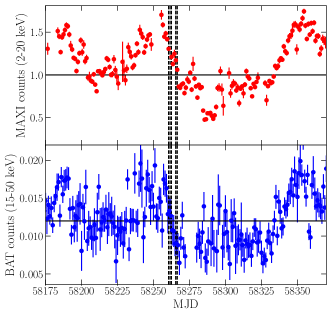
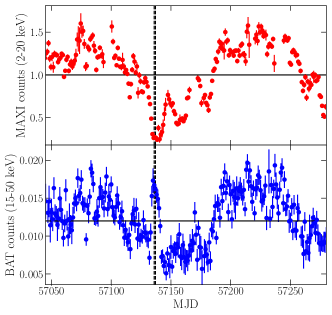
To determine the X-ray mode of 4U 182030 at the time of the radio observations, we inspected MAXI, Swift-BAT and RXTE-ASM light curves, which clearly show the X-ray modulations (for example, see Figure 3). In almost all cases, MAXI data were used to determine the X-ray mode, where the mid-line between the maxima and minima of the periodic light curve occurs at a 2–20 keV MAXI count rate of 1 photons cm-2 s-1. For the three 2006 ATCA observations, the X-ray mode was estimated from count rates reported by Titarchuk et al. (2013).
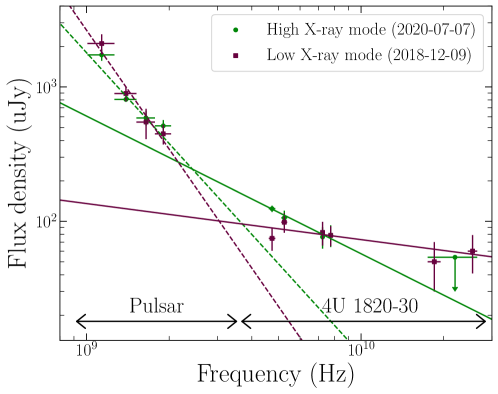
Due to contamination from the nearby pulsar PSR 4U182030A (0.22′′ away; Perera et al. 2017), we first explored the broadband 1–25 GHz radio emission from the source position with multi-frequency VLA observations. Like Migliari et al. (2004), we find that the emission below 4 GHz is dominated by the nearby steep spectrum () radio pulsar, while higher radio frequencies show the flatter spectrum radio emission from 4U 182030 (Figure 4). Hereafter, we only discuss higher frequency ( GHz) radio emission associated with 4U 182030.
3.2 An evolving radio jet between the high and low modes
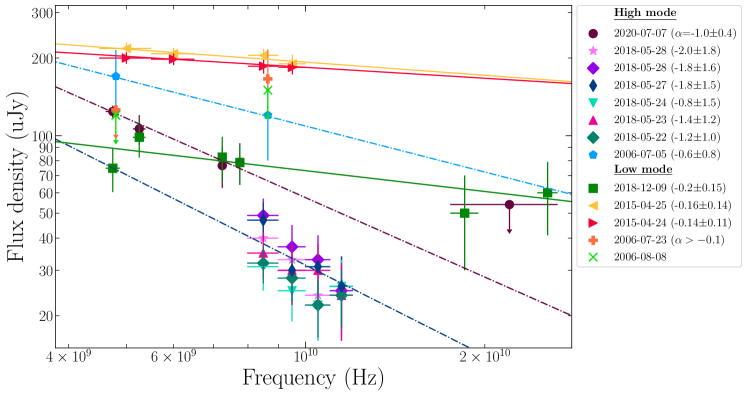
Our broadband 4–26 GHz VLA observations of 4U 182030 taken in 2018 during a low X-ray mode show a relatively flat radio spectrum (; Figure 1), consistent with optically-thick synchrotron emission from a self-absorbed compact jet. During the 2020 high X-ray mode the radio spectrum was steeper () and we did not detect radio emission at 22 GHz. This steep radio spectrum is consistent with optically-thin synchrotron emission indicating that the compact jet had switched off at these higher X-ray luminosities. The observed radio emission either originated from a quenched compact jet (where we are now seeing the optically-thin synchrotron emission), or from discrete jet ejecta in a transient radio jet (e.g., Fomalont et al., 2001; Fender et al., 2004; Migliari & Fender, 2006). To determine if the jet changes are consistent for all high and low X-ray modes, we analysed archival VLA and ATCA radio observations (Figure 1).
3.2.1 Low X-ray modes
In addition to our 2018 VLA observation, there were four additional ATCA radio observations taken during low X-ray modes (two in 2006 and two in 2015). 4U 182030 was detected in both 2015 observations and one 2006 observation, exhibiting a relatively flat radio spectrum with radio spectral indices of , consistent with a compact radio jet.
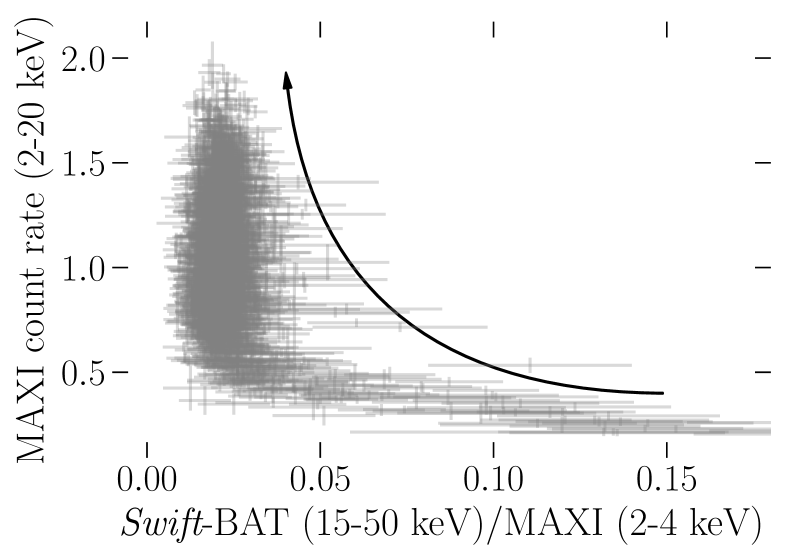
The 2015 ATCA observations of 4U 182030 were taken during a relatively hard X-ray spectral state, i.e., toward the typical island state (IS) of atoll sources (see Figure 2). These are the first reported radio detections from this source outside of the full soft state (as described by Titarchuk et al. 2013). Interestingly, while the jet emission may have been marginally brighter (by a factor of 1.5 – 2) at this time (see also Tremou et al. 2018), the radio spectrum () was consistent with other low X-ray mode radio observations. Further simultaneous radio and X-ray (spectral and timing) data are needed to accurately identify the X-ray state and to compare the radio emission.
For the two low-mode ATCA observations taken in 2006, the observations occurred prior to the ATCA bandwidth upgrade (Wilson et al., 2011) meaning that the sensitivity was poor and 4U 182030 was only detected in one frequency band (detected at 8.64 GHz but not at 4.8 GHz) on 2006-07-23, and not at all on 2006-08-08 (Figure 1). Using the 4.8 GHz upper-limit and 8.64 GHz detection implied a flat spectral index on 2006-07-23, where .
3.2.2 High X-ray modes
For the high X-ray modes, we analysed an additional six VLA observations and two ATCA observations. In all cases where good constraints could be placed on the radio spectrum, the spectrum was steep such that .
The six VLA observations were taken over 6 days in 2018, following an X-ray maximum as the X-ray brightness decreased. For all of these six VLA observations faint radio emission was detected from 4U 182030 (Figure 1). Unfortunately, the faintness of these detections meant that we were not able to identify any progressive changes to the radio emission (should they exist) between each epoch as the source evolved towards a low X-ray mode. While the measured radio spectrum of each individual epoch could have been consistent with flat, stacking these six observations together provided much tighter constraints on the spectral index, where , inconsistent (at ) with a flat radio spectrum.
ATCA also observed 4U 182030 during a high X-ray mode in 2006. Unfortunately, due to the low sensitivity of those radio observations we were unable to rule out a flat radio spectrum ().
In addition, Díaz Trigo et al. (2017) reported on ATCA (5.5/9 GHz) and ALMA (302 GHz) observations from 2014, where the ALMA observations were taken 10 days prior to the ATCA observations. Those observations produced puzzling results, where 4U 182030 was detected at 5.5 and 302 GHz, but not at 9 GHz (despite the 5.5 and 302 GHz results indicating that the source should have been detected at 9 GHz). The 9 GHz non-detection was attributed to either atmospheric or systematic effects, or even an additional previously unknown bright millimetre (mm) source close to the position of 4U 182030 (to account for the bright 302 GHz emission). However, analysing the MAXI X-ray light curves at the time of the ATCA and ALMA observations revealed that, despite occurring only 10 days apart, the two jet observations occurred within different X-ray modes, where the ALMA observations were taken in a low mode and the ATCA taken in a high mode (corresponding to points 11 and 7, respectively, in Figure 2). Therefore, our results imply that the 9 GHz non-detection was a result of a steep radio spectrum at the time of the ATCA observations (using the 236 Jy beam-15.5 GHz radio detection and assuming an radio spectrum, 4U 182030 should have been Jy beam-1 at 9 GHz, below the 200 Jy beam-1 upper-limit reported). The standalone ALMA data from Díaz Trigo et al. (2017) suggested a flat/inverted mm spectrum () with no strong intra-observational fading or brightening, implying emission from a compact jet. Comparing typical radio flux densities of 4U 182030 with the bright (400 Jy) ALMA detection suggests a radio to mm spectral index of (as noted by Tremou et al., 2018).
3.3 Quenching of the compact jet emission
Radio observations of 4U 182030 have shown a dramatic change in the jet emission between the source’s high and low X-ray modes. These radio observations indicate that 4U 182030 launches a steady compact jet during its low X-ray modes but not during its high X-ray modes (Figure 1), indicating that the jet is quenched at those times. We also constrain the timescale of the jet quenching to be less than 10 days. For NS LMXBs, recent results have shown compact jet quenching occurring in less than 2 days (Díaz Trigo et al., 2018), with even shorter constraints for BH systems (Russell et al., 2020). No bright radio flaring was observed, where the observed 5 GHz radio flux densities only varied by a factor of 2 for all observations. Therefore, while we currently favour a scenario where the high-mode steep-spectrum radio emission arises from the quenched compact jet (following the jet break evolving below the radio band as the jet’s first acceleration zone moves away from the compact object; e.g., Russell et al. 2014), further high cadence radio observations (or sensitive high-resolution very long baseline interferometric radio observations) around the transition are required to identify whether this, or a transient jet are responsible for the observed radio emission. At present, the shortest timescale we can place on the launching, flaring, and fading of any transient jet ejecta is 10 days (see Section 3.2.2).
3.3.1 Connection to the accretion flow
In BH transients, compact jet quenching is typically associated with a transition from the hard to the soft X-ray spectral state. In NS LMXBs, in particular in atoll-type sources, the jet quenching scenario is not so clear, with the jet quenching observed in some sources, but not others (e.g., Migliari, 2011; Gusinskaia et al., 2017, for further discussion). In 4U 182030, we have observed compact jet quenching that appears to be strongly connected with the accretion rate, where the jet emission transformed at an X-ray flux of erg s-1 cm-2 (3–10 keV), corresponding to a transition luminosity of erg s-1(3–10 keV).
Connecting the observed source evolution with the typical atoll-type spectral branches: at its lowest mass accretion rate 4U 182030 the X-ray spectrum is hardest (within the IS; Figure 2), then as the average mass accretion rate increases the source initially softens before rising at a constant hardness through the lower banana (LB) to the upper banana (UB) branch, with the transition of the jet occurring somewhere around the LB state (Figure 2). In atoll-type sources as the mass accretion rate rises (from the LB to UB branch), the electron temperature of the Comptonising medium (the boundary layer) remains almost constant while the optical depth increases. A change in the boundary layer, along with a simultaneous decrease of the inner disk radius (e.g., Gierliński & Done, 2002) could be responsible for the jet changes.
In comparison, in Z-type NS LMXBs, which only show soft X-ray states (but do show some changes in the X-ray hardness), the NS black-body temperature increases by a factor of 2 when rises within the normal branch, giving an increase of the radiation pressure. Moreover, transient radio jets are launched during this progression (Migliari & Fender, 2006). In a unified model for NS LMXBs, Church et al. (2014) proposed that in both atoll and Z-type sources an increase of the radiation pressure may be responsible for disrupting the inner disk and launching transient jets, implying a connection between the jets and the inner accretion disk.
A possible coupling between the jet emission and the boundary layer is an interesting prospect. Such a connection was discussed in a study of the dwarf nova SS Cyg, where the observed radio emission brightened around the time that material first reached the boundary layer and radio flaring was observed when the optical depth of the boundary layer increased such that it became optically-thick to itself (Russell et al., 2016). That study speculated that the boundary layer may provide a vertically-extended region required for jet launching, analogous to BH and NS LMXBs, where the WD and NS systems have a boundary layer while BH LMXBs contain a geometrically-thick accretion flow (i.e., corona; e.g., Zdziarski & Gierliński 2004).
4 Conclusions
4U 182030 periodically cycles between high and low X-ray accretion modes. Using new and archival radio observations of this system during each of these modes, we report on dramatic changes to the jet emission. In all observations where good constraints could be placed on the radio spectrum, 4U 182030 launched a flat-spectrum compact jet during its low X-ray modes, which was quenched during the high X-ray modes. In the latter case, the radio spectrum was consistent with optically-thin synchrotron emission from either a quenched compact jet where the jet break had evolved below the radio band jet, or possibly a transient jet. The changes in the jet appear to be strongly linked to the X-ray luminosity, and hence the mass accretion rate, suggesting a connection to the composition of the inner accretion flow or boundary layer and not the X-ray spectral state. The observations reported here suggest that the radio emission transforms rapidly at an X-ray luminosity of erg s-1. High cadence radio and X-ray observations around and after the transition are required to determine precisely when the jet transition occurs, discriminate between the quenched compact jet and transient jet scenario, and identify the specific changes in the accretion flow that may be driving the jet evolution. In particular, X-ray monitoring that includes spectral and X-ray timing information is necessary.
Acknowledgements
We thank the referee for their helpful comments. TDR, MDS and AS acknowledge financial contribution from ASI-INAF n.2017-14-H.0, an INAF main stream grant. ND is supported by a Vidi grant from the Dutch organization for scientific research (NWO). JvdE is supported by a Lee Hysan Junior Research Fellowship from St Hilda’s College, Oxford. The NRAO is a facility of the NSF operated under cooperative agreement by Associated Universities, Inc. ATCA is part of the ATNF which is funded by the Australian Government for operation as a National Facility managed by CSIRO. We acknowledge the Gomeroi people as the traditional owners of the ATCA observatory site. This research made use of NASA’s Astrophysics Data System, software, and HEASARC web tools, and MAXI, Swift-BAT and RXTE-ASM data.
Data Availability
All radio results are provided in Table 11. VLA, ATCA, and ALMA data can be accessed from their online archives. MAXI, Swift-BAT, and RXTE-ASM light curves are publicly available.
References
- Arnaud (1996) Arnaud K. A., 1996, in Jacoby G. H., Barnes J., eds, Astronomical Society of the Pacific Conference Series Vol. 101, Astronomical Data Analysis Software and Systems V. p. 17
- Blandford & Königl (1979) Blandford R. D., Königl A., 1979, ApJ, 232, 34
- Bloser et al. (2000) Bloser P. F., Grindlay J. E., Kaaret P., Zhang W., Smale A. P., Barret D., 2000, ApJ, 542, 1000
- Chou & Grindlay (2001) Chou Y., Grindlay J. E., 2001, ApJ, 563, 934
- Church et al. (2014) Church M. J., Gibiec A., Bałucińska-Church M., 2014, MNRAS, 438, 2784
- Cornelisse et al. (2003) Cornelisse R., et al., 2003, A&A, 405, 1033
- Díaz Trigo et al. (2017) Díaz Trigo M., Migliari S., Miller-Jones J. C. A., Rahoui F., Russell D. M., Tudor V., 2017, A&A, 600, A8
- Díaz Trigo et al. (2018) Díaz Trigo M., et al., 2018, A&A, 616, A23
- Fender (2006) Fender R., 2006, Jets from X-ray binaries. Cambridge University Press, Cambridge, pp 381–419
- Fender et al. (2004) Fender R., Wu K., Johnston H., Tzioumis T., Jonker P., Spencer R., van der Klis M., 2004, Nature, 427, 222
- Fomalont et al. (2001) Fomalont E. B., Geldzahler B. J., Bradshaw C. F., 2001, ApJ, 553, L27
- Fruchter & Goss (2000) Fruchter A. S., Goss W. M., 2000, ApJ, 536, 865
- Gallo et al. (2018) Gallo E., Degenaar N., van den Eijnden J., 2018, MNRAS, 478, L132
- Gierliński & Done (2002) Gierliński M., Done C., 2002, MNRAS, 337, 1373
- Gusinskaia et al. (2017) Gusinskaia N. V., et al., 2017, MNRAS, 470, 1871
- Gusinskaia et al. (2020) Gusinskaia N. V., et al., 2020, MNRAS, 492, 2858
- Krimm et al. (2013) Krimm H. A., et al., 2013, ApJS, 209, 14
- Kuulkers et al. (2003) Kuulkers E., den Hartog P. R., in’t Zand J. J. M., Verbunt F. W. M., Harris W. E., Cocchi M., 2003, A&A, 399, 663
- Marino et al. (2020) Marino A., et al., 2020, MNRAS, 498, 3351
- Markoff et al. (2001) Markoff S., Falcke H., Fender R., 2001, A&A, 372, L25
- Markoff et al. (2005) Markoff S., Nowak M. A., Wilms J., 2005, ApJ, 635, 1203
- Matsuoka et al. (2009) Matsuoka M., et al., 2009, PASJ, 61, 999
- McMullin et al. (2007) McMullin J. P., Waters B., Schiebel D., Young W., Golap K., 2007, in Shaw R. A., Hill F., Bell D. J., eds, Astronomical Society of the Pacific Conference Series Vol. 376, Astronomical Data Analysis Software and Systems XVI. p. 127
- Migliari (2011) Migliari S., 2011, in Romero G. E., Sunyaev R. A., Belloni T., eds, Jets at All Scales. 275. pp 233–241, doi:10.1017/S174392131001608X
- Migliari & Fender (2006) Migliari S., Fender R. P., 2006, MNRAS, 366, 79
- Migliari et al. (2003) Migliari S., Fender R. P., Rupen M., Jonker P. G., Klein-Wolt M., Hjellming R. M., van der Klis M., 2003, MNRAS, 342, L67
- Migliari et al. (2004) Migliari S., Fender R. P., Rupen M., Wachter S., Jonker P. G., Homan J., van der Klis M., 2004, MNRAS, 351, 186
- Miller-Jones et al. (2010) Miller-Jones J. C. A., et al., 2010, ApJ, 716, L109
- Perera et al. (2017) Perera B. B. P., et al., 2017, MNRAS, 468, 2114
- Priedhorsky & Terrell (1984) Priedhorsky W., Terrell J., 1984, ApJ, 284, L17
- Russell et al. (2014) Russell T. D., Soria R., Miller-Jones J. C. A., Curran P. A., Markoff S., Russell D. M., Sivakoff G. R., 2014, MNRAS, 439, 1390
- Russell et al. (2016) Russell T. D., et al., 2016, MNRAS, 460, 3720
- Russell et al. (2018) Russell T. D., Degenaar N., Wijnands R., van den Eijnden J., Gusinskaia N. V., Hessels J. W. T., Miller-Jones J. C. A., 2018, ApJ, 869, L16
- Russell et al. (2020) Russell T. D., et al., 2020, MNRAS, 498, 5772
- Rutledge et al. (1998) Rutledge R., Moore C., Fox D., Lewin W., van Paradijs J., 1998, The Astronomer’s Telegram, 8, 1
- Shishkovsky et al. (2020) Shishkovsky L., et al., 2020, ApJ, 903, 73
- Tarana et al. (2007) Tarana A., Bazzano A., Ubertini P., Zdziarski A. A., 2007, ApJ, 654, 494
- Titarchuk et al. (2013) Titarchuk L., Seifina E., Frontera F., 2013, ApJ, 767, 160
- Tremou et al. (2018) Tremou E., et al., 2018, ApJ, 862, 16
- Tudor et al. (2017) Tudor V., et al., 2017, MNRAS, 470, 324
- Tudose et al. (2009) Tudose V., Fender R. P., Linares M., Maitra D., van der Klis M., 2009, MNRAS, 400, 2111
- Verner et al. (1996) Verner D. A., Ferland G. J., Korista K. T., Yakovlev D. G., 1996, ApJ, 465, 487
- Wen et al. (2006) Wen L., Levine A. M., Corbet R. H. D., Bradt H. V., 2006, ApJS, 163, 372
- Wijnands et al. (1999) Wijnands R., Homan J., van der Klis M., 1999, ApJ, 526, L33
- Wilms et al. (2000) Wilms J., Allen A., McCray R., 2000, ApJ, 542, 914
- Wilson et al. (2011) Wilson W. E., et al., 2011, MNRAS, 416, 832
- Zdziarski & Gierliński (2004) Zdziarski A. A., Gierliński M., 2004, Progress of Theoretical Physics Supplement, 155, 99
- Zdziarski et al. (2007) Zdziarski A. A., Gierliński M., Wen L., Kostrzewa Z., 2007, MNRAS, 377, 1017
- Šimon (2003) Šimon V., 2003, A&A, 405, 199
Appendix A Online information: light curves, and radio SEDs, and radio data
| Date | MJD | Project | Frequency | Flux density | 3–10 keV X-ray flux | X-ray mode/state | |
|---|---|---|---|---|---|---|---|
| code | (GHz) | (Jy) | erg/s | ||||
| 2020-07-07 | 20A-255 | 1.1355 | 1730 165 | Pulsar | |||
| 1.3915 | 810 50 | ||||||
| 1.6475 | 590 70 | ||||||
| 1.9035 | 515 55 | ||||||
| 4.743 | 124 14 | 8.05 0.20 | High/Soft | ||||
| 5.255 | 106 14 | ||||||
| 7.243 | 76 14 | ||||||
| 7.755 | 78 15 | ||||||
| 22.00 | |||||||
| 2018-05-28 | 18A-081 | 8.488 | 40 9 | 5.13 0.15 | High/Soft | ||
| 9.488 | 33 8 | ||||||
| 10.488 | 24.0 8.5 | ||||||
| 11.488 | 25.0 8.5 | ||||||
| 2018-05-28 | 18A-081 | 8.488 | 44 8 | 5.13 0.15 | High/Soft | ||
| 9.488 | 38 9 | ||||||
| 10.488 | 33 9 | ||||||
| 11.488 | 25 8 | ||||||
| 2018-05-27 | 18A-081 | 8.488 | 38 8 | 6.2 0.7 | High/Soft | ||
| 9.488 | 30 8 | ||||||
| 10.488 | 31 7 | ||||||
| 11.488 | 26 8 | ||||||
| 2018-05-24 | 18A-081 | 8.488 | 31 6 | 5.9 0.2 | High/Soft | ||
| 9.488 | 25 6 | ||||||
| 10.488 | 22 6 | ||||||
| 11.488 | 26 7 | ||||||
| 2018-05-23 | 18A-081 | 8.488 | 35 8 | 6.07 0.14 | High/Soft | ||
| 9.488 | 28 6 | ||||||
| 10.488 | 22 6 | ||||||
| 11.488 | 24.0 6.5 | ||||||
| 2018-05-22 | 18A-081 | 8.488 | 32 5 | 6.05 0.16 | High/Soft | ||
| 9.488 | 28.0 5.5 | ||||||
| 10.488 | 22.0 5.5 | ||||||
| 11.488 | 24 6 | ||||||
| 2014-07-17a | C3010 | 5.5 | 236 27 | 4.9 0.6 | High/Soft | ||
| 9.0 | |||||||
| 2006-07-05 | C1559 | 4.8 | 170 45 | 7.0 0.7b | High/Soft | ||
| 8.64 | 130 40 | ||||||
| 2018-12-09 | 18A-194 | 1.1355 | 2000 450 | Pulsar | |||
| 1.3915 | 890 110 | ||||||
| 1.6475 | 550 140 | ||||||
| 1.9035 | 450 75 | ||||||
| 4.743 | 75 14 | 3.76 0.35 | Low/Soft | ||||
| 5.255 | 98 17 | ||||||
| 7.243 | 83 17 | ||||||
| 7.755 | 79 15 | ||||||
| 18.5 | 50 20 | ||||||
| 25.5 | 62 19 | ||||||
| 2015-04-24 | C2877 | 5.0 | 200 10 | 1.23 0.15 | Low/Harder | ||
| 6.0 | 198 10 | ||||||
| 8.5 | 186 12 | ||||||
| 9.5 | 184 11 | ||||||
| 2015-04-25 | C2877 | 5.0 | 218 11 | 1.20 0.15 | Low/Harder | ||
| 6.0 | 208 11 | ||||||
| 8.5 | 205 12 | ||||||
| 9.5 | 190 16 | ||||||
| 2014-07-07a | ALMA | 295 | 390 25 | 3.0 0.6 | Low/Soft | ||
| 297 | 404 26 | ||||||
| 307 | 415 28 | ||||||
| 309 | 440 28 | ||||||
| 2006-07-23 | C1559 | 4.8 | 5.26 0.5b | Low/Soft | |||
| 8.64 | 166 50 | ||||||
| 2006-08-08 | C1559 | 4.8 | – | 4.7 0.5b | Low/Soft | ||
| 8.64 |