An integrated whispering-gallery-mode resonator for solid-state coherent quantum photonics
Abstract
Tailored photonic cavities allow enhancing light-matter interaction ultimately to create a fully coherent quantum interface. Here, we report on an integrated microdisk cavity containing self-assembled quantum dots to coherently route photons between different access waveguides. We measure a Purcell factor of for a cavity quality factor of about 10,000, allowing us to observe clear signatures of coherent scattering of photons by the quantum dots. We show how this integrated system can coherently re-route photons between the drop and bus ports, and how this routing is controlled by detuning the quantum dot and resonator, or through the strength of the excitation beam, where a critical photon number less than one photon per lifetime is required. We discuss the strengths and limitations of this approach, focusing on how the coherent scattering and single-photon nonlinearity can be used to increase the efficiency of quantum devices such as routers or Bell-state analyzers.
keywords:
Quantum nanophotonics, quantum dots, resonatorsNiels Bohr Institute] Center for Hybrid Quantum Networks (Hy-Q), Niels Bohr Institute, University of Copenhagen, Blegdamsvej 17, DK-2100 Copenhagen, Denmark \alsoaffiliation[Imperial College London] Present address: MRC London Institute of Medical Sciences, Du Cane road, London, W12 0NN, United Kingdom Niels Bohr Institute] Center for Hybrid Quantum Networks (Hy-Q), Niels Bohr Institute, University of Copenhagen, Blegdamsvej 17, DK-2100 Copenhagen, Denmark Bochum] Lehrstuhl für Angewandte Festkörperphysik, Ruhr-Universität Bochum, Universitätsstrasse 150, D-44780 Bochum, Germany Niels Bohr Institute] Center for Hybrid Quantum Networks (Hy-Q), Niels Bohr Institute, University of Copenhagen, Blegdamsvej 17, DK-2100 Copenhagen, Denmark Niels Bohr Institute] Center for Hybrid Quantum Networks (Hy-Q), Niels Bohr Institute, University of Copenhagen, Blegdamsvej 17, DK-2100 Copenhagen, Denmark \alsoaffiliation[Queens University] Present address: Department of Physics, Engineering Physics & Astronomy, 64 Bader Lane, Queen’s University, Kingston, Ontario, Canada K7L 3N6 \abbreviationsIR,NMR,UV
1 Introduction
Photonic resonators enhance light-matter interactions, and have played a crucial role in quantum optical experiments over the past several decades. Resonators such as photonic crystal cavities 1 or whispering gallery mode resonators 2 have been fabricated on photonic chips, leading to pioneering demonstrations of strong light-matter coupling of single atoms 3 and quantum dots (QDs) 4, 5, or an increase in the coherent interaction between photons and single organic molecules 6. Whispering gallery mode resonators also support chiral quantum interactions 7, 8, where photons are emitted or scattered unidirectionally, enabling non-reciprocal photonic elements constructed with single emitters such as optical circulators 9, isolators 10 and atom-photon SWAP gates 11.
Here, we create an integrated photonic circuit consisting of a microdisk resonator with embedded self-assembled QDs, access waveguides and grating couplers, as shown in Fig. 1a. The enhancement provided by the resonator lessens the effect of decoherence mechanisms12, most notably spectral diffusion, enabling the observation of coherent scattering of photons from the QD and leading to a coherent switching of photons between the bus and drop ports. This stands in contrast to earlier demonstrations where QDs embedded in a photonic crystal cavity could modulate the transmission across a single channel coupled to the cavity 13, 14. Cryogenic spectroscopy and time-resolved measurements in conjunction with quantum optical theory allow us to quantify the effect of the resonators on the QD, and to explore the response of the QD-resonator detuning and excitation strengths on the photon routing.
2 Integrated microdisk resonators
We fabricate GaAs disk-shaped cavities that support whispering gallery modes that are optically addressed via evanescently coupled single mode waveguides, as shown in Figure 1a). In the present sample no electrical contacts were implemented, which otherwise have been shown to efficiently overcome QD broadening due to electrostatic charge fluctuations 15. However, electrically contacted samples may increase absorption losses and increases fabrication complexity 16, such that an alternative strategy using Purcell enhancement to reduce the influence of noise processes is a favorable approach. The high intrinsic quantum efficiency of QDs means that any non-radiative processes can be neglected (c.f. Supplementary Information) 17. Consequently, we need only consider radiative decay, which occurs with rates and into the resonator modes and free-space, respectively, as depicted in Figure 1b).
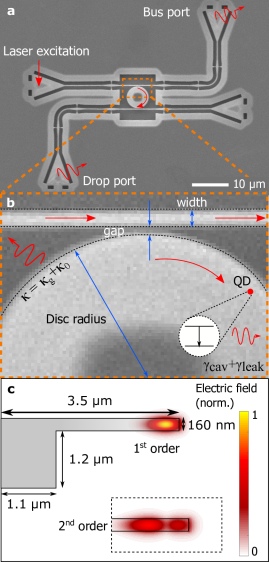
The disk resonators are fabricated with a 3.5 m radius, chosen because a m support pillar remains after the disk and waveguides are under-etched (dark region in Figures 1a and b), and because finite element simulations (COMSOL Multiphysics) reveal negligible bending losses. In fact, for the first two radial modes, as shown in Figure 1c, we find intrinsic quality factors (Q-factor) limited only by the computational accuracy . This value is well above typically reported values of for QD-based GaAs resonators 18, 19, 20 limited by surface roughness and gap state related surface absorption 21. However, these effects can be decreased by employing surface passivation techniques, resulting in ultrahigh Q-factor resonators 22. In our case, a further reduction due to coupling between the resonator and the access waveguides is expected. From the field distributions, we calculate the effective mode volumes23 of the first and second radial modes and (c.f. Supplementary Information).
To characterize the integrated photonic resonator, we use an optimized grating coupler 24 to launch light from a tunable continuous-wave laser through the access waveguides and into the disk. The access waveguide is single mode at the 940 nm emission wavelength of the QDs, and is tapered to a width of 220 nm in the vicinity of the resonator to improve coupling to the cavity mode. Additionally, in a series of different structures, the gap between the disk and waveguides is varied between 40 and 160 nm, in steps of 30 nm, to determine the critical coupling geometry.
Working at cryogenic temperatures, we scan the excitation laser frequency over a 13 THz bandwidth and record the outcoupled intensity transmitted through both the bus and drop ports, as shown in Figure 1a. Exemplary spectra are shown in Figure 2a, here for a gap size of 100 nm. In the bus port spectrum, which has been normalized to a highly dispersive background (all dips are shown; see Supplementary Information for raw data), we observe sharp dips at the WGM frequencies where the disk couples light from one access waveguide to another. Since the different resonator modes couple to the access waveguides with different efficiencies, the depths of the dips vary. As expected, the dips in the bus port spectrum are well correlated with peaks in the drop port spectrum, and the different resonance orders can be determined by the measured free spectral range. Furthermore, the QDs in the cavity are excited non-resonantly using a Ti:Sapphire laser at 810 nm (Tsunami) and the emission collected on a spectrometer. Note the strong emission enhancement when the QDs are on resonance with a cavity mode.
These measurements are repeated for all structures, fitting each cavity resonance with a Lorentzian function to determine its width , allowing us to deduce the loaded Q-factor , where is the central resonance frequency. A collection of values are shown in a histogram in Figure 2b), where a mean of 10600 4700 is obtained and the largest average is measured for 1st order modes ( 13600 5400 vs 9300 4900).
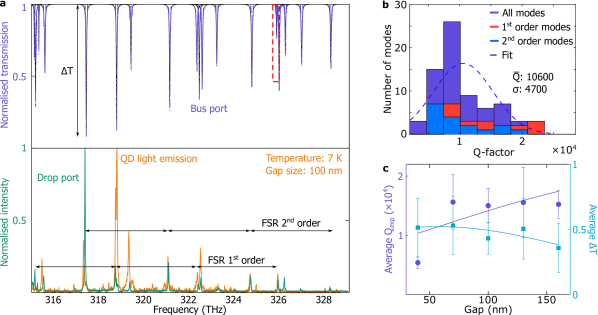
To determine the optimal, critically coupled configuration, we consider the gap-width dependence of both and change in transmission , cf. Figure 2c. Qualitatively, as the gap size increases, leading to a weaker coupling between the resonator and access waveguides, the signature of the coupling decreases with a corresponding increase in . This trend agrees well with the theoretical prediction (solid curves) for the loaded ring resonator,25
| (1) | ||||
| (2) |
where characterizes the coupling rate between the cavity and access waveguides, is the characteristic length constant, and is the gap size. In these equations, is the transmission at critical coupling, while is the intrinsic Q-factor of the resonator (i.e. in the absence of the access waveguides). From modelling the data, we find and a critical coupling gap size of nm, well within the reach of modern nanofabrication techniques.
3 Resonant scattering from a quantum dot
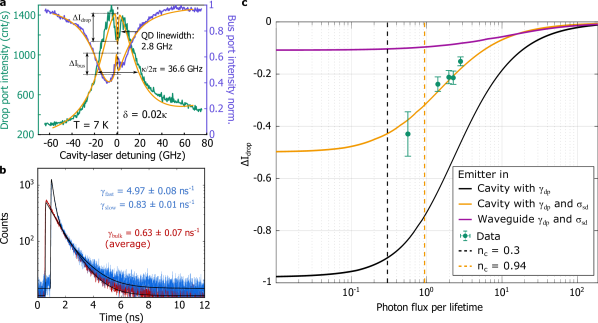
We now turn to the QDs embedded within the disks and study how the resonators alter the light-matter interaction. Figure 3a) shows typical drop (left axis, green) and bus (right axis, purple) intensity as a function of cavity-laser detuning, taken on a sample with a 100 nm gap at 7 K and at 5 W excitation power. In this figure, we see a clear signature of the coherent interaction between photons and the QD (highlighted by dashed lines in Fig. 3a), resulting in a re-routing of the photons between the bus and drop ports, at a QD-cavity detuning of . In the bus port, we observe a clear extinction by the QD of the transmission that is indicative of interference between the photons scattered by the QD and the incoming probe field 26, 15. Similarly, we observe a peak in the bus port intensity at the same location, as additional photons are scattered into this channel by the QD.
To accurately model the frequency response presented in Figure 3a we first require knowledge of the emitter decay rate, which is the sum of decay rates into free-space and the cavity mode . We therefore measure the QD lifetime in both bulk GaAs and when coupled to the microdisk, presenting exemplary results in Figure 3b. Bulk (red data) measurements are well-fitted by a single-exponential decay with an average value of = (0.63 0.07) ns-1, corresponding to the natural linewidth of = (0.1 0.01) GHz. In contrast, a double-exponential is needed to fit the cavity enhanced lifetime measurement (blue data), which we attribute to the different coupling of the two, orthogonally polarized QD transition dipoles to the cavity. Here, one dipole is well coupled to the cavity and hence has a fast decay rate ) ns-1 ((0.79 0.01) GHz linewidth), while the other is weakly coupled with a decay rate ) ns-1 ((0.31 0.002) GHz linewidth). By comparing the decay rate of the well-coupled transition to that of bulk , we find a lifetime enhancement of 7.9 due to the cavity. While it is likely that embedding the QD in the microdisk suppresses emission into free-space, relative to an emitter in the bulk, in what follows we assume that as is done in literature27, which means that we extract lower-bounds on the Purcell factor and the coupling efficiency of our system. Finally, we take the pure-dephasing rate for the QD embedded in the microdisks and at temperatures ranging from 6 - 12 K to be GHz, as reported in literature 28.
Having determined , and , we repeat the spectral measurements such as those presented in Figure 3a, increasing the excitation laser. For the drop port (green data), for example, the transmitted intensity is , where accounts for the incidence photon flux and the cavity-mediated coupling efficiency between the bus and drop port waveguides. An analytic form of the transmission coefficient, including coherent scattering from the QD, is known to be 29, 30
| (3) |
where is the laser detuning to the QD resonance, , and is the saturation parameter that accounts for the incident power (see Supplementary Information for relationship of to input power and photon number per lifetime, and the corresponding ). Spectral diffusion in the system results in ‘wandering’ of the QD resonance, which can be modelled by a convolution of the transmission with a Gaussian with linewidth :31
| (4) |
where
| (5) |
As can be seen in Figure 3a, the frequency response is well reproduced by the theory.
In practise, bus and drop port frequency-resolved data at different excitation powers are simultaneously fit with , , , and as free parameters, noting that is temperature dependent (see Figure 6 in the Supplementary Information). For the 5 W data presented in Figure 3a, we find S = 1.5 0.2 (corresponding to 1.4 0.2 photons per lifetime), a QD-cavity detuning of where GHz and spectral diffusion of GHz. We also find a coherent extinction of photons in the drop port () of (-24 4), as those photons are re-routed back into the bus port () by the QD. The measured ratio of 0.87 is a factor of 4 better than what has been achieved in slow-light photonic crystals with QDs that are not electrically contacted 32, where a peak extinction of was observed.
The routing can be controlled either through the QD-cavity detuning or by varying the intensity of the incident photon stream. We first demonstrate the latter, presenting the fraction of photons re-routed from the drop to bus ports as a function of the incident photon flux per lifetime in Figure 3c. Here, the extinction measurements (symbols) are compared with three theoretical predictions (using Eq. 3 above and the fitted parameters): the QD-resonator with broadening due to pure dephasing and spectral diffusion (orange curve), with pure dephasing only (as for an electrically contacted sample, black curve), or a QD in a waveguide (i.e. no emission enhancement, purple curve). The measurements are well reproduced when both pure dephasing and spectral diffusion are accounted for, and for this detuning a critical number of photons per lifetime of and maximum extinction of in the limit of low power () were found. For comparison, the maximum extinction realizable for a QD without Purcell enhancement is (-) %. For an electrically contacted QD system, where , the critical photon number is expected to decrease to , with a maximum being achievable (black curve) (see Supplementary Information). These results benchmarks the conditions for coherent routing of photons in between the bus and drop ports at the single-photon level.
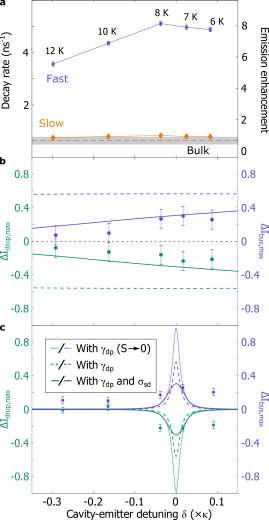
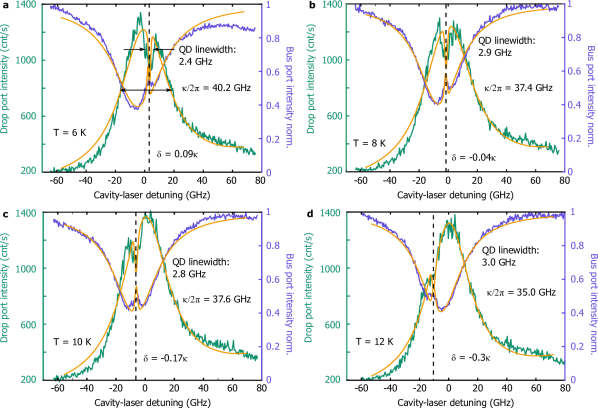
The photon routing can also be controlled by changing the QD-cavity detuning, which we do by varying the sample temperature, hence tuning the QD through the cavity resonance from -0.3 to 0.09 (Figure 4 in Supplementary Information). As the QD is scanned through the resonance, increases as can be seen in Figure 4a (purple symbols) and peaks at a maximum lifetime of = (5.11 0.08) at 8K (), corresponding to an 8-fold emission enhancement. In contrast, the weakly coupled transition decay rate (orange symbols) remains constant and near the bulk decay rate (shaded region).
We observe a similar trend in photon re-routing efficiency, shown in Figure 4b; as the QD becomes resonant with the microdisk, the maximum at the QD resonance () becomes increasingly negative (left axis, green symbols) while the maximum increases (right axis, purple symbols), as more photons are re-routed from the drop to bus port by the emitter, in good agreement with the theoretical calculations (solid curves). The predicted increase in routing efficiency for positive detunings is due to the decrease in spectral diffusion at lower temperatures (c.f. Supplementary Information). For our system, a maximum of of the photons are re-routed between the ports, although for a similar but electrically contacted resonator ( = 0 and , dashed curves), we predict that up to of the photons can be re-routed (dashed curves).
Figure 4c demonstrates how our system can be used as a coherent photon router in practice, showing the fraction of photons scattered out of the drop port (left axis, green symbols) and into the bus port (right axis, purple symbols) for photons on resonance with the cavity () as a function of the QD-cavity detuning. Here, we observe that a detuning of the QD of (requiring a temperature change of only 6 K) is sufficient to completely turn off the router, corresponding to a shift of QD linewidths. For an electrically contacted resonator, the fraction of photons scattered into the bus port increases to (dashed curve), where the intensity of the incoming photon stream adds an additional control knob that increases this value to (dotted curve). Instead of temperature tuning of the QD, it is also possible to achieve similar control electronically with a contacted sample 33 or even all-optically 26.
4 Discussion
Enhancing the quantum light-matter interactions simultaneously increases the coupling of photons to desired modes and the coherence of the emission, with implications for a host of quantum technologies. We define this enhancement in terms of the Purcell factor , which quantifies the change to the radiative emission rate, such that . Experimentally, we find (c.f. Figure 4a), which can be compared to the predicted value of,34, 30
| (6) |
where for our resonator 18 and = 8900 100. The resulting = 38 1 is larger than measured experimentally due to spatial mismatch of the QD relative to the field maximum of the optical mode. Deterministic positioning35, 36 can address this issue.
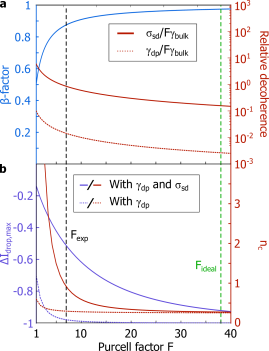
Increasing not only increases the emission rate, but also decreases the relative effect of decoherence mechanisms such as pure dephasing or spectral diffusion, with clear implications for bright sources of indistinguishable single photons 37. For our system, the dominant source of decoherence is spectral diffusion that, in bulk (=1), results in a ratio of 6. In Figure 5a, we display how this ratio decreases as the increases, noting that moderate 6 suffice to reach a unity ratio. A further two orders-of-magnitude reduction in decoherence is obtainable in the absence of spectral diffusion, motivating the use of electrically contacted resonators.
A QD-microdisk resonator system is not limited to acting as a source of quantum light states, but can also be used for their control or processing. As an example, this system can act as a Bell-state analyzer, a key element of a quantum optical network 38, either in a standard cavity-QED configuration 39 or as a passive, nonlinear scatterer 40. For cavity-QED, the Purcell factor can be re-expressed in terms of the QD-cavity coupling strength ,. The resulting GHz, which can be used to write the cooperativity of the system 41 . Given the success rate of a cavity-QED based analyzer of , we expect our modest device to succeed of the time.
On the other hand, the success of a Bell-state analyzer based on passive, coherent scattering from the QD depends on the emitter-waveguide coupling efficiency 40. By expressing the (lower-bound) -factor as
| (7) |
we find an experimental , which increases to for an optimally positioned QD. For this scheme, the success rate scales as , showing that near-perfect operation should be possible with our system.
Finally, as discussed in the main text, the QD-microdisk resonator can function as a coherent router, where the re-routing of photons between the drop and bus ports can be controlled either through the intensity of the incident photon stream or the QD-microdisk detuning. In Figure 5b we present the dependence of the maximum change in drop port intensity (i.e. re-routing efficiency, left axis) on the Purcell factor in the cases where the emitter suffers from both pure dephasing and spectral diffusion (solid curve) or just the former (dotted curve). Even for the non-contacted systems, we expect a re-routing efficiency in excess of for moderate enhancements of , while for an electrically contacted sample near-perfect routing is predicted already at . We predict similar dependencies for the critical photon number (Figure 5b, right axis), where for an on-resonance emitter we observe that moderate Purcell factors are sufficient to overcome spectral diffusion for single-photon nonlinearities.
5 Conclusions
In summary, we present an integrated whispering gallery mode resonator system for on-chip quantum photonics based on single self-assembled QDs. For such a system, which can be easily integrated with other photonic components, Q-factors in excess of 20,000 are observed, enhancing emission into the desired optical modes to simultaneously achieve a high coupling efficiency and compensate for the majority of the decoherence mechanisms. Using this platform, we demonstrate coherent re-routing of photons between the drop and bus ports, observing a peak efficiency of that is expected to increase to at and to ( and, ) with electrical gating 33. We show control over this routing using both temperature tuning and via the excitation intensity, with the latter requiring a critical photon number of only 0.94 photons per lifetime. Altogether, our platform enables coherent light-matter scattering 31 and efficient quantum optical nonlinearities 32, 42 at the single-photon level, two key functionalities of solid-state quantum technologies 41.
The authors gratefully acknowledge financial support from Danmarks Grundforskningsfond (DNRF 139, Hy-Q Center for Hybrid Quantum Networks) and the European Union’s Horizon 2020 research and innovation programme under grant agreement No. 824140 (TOCHA, H2020-FETPROACT-01-2018). A.D.W. and A.L. acknowledge gratefully support of DFG-TRR160 and BMBF - Q.Link.X 16KIS0867. {suppinfo} The supplementary information containing the theoretical models and fabrication details can be found here below.
6 Supplementary Information
6.1 Raw bus port scans
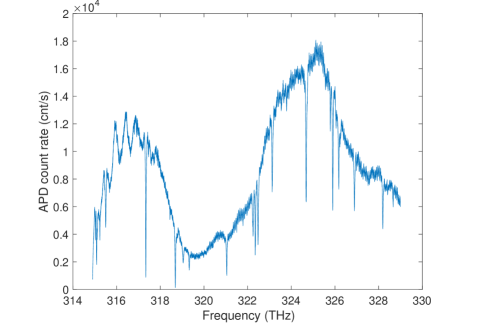
We use a tunable continuous (cw) laser (Toptica CTL) to study the sample by coupling the laser into the waveguide mode via the shallow etch gratings. We scan the laser frequency over a 13 GHz range and monitor the intensity that is outcoupled at the bus port with a single-photon detector. An example of the raw data is shown in Fig. 6, corresponding to Fig. 2a in the main manuscript. A large background oscillation due to the frequency dependent grating is visible. To make the transmission dips more comparable, they are each normalized to the background count rate at their frequency position, allowing us to obtain the dip transmission .
6.2 Estimating the Purcell factor and coupling strength
The theoretical model in this paper is based on reference29. We start by considering a single Indium Arsenide (InAs) quantum dot (QD) in bulk Gallium Arsenide (GaAs). It decays with a rate of: , corresponding to the radiative decay and decay to non-radiative channels respectively 43. When the emitter is placed in a cavity, its overall decay rate is modified and is thus given by:
| (8) |
where we consider decay into the cavity mode, non-radiative channels and non-cavity modes respectively. For InAs QDs in bulk GaAs, quantum efficiencies () 0.9 are routinely reported 44, 17. By coupling the QDs to a cavity, the enhanced radiative decay rate further increases its as follows:
| (9) |
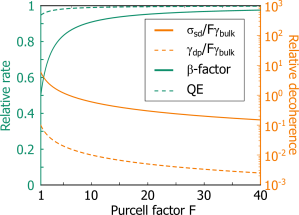
where we have used the approximation , as has been reported elsewhere 27. The variation in as a function of Purcell enhancement is displayed in Fig. 7, evaluated with =0.9 at 1. Here the increases above 0.99 for 6.3, suggesting that the non-radiative decay rate is small and hence justifying the approximation .
By using these approximations, we can also write and the coupling efficiency as 30:
| (10) |
To obtain the Purcell factor experimentally, we measure the lifetime of the QD situated in the cavity and compare it to the average lifetime measured for QDs in bulk GaAs. A cavity-enhanced decay rate allows us to express:
| (11) |
Given the measured lifetimes, we obtain a , with which we can further estimate the QD-cavity coupling strength as follows 30:
| (12) |
For our system, we obtain GHz. Subsequently, we estimate the Cooperativity factor using the following formula:
| (13) |
6.3 Coherent interaction of the QD-cavity system
To study the coherent interaction of the QD-cavity system, we consider a two-level system placed in a cavity and coupled to a waveguide, as depicted in Fig. 1 in the main text. We measure the transmission in the bus port and in the drop port. We start with the rate equations of the QD-cavity system, which are found in the literature 29:
| (14) |
| (15) |
| (16) |
where is the outgoing field into the drop port, is the incoming field amplitude, is the total quality factor including coupling to leaky modes, is the quality factor of the cavity mode, is the transmission of an empty cavity, is the frequency detuning of the drive field, is the cavity linewidth, and is the detuning of the cavity resonance with respect to the QD resonance. The atomic operators are and and in the above equations we are considering the expectation values, , , and . Here, is the bare cavity response in the absence of an emitter:
| (17) |
Additionally, the parameter describes the decay rate into the cavity versus all other rates:
The steady-state solution to and can be found from Eqs.14-15 by setting and , which results in:
| (18) |
| (19) |
| (20) |
where is the critical power to reach and scales like the number of photons per second. Here we can use the following expressions to simplify :
| (21) | ||||
| (22) | ||||
| (23) | ||||
| (24) |
This allows us to obtain the following expression for the critical power :
| (25) |
In the limit of and , the above expression can be simplified to:
| (26) |
The atomic population therefore becomes:
| (27) |
where is the saturation parameter. We have also introduced a coupling efficiency that relates the incoming light to the light that reaches the cavity, such that for an ideal lossless system . can hence be expressed as:
| (28) |
where and are the number of incident photons per lifetime and the critical number of photons per lifetime to reach S = 1, respectively. In our work, we are considering a ”leaky” cavity where the emitter in the cavity couples to leaky modes with decay rate and experiences pure dephasing with the rate . Assuming coupling to the cavity via the waveguides only, we obtain the following transmission coefficient :
| (29) |
| (30) |
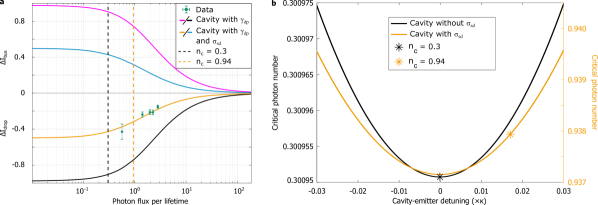
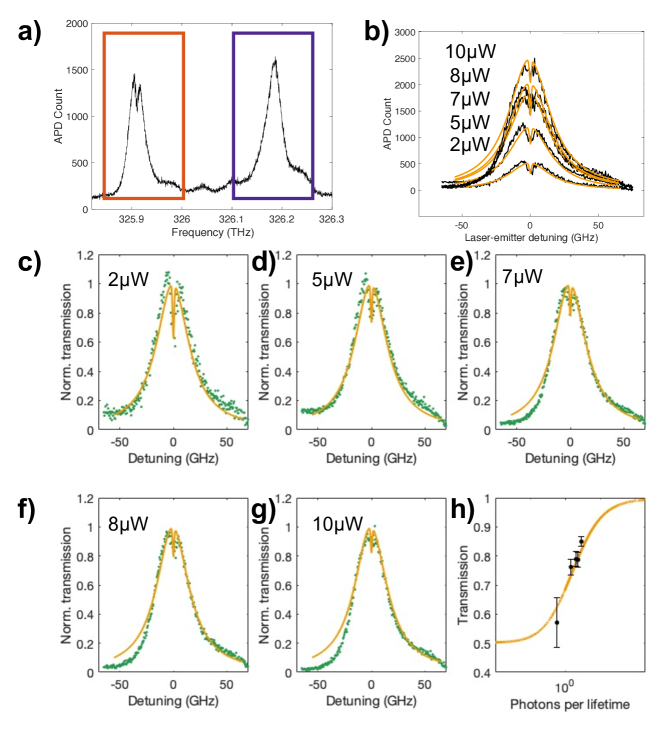
This gives the steady-state cavity transmittivity in the drop and bus ports: and , where accounts for the total unnormalized count rate. Since the transmission by the QD depends on the incoming power, the first step in our fitting procedure is to use Eq. 29 to fit the drop and bus port spectra at 7K whilst varying the power. We use the knowledge of the QD lifetime in the cavity and hence obtain the cavity linewidth , QD spectral diffusion , detuning and saturation parameter . In Fig. 8a), we show the QD extinction for different powers together with its theoretical fit and observe experimentally that the coherent extinction by the QD on resonance with the cavity decreases as the power increases. Both the theoretical drop and bus port extinction and , excluding spectral diffusion (pink and black solid lines), are displayed. Their inverse relation show that the incoming photons are either routed through to the bus port or drop port, and the ratio can be controlled by the incoming photon flux impinging on a single QD in the cavity, enabling its use as a photon switch. This analysis also allows us to obtain the critical photon number = 0.94 at a 7K at detuning . In the absence of spectral diffusion and on resonance (but including dephasing), = 0.3, close to the ideal value of 0.25.
Using the knowledge of , we are further able to fit the temperature tuned data where the QD is moved through the cavity resonance, as displayed in Fig. 9.
For reference, the power-dependent transmission coefficient is further simplified when the emitter is resonant with the cavity, :
| (31) |
6.4 Critical coupling
The proximity of the waveguide to the cavity results in gap-dependent , that increases as the gap between cavity and waveguide is widened. Following the formalism in reference 25, the coupling on resonance can be expressed as:
| (32) | ||||
| (33) |
where is the coupling rate between the cavity and access waveguides, is the characteristic length constant and is the gap size. In these expressions, is the transmission at critical coupling, while is the intrinsic quality factor of the resonator in the absence of the access waveguides.
6.5 Background subtraction in data
The cavity resonance as shown in Fig. 3 in the main text is spectrally situated in the vicinity of another cavity mode, increasing the count rate on one side of the cavity mode, as depicted in Fig. 10a. To better fit our data, we include the second cavity mode in the fitting analysis, which is depicted in Fig. 10b where all power spectra are fitted simultaneously along with the second resonance. In order to model the power saturation curve given by Eq. 29 at , we subtract the additional counts from the second cavity mode using the double-cavity fit, which results in fits as shown in Fig. 10c-g. This data is subsequently fitted with Eq. 29 convoluted with a Gaussian to include spectral diffusion, with which we also find the parameters , , . Using Eq. 25 (assuming ) and Eq. 28 we are able to convert input power to photons per lifetime and obtain Fig. 10h. Each data point in Fig. 10h is equal to the minimum within the QD dip of the corresponding data. The errors are primarily due to the dark count noise on our single photon detectors.
6.6 Temperature dependent spectral diffusion
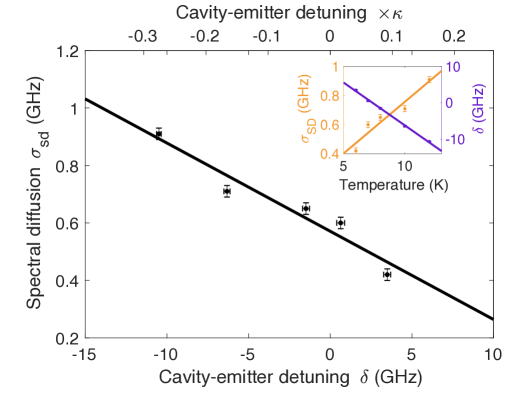
In our experiment, the QD is tuned across the cavity resonance by controlling the sample temperature and we denote the cavity-emitter detuning . This is taken into account in the theoretical calculations displayed in Figure 4 in the main text, where the spectral diffusion varies with temperature. From the inset in Fig. 11, it is shown that both and scale linearly with temperature. This allows us to fit a linear relation between and , which we use to extract the amount of temperature-dependent spectral diffusion experienced by the QD.
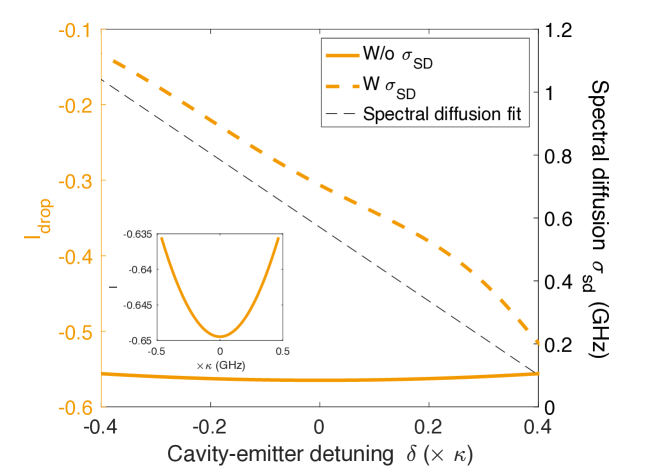
The linear relation of the spectral diffusion is taken into account in Fig. 4 in the main text, where the theoretical extinction of the QD is expected to be at maximum when the QD is on resonance with the cavity, as depicted on the inset in Fig. 12. Due to the contribution, which decreases for lower temperatures, the extinction also scales linearly as can be seen of Fig. 12.
6.7 Mode profile and volume calculations
A geometry representing the disc structures discussed in this paper was defined and meshed in COMSOL Multiphysics 5.1. Using the Electromagnetic Waves, Frequency Domain and rotational symmetry we searched for eigenfrequencies in the disc in the 910-940nm range and were hence able to simulate the first and higher order modes of the structure.
All variables are calculated using COMSOL along with the Electromagnetic Waves, Frequency Domain physics package in order to obtain the final effective mode volumes of the various modes discussed in the main manuscript, using n = 3.46 for GaAs. In order to obtain a sufficiently small convergence error in the simulations, the geometry was meshed to a maximum element size of (corresponding to of the height of the disc), while the pedestal and the surrounding air was meshed to a maximum element size of (corresponding to of the central wavelength within the simulation). Finally, a perfectly matched layer (PML) enclosing the geometry and air is added as the outer boundary of the setup. This procedure results in a convergence error .
We follow the approach presented in 8 but adapt it for a linear dipole, using the knowledge of how the counter propagating modes are related, and given the mode volume when the dipole is placed in the field maximum, we obtain a minimum mode volume for a lossy structure in cylindrical coordinates:
| (34) |
where is the electric field while is the magnetic field of the mode. The factor is the refractive index, is the permittivity of the material while is the vacuum permittivity, and is the permeability of the material.
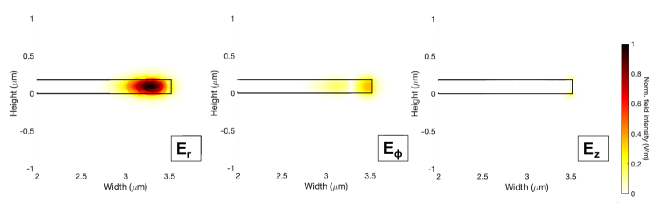
The normalized mode profile is presented in the main text. In Fig. 13 we see the contributions from the various components of the mode and note that the radial component is by far the dominant mode as would be expected.
6.8 Fabrication
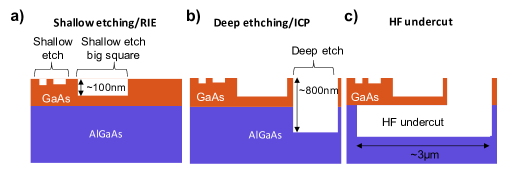
Disc resonators used throughout this study were fabricated on an undoped GaAs (160nm)/ AlGaAs (1150nm) wafer embedded with InAs quantum dots. The devices were developed using Electron Beam Lithography (EBL) on a layer of resist (ZEP520). Our smallest design features are 40 nm, which is larger than the precision of the EBL-alignment error of 30 nm. The shallow edged gratings were etched using Reactive Ion Etching (RIE), followed by an Inductively Coupled Plasma (ICP) etching to a depth of 800 nm. In the final step, the remaining structures were under-etched to fully suspend the waveguides and the periphery of the discs (m) using hydrofluoric acid (HF, 10%), which is depicted in Fig 14. The under-etching step sets a lower limit on the size of the disc. Following the under-etching, the sample was dried using a Critical Point Dryer (CPD).
References
- Akahane et al. 2003 Akahane, Y.; Asano, T.; Song, B.-S.; Noda, S. High-Q photonic nanocavity in a two-dimensional photonic crystal. Nature 2003, 425, 944–947
- Armani et al. 2003 Armani, D. K.; Kippenberg, T. J.; Spillane, S. M.; Vahala, K. J. Ultra-high-Q toroid microcavity on a chip. Nature 2003, 421, 925–928
- Aoki et al. 2006 Aoki, T.; Dayan, B.; Wilcut, E.; Bowen, W. P.; Parkins, A. S.; Kippenberg, T. J.; Vahala, K. J.; Kimble, H. J. Observation of strong coupling between one atom and a monolithic microresonator. Nature 2006, 443, 671–674
- Hennessy et al. 2007 Hennessy, K.; Badolato, A.; Winger, M.; Gerace, D.; Atatüre, M.; Gulde, S.; Fält, S.; Hu, E. L.; Imamoğlu, A. Quantum nature of a strongly coupled single quantum dot–cavity system. Nature 2007, 445, 896–899
- Loo et al. 2010 Loo, V.; Lanco, L.; Lemaître, A.; Sagnes, I.; Krebs, O.; Voisin, P.; Senellart, P. Quantum dot-cavity strong-coupling regime measured through coherent reflection spectroscopy in a very high-Q micropillar. Appl. Phys. Lett. 2010, 97, 241110
- Wang et al. 2019 Wang, D.; Kelkar, H.; Martin-Cano, D.; Rattenbacher, D.; Shkarin, A.; Utikal, T.; Götzinger, S.; Sandoghdar, V. Turning a molecule into a coherent two-level quantum system. Nature Physics 2019, 15, 483–489
- Lodahl et al. 2017 Lodahl, P.; Mahmoodian, S.; Stobbe, S.; Rauschenbeutel, A.; Schneeweiss, P.; Volz, J.; Pichler, H.; Zoller, P. Chiral quantum optics. Nature 2017, 541, 473–480
- Martin-Cano et al. 2019 Martin-Cano, D.; Haakh, H. R.; Rotenberg, N. Chiral Emission into Nanophotonic Resonators. ACS Photonics 2019, 6, 961–966
- Hilico et al. 2016 Hilico, M. S. A.; Will, E.; Volz, J.; Rauschenbeutel, A. Quantum optical circulator controlled by a single chirally coupled atom. Science 2016, 354, 1577–1580
- Sayrin et al. 2015 Sayrin, C.; Junge, C.; Mitsch, R.; Albrecht, B.; O’Shea, D.; Schneeweiss, P.; Volz, J.; Rauschenbeutel, A. Nanophotonic Optical Isolator Controlled by the Internal State of Cold Atoms. Phys. Rev. X 2015, 5, 041036
- Bechler et al. 2018 Bechler, O.; Borne, A.; Rosenblum, S.; Guendelman, G.; Mor, O. E.; Netser, M.; Ohana, T.; Aqua, Z.; Drucker, N.; Finkelstein, R.; Lovsky, Y.; Bruch, R.; Gurovich, D.; Shafir, E.; Dayan, B. A passive photon–atom qubit swap operation. Nature Physics 2018, 14, 996–1000
- Pedersen et al. 2020 Pedersen, F. T.; Wang, Y.; Olesen, C. T.; Scholz, S.; Wieck, A. D.; Ludwig, A.; Löbl, M. C.; Warburton, R. J.; Midolo, L.; Uppu, R.; Lodahl, P. Near Transform-Limited Quantum Dot Linewidths in a Broadband Photonic Crystal Waveguide. ACS Photonics 2020, 7, 2343–2349
- Englund et al. 2012 Englund, D.; Majumdar, A.; Bajcsy, M.; Faraon, A.; Petroff, P.; Vučković, J. Ultrafast Photon-Photon Interaction in a Strongly Coupled Quantum Dot-Cavity System. Phys. Rev. Lett. 2012, 108, 093604
- Sun et al. 2018 Sun, S.; Kim, H.; Luo, Z.; Solomon, G. S.; Waks, E. A single-photon switch and transistor enabled by a solid-state quantum memory. Science 2018, 361, 57–60
- Thyrrestrup et al. 2018 Thyrrestrup, H. et al. Quantum Optics with Near-Lifetime-Limited Quantum-Dot Transitions in a Nanophotonic Waveguide. Nano Lett. 2018, 18, 1801–1806
- Wang et al. 2021 Wang, Y.; Uppu, R.; Zhou, X.; Papon, C.; Scholz, S.; Wieck, A. D.; Ludwig, A.; Lodahl, P.; Midolo, L. Electroabsorption in gated GaAs nanophotonic waveguides. Appl. Phys. Lett. 2021, 118, 131106
- Wang et al. 2011 Wang, Q.; Stobbe, S.; Lodahl, P. Mapping the Local Density of Optical States of a Photonic Crystal with Single Quantum Dots. Phys. Rev. Lett. 2011, 107, 167404
- Gayral et al. 2001 Gayral, B.; Gérard, J. M.; Sermage, B.; Lemaître, A.; Dupuis, C. Time-resolved probing of the Purcell effect for InAs quantum boxes in GaAs microdisks. Appl. Phys. Lett. 2001, 78, 2828–2830
- Michael et al. 2007 Michael, C. P.; Srinivasan, K.; Johnson, T. J.; Painter, O.; Lee, K. H.; Hennessy, K.; Kim, H.; Hu, E. Wavelength- and material-dependent absorption in GaAs and AlGaAs microcavities. Appl. Phys. Lett. 2007, 90, 051108
- Baker et al. 2011 Baker, C.; Belacel, C.; Andronico, A.; Senellart, P.; Lemaitre, A.; Galopin, E.; Ducci, S.; Leo, G.; Favero, I. Critical optical coupling between a GaAs disk and a nanowaveguide suspended on the chip. Appl. Phys. Lett. 2011, 99, 151117
- Najer et al. 2021 Najer, D.; Tomm, N.; Javadi, A.; Korsch, A. R.; Petrak, B.; Riedel, D.; Dolique, V.; Valentin, S. R.; Schott, R.; Wieck, A. D.; Ludwig, A.; Warburton, R. J. Suppression of Surface-Related Loss in a Gated Semiconductor Microcavity. Phys. Rev. Appl. 2021, 15, 044004
- Guha et al. 2017 Guha, B.; Marsault, F.; Cadiz, F.; Morgenroth, L.; Ulin, V.; Berkovitz, V.; Lemaître, A.; Gomez, C.; Amo, A.; Combrié, S.; Gérard, B.; Leo, G.; Favero, I. Surface-enhanced gallium arsenide photonic resonator with quality factor of . Optica 2017, 4, 218–221
- Sauvan et al. 2013 Sauvan, C.; Hugonin, J. P.; Maksymov, I. S.; Lalanne, P. Theory of the Spontaneous Optical Emission of Nanosize Photonic and Plasmon Resonators. Phys. Rev. Lett. 2013, 110, 237401
- Zhou et al. 2018 Zhou, X.; Kulkova, I.; Lund-Hansen, T.; Hansen, S. L.; Lodahl, P.; Midolo, L. High-efficiency shallow-etched grating on GaAs membranes for quantum photonic applications. Appl. Phys. Lett. 2018, 113, 251103
- Ding et al. 2010 Ding, L.; Senellart, P.; Lemaître, A.; Ducci, S.; Leo, G.; Favero, I. GaAs micro-nanodisks probed by a looped fiber taper for optomechanics applications. Proc. SPIE 2010, 7712, 771211
- Türschmann et al. 2017 Türschmann, P.; Rotenberg, N.; Renger, J.; Harder, I.; Lohse, O.; Utikal, T.; Götzinger, S.; Sandoghdar, V. Chip-Based All-Optical Control of Single Molecules Coherently Coupled to a Nanoguide. Nano Lett. 2017, 17, 4941–4945
- Srinivasan and Painter 2007 Srinivasan, K.; Painter, O. Linear and nonlinear optical spectroscopy of a strongly coupled microdisk–quantum dot system. Nature 2007, 450, 862–866
- Tighineanu et al. 2018 Tighineanu, P.; Dreeßen, C. L.; Flindt, C.; Lodahl, P.; Sørensen, A. S. Phonon Decoherence of Quantum Dots in Photonic Structures Broadening of the Zero-Phonon Line and the Role of Dimensionality. Phys. Rev. Lett. 2018, 120, 257401
- Aufféves-Garnier et al. 2007 Aufféves-Garnier, A.; Simon, C.; Gérard, J.-M.; Poizat, J.-P. Giant optical nonlinearity induced by a single two-level system interacting with a cavity in the Purcell regime. Phys. Rev. A 2007, 75, 1–16
- Wang et al. 2017 Wang, D.; Kelkar, H.; Martin-Cano, D.; Utikal, T.; Götzinger, S.; Sandoghdar, V. Coherent Coupling of a Single Molecule to a Scanning Fabry-Perot Microcavity. Phys. Rev. X 2017, 7, 021014
- Jeannic et al. 2021 Jeannic, H. L.; Ramos, T.; Simonsen, S. F.; Pregnolato, T.; Liu, Z.; Schott, R.; Wieck, A. D.; Ludwig, A.; Rotenberg, N.; García-Ripoll, J. J.; Lodahl, P. Experimental Reconstruction of the Few-Photon Nonlinear Scattering Matrix from a Single Quantum Dot in a Nanophotonic Waveguide. Phys. Rev. Lett. 2021, 126, 023603
- Javadi et al. 2015 Javadi, A.; Söllner, I.; Arcari, M.; Hansen, S. L.; Midolo, L.; Mahmoodian, S.; Kiršanske, G.; Pregnolato, T.; Lee, E.; Song, J.; Stobbe, S.; Lodahl, P. Single-photon non-linear optics with a quantum dot in a waveguide. Nat. Commun. 2015, 6, 8655
- Uppu et al. 2020 Uppu, R.; Pedersen, F. T.; Wang, Y.; Olesen, C. T.; Papon, C.; Zhou, X.; Midolo, L.; Scholz, S.; Wieck, A. D.; Ludwig, A.; Lodahl, P. Scalable integrated single-photon source. Science Adv. 2020, 6, eabc826
- Purcell 1946 Purcell, E. M. Spontaneous Emission Probabilities at Radio Frequencies. Phys. Rev. 1946, 69, 674
- Schnauber et al. 2018 Schnauber, P.; Schall, J.; Bounouar, S.; Höhne, T.; Park, S.-I.; Ryu, G.-H.; Heindel, T.; Burger, S.; Song, J.-D.; Rodt, S.; Reitzenstein, S. Deterministic Integration of Quantum Dots into on-Chip Multimode Interference Beamsplitters Using in Situ Electron Beam Lithography. Nano Lett. 2018, 18, 2336–2342
- Pregnolato et al. 2020 Pregnolato, T.; Chu, X.-L.; Schröder, T.; Schott, R.; Wieck, A. D.; Ludwig, A.; Lodahl, P.; Rotenberg, N. Deterministic positioning of quantum dots in nanophotonic waveguides. APL Photonics 2020, 5, 086101
- C. et al. 2002 C.,; Santori,; Fattal, D.; Vučkovi/’c, J.; Solomon, G. S.; Yamamoto, Y. Indistinguishable photons from a single-photon device. Nature 2002, 419, 594–597
- Lodahl 2018 Lodahl, P. Quantum-dot based photonic quantum networks. Quantum Sci. Technol. 2018, 3, 013001
- Duan and Kimble 2004 Duan, L.-M.; Kimble, H. J. Scalable Photonic Quantum Computation through Cavity-Assisted Interactions. Phys. Rev. Lett. 2004, 92, 127902
- Ralph et al. 2015 Ralph, T. C.; Söllner, I.; Mahmoodian, S.; White, A. G.; Lodahl, P. Photon Sorting, Efficient Bell Measurements, and a Deterministic Controlled-Z Gate Using a Passive Two-Level Nonlinearity. Phys. Rev. Lett. 2015, 114, 173603
- Borregaard et al. 2019 Borregaard, J.; Sørensen, A. S.; Lodahl, P. Quantum Networks with Deterministic Spin–Photon Interfaces. Adv. Quant. Tech. 2019, 2, 1800091
- Türschmann et al. 2019 Türschmann, P.; Jeannic, H. L.; Simonsen, S. F.; Haakh, H. R.; Götzinger, S.; Sandoghdar, V.; Lodahl, P.; Rotenberg, N. Coherent nonlinear optics of quantum emitters in nanophotonic waveguides. Nanophotonics 2019, 8, 1641–1657
- Johansen et al. 2008 Johansen, J.; Stobbe, S.; Nikolaev, I. S.; Lund-Hansen, T.; Kristensen, P. T.; Hvam, J. M.; Vos, W. L.; Lodahl, P. Size dependence of the wavefunction of self-assembled InAs quantum dots from time-resolved optical measurements. Phys. Rev. B 2008, 77, 073303
- Stobbe et al. 2009 Stobbe, S.; Johansen, J.; Kristensen, P. T.; Hvam, J. M.; Lodahl, P. Frequency dependence of the radiative decay rate of excitons in self-assembled quantum dots: Experiment and theory. Phys. Rev. B 2009, 80, 155307