The Large Enriched Germanium Experiment for Neutrinoless Decay
![[Uncaptioned image]](/html/2107.11462/assets/x1.jpg)
LEGEND-1000 Preconceptual Design Report
LEGEND-1000 Preconceptual Design Report
LEGEND Collaboration
Acknowledgments
This material is based upon work supported by the U.S. Department of Energy, Office of Science, Office of Nuclear Physics under Federal Prime Agreements DE-AC02-05CH11231, DE-AC05-00OR22725, LANLEM77, and under award numbers DE-FG02-97ER41020, DE-FG02-97ER41033, DE-FG02-97ER41041, DE-FG02-97ER41042, DE-SC0017594, DE-SC0012612, DE-SC0018060, and DE-SC0014445. We acknowledge support from the Nuclear Precision Measurements program of the Division of Physics of the National Science Foundation through grant numbers NSF PHY-1812374, NSF PHY-1812356, NSF PHY-1812409, and from the Office of International Science and Engineering of the National Science Foundation through grant number NSF OISE 1743790. We gratefully acknowledge the support of the U.S. Department of Energy through the LANL, ORNL and LBNL Laboratory Directed Research and Development (LDRD) Programs for this work. This research was supported in part by the Excellence Cluster ORIGINS (EXC-2094 : 390783311) and the SFB1258 which are funded by the Deutsche Forschungsgemeinschaft (DFG, German Research Foundation). We acknowledge the support of the German Federal Ministry for Education and Research (BMBF) through grant number 05A2020. and the Max Planck Society (MPG). This work is supported in part by the European Research Council (ERC) under the European Union’s Horizon 2020 research and innovation programme (Grant agreement No. 786430 - GemX). We gratefully acknowledge the Italian Istituto Nazionale di Fisica Nucleare (INFN), the Polish National Science Centre (NCN, grant number UMO-2020/37/B/ST2/03905), the Polish Ministry of Science and Higher Education (MNiSW, grant number DIR/WK/2018/08), the Czech Republic Ministry of Education, Youth and Sports CZ.02.1.01/0.0/0.0/16_019/0000766 and LM2018107, the Slovak Research and Development Agency, grant No. 15-0576, and the Swiss National Science Foundation (SNF). This project has received funding /support from the European Union’s Horizon 2020 research and innovation programme under the Marie Skłodowska-Curie grant agreement No 860881-HIDDeN. This work has been supported by the Science and Technology Facilities Council, part of U.K. Research and Innovation (grant numbers ST/T002042/1 and ST/T004169/1). We acknowledge support from the Russian Foundation for Basic Research (RFBR), grant No. 15-02-02919, and from the Institute of Nuclear Physics and Technology of National Research Nuclear University “Moscow Engineering Physics Institute” and by the Ministry of Science and Higher Education of the Russian Federation, Project “Fundamental properties of elementary particles and cosmology” No 0723-2020-0041. We acknowledge the support of the Natural Sciences and Engineering Research Council of Canada, funding reference number SAPIN-2017-00023, and from the Canada Foundation for Innovation John R. Evans Leaders Fund. This research used resources provided by National Energy Research Scientific Computing Center, a U.S. Department of Energy Office of Science User Facility under Contract No. DE-AC02-05CH11231, and the Oak Ridge Leadership Computing Facility at Oak Ridge National Laboratory. The collaboration thanks the directors and the staff of the Laboratori Nazionali del Gran Sasso for their continuous strong support of the LEGEND experiment. We thank our hosts and colleagues at the Sanford Underground Research Facility for their support.
I. Executive Summary
Objective: We propose the construction of LEGEND-1000, the ton-scale Large Enriched Germanium Experiment for Neutrinoless Decay. This international experiment is designed to answer one of the highest priority questions in fundamental physics. It consists of 1000 kg of Ge detectors enriched to more than 90% in the 76Ge isotope of interest operated in a liquid argon active shield at a deep underground laboratory. The experiment is designed to achieve a discovery potential that covers the inverted-ordering neutrino mass scale region. The baseline design assumes installation in the SNOLAB cryopit. A similar experimental setup could also be realized at the alternative LNGS site.
Vision and Mission: Neutrinos have been at the forefront of discovery in particle physics for decades, and the study of their properties drove the conception of the weak interaction and modern quantum field theories. Still unanswered is the important fundamental question of whether the neutrino is identical to its anti-particle, i.e., a Majorana particle, a property connected to the origin of its mass. Majorana neutrinos are naturally predicted by many extensions of the Standard Model (SM). They are also predicted by leptogenesis, a leading model to account for the predominance of matter over antimatter in the Universe.
The only known, feasible probe of the Majorana nature of the neutrino is neutrinoless double-beta () decay, an as yet unobserved radioactive transition. The discovery of decay would prove unambiguously not only that new lepton-number-violating physics exists but also that it is connected to the mysterious origin of the neutrino’s mass. There is a long history of searches for decay. At present, the most stringent constraints are set by experiments using the isotopes 76Ge, 130Te, and 136Xe, with lower bounds on the decay half-life surpassing years. For minimal extensions of the SM, these limits constrain the effective Majorana neutrino mass at the scale of 100 meV.
LEGEND-1000 is designed to probe decay with a 99.7% CL discovery sensitivity, defined to be a 50% chance of measuring a signal of at least 3 significance, in the 76Ge half-life beyond years, corresponding to a upper limit in the range of 9–21 meV in 10 yr of live time. By combining the lowest background levels and the best energy resolution in the field, LEGEND-1000 will perform a quasi-background-free search and can make an unambiguous discovery of decay with just a handful of counts at the decay value (). The experiment uses an unambiguous signature for the events of interest: a fully contained event at a very specific energy (2039 keV) with a distinctive signal shape that indicates a single-interaction event topology in the bulk of a Ge detector and with no accompanying signals from other detectors. LEGEND-1000’s discovery sensitivity covers the inverted-ordering neutrino mass scale. It also probes the next order of magnitude for the normal ordering and other exchange mechanisms.
Experimental Advantages: Germanium is a leading material for decay searches:
-
•
Germanium detectors achieve the best energy resolution of any decay experiment, while also providing detailed information on the event topology.
-
•
It can be isotopically enriched to greater than 90% in 76Ge in sufficient quantities and converted into high-purity Ge detectors with high yield.
-
•
Nearly all 76Ge decays occur in active detector regions that do not require self-shielding to eliminate background, resulting in high detection efficiency.
-
•
Germanium detectors have undetectably low 232Th- and 238U-chain internal contamination and no known background source produces a peak in the vicinity of .
-
•
Experiments based on 76Ge (Gerda and Majorana Demonstrator) have achieved the lowest background of any decay experiment when normalized to energy resolution and operate in a quasi-background-free regime, with no contamination from two-neutrino double-beta () decays. Thus, decay events would create a lone, sharp peak in the energy spectrum, visible to the eye. The extraction of a decay signal does not rely on background modeling and so has negligible systematic uncertainty.
Key Innovations: While Ge detector technology is mature and proven, it continues to be improved. LEGEND-1000 builds upon major breakthroughs achieved in the current-generation Ge-based searches, combining excellent energy resolution with the most effective background-mitigating practices employed in Gerda and the Majorana Demonstrator. The immersion of Ge detectors in a LAr scintillating medium by Gerda has shown that backgrounds can be greatly suppressed. The dominant backgrounds in Gerda, other than 42Ar, can be reduced using Majorana Demonstrator’s materials and improved energy resolution. The use of underground-sourced liquid argon (UGLAr) can drastically reduce the 42Ar background. LEGEND-1000 is informed by the design of a 200-kg phase, LEGEND-200, which is using new inverted-coaxial point-contact (ICPC) Ge detectors with more than a factor of two greater mass per crystal over previous experiments and excellent energy resolution. Combining these innovations leads to an achievable LEGEND-1000 background goal of less than cts/(keV kg yr).
LEGEND-1000 Baseline Design: The LEGEND-1000 experiment utilizes the demonstrated low background and excellent energy performance of high-purity p-type, ICPC Ge semiconductor detectors, enriched to more than 90% in 76Ge. The background rejection power of ICPC detectors begins with their superb energy resolution, demonstrated to have a full-width at half-maximum (FWHM) resolution of 0.12% (0.05% ) at . Pulse shape analysis of the signal distinguishes bulk decay energy depositions from surface events and backgrounds from rays with multiple interaction sites. The granular nature of the Ge detector array allows rejection of background events that span multiple detectors. Finally, background interactions external to the Ge detectors are identified by LAr scintillation light.
About 400 ICPC detectors with an average mass of 2.6 kg each are distributed among four 250-kg modules to allow independent operation and phased commissioning. In each module, the detectors are arranged into 14 vertical strings, are supported by ultra-clean materials and read out using ultra-low-background ASIC-based electronics. The detector strings are immersed in radiopure UGLAr, reduced in the 42Ar isotope and contained within an electroformed copper reentrant tube. Each of the four UGLAr modules is surrounded by LAr produced from atmospheric Ar, contained within a vacuum-insulated cryostat. The LAr volumes are instrumented with an active veto system comprising optical fibers read out by Si photomultipliers. The cryostat is enveloped by a water tank providing additional shielding. The baseline design assumes installation in the SNOLAB cryopit.
II. Introduction and Science Program
II.1. Global Symmetries of the Standard Model and Lepton Number Violation
In the Standard Model (SM) Weinberg (2018) of particle physics, lepton flavor and total lepton number, , are both conserved quantities de Gouvea and Vogel (2013). The existence of neutrino oscillation indicates that flavor lepton number is not conserved. The quantity , on the other hand, is associated with the SM’s symmetry and remains a conserved quantity at the classical level in the SM.
This empirically observed symmetry, like that associated with baryon number, , is accidental in the SM Rodejohann (2011). In Grand Unified Theories (GUTs), quarks and leptons are grouped in multiplets, and thus and are not expected to be conserved. In the SM, the combination is conserved, but it is usually broken at some scale in GUTs. Furthermore, there is an excess of baryons over anti-baryons in the Universe. The Big Bang presumably created equal numbers of each, suggesting that some - or -violating process must have subsequently generated the asymmetry. The SM contains in principle all the ingredients required for the baryon asymmetry, but it quantitatively predicts a much smaller asymmetry than is observed ’t Hooft (1976); Davidson et al. (2008). Therefore, new physics is required.
Neutrino oscillations prove that neutrinos have mass, but they provide information only on the differences between their masses squared. Precise measurements of beta-decay kinematics constrain the neutrino mass to be much smaller than that of their charged-lepton counterparts. The seesaw mechanism provides an explanation for this very low neutrino mass and the observation of left-handed neutrinos without their right-handed counterparts. In addition, the seesaw mechanism predicts neutrinos to be their own antiparticles, i.e., Majorana particles. Light Majorana neutrinos, along with their heavy partners, could be harbingers of leptogenesis as an explanation of the baryon-antibaryon imbalance Fukugita and Yanagida (1986); Davidson et al. (2008). Furthermore, the Majorana or Dirac nature of neutrinos directly impacts how their mass would be incorporated as extensions to the SM.
The question of the Majorana or Dirac nature of neutrinos and whether is violated is an experimental one; theory requires guidance from measurements. Since the answer is critical to many physics questions, searches for lepton number violation are extremely well motivated and a range of potential experimental probes exist. The most sensitive experimental test for lepton number violation and Majorana neutrinos is the search for neutrinoless double-beta () decay Haxton and Stephenson (1984); Davidson et al. (2008); Rodejohann (2011).
II.2. Neutrinoless Double-Beta Decay
Double-beta decay is a transition between nuclei of the same atomic mass number, , that changes the nuclear charge, , by two units through the emission of light particles. For nuclei close to the valley of stability with even numbers of both neutrons and protons, beta decays are often energetically forbidden or highly suppressed, leaving double-beta decay as the only potential decay mode. The transformation can occur by two-neutrino double-beta () decay,
| (1) |
conserving lepton number. This decay is allowed within the SM as a rare, second-order process and has been observed in 11 nuclei Barabash (2020). In contrast, decay,
| (2) |
violates lepton number by two units and is forbidden in standard electroweak theory. There have been a great number of reviews on the topic of decay over the years, and we refer the reader to Refs. Schwingenheuer (2013); Cremonesi (2013); Elliott and Franz (2015); Engel (2017); Henning (2016); Barabash (2019); Dolinski et al. (2019).
The two decay modes are distinguishable by the spectrum of the summed energies of the two outgoing electrons. For the decay mode, the summed electron kinetic energy is reduced by the total energy of the outgoing antineutrinos and therefore displays a continuous spectrum with a broad maximum around one third of the endpoint energy. In contrast, the decay mode exhibits a monoenergetic line at the decay value (), as the electrons carry the full available energy.
The decay mode can be mediated by various mechanisms. One requiring minimal new physics is the exchange of a light Majorana neutrino interacting via standard, left-handed V-A weak currents. The half-life () can be expressed as Cirigliano et al. (2018a)
| (3) |
where is the phase-space integral and is the axial-vector coupling constant. The nuclear matrix element is composed of Gamow-Teller (GT), Fermi (F) and tensor (T) components as follows:
| (4) |
is a recently identified contact operator that comes with its own hadronic coupling normalized by the pion mass Cirigliano et al. (2018b). The term is the effective Majorana neutrino mass that captures the physics of the light-neutrinos that mediate the decay. It is a coherent sum of the neutrino parameters:
| (5) |
where are the elements of the neutrino mixing matrix, which include the Dirac and Majorana CP-phases, and are the neutrino mass eigenvalues Zyla et al. (2020).
Figure 1 displays the range of as a function of the lightest neutrino mass : for normal ordering and for inverted ordering. The width of the bands is primarily due to the uncertainty on the Majorana phases, for which no experimental information is available.
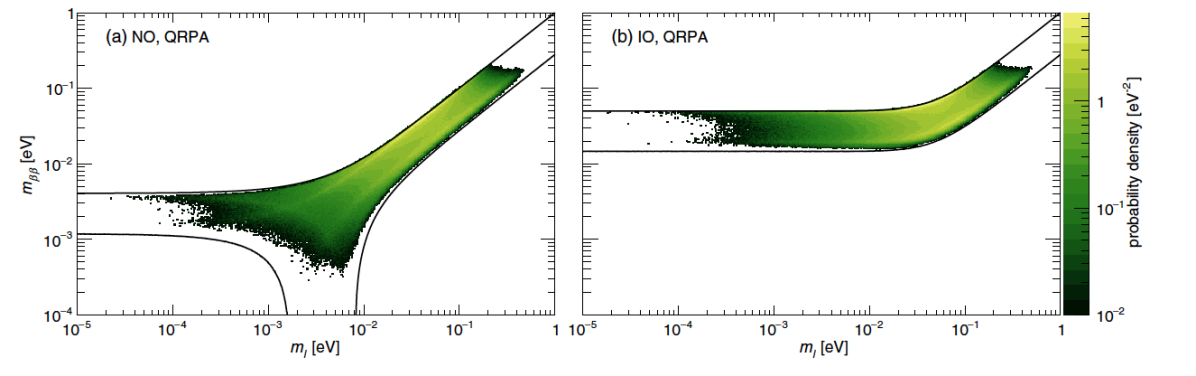
In the normal ordering, the unconstrained Majorana phases can conspire to give vanishing values of . However, in the inverted ordering, is constrained from below. Using the central values and uncertainties of the latest neutrino-oscillation data Zyla et al. (2020), the minimum value of for the inverted ordering corresponds to meV Agostini et al. (2021a).
II.3. Nuclear Physics Uncertainties
The conversion of an experimental decay half-life into a value for requires inputs from nuclear theory, as shown by Eqn. (3). The uncertainty in the phase space factor is small, and the two available calculations for Ge agree very well: /yr Kotila and Iachello (2012) and /yr Mirea et al. (2015). Conversely, state-of-the-art nuclear matrix element calculations can differ by more than a factor of two as shown in Table 1. A world-wide effort to reduce these uncertainties is ongoing within the nuclear theory community, with significant advancements made in recent years. While this effort bears fruit, following the recommendation by the U.S. Nuclear Science Advisory Committee’s subcommittee on neutrinoless double-beta decay McKeown et al. (2014), we continue to quote our sensitivity providing a range of values that extends from the conversion obtained with the largest and smallest matrix elements available among four primary calculation methods, using an unquenched value of 1.27 and no contribution from the contact term. Uncertainties associated with the possible quenching of the axial vector coupling and with the contact term are not explicitly included. Their impacts are discussed below.
| Framework | Nuclear Matrix Element Values () |
|---|---|
| Nuclear Shell Model | 3.37 - 3.57 Horoi and Neacsu (2016), 2.89 - 3.07 Menéndez (2018), 2.66 Coraggio et al. (2020) |
| Quasiparticle Random Phase Approximation | 5.09 Mustonen and Engel (2013), 5.26 Hyvärinen and Suhonen (2015), 4.85 Šimkovic et al. (2018), 3.12 - 3.40 Fang et al. (2018) |
| Interacting Boson Model | 4.68 Barea et al. (2015) |
| Energy Density Functional | 4.60 Rodriguez and Martinez-Pinedo (2010, 2013), 5.55 López Vaquero et al. (2013), 6.04 Song et al. (2017) |
| Range | 2.66 – 6.04 |
Quenching
It is well-known that in the case of single decay, many-body calculations yield decay rates that significantly exceed measurements, but this disagreement can be alleviated by “quenching” by roughly 25% Towner (1987). Equation (3) shows the overall 4 dependence on the decay rate, while Eqn. (4) shows its explicit factor in the Fermi matrix element contribution to . Simply scaling as 2, quenching would introduce a 40% effect on . Since the Fermi contribution is sizable, however, the values quoted by Refs. Šimkovic et al. (2013) and Hyvärinen and Suhonen (2015) for 76Ge, for example, are closer to 20–30%; for Ref. López Vaquero et al. (2013), the value is only a 10% effect. Since the decay rate depends on , a 25% quenched matrix element would alter the decay rate by about 44%.
Some authors have claimed that the quenching could be very large (see the summary in Ref. Ejiri and Suhonen (2015)) based on the fact that large quenching is seen in decay. Unlike decay, however, decay is a process that includes all multipoles of the intermediate states. Muon capture, which is similar in this regard, requires little if any quenching Suzuki et al. (2018); recent neutrino cross-section calculations also seem to not require quenching Lovato et al. (2020).
The theory is advancing, and investigations using effective field theory indicate that quenching in single decay likely arises from the combination of two-nucleon weak currents and strong correlations in the nucleus that are omitted in traditional calculations Pastore et al. (2018); Gysbers et al. (2019). New ab-initio calculations such as in Ref. Belley et al. (2021) attempt to explicitly include all of this typically omitted physics and indicate a suppression of in 76Ge indeed by about 25%, albeit with still large uncertainty. The picture is converging, and it is likely that this uncertainty can be resolved in the near future.
The contact term from effective field theory
It has recently been recognized that a leading order, short-range contribution has previously been ignored in calculations of decay transition operators Cirigliano et al. (2018b, 2019). This contact term represents the effects of heavy mesons and quark/gluon physics that can be excited by the exchanged neutrino when its energy is above about a GeV. Effective field theory and ab-initio nuclear structure provide a scheme for estimating how large the coefficient of such a term in the double-beta operator should be, and recent work in this direction Wirth et al. (2021) indicates that this term is potentially tens of percent of in magnitude with the same sign, leading to enhancement of the decay rate. This would offset some of the possible reduction in decay rate expected due to quenching. Lattice quantum-chromodynamics calculations are also being pursued to compute this essential contribution Davoudi et al. (2021).
II.4. Discovery Opportunities for Next Generation Experiments
There is no theoretical motivation to favor one neutrino mass ordering over another. Long-baseline neutrino experiments (NOvA Acero et al. (2019) and T2K Abe et al. (2020)) are currently the most sensitive probes we have to test the mass ordering. Their results had favored the normal ordering for a few years, but interpretations of their latest higher-statistics data sets are now pushing in the opposite direction Esteban et al. (2020); Kelly et al. (2021). Global fits that include long- and short-baseline data currently show a mild preference for normal ordering, but the statistical significance is too low to draw any conclusion at the moment Esteban et al. (2020); Capozzi et al. (2020); de Salas et al. (2021). It seems unlikely that the mass ordering will be established in this decade, before data from future experiments such as JUNO Lu (2021), KM3NeT Aiello et al. (2021), DUNE Abi et al. (2020), and Hyper-Kamiokande Abe et al. (2018) become available.
Future decay experiments probing values down to 18.4 meV will be able to test the inverted ordering parameter space Agostini et al. (2021a). Reaching such a sensitivity will offer exciting discovery opportunities even when assuming normal ordering. The current best bounds on are at the level of 160–180 meV assuming less favorable nuclear matrix element calculations. Reaching 18.4 meV means probing 80–90% of the currently allowed range for the normal ordering. Bayesian analyses Agostini et al. (2017a); Caldwell et al. (2017) have tried to quantify the discovery probability of future experiments using all experimental information available. The posterior distributions for and the lightest neutrino mass are typically not uniform (see Fig. 1). Low values are disfavored as they require a fine tuning of the Majorana phases whose values are random in many reasonable scenarios. This leads to discovery probabilities of up to 50% even when assuming the normal ordering. Moreover, cosmological data suggests non-vanishing discovery opportunities even assuming the less favorable combination of Majorana phases Agostini et al. (2021b).
A discovery of decay with an value close to the current experimental limits would also create discovery expectations for cosmology and tritium -decay experiments. Cosmological observations of the cosmic microwave background, baryon acoustic oscillations, and Lyman- forest are sensitive to neutrino properties, in particular to the sum of the neutrino mass eigenstates Lahav and Liddle (2019); Zyla et al. (2020). Precision measurements of the tritium -decay kinematics are instead sensitive to the incoherent sum of neutrino masses. Both mass quantities will be measured with increasing precision in the years to come, with the tritium -decay experiment KATRIN Aker et al. (2021) continuing data-taking, to be followed up by Project 8 Ashtari Esfahani et al. (2017), and planned cosmological observations Dvorkin et al. (2019) coming online. The three-Majorana-neutrino model predicts correlations among these quantities and , offering a unique opportunity to pin down the model parameters or prove the existence of additional decay mechanisms.
If one considers alternative mediation mechanisms beyond the light, left-handed neutrino exchange paradigm, the parameter space for discovery opens up considerably. The existence of a sterile neutrino, for example, could swap the order in which decay probes neutrino masses, with the normal ordering being potentially fully probed by ton-scale experiments and the inverted ordering allowing for vanishing decay rates Rodejohann (2011). For more general new physics, a “master formula” has been developed in Ref. Cirigliano et al. (2018a) for computing contributions to decay for Beyond-SM Lagrangian contributions up to dimension nine. In the case of the exchange of heavy particles, the decay rate scales generically as an inverse power of the energy scale at which new physics appears. From this perspective, any improvement in sensitivity in decay experiments probes ever higher energy scales. This includes energy scales that can be probed in complementary searches at particle colliders as well as energy scales that are not accessible by current accelerator technologies (see Ref. Peng et al. (2016)).
In addition to the crucial search for the lepton-number-violating decay, future decay experiments will have broad physics programs. The larger mass and lower backgrounds of LEGEND-1000 extends its reach for other Beyond Standard Model (BSM) searches well beyond that of the Majorana Demonstrator and Gerda experiments. Table 2 lists some of these other BSM physics accessible to LEGEND-1000. A potentially-significant background for these searches is 39Ar decay in the LAr, but this risk has been mitigated by the use of underground-sourced Ar. This brings the 39Ar background rate in LEGEND-1000 below 100 keV more than an order of magnitude lower than the background rate achieved in the Majorana Demonstrator.
| Physics | Signature | Energy | Experiment |
|---|---|---|---|
| Range | |||
| Bosonic dark matter | Peak at DM mass | MeV | MajoranaAbgrall et al. (2017a), Gerda Agostini et al. (2020a) |
| Electron decay | Peak at 11.8 keV | keV | Majorana Abgrall et al. (2017a) |
| Pauli exclusion principle violation | Peak at 10.6 keV | keV | Majorana Abgrall et al. (2017a) |
| Solar axions | Peaked spectra, daily modulation | keV | MajoranaAbgrall et al. (2017a); Xu and Elliott (2017) |
| Majoron emission | spectral distortion | Gerda Agostini et al. (2015a) | |
| Exotic fermions | spectral distortion | (proposed) Bolton et al. (2021); Agostini et al. (2021c) | |
| Lorentz violation | spectral distortion | (proposed) Díaz et al. (2013); Díaz (2014); Azzolini et al. (2019) | |
| Exotic currents in decay | spectral distortion | (proposed) Deppisch et al. (2020) | |
| Time-dependent decay rate | Modulation of spectrum | (proposed) Arnold et al. (2020) | |
| WIMP and related searches | Exponential excess, annual modulation | keV | CDEX Liu et al. (2019) |
| Baryon decay | Timing coincidence | MeV | Majorana Alvis et al. (2019a) |
| Fractionally charged cosmic-rays | Straight tracks | few keV | Majorana Alvis et al. (2018) |
| Fermionic dark matter | Nuclear recoil/deexcitation | few MeV | (proposed) Dror et al. (2020) |
| Inelastic boosted dark matter | Positron production | few MeV | (proposed) Ha et al. (2019) |
| BSM physics in Ar | Features in Ar veto spectrum | ECEC in 36Ar | Gerda Agostini et al. (2016a) |
The detection signatures of these new physics phenomena align well with the strengths of LEGEND-1000. New BSM particles such as dark matter WIMPs or axions could interact within the detectors, creating peaks in the energy spectrum or an accumulation of events at low energy. Exotic fermions and bosons could also be created by double-beta decays, deforming the energy distribution of the two electrons ejected by the nucleus Blum et al. (2018). Other BSM searches include electron decay Piscicchia et al. (2015) and fractionally charged cosmic-rays Graesser et al. (2021). LEGEND-1000 could also scrutinize the recently reported excess in the XENON1T low-energy electron recoil spectrum Aprile et al. (2020). These science opportunities complement the already exciting physics program of LEGEND-1000.
II.5. The Worldwide Program in Experimental Decay
At the end of the past century, the decay panorama was defined by the Heidelberg-Moscow Klapdor-Kleingrothaus et al. (2001) and IGEX Aalseth et al. (2002) experiments, both of which used high-purity Ge detectors made from material isotopically enriched in 76Ge to around 86%. Finding no signal, these two experiments set leading limits on the decay half-life. While part of the Heidelberg-Moscow collaboration Klapdor-Kleingrothaus et al. (2004) later claimed evidence for a signal, there were various inconsistencies in the methodology Schwingenheuer (2013), and the claim is now refuted by present experiments. In the initial decade of the new century, CUORICINO Andreotti et al. (2011) and NEMO-3 Arnold et al. (2015) provided bounds on the half-lives of new isotopes: 130Te, 100Mo, and 82Se. Although the results were no more restrictive than the previous Ge experiments, they were harbingers of technology to come. CUORICINO was the precursor of the CUORE and CUPID programs, and NEMO-3 developed a technique to study the various kinematic variables in decay.
At present, the landscape is shaped by the results of five experiments. The Gerda Agostini et al. (2020b), Majorana Demonstrator Aalseth et al. (2018a); Alvis et al. (2019b), EXO-200 Anton et al. (2019), KamLAND-Zen Gando et al. (2016) and CUORE Adams et al. (2020, 2021) experiments provide the strongest constraints on decay. Gerda, located at the Laboratori Nazionali del Gran Sasso (LNGS) in Italy, operated an array of high-purity Ge detectors enriched in the isotope 76Ge, immersed in a LAr active shield (see Sect. III.III.2). Similarly, the Majorana Demonstrator, located at the Sanford Underground Research Facility (SURF) in the USA, investigated the decay of 76Ge with a Ge detector array deployed in vacuum cryostats with shielding produced from ultra-pure Cu and Pb (see Sect. III.III.3). The EXO-200 experiment, located at the Waste Isolation Pilot Plant facility in the USA, operated a liquid Xe time-projection-chamber (TPC) enriched in the isotope 136Xe. KamLAND-Zen, located in the Kamioka mine in Japan, is a conversion of the neutrino experiment KamLAND into an apparatus capable of studying decay by dissolving enriched Xe gas in organic scintillator. CUORE, located at LNGS, searches for the decay of 130Te. CUORE operates an array of natural isotopic abundance TeO2 bolometers at 10 mK in a specially designed cryostat.
| Experiment | Isotope | Exposure kg-yr | 1025 yr | meV |
|---|---|---|---|---|
| Gerda Agostini et al. (2020b) | 76Ge | 127.2 | 18 | |
| Majorana Alvis et al. (2019b) | 76Ge | 26 | 2.7 | |
| KamLAND-Zen Gando et al. (2016) | 136Xe | 594 | 10.7 | |
| EXO-200 Anton et al. (2019) | 136Xe | 234.1 | 3.5 | |
| CUORE Adams et al. (2021) | 130Te | 1038.4 | 2.2 |
These five experiments explored the quasi-degenerate neutrino mass spectrum with no evidence for a positive signal, and Table 3 shows their most recent results. The lower limits on can be converted to upper limits on assuming light neutrino exchange as the dominant mechanism (see Eqn. (3)). In Table 3 the upper limits on quoted were derived by the collaborations. There is some uniformity in their respective derivations, as choices of the values for = 1.27, the phase space factors Kotila and Iachello (2012), and the set of nuclear matrix elements (discussed in a recent review Engel (2017)) are fairly standard.
The next-generation of decay experiments aims to probe the inverted mass ordering Agostini et al. (2021a); Adhikari et al. (2021); Armstrong et al. (2019). It is clear from Table 3 that 76Ge experiments reach competitive sensitivities with much smaller exposures than the other technologies. This competitiveness derives from Ge-based experiments’ high detection efficiency, excellent energy resolution, and operation in a quasi-background-free regime. As a result, experiments using 76Ge have been historically impactful in decay Avignone and Elliott (2019); a past timeline of Ge experiments and future projections for LEGEND are shown in Fig. 2.
III. Innovation Toward LEGEND-1000
LEGEND-1000 combines the fundamental strengths of Ge-based decay searches with significant innovations in Ge-detector technology, active shielding, clean materials, and high-resolution electronics developed and demonstrated by members of the Gerda, Majorana, and LEGEND-200 experiments. The LEGEND collaboration was formed to bring together the technical expertise and leadership from both the Majorana and Gerda collaborations, as well as add new members to strengthen core capabilities. Its members bring a broad range of deep technical expertise and a history of innovation developed through the design and operation of the Majorana Demonstrator, Gerda, and LEGEND-200 experiments. The existing strengths of Ge detectors, described next, provide a basis for their competitive standing in the search for decay; technical advancements have resulted in larger detectors with better energy resolution, operating within a scintillating medium for enhanced background suppression, cleaner materials, and low-noise electronics to expand the overall reach of the technology.
III.1. Ge Detectors and Decay Searches
Germanium detectors have many advantages that make them well suited for decay searches. As a result, they have historically provided some of the most sensitive limits on this process Avignone and Elliott (2019). The excellent energy resolution of Ge detectors is of paramount importance for a decay search, as energy is the only observable that is truly both necessary and sufficient for a discovery. In addition, Ge detectors are essentially solid-state TPCs, allowing for accurate event reconstruction and a clear topological discrimination between background and signal events through pulse shape discrimination (PSD) techniques.
The crystal-growth process for Ge material provides a significant purification step resulting in unmeasurably low levels of internal 238U- and 232Th-chain contaminants. The solid crystal bulk is not at risk of being contaminated during handling and requires no further purification in situ. Ge detectors are also mostly insensitive to surface activity, and the cryogenic requirements for operating at LN2 temperatures are modest. The Majorana and Gerda collaborations pioneered the deployment of Ge detectors in strings with minimal interstitial mass and shared shielding and cooling infrastructure (see Fig. 3), leading to orders-of-magnitude background reduction with respect to previous-generation searches.


Germanium provides excellent discovery power, even for relatively small exposures compared to other isotopes. Although the lower atomic number and of 76Ge give it a phase-space factor that is relatively modest compared with other isotopes, most of the precious target isotope is operated in a quasi-background-free111Quasi-background-free refers to background expectation values with high probability to observe less than one background count in the region of interest within the dataset. In this case, the sensitivity scales almost linearly with exposure. environment and is not used for self shielding as in other experiments. The detection efficiency is hence very high, and nearly all the decay material contributes to the sensitivity.
The Majorana and Gerda collaborations have accumulated extensive experience in Ge crystal and detector usage. The two collaborations independently worked with vendors to utilize novel Ge-detector designs optimized for decay searches (see Fig. 4). Majorana used p-type, point-contact (PPC) detectors, based on the original design of Ref. Luke et al. (1989), produced by ORTEC222AMETEK-ORTEC, Oak Ridge, TN, USA. https://www.ortec-online.com/. In collaboration with Mirion333Mirion Technologies, Olen, Belgium. https://www.mirion.com/, Gerda used a customized version444Commercial BEGe detectors have the top n+ surface ground off to allow better detection of low-energy rays in a vacuum cryostat. The customized version retains the n+ contact wrapped around the whole detector. of broad-energy Ge (BEGe) detectors Agostini et al. (2015b), which share the point-contact characteristics of the ORTEC PPC detectors. Both detector geometries exhibited outstanding energy resolution and advanced capabilities to reconstruct the event topology. However, constrained by the electrode geometry, the maximum detector masses were limited to around 1 kg.
A major breakthrough for LEGEND has been the invention of the p-type inverted-coaxial point-contact (ICPC) detectors Cooper et al. (2011). These devices maintain the excellent energy and event reconstruction performance of PPC and BEGe detectors but are significantly larger, with typical masses around 2–3 kg. The increased detector size allows the overall number of detectors operated in LEGEND to be reduced by a factor of three, also reducing by the same factor the number of cables, read-out channels, and detector support materials that are all sources of background. The reduction of the surface-to-volume ratio also helps in mitigating the background due to radioactive decays on the detector surfaces.
The ICPC detectors were successfully deployed and operated in both Gerda and the Majorana Demonstrator. Gerda’s five enriched ICPC detectors were fabricated in 2018 by Mirion and ran in Gerda from July 2018 until November 2019. With an average mass of 1.8 kg each, the ICPC detectors contributed to the Gerda -decay analysis with 8.5 kg yr of high-quality data. These detectors demonstrated excellent energy resolution, lower surface contamination compared to the other Gerda detectors, and the lowest background level ever achieved in Gerda: cts/(keV kg yr) Agostini et al. (2021d). After analysis cuts, not a single high energy alpha-decay event was left in the ICPC dataset while keeping the same cut efficiencies. The four enriched ICPC detectors deployed in the Majorana Demonstrator were fabricated in 2019–2020 by ORTEC and ran from August 2020 to March 2021. These detectors showed an exquisite combined energy resolution of 2.4 keV FWHM at . More details on ICPC detector performance can be found in Sect. IV.IV.1.IV.1.2.
III.2. LAr Scintillation and Gerda
The Gerda experiment, located at LNGS, pioneered the operation of bare enriched Ge detectors in LAr, serving simultaneously as radiation shield, coolant, and scintillation detector. Exploiting the entire space-time signal topology in the novel Ge- and LAr-detector systems enabled the Gerda Collaboration to distinguish background from decay signal candidate events with unprecedented efficiency. This breakthrough experimental technology opened the path towards quasi-background-free searches for decay of 76Ge.
The Gerda experiment operated an array of 20 kg of enriched Mirion, custom-designed BEGe detectors and 15.6 kg of enriched semi-coaxial detectors. In the last year of data taking, the Gerda collaboration deployed 9.6 kg of the novel ICPC detectors to verify their technical maturity for LEGEND. The LAr detector consists of a wavelength shifting fiber barrel that surrounds the Ge-detector strings. The fibers convert Ar 128 nm scintillation photons into green photons, which are guided to silicon photomultipliers (SiPMs) attached at the ends of the fibers. Single photo-electron resolution was observed, allowing the rejection of events with greater than photo-electrons in the LAr detector within 5 s of a Ge-detector signal. Figure 5 shows the wavelength shifting fiber barrel coupled to low-background SiPM arrays. The right panel demonstrates how the selection of events that are not associated with LAr scintillation light creates an almost pure sample of decay events which have the same topology as the sought-after decay signal.
The Gerda background model before analysis cuts is shown in Fig. 6. The model is able to accurately describe all features observed in the data set and is based on a comprehensive multivariate fit in which events are divided by detector and the number of detectors hit (multiplicity). The fit results are in good agreement with assay expectations, showing how Ge-based experiments can accurately make background projections. The most prominent spectral features are the cluster of events at 5.2 MeV tailing to lower energies. These are due to 210Po decays on the surface of the Ge-detector p+ electrode. The lines are due to radionuclides in the 232Th- and 238U-decay chains (e.g., 228Ac, 212Bi, 208Tl and 214Bi), and 40K and 42K (a progeny of 42Ar). At low energies the strong signal from decays is dominant. According to the background model, the dominant background contributions originate from materials close to the detectors.
Gerda Phase II completed data taking in 2019. Its full data set is displayed in Fig. 7. Due to the complementarity of the LAr scintillation light detection and the event topology reconstruction of Ge detectors, Gerda achieved the world-leading background index of cts/(keV kg yr) Agostini et al. (2020b) with an average FWHM energy resolution of 2.6 keV for the BEGe detectors and 2.9 keV for the ICPC detectors. Gerda was the first experiment to reach a half-life sensitivity above years. With only 127.2 kg yr of exposure (Phase I + II), Gerda set a lower limit at yr ( CL) Agostini et al. (2020b).
III.3. Materials, Electronics, and the Majorana Demonstrator
The Majorana Demonstrator experiment, located at SURF, operated an array of 30 kg of enriched ORTEC PPC detectors, split between two vacuum-insulated cryostats housed within a low-background shield. The Majorana Demonstrator Collaboration developed low-noise electronics to improve energy resolution and developed clean materials to reduce internal component backgrounds. One key innovation was the development of underground electroformed Cu (EFCu), shown in Fig. 8 and described in Sect. V.V.2.V.2.1, in which one obtains the purest commercial Cu available and then re-forms it underground. This eliminates cosmogenic activation species like 60Co while rejecting bulk 238U/232Th-chain natural radioactivity by a factor of approximately 30, achieving radiopurities below 0.1 Bq/kg Abgrall et al. (2016). This ultra-pure Cu served as the primary structural material inside the array. It was also used to fabricate the cryostats and the innermost passive shield layer. A number of other novel ultra-pure materials and components were developed for the Majorana Demonstrator, including clean dielectrics, cables, connectors, and coatings Abgrall et al. (2016).
Another key development was the Majorana Demonstrator low-mass front-end (LMFE) electronics board (see Fig. 8). In addition to being highly radiopure, the LMFE achieved extremely low noise levels, contributing a negligible 0.1 keV (FWHM) to the energy resolution. This allowed the Majorana Demonstrator to achieve a record energy resolution for large-scale decay experiments of keV () FWHM at when combining all detectors Alvis et al. (2019b)


Figure 9 shows the experiment’s latest reported background spectrum. The Majorana Demonstrator achieved a background rate of cts/(keV kg yr) Alvis et al. (2019b) in its low-background configuration.555Note that Majorana and Gerda use different conventions to derive their respective background indices. Gerda uses the full detector mass and an energy window of 1930–2190 keV whereas Majorana takes into account the active volume fraction and uses a 1950–2350 keV range. The LEGEND-1000 background projections given in Sect. V.V.4 use the full detector mass and an energy window of 1985–2095 keV centered around . According to background model spectral fits, and supported by studies of relative peak intensities and coincident events, the major background contributor is 208Tl outside the immediate vicinity of the detectors Buuck (2019); Gilliss (2019).
During a hardware upgrade in 2020, five of the PPC detectors were removed for testing in LAr in advance of their use in LEGEND-200. At the same time, four of the ORTEC enriched ICPC detectors destined for LEGEND-200 were installed in the Majorana Demonstrator for characterization in a low-background vacuum environment. All ICPC detectors exhibited excellent PSD performance and energy resolution. The experiment has completed data taking with enriched detectors and is currently taking data with only natural detectors.
III.4. LEGEND-200
The LEGEND-200 experiment is planning to operate 200 kg of Ge detectors in a bath of LAr in an upgrade of the Gerda infrastructure at LNGS. The LEGEND-200 design combines the best elements of Gerda and the Majorana Demonstrator, implementing many of the improvements envisioned for LEGEND-1000. LEGEND-200 uses the existing 70 kg of enriched detectors from the Majorana Demonstrator and Gerda and an additional 130 kg of newly produced ICPC detectors. LEGEND-200 is currently under construction and is expected to start commissioning in the fall of 2021. The Ge- and LAr-detector systems and the setup are illustrated in Fig. 10.
LEGEND-200 is an integral part of the strategic, staged approach pursued by the LEGEND Collaboration. The design of LEGEND-200 integrates many of the key ideas that will remain in LEGEND-1000; the ICPC Ge detectors, the LAr instrumentation, the holders, and many other components and subsystems are very similar to what we propose for LEGEND-1000. LEGEND-200 is a timely and concrete opportunity to integrate the best elements of Gerda and the Majorana Demonstrator and to test them before finalizing the LEGEND-1000 baseline design proposed in this report.
LEGEND-200 will continue to be an asset during the design and construction phases of LEGEND-1000. The detector system of LEGEND-200 following the design of Gerda, can be lifted and lowered into the cryostat in just a few days. Technology improvements can hence be installed and tested in LEGEND-200 as soon as they become available. LEGEND-200 thus acts as a unique test-stand to refine our technological solutions in an ultra-low-background environment extremely similar to the final one. The background data collected will also be used to further validate our simulations, inform our design choices, and reduce risk for LEGEND-1000.
Until LEGEND-1000 comes online, LEGEND-200 will be one of the leading experiments in the field, reaching a half-life sensitivity of yr after five years of operations. To remain quasi-background-free for the design exposure of 1 t yr, LEGEND-200 requires the reduction of background by a modest factor of 2.5 with respect to what has already been achieved by Gerda. This improvement is easily obtained due to:
-
•
The larger average detector mass, resulting in fewer nearby components, cables, and holder materials per kilogram of detector
-
•
The adoption of Majorana Demonstrator-style low-noise electronics, low-mass components, and clean materials with a lower level of radioimpurities (e.g., electroformed copper) as well as the incorporation of scintillating plastic components to minimize the inactive material around the detectors
-
•
An improved design for the scintillation light readout and higher-purity LAr with better light transmission and light yield
The additional 20-fold background reduction anticipated for LEGEND-1000 with respect to LEGEND-200 is obtained primarily by the usage of underground-sourced Ar, new less-radioactive electronics and cables, and the presence of only ICPC detectors. These aspects are discussed in depth in the following sections.
LEGEND-200
IV. The LEGEND-1000 Approach
The LEGEND-1000 discovery power manifests as a signal visible to the eye, appearing as an isolated peak at on a flat, featureless background continuum, with no expected peaks nearby. The signal extraction will not be affected by background modeling uncertainties, maximizing the confidence that the signal is due to the sought-after decay. Figure 11 illustrates the detection capability of LEGEND-1000 through an example Monte Carlo dataset generated assuming 10 years of data taking and a decay signal of yr. The decay spectrum and all other expected backgrounds are derived from the comprehensive LEGEND-1000 background model, which has been tuned using data from Gerda and the Majorana Demonstrator. The expected number of background events within the 2.5-keV FWHM signal peak with 10 t yr of exposure is projected to be fewer than 0.25 counts and is easily constrained from the sidebands. This allows for even a simple analysis based on counting statistics alone to yield unambiguous detection with just a handful of counts.
In this section, we describe the baseline design concept of LEGEND-1000, the signal detection capabilities of its ICPC detectors, the experiment’s active background tagging techniques, and their application to expected LEGEND-1000 background sources, all of which culminate in a 99.7% CL discovery sensitivity666A 50% chance of measuring a signal of at least 3 significance. for of years.
IV.1. Conceptual Overview
IV.1.1. Baseline Design
The LEGEND-1000 baseline technical design is centered around the demonstrated low background and excellent energy performance of p-type, point-contact, high-purity Ge semiconductor detectors, enriched in 76Ge and operated in LAr. The innovative ICPC Ge-detector geometry was developed to boost the experimental sensitivity and maximize synergy with the LAr scintillation light detection. Combined with the LEGEND-200 ICPC detectors, approximately 400 individual ICPC detectors with an average mass of 2.6 kg are instrumented for a total detector mass of 1000 kg. The detectors are mounted using underground electroformed Cu rods for physical support, with electrical isolation provided via plastic insulators. Below each detector is a baseplate supporting a wire-bonded signal cable and front-end application-specific integrated circuit (ASIC) board to collect charges at the detector’s p+ electrode. From there, flat flex cables carry the amplified signals out of the cryostat and water tank to a data-acquisition (DAQ) system for waveform digitization and offline storage. A separate, single-conductor, flat flex cable wire-bonded to the detector’s n+ electrode provides a high-voltage bias to deplete the Ge semiconductor.
The signal/background discrimination power of ICPC detectors begins with their superior energy resolution, demonstrated to be 0.12% FWHM (0.05% ) at , making decays a completely negligible background for LEGEND-1000. Beyond the tight energy response, additional event-topology information offers strong discrimination against background events with energy close to . Pulse shapes provide information on the interaction-site multiplicity, the interaction-site location, and the presence of any delayed-charge collection, allowing the prompt, single-site signature from bulk decay energy depositions to be easily distinguished from multiply-interacting rays, decays on the surfaces of the detectors, and other backgrounds. The granular nature of the Ge detector array and its immersion within an active LAr scintillating volume offers a pixelation of the setup that provides additional strong discrimination between decay signal events, which are isolated to a single Ge detector, and backgrounds generating coincident events in multiple regions. LEGEND’s PSD and anti-coincidence techniques and their background discrimination performance are described in greater detail in Sect. V.V.3.V.3.2.
The Ge detectors are distributed among four independently operating 250-kg modules to allow commissioning of the array in stages (see Fig. 12). In each module, the detector strings are immersed in UGLAr sourced from radiopure underground Ar to provide direct reduction of the primary background source observed in Gerda. LAr scintillation light is read out by a curtain of wavelength-shifting (WLS) polystyrene fibers. The TPB (tetraphenyl butadiene) coated fibers are coupled to SiPM photodetectors, which provide single photo-electron detection capabilities. Each of the four UGLAr modules is surrounded by atmospheric-sourced LAr, with additional light collection, and supported within a vacuum-insulated cryostat, itself inside a water tank providing infrastructure and additional active and passive shielding.
Installation in the SNOLAB cryopit is assumed (see Sect. VI.VI.2.VI.2.1). This reference cavity is used for cosmogenic background estimation, the cryostat conceptual design, and infrastructure needs. The impact of the design and background contribution at shallower depths is described starting in Sect. VI.VI.2.VI.2.2. Further details of the LEGEND-1000 technical design are given in Sect. V.V.1. Descriptions of LEGEND-1000’s unique materials are given in Sect. V.V.2.V.2.1.
IV.1.2. Energy Resolution
The excellent energy resolution of Ge detectors—the best of any ton-scale decay detection technology—provides high discovery sensitivity with negligible background contribution from irreducible decays and no lines in the region of interest. Majorana and Gerda achieved an average energy resolution at of 2.53 keV Alvis et al. (2019b) and 2.6 keV Agostini et al. (2020b) (FWHM), respectively, with PPC and BEGe detectors operated over multi-year periods of data taking. Figure 11 (right) shows how and decay events are fully separated with this energy resolution. Fewer than decay events are expected at the region of interest (ROI) of the full LEGEND-1000 dataset. This is the lowest rate expected by any decay experiment and gives LEGEND-1000 effectively double the sensitivity Agostini et al. (2017a) with respect to experiments in which a roughly exponentially falling tail of decay events leaks across the decay ROI.
The transition to the larger ICPC detector for both LEGEND-200 and LEGEND-1000 preserves the excellent energy resolution of the PPC and BEGe detectors. The performance of ICPC detectors has been demonstrated several ways. Nine ICPC detectors from two different detector vendors were deployed toward the end of the Gerda and Majorana Demonstrator operational periods. In addition, we have characterized the delivered LEGEND-200 ICPC detectors in their vendor cryostats. As shown in Fig. 13, the first 75.9 kg of detectors characterized in their vendor cryostats has a mass-weighted average energy resolution of 2.19 keV at 2039 keV (0.11% FWHM, 0.05% ). The in situ tests in Gerda and the Majorana Demonstrator revealed no significant degradation. The increased detector mass does not affect the energy resolution as shown in Fig. 14 (left), leaving open the possibility to further increase the average detector mass in the future.
In addition to the excellent energy resolution, a Ge detector’s peak shape is well understood. The peak shape is modeled as the sum of a full-energy Gaussian component and an exponentially modified Gaussian tail to approximate the peak shape distortion due to incomplete charge collection. A linear step-like flat background is included on either side of the peak. An example fit to a 2615-keV 208Tl peak in an ICPC Ge detector from calibration data is shown in Fig. 14 (right); additional examples of the consistent peak shape fits from the Majorana Demonstrator and Gerda detectors can be found in Refs. Alvis et al. (2019b) and Agostini et al. (2021e), respectively.
IV.1.3. Multivariate Event Topology Discrimination
The decay events are inherently single-site, monoenergetic events occurring within the bulk of a single Ge detector, whereas many background events have larger spatial distributions. Extracting topological information about the spatial distribution of an event allows additional background discrimination over a simple energy measurement and builds confidence in a possible observation (Sect. IV.IV.2.IV.2.2). A number of such topological observables have been fully developed and implemented successfully in both Gerda and the Majorana Demonstrator. They include the following:
- Pulse-Shape Information
-
Interaction Site Multiplicity
ICPC Ge detectors are in essence solid-state TPCs, with the signal fidelity to identify the drift and arrival of distinct ionization clouds at the point contact. A simple application of this capability is to count the number of distinct ionization sites in an event. This allows for the discrimination of single-site decay signals that deposit all their energy within approximately 1 mm from multiple-site backgrounds like rays, scattering sites for which can be 1 cm apart.
Interaction Localization
The shape of the signal induced during ionization drift carries additional information that can help isolate the event location. A simple application of this capability is discriminating the varying drift signals throughout the detector bulk that would be exhibited by decay events from distinct drift signals due to ionization from background events originating on the detector surfaces.
Delayed Charge Collection
decay events are generated throughout the detector bulk with effectively 100% of the ionization collected promptly. Events with significant charge collection at delayed times, e.g., due to backgrounds generating ionization on or near surfaces with significant charge trapping and/or low drift fields, can be easily discriminated from signal events and removed.
- Event Coincidences
-
Ge Multiplicity
The granularity of the Ge detector array configuration allows the discrimination of single-hit decay events from background events, such as scattered rays with simultaneous energy deposition in more than one Ge detector. It can also be used to identify coincident rays indicating decays to excited states, serving effectively as a daughter nucleus tag.
LAr Scintillation
Embedding the Ge-detector array in a LAr active medium allows for the identification of simultaneous interactions occurring outside of the detectors, such as scattered rays. scintillation in LEGEND-1000 over previous phases.
Muon Veto
The water tank surrounding the LAr is instrumented with photomultiplier tubes (PMTs) to act as a water Cherenkov muon veto. This allows for additional muon-shower identification than that provided by the LAr shield to tag in situ radioisotope production.
- Timing Information
-
In a LEGEND ICPC detector, charge begins to drift and generate a signal immediately after the decay. For a high-energy signal like decay, this drift generates a measurable voltage change of the analog-to-digital converter (ADC) within just one or two clock ticks, allowing for unambiguous and precise determination of event times. This allows additional analysis handles:
Event-Time Distribution
A decay signal has a uniform time distribution as opposed to, e.g., exponentially decaying backgrounds or other sources with rates that vary during data taking.
Delayed Coincidences
decay has no progenitor event and is unaccompanied by delayed de-excitations or daughter decays. Searches for events in delayed coincidence with decay candidates (either as the prompt or delayed event) can thus help discriminate between a decay signal and backgrounds, e.g., from cosmogenic 68Ge decay sequences, Bi-Po coincidences from Rn progeny, and cosmic-ray-induced activation products.
LEGEND-1000 uses a multivariate analysis incorporating all of these observables to identify and constrain not just signal events but also the nature and sources of the backgrounds that are observed in the actual experiment. Owing to the clear separation of signal and background in the multivariate parameter space, Gerda and the Majorana Demonstrator have often applied discrete cuts on these observables (see Fig. 15). For simplicity, we adopt this historical approach throughout the remainder of this document and will refer to the following two cuts:
- Anti-Coincidence (AC) Cut
-
Events producing energy depositions in multiple Ge detectors (granularity cut), generating scintillation in the LAr volume (LAr veto cut), or creating Cherenkov light in the water tank (muon veto cut) are flagged as background and removed.
- Pulse Shape Discrimination (PSD) Cut
-
Events with waveforms indicative either of multiple energy depositions within a single Ge detector or of charge collection associated with surface events are flagged as background and removed.
IV.1.4. Projected Backgrounds
We have estimated the expected background rate in the baseline design of LEGEND-1000 through a comprehensive Monte Carlo simulation campaign, relying on the extensive radiopurity assays of selected materials, proven active background suppression through a LAr active veto, PSD capabilities of ICPC Ge detectors, opportunities afforded by such new capabilities as UGLAr, larger detectors, and new readout electronics development. The anticipated background rate at is cts/(keV kg yr), consistent with our background goal of less than cts/(keV kg yr). Here we summarize the major sources of backgrounds, their impact, and background reduction improvements expected for LEGEND-1000:
- 238U and 232Th Decay Chains
-
Decays of long-lived radioisotopes 238U and 232Th—as well as their shorter-lived progeny in array components—have been simulated for the LEGEND-1000 array. The simulations assume secular equilibrium of the decay chains, however, more direct assay information is used to set the activities of the relevant sub-chains (see Sect. V) The decays of 214Bi and 208Tl, both emitting rays with energies in excess of the 2039-keV value for decay in 76Ge, are of primary concern; however, the LAr veto is highly effective in rejecting Compton scatters from these rays. Backgrounds from the 238U- and 232Th-decay chains before analysis cuts are reduced compared with Gerda by factors of 19 and 3.6, respectively, as a result of the following background reduction measures:
-
1.
Lower-background Kapton flex cables: 12 reduction in 238U and 13 reduction in 232Th activity per channel compared with the Majorana Demonstrator cables; 75 reduction in 238U, and 68 reduction in 232Th activity per channel compared with the Gerda cables Agostini et al. (2020c), based on recent developments isolating the sources of contamination in the production process reported in Ref. Arnquist et al. (2020a).
-
2.
Adoption of ASIC-based front-end electronics: 7 reduction in 238U and 75 reduction in 232Th activity per channel compared with the Majorana Demonstrator LMFE Abgrall et al. (2016), based on the ASIC chip activity reported in Ref. Edzards et al. (2020) and direct mounting of ASIC chips on Kapton laminate signal cables (see Sect. V.V.1.V.1.6). Additionally, this choice eliminates charge-sensitive amplifiers mounted near detectors.
-
3.
Reduced front-end substrate and connector mass: 7 reduction in the plastic mass at both the signal cable bonding point, enabled by the adoption of a ASIC-based front end chip, and the high-voltage cable bonding point, enabled by the adoption of Kapton flat-flex cable.
-
4.
Elimination of nylon mini-shrouds: Use of UGLAr eliminates the need for nylon shrouds used in Gerda to limit the drift of 42K ions to detector surfaces (See item 42K in LAr below).
-
5.
Lower array packing density: The circular string arrangement and increased spacing between detectors reduces the solid angle from -ray sources.
-
1.
- 42K in LAr
-
Atmospheric Ar contains two long-lived radioisotopes, 39Ar and 42Ar, the latter of which is a background for decay searches through its decay to 42K, which can drift in electric fields to detector surfaces and subsequently decay with a value of 3525 keV. The use of UGLAr near the arrays is expected to strongly reduce this background. Because of the large uncertainty in the 42Ar content of UGLAr, we have estimated its activity conservatively. Still, this approach represents a reduction in this source of background. See Sect. V.V.4.V.4.4 for more details.
- Alpha Decays on Detector Surfaces
-
Alpha particles originating in decays on the detector’s thin p+ electrode and passivated insulating surfaces can lose sufficient energy to be a source of background at 2039 keV, while alphas impacting the thick n+ contacts are effectively stopped. PSD is particularly effective at rejecting these surface events based on the fast (p+) or delayed arrival of charge (passivated). The areas of these sensitive surfaces are largely independent of detector mass, and the 2.6 kg ICPC detectors used in LEGEND-1000 have a mass larger than that of the BEGe detectors used in Gerda; this directly translates to a reduction in alpha backgrounds before cuts.
- Cosmogenics
-
The cosmogenic isotopes 68Ge and 60Co are produced by exposure of Ge to cosmic-ray-produced neutrons, and they decay within enriched detectors with values in excess of the 76Ge . Backgrounds from 68Ge ( days), averaged over a 10-year operational lifetime, are projected to increase in LEGEND-1000 as compared with Gerda; the reason is the two-year projected underground cool-down period for the LEGEND detectors prior to the start of data-taking as opposed to the roughly four-year cool down of the Gerda BEGe detectors. The in situ production of muon-induced 77Ge and Ge backgrounds contributes to the cosmogenics backgrounds but to a lesser extent at the SNOLAB reference depth.
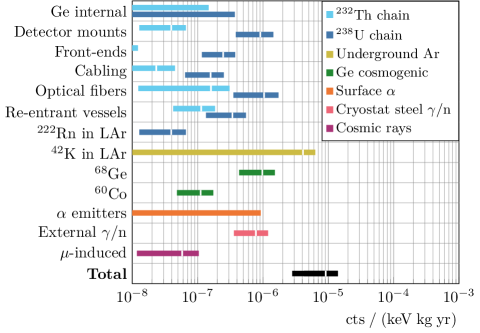
The projected background index in the LEGEND-1000 experiment prior to analysis cuts is cts/(keV kg yr), and its components are compared to the levels achieved in Gerda in Fig. 16. The effectiveness of the anti-coincidence and PSD cuts for each component is shown in Fig. 17 and compared with the values observed for the Gerda ICPCs. The background index prior to cuts corresponds to a factor of six reduction over Gerda, but the composition of the background is very different: the before-cuts LEGEND-1000 background is dominated by components that are strongly rejected by one cut but not the other, while the Gerda background index is dominated by 238U whose efficient rejection requires the application of both cuts. LEGEND-1000 also benefits from improvements in light collection due to an increased spacing between detectors, the reduction of inactive material near the detectors, inner and outer fiber shrouds, and SiPMs with an improved quantum efficiency, which enhances the AC cut performance. The total rejection factor is thus expected to be more than a factor of five stronger in LEGEND-1000 over what was achieved in Gerda ICPCs and a full factor of 10 over the average suppression factor achieved for all Gerda detectors.
A summation of all non-negligible backgrounds expected in LEGEND-1000 is shown in Fig. 18; we estimate a final background index of cts/(keV kg yr) in LEGEND-1000. At an energy resolution of 2.5 keV FWHM, an equivalent a background rate of cts/(FWHM t yr) is consistent with the stated LEGEND-1000 background goal of less than cts/(FWHM t yr). A detailed treatment of the analysis methods is given in Sect. V.V.3 and greater details on the background contributions in Sect. V.V.4.
IV.2. Discovery Potential
IV.2.1. Discovery Sensitivity
The sensitivity to a decay signal as a function of exposure and background is shown in Fig. 19 separately for a 90% CL exclusion sensitivity and for a 99.7% CL discovery sensitivity. The exclusion sensitivity is defined as the median half-life value that will be excluded assuming there is no signal, while the discovery sensitivity gives the half-life value at which there is a 50% chance of a 3 discovery. The calculation assumes a total signal efficiency of 69%, accounting for the enrichment level, analysis cuts, active volume fraction, and containment efficiency for decay events to have their full energy deposited within a crystal’s active volume. If an experiment background is zero, both the discovery sensitivity and the limit sensitivity scale linearly with the exposure, whereas in the background-dominated regime both sensitivities scale with the square root of exposure. The transition between these two regimes is governed by Poisson statistics and is computed using the approximation outlined in Ref. Agostini et al. (2017a). We neglect background uncertainty under the assumption that it is well constrained from energy side bands. For signal discovery, a low background is especially important because as the expected number of background counts increases, the signal level required to obtain a 3 excess grows rapidly.
LEGEND’s staged approach provides a low-risk path to world-leading sensitivity. The initial LEGEND-200 phase should easily achieve a modest background improvement over Gerda with a background index of cts/(keV kg yr) or 0.5 cts/(FWHM t yr) at . With this background level, LEGEND-200 reaches a 3 discovery sensitivity of yr with an exposure of only 1 t yr within five years. Using a nuclear matrix element range of 2.66 to 6.04 for 76Ge (see Table 1), a phase space factor of /yr Kotila and Iachello (2012) (consistent with /yr of Ref. Mirea et al. (2015)), and a value of =1.27, the LEGEND-200 discovery sensitivity corresponds to an upper limit in the range of meV.
LEGEND’s ultimate goal is to achieve 3 discovery sensitivity covering the full parameter space remaining for the inverted neutrino mass ordering, under the assumption of light left-handed neutrino exchange as the dominant mechanism. As described previously, the LEGEND-1000 experiment should achieve a higher signal/background discrimination than the present generation experiments. The background goal for LEGEND-1000 is a background index of less than cts/(keV kg yr) or less than cts/(FWHM t yr). At this background level, LEGEND-1000 reaches a half-life discovery sensitivity of yr, corresponding to a upper limit in the range of meV in 10 yr of live time. As shown in Fig. 20, the LEGEND-1000 discovery sensitivity comes within a few standard deviations of covering the inverted ordering parameter space for all four of the primary many-body methods used in modern nuclear matrix element calculations.
IV.2.2. Post-Discovery Validation
In the event of a discovery, LEGEND-1000’s rich data provide a number of additional handles for signal verification and rejection of alternative hypotheses. LEGEND-1000’s exquisite energy resolution combined with the simple spectral shape of its expected backgrounds near the ROI—a smooth continuum free of peaks within an energy range equal to many multiples of the energy resolution at —makes LEGEND-1000 capable of making a discovery even with very few counts in the ROI. Figure 11 shows a Monte Carlo example of what such a discovery might look like for a 76Ge decay half life of 1028 years, just within the LEGEND-1000 discovery sensitivity. With such a sparse background continuum after applying all analysis cuts, a feature at can be clearly discerned with just a handful of counts.
This simple spectrum lends itself to a simple analysis; sensitivity is near-optimal for even a rudimentary, Poisson-counting treatment based on counting events within an ROI chosen based on the known detector resolution function and then comparing that count with a background expectation derived from interpolating count rates in sidebands straddling the ROI. In practice, we maximize sensitivity from this experiment using a true spectral analysis that accounts for the full detector resolution function and its uncertainties, optimizes the separation of signal from background in the pulse shape parameters, and accommodates potential variations in the energy dependence of the background as derived from the background model. This can be achieved while incurring negligible systematic uncertainty. We are also exploring more extensive multivariate, as well as machine-driven, analyses using more of the available pulse shape and coincidence event information, balancing improvements in statistics with increases in systematic uncertainty.
In the event of a discovery, the additional handles for signal verification and rejection of alternative hypotheses include the following:
-
•
The ROI-event energy distribution should be compatible with the detector resolution function centered at , with appropriate moments (mean, standard deviation) or shape.
-
•
The ROI-event spatial information should be consistent with point-like interactions uniformly distributed throughout the Ge: no clustering in specific detectors, no simultaneous energy deposition in adjacent detectors or in the LAr, and pulse shapes consistent with single-site energy depositions in the detector bulk.
-
•
The ROI events should occur randomly in time, with no correlations with other detector events or delayed coincidences with the LAr veto.
-
•
The ROI events should be unique, with no other similar nearby peak structures lacking explanation from known processes.
These tests are informed by the observation that there exists no potential detector signature that can mimic decay without also leaving a telltale signature elsewhere in the data. For example:
-
•
As shown in Fig. 15, a faint line appearing right at and leaving just a handful of counts in the ROI after all cuts would also create approximately 10 times more events with a clear multi-site signature. Other -induced monoenergetic events in Ge such as double- and single-escape peaks would instead create a strong signature in the LAr scintillation light classifiers.
-
•
Other non--induced monoenergetic transitions (e.g., electron capture, conversion electrons, and decay) are likely to be accompanied by the emission of coincident -ray, x-ray, or bremsstrahlung photons; by additional transitions appearing elsewhere in the energy spectrum; or by time coincidences with progenitors or daughter decays.
-
•
Nearly all other conceivable backgrounds give a spectral signature that either forms a continuum across the ROI or is significantly broader than the detector energy-resolution function.
IV.3. Key Experimental Parameters
The experimental parameters used in the LEGEND-1000 discovery potential and background projections are listed in Table 4.
| Parameter | Value |
| Performance Parameters | |
| decay isotope | 76Ge |
| 2039 keV | |
| Total mass | 1000 kg |
| Energy resolution at | 2.5 keV FWHM |
| Overall signal acceptance777Includes an average 91% 76Ge enrichment, 92% active volume, 92% containment efficiency, and 90% analysis cuts. An additional factor of 95% is necessary for the fraction of events in a optimal region of interest in a counting-based analysis. See Sect. V.V.3.V.3.3 for details. | 0.69 |
| Live time goal | 10 yr |
| Total exposure goal | 10 t yr |
| Background goal | cts/(keV kg yr) |
| cts/(FWHM t yr) | |
| yr (99.7% CL discovery) | |
| yr (90% CL sensitivity) | |
| 9.4–21.4 meV (99.7% CL discovery) | |
| 8.5–19.4 meV (90% CL sensitivity) | |
| Physics Parameters | |
| 2.66–6.04 Coraggio et al. (2020); Song et al. (2017) | |
| /yr Kotila and Iachello (2012) | |
| 1.2724 | |
V. The LEGEND-1000 Design
Figure 21 illustrates the conceptual design of the LEGEND-1000 experiment. Large-mass ICPC detectors operate in a bath of LAr. The Ge detectors are distributed among four independently-operating, 250-kg modules to allow commissioning of the array in stages. Below, we provide greater detail on major components of the LEGEND-1000 technical design. Next, the use of ultra-low-background materials, some of which have been developed by LEGEND collaborators, that are certified for use in LEGEND-1000 through material screening is described. Last, we specify the data-analysis techniques and conclude with a detailed treatment of the background projections for LEGEND-1000.
V.1. Detailed Technical Design
V.1.1. Acquisition of 76Ge
The enriched 76Ge ICPC detectors are fabricated by commercial vendors, as described next in Sect. V.V.1.V.1.2. When dealing with enriched material, a series of additional steps are managed by the Collaboration to acquire and process the 76Ge into the form usable by the detector manufacturers.
76Ge Procurement
The LEGEND-200 project purchased the enriched 76Ge isotope from Isotope JSC888Isotope JSC, Moscow, Russia; http://www.isotop.ru/en/, which is enriched at the Electro Chemical Plant999Electrochemical Plant JSC, Zelenogorsk, Russia; https://www.ecp.ru/eng/ (ECP), and Urenco101010Urenco Nederland, Almelo, Netherlands; https://www.urenco.com/. Urenco material has now been successfully converted into working detectors for LEGEND-200, while ECP delivered 76Ge previously to the Gerda and Majorana Demonstrator experiments.
In previous procurements, the 76Ge isotopic enrichment fraction was specified to be at least 86%, which was typically exceeded by 1–2% in received shipments. For LEGEND-200, it became economical to order material with at least 92% enrichment. If the detector enrichment is below 86%, the fraction of 70Ge becomes problematic due to the high cross section to produce 68Ge while residing on the Earth’s surface. Higher enrichment fractions result in a more favorable signal-to-background ratio since most background sources in the Ge material scale with the absolute detector mass, while the signal strength scales with the enrichment fraction. The higher specification (92%) boosts the sensitivity of the experiment by about 6% for the same amount of 76Ge. Based on considerations of costs and benefits, we are planning for an enrichment fraction of 92%. Note that the experimental parameters listed in Sect. IV.IV.3 defining the LEGEND-1000 sensitivity goals assume an enrichment fraction of 91% since it represents the weighted average of the new material (at 92%) and the addition of the LEGEND-200 detectors, which are described next.
LEGEND-1000 plans to fabricate 870 kg of new detectors and reuse 130 kg of existing LEGEND-200 detectors. For a 75% yield of detectors from the starting material, discussed below, and recycling 50 kg of existing small detectors, LEGEND-1000 needs to procure 1100 kg of enriched 76Ge. For LEGEND-200, the two vendors produced 185 kg of enriched material, with a combined production rate of about 65 kg per year. This production rate was not limited by vendor separation capabilities but rather by the availability of project funding. From our LEGEND-200 experiences and based on discussions with vendors, we estimate that a conservative production rate is 220 kg per year. This results in about five years to produce all of the material, assuming a technically driven schedule. The total amount of about a 12-ton quantity of natural Ge input material to the enrichment process spread over this period should not cause any disturbance of the world market, considering that the current world production of natural Ge is about 130 tons per year.1111112021 estimate from https://www.usgs.gov/centers/nmic/germanium-statistics-and-information
76Ge Metal Production
The enriched Ge is delivered in the form of GeO2. Established facilities, in the USA or Europe, reduce the oxide to Ge metal and further purify the material to the level required by the detector manufacturers. The Ge oxide has a purity of 4N (99.99% Ge). For LEGEND-200, the conversion to metal and the initial purification by zone refinement to 5N to 6N (99.999–99.9999%) quality was performed by PPM Pure Metals121212PPM Pure Metals. Am Bahnhof 1, 38685 Langelsheim, Germany. Now Vital Pure Metal Solutions (VPMS). Additionally, the Leibniz-IKZ Institute in Berlin also has a similar capability and delivered 43 kg of enriched Ge metal to LEGEND-200. About 1–2% of the material is lost in this processing step. For LEGEND-1000, it is estimated this can be reduced to less than 1% by collecting cutting scraps (kerf) for recycling. The enriched Ge is transported in a custom 16-ton steel housing mounted inside a standard 20 ft sea container Agostini et al. (2015b); Abgrall et al. (2018). The production rate of the radioactive isotopes 68Ge and 60Co, which contribute to experimental backgrounds, are reduced by a factor of 10 by the shield Barabanov et al. (2006).
76Ge Losses and Recovery
During all processing steps starting from the reduction of GeO2 to the final detector production, various forms of Ge waste occur. Due to the value of the enriched Ge, it is prudent to reduce losses and to collect and recycle waste material. Figure 22 shows schematically the production process and the material streams. The recycling steps are:
-
1.
Metal Reprocessing: Cutting chips, crystal and bar tails that do not meet the required purity, can be reintroduced either directly into crystal pulling or through additional zone refinement during the detector manufacturing stages. While the fraction of this material stream depends on the viable size of the detector(s) cut from a crystal boule, the recovery yield from reprocessed metal is on the order of 96%.
-
2.
Chemical Recycling: Cuttings and grindings with lubricant/water, lithiated contacts, and metal that has exceeded the contamination level for zone refining must be chemically recycled. Chemical recycling is also a normal industrial process, and experience exists within the collaboration. This step is discussed in more detail below.
-
3.
Etchant Recovery: Prior to zone refinement or crystal pulling, the metal bars are etched with a mixture of HF and HNO3. Approximately 5% of the input material per detector production run—a batch of typically 20–30 kg—is lost at this step. After the metal recycling step, this fraction increases. The extraction of the Ge from the etchant solution turns out to be difficult and is not part of the industry process. The collaboration is exploring if the etchant process can be adapted such that recycling becomes possible.
About 20% of production run input material needs chemical reprocessing, with which the collaboration has experience. The Majorana Demonstrator chemical reprocessing Abgrall et al. (2018) of the cutting and grinding losses used the following steps: burning in chlorine gas to produce GeCl4, fractional distillation of GeCl4, and hydrolysis to convert to GeO2, which was then fed back into the normal production cycle. The same process was recently used by Gerda for metal waste from the production of BEGe detectors.
Another option for chemical reprocessing is to use a liquid process with HCl and H2O2 to produce GeCl4. The advantage of this wet chemistry is that all forms of Ge and oxide can be recycled while not using Cl2 gas, which poses other safety issues. This wet process was previously used by PPM Pure Metals on an industrial scale for recycling Ge. The company built a smaller unit to reprocess the LEGEND-200 kerf. This technology can be utilized near the detector manufacturing stages to maximize usable Ge and limit surface transportation of the material.
The Majorana Demonstrator demonstrated a yield of 70% for the total conversion of input Ge to detector mass Abgrall et al. (2018). With larger amounts of input material and improvements in the process, we expect to achieve 75% for LEGEND-200. If further improvements such as the recovery of etchant losses can be established, a yield above 80% should be possible.
V.1.2. Ge Detector Production
The detector fabrication process starts when LEGEND supplies enriched material to the detector fabrication vendor as electronic-grade material ( cm). Prior to crystal growth, the vendor does a further zone refinement to detector-grade purity. Crystals are then grown using the Czochralski process. For LEGEND-200 detector fabrication, vendors have assigned at least one dedicated clean crystal puller while processing an entire batch of LEGEND material in order to prevent contamination of enriched Ge by natural material. An analysis of the longitudinal net impurity concentration (IC) profile of the crystal ingots is used to decide where to cut it into slices for further conversion into working detectors. LEGEND collaborators are involved at this stage to ensure that the slices meet the impurity gradient specification, estimated case by case by means of electrostatic simulations using ADL3 Bruyneel et al. (2016) and siggen 131313Software for the field and signal generation in Ge detectors. https://github.com/radforddc/icpc_siggen software. Acceptable impurity values for the IC lie in the range of . The conversion of the enriched Ge crystal ingots into an ICPC detector relies on four key steps:
-
1.
Machining of the groove on the higher impurity concentration crystal side
-
2.
Machining of a well on the opposite side
-
3.
Diffusion of Li atoms into the outer crystal surface to produce the n+ contact
-
4.
Implanting B within the region enclosed by the groove for the p+ contact
The specification for the n+ contact thickness—determined by the temperature and duration of the lithium diffusion process—results from a compromise between the loss of detector active volume and an efficient absorption of particles on the outer surface. The accepted baseline thicknesses are within the range of 0.8 mm to 1.0 mm, but R&D is ongoing to optimize this value for additional background reduction. Other specifications are mainly driven by electrostatic simulations that take into account the measured impurity concentration. The detector geometry is optimized by varying many parameters—overall dimensions, groove diameter and width, well diameter and depth, and point-contact size—to find values that maximize the detector mass while maintaining a minimal electric field in the detector bulk above 200 V/cm and a predicted depletion voltage below 4000 V. These two parameters are of particular importance because of their influence on charge-collection efficiency and leakage current, respectively. Both contribute to the event-topology discrimination performance and energy resolution.
Mirion currently grows Ge crystals in Oak Ridge, TN, USA, and converts them into working diodes in Olen, Belgium. They also have a detector fabrication facility in Meriden, CT, USA. ORTEC processes Ge material and fabricates detectors entirely in Oak Ridge. In all cases, care is taken to minimize the time above ground by making use of underground storage facilities and shielded shipping containers Agostini et al. (2015b); Abgrall et al. (2018).
Detector Fabrication Baseline Design
The baseline design for the LEGEND-1000 detector fabrication builds on the experience of LEGEND-200. The realized mass increase of the LEGEND-200 ICPC detectors, which average 2.0 kg to date compared to the point-contact detectors from Gerda (0.6 kg average) and the Majorana Demonstrator (0.9 kg avg.), was a critical milestone in moving forward with LEGEND. The LEGEND-1000 baseline assumes a modestly larger average mass of 2.6 kg based on demonstrated ICPC detectors with masses over 3 kg produced by the vendors. Larger detectors reduce the amount of surrounding material (e.g., front-end electronics and cables) and the surface-to-volume ratio. Although we continue to explore the fabrication of even larger detectors, they are not required for the LEGEND-1000 baseline design. Critical aspects for LEGEND-1000 detector fabrication are the production rate, material losses, and the cleanliness of the process.
Production Rate
Based on LEGEND-200 detector deliveries and including an assumption that detector production is not limited by the availability of enriched 76Ge material, the estimated annual production rate for LEGEND-200 would be about 30 detectors per year, corresponding to 70 kg of detectors. This projected throughput rate is constrained by the current vendor fabrication resources that were dedicated to working with the enriched material. The LEGEND-1000 estimates for detector production are based on input from vendors which include plans to have dedicated production lines over much of the fabrication period. Figure 24 shows the estimates for new detector production versus time assuming an initial conservative production rate of 50 detectors per year that goes up to 110 detectors per year as fabrication becomes more routine. This scenario also takes into account that the production rate decreases towards the end of the production cycle, accounting for delays associated with the use of material that have been recycled from previous fabrication cycles. At these projected rates, we estimate that it takes six years to produce all of the LEGEND-1000 detectors. With LEGEND-1000’s staged approach, the detectors needed for the first module are ready in just over two years from the start of detector production. The detector production rate is matched to the production of enriched isotope (see Sect. V.V.1.V.1.1).
Material Losses
During the detector fabrication process one incurs material losses during the zone refining, crystal pulling, crystal cutting and shaping, and final fabrication of the detectors. However, as shown by Majorana, by following careful materials management it is possible to recover and recycle much of the material that would potentially be lost during etching, cutting, and grinding processes. As discussed in detail in Sect. V.V.1.V.1.1, we estimate an overall yield of 70–80% of detector mass per purchased enriched Ge.
Cleanliness of the Process
The process of zone-refinement and crystal pulling results in detectors which are intrinsically clean. The current vendor standards are already sufficient in terms of bulk contaminants from the 238U and 232Th chain. However, improved control of the air quality (low Rn concentration) and higher cleanliness requirements for detector handling (currently not under control of the collaboration) at the manufacturer sites could potentially reduce surface-associated backgrounds. For LEGEND-1000 vendors may operate a dedicated fabrication line for the duration of the detector-production period. Therefore, it is feasible for the LEGEND collaboration to work with the vendors to institute improved cleanliness measures, further reducing the surface-associated backgrounds. However, the background-index projection described in Sect. V.V.4.V.4.5 does not assume such an improvement.
Detector Characterization
The detector fabrication follows a set of specifications on the mass, the maximum depletion voltage, the minimal electric field, the energy resolution, and the n+-contact dead layer thickness of the detector. In addition to these parameters, we are interested in the background rejection capabilities and the homogeneity of the detector response over its entire volume. For reference to recent characterization measurements made on BEGe and ICPC detectors deployed in Gerda, see Refs. Agostini et al. (2019, 2021d).
The working detectors received from the manufacturers undergo a set of specific characterization measurements that qualify and quantify the aforementioned parameters. The comprehensive measurements are performed in a vendor-supplied vacuum cryostat with the best-achievable electronics noise and with high statistics, which cannot be reproduced once the detectors are installed in the final LEGEND-1000 apparatus. The full length of a characterization campaign is typically up to a week per detector (using multiple setups in parallel), which makes use of available underground space near the manufacturer’s facility in order to limit cosmic-ray activation of the detectors.
The Ge detector’s energy resolution at is deduced through an interpolation of the measured lines to a well-understood resolution curve as a function of energy. The Ge detector’s active volume is determined by measuring the amount of inactive material found at the detector surface. The entire surface, except the groove and the p+contact, undergo Li diffusion that makes the n+ contact and prevents and most particles from penetrating into the active detector volume and depositing energy. A precise estimate of its thickness can be achieved by comparing measurements of low-energy -ray absorption in the dead layer with Monte Carlo simulations, typically the -ray lines from 241Am (59 keV and 99 keV / 101 keV) and 133Ba (79 keV / 81 keV and 356 keV) to suppresses uncertainties due to the source activity. A precision on the dead layer thickness of better than 0.1 mm has been achieved, leading to a systematic uncertainty on the active volume of a few percent.
The PSD performance of the detector is investigated in a test stand by means of a 228Th source—similar to the method by which it is measured in situ for LEGEND-1000. The source provides both single-site and multi-site events within a detector for which the PSD rejection and acceptance parameters can be determined. The additional benefits of test-stand measurements are that significant statistics are collected within a few hours, instead of over a longer time through integrated LEGEND-1000 calibration runs; the source position is changed from top to side in order to have a complete picture of the PSD as a function of position within the detector. In the case of a significant under-performance, the detector may be reprocessed and improved at the manufacturer site within a reasonable time frame.
Detector Mounting
Detector mounts provide physical support and electrical isolation for each detector. Additional requirements are that the design must accommodate the front-end electronics mounting, cable routing, and termination. The detector mounts provide a level of protection from damage during handling and installation. The mounts are made from ultra-pure materials to minimize their contribution to the background and have low volume in order to minimize any shadowing effects on the light collection for the active veto system. LEGEND-200 will serve as an early testbed for new designs. In addition, the 14-string array in LEGEND-1000 allows some flexibility in detector mount design, and it is possible to deploy several design alternatives and iterations simultaneously. Each detector has unique dimensions in order to maximize single pass yield from each crystal boule.
The baseline LEGEND-1000 detector holder design is an evolution of the Gerda and LEGEND-200 detector mount design. Figure 23 shows the conceptual design of a detector unit integrating the electrical and supporting connections to an individual Ge detector. The vertical support rods are machined from EFCu with laser welded features to provide a captured coupling nut at one end for mechanical attachment to an adjacent detector unit. Small blocks of Ultem™ provide electrical isolation from charged electrical surfaces as needed, primarily the outer diameter of the detectors that are at full bias voltage of up to 5 kV. The baseplate is made out of polyethylene naphthalate (PEN), which can be produced sufficiently radiopure and has excellent mechanical properties. PEN is a scintillating material, described in more detail in Sect. V.V.2.V.2.1, which provides active shielding from nearby background sources (e.g., the detector’s cables and front-end boards). Detector mounting parts produced through an additive machining process (also described in Sect. V.V.2.V.2.1) would add an on-demand production capability as well.
LEGEND is exploring alternative strategies to replace additional passive materials with active materials. The additional use of scintillating support structures would further reduce backgrounds by improving the geometric efficiency of the existing LAr veto and reduce the non-active mass. One option would be to replace the Cu vertical support rods in the detector mounts with similar support structures made from PEN to be integrated within the baseplate. It is also envisioned that an entirely new kind of detector mount could be made entirely out of PEN, which would surround a number of detectors and provide a closed volume to shield them from the environment. The mount would be a modular capsule with internal support structures with laminated Cu traces as cabling and serve as part of the active veto system. This detector encapsulation would be highly beneficial for a detector array directly submerged in LAr as it would limit the effect of the 42Ar contamination. The produced 42K ions would be unable to reach the detector surfaces, and any electrons reaching the surface of a PEN capsule would be absorbed, causing the event to be vetoed by the PEN scintillation response. Figure 25 depicts a test capsule with a wall thickness of approximately 2 mm assembled out of two capsules. As a proof of principle, such a capsule, filled with N2 gas, has been successfully tested in LN2 and LAr. Further testing with internal support structures, feed-throughs, and a Ge detector are underway.

Detector R&D
The collaboration continues an R&D program to further investigate and optimize the ICPC detector design for use in LEGEND-1000 by characterizing available natural detectors and by testing larger prototype detectors of up to 6.0 kg mass. The effort includes detailed simulations of the depletion, field, and charge collection characteristics, and collaborative work with Mirion, ORTEC, and PHDS Co.141414PHDS Co, Knoxville, TN, USA. to produce and characterize large-scale prototype detectors. Due to the long drift distance for charges produced in such large detectors and the relatively weak electric field, some charge trapping can be expected. Special digital-signal processing and analysis will be required to correct for this and to maintain the best energy resolution. Alternative geometries to ICPC detectors are also being explored. The collaboration is studying what is termed a Ge ring-contact detector. The design detector has a true coaxial center hole, where the point contact is replaced by an outer contact ring that is centered near the mid-point of the detector (see Fig. 26). Such detectors, if shown to be feasible, may allow for larger crystals than the ICPC design.
Crystal R&D
While the collaboration will continue to partner with commercial vendors on R&D studies, several LEGEND collaboration institutions also have the ability to grow crystals and fabricate detectors. The ‘Institut für Kristallzüchtung’ (IKZ), translated as Institute for Crystal Growth, is working to provide detector-grade high-purity Ge single crystals for detector fabrication to broaden the options in the supply chain. Earlier crystal growth work for the Gerda collaboration was supported by the experienced IKZ materials science team. With extensive expertise in Ge crystal growth, IKZ is routinely growing high-purity Ge single crystals of 50 mm in diameter, 15–20 cm long, and 1.5 kg in mass. It can now grow larger crystals of 75–80 mm diameter using a newly scaled-up facility. For its participation in LEGEND, IKZ has been enhancing its technique for Ge processing—including Ge reduction and purification—to establish a complete production process that starts with the reduction of the GeO2 materials through the Ge crystal growth for detector fabrication. The IKZ team has successfully established a high-yield process of reducing both natural and isotopically enriched GeO2 powder into Ge metal and zone-refining it to semiconductor-grade Ge bars with an overall process yield of 99% (94% with 50 cm). The University of South Dakota (USD) is also growing crystals and fabricating detectors as a member of the Partnerships for International Research and Education (PIRE) GErmanium Materials And Detectors Advancement Research Consortium (PIRE-GEMADARC). The global consortium was created to accelerate the Ge material platform used in R&D for new generation dark matter and decay experiments while educating the next generation of scientists. PIRE-GEMADARC members USD and Texas A&M provide in-house capabilities to grow crystals, develop detectors, and study detector performance. Utilizing the in-house crystal growth ability, small Ge detectors can be fabricated on a weekly basis to study bulk and surface properties that are inconvenient or costly to study with large commercial detectors, such as contact technologies, passivation techniques, charge carrier mobility and trapping constants, or other properties. The group plans to fabricate a ring-contact detector (see Fig. 26) from a USD-grown crystal with a mass of 2–3 kg to characterize its energy resolution and pulse shape properties and determine its potential for use in LEGEND-1000.
V.1.3. Cryostat and Water Tank
The LEGEND-1000 cryostat and water tank infrastructure support the Ge-detector array and the means to provide shielding from backgrounds. LEGEND-1000 backgrounds from the underground environment and laboratory infrastructure are very small components of the overall background budget. Multiple modules of Ge detector arrays allow commissioning of the detector system in stages, with operation of installed detectors remains undisturbed when additional modules are installed. The Ge is divided into four modules of about 250 kg each.
The reference design for LEGEND-1000 is to operate the Ge detector array in LAr within a single vacuum-superinsulated cryostat appropriately sized to fit, together with the enveloping water tank, in the Cryopit cavity at SNOLAB. The Ge detectors comprise four modules within reentrant tubes containing UGLAr, which are submerged in a LAr cryostat and shielded from site-related radioactivity by an external water tank. The conceptual design of the LAr cryostat and UGLAr-filled modules is shown in Fig. 27, along with its representation in the SNOLAB Cryopit. As an alternative, we also consider this general cryostat design deployed at LNGS described in Sect. VI.VI.2.VI.2.2.

The walls of the cryostat are made from welded stainless steel components similar to 316L that are pre-screened for radioactivity. Due to the required mass for this cryostat, an entire “heat” of 120 t can be reserved and assayed, increasing the level of control the supplier has with input materials and consistency throughout the lot. The walls contain multilayer insulation material within the vacuum gap. The inner cryostat wall is 7 m in diameter, and the outer diameter, without stiffening rings, extends to 7.2 m. The cryostat holds 240 m3 or 332 t of cryogenic LAr. The cryostat has a 4-m high inner cylindrical portion height with 1.5-m tall domed shells on the top and bottom. The reentrant tubes have a 950 mm inner diameter and are are arranged on a 2-m-diameter circle. The lower portion of the tubes that extend into the cryostat comprise multiple cylindrical rings grown from underground electroformed Cu (see Sect. V.V.2.V.2.1), rolled to a final thickness of 1.0 mm, and electron-beam welded to form the full cylindrical height. Each tube holds 3.3 m3 or 4.6 t of cryogenic UGLAr. Each module’s Ge detector array, of total mass 250 kg, is inserted from the top into each of the reentrant tubes. A lock and shutter system provides a controlled interface between the reentrant tubes extending into the cryostat and the installation glovebox where the Ge-detector array is assembled. The lock systems also provide accommodations to facilitate the slack length of cabling before lowering or after raising the detector array. The design of the cryostat lock is based on the experience from Gerda and LEGEND-200. Openings accommodate a LAr purification loop, services for LAr filling, Ar exhaust gas, and LN2 cooling, as well as safety devices, cabling for LAr instrumentation, or other sensors.
The physical dimensions and configuration of the cryostat are modeled through Monte Carlo simulations to ensure the backgrounds from the cryostat materials and outer environment are each at acceptable levels of 5–10% of the experiment’s background goal (see Sect. V.V.4.V.4.6). Since the detectors in the array are arranged in rings offset from the cryostat center, the distance from a detector to the cylindrical cryostat wall varies between 2.1 m and 4.9 m. This thickness improves upon the -ray shielding achieved for the Gerda cryostat Barabanov et al. (2009). Therefore, a 7-m-diameter cryostat is expected to provide the required shielding, based on an assumed activity of 1 mBq/kg of 232Th for the stainless steel, compared to the 0.4 mBq/kg upper limit for the steel used in Gerda, and conservative assumptions of the effectiveness of analysis cuts. The cryostat design allows the mounting copper plates on the inside of the inner wall—as implemented in the Gerda cryostat—for additional shielding in case the radioactivity of the steel is higher than expected.
The cryostat is immersed in a water tank (visible in Fig. 27). The combined shielding of LAr and water reduces the ray and neutron (low-energy (,n) and fission reactions) backgrounds from the laboratory environment to an acceptable level with a 2-m-thick water shield. Therefore, a water tank with an overall diameter of 12 m is sufficient. The water tank is instrumented with photon detectors along the walls of the tank to veto muons through the detection of Cherenkov light in water, as was done in Gerda and planned for LEGEND-200. However, since the full LAr volume is separately instrumented (see Sect. V.V.1.V.1.5), muons can be sufficiently identified by the LAr scintillation light. At the baseline SNOLAB depth, a water-based muon-veto instrumentation system is not a requirement to meet our background goal.
The cryostat design follows upon the experience of Gerda, which operated its cryostat in a water tank at LNGS for over a decade. Deploying the cryostat at SNOLAB does introduce fabrication and installation constraints, which are factored into the infrastructure requirements, quality assurance and testing plans, and the overall schedule. Safety is a prime concern for such a large cryostat, and design studies are considering normal and accidental load cases. The cryostat must be designed according to a pressure vessel code to meet operational standards and ensure quality control of fabrication. The design must ensure that the cryostat can withstand not only normal operating conditions but also the conditions during leak checking and pressure tests. Accident scenarios, including vacuum leaks that introduce air, water, or Ar and compromise the cryogenic insulation, are considered to inform the overall design and necessary precautions. The failure of the cryostat vessel within a large volume of water is a concern. If the thermal insulation is compromised, the rate of Ar evaporation has to be limited to a tolerable level. Mitigation strategies may include using baffling to segregate the innermost volume of water, which can be drained quickly, or freezing the water entirely to minimize its heat load. Additionally, dynamic loading from seismic events or mining activities must be considered to ensure adequate support of the cryostat walls. The inner vessel support tubes that exist between the cryostat walls must withstand the stress of any acceleration, in addition to supporting the full weight of the LAr and any supplemental shielding materials, while exhibiting low thermal conductivity and low radioactivity.
LAr Cryostat Auxiliary Systems
Several auxiliary systems support the commissioning and operation of the LAr vacuum-insulated cryostat. Figure 27 illustrates the major subsystems and their notional connections. The UGLAr begins as a high-pressure gas in storage tanks prior to being condensed and fed to the UGLAr filtration system. A separate filtration system services the UGLAr contained within each of the reentrant tubes, both to purify the UGLAr upon initial filling and for re-purification during operation. Should the UGLAr need to be evacuated from the reentrant tubes, the evaporated gas is compressed and returned to the high-pressure storage tanks for later re-introduction to the cryostat. The handling of the atmospheric LAr begins with delivery in custom 2 t transport skids prior to being fed to a filtration system during the filling of the cryostat. Should the atmospheric LAr need to be evacuated out of the cryostat, it is evaporated and relieved through a laboratory exhaust vent to the surface. A liquid nitrogen (LN2) generating system and buffer tank provide a closed-loop heat exchanger to provide the cooling power for the LAr cryostat and the UGLAr condenser. The LN2 system also generates N2 gas for purging glove boxes and dry storage cabinets.
While most of the auxiliary systems support the cryogenic needs of the cryostat, the filtration systems are integral to the low-background operation of the experiment. The LAr active shield system (described separately in Sect. V.V.1.V.1.5) relies on the fact that ionizing radiation in LAr scintillates through decays of the excited singlet and triplet states. The lifetime of the triplet state reaches 1.6 s, which is significantly longer than the 6 ns lifetime of the singlet state. The population ratio of these two states depends on the incident particle and enables the possibility of its identification, which is a key feature in LAr-based detectors searching for direct dark matter interactions. The presence of electronegative impurities in LAr can, however, lead to a strong suppression of the formation of excitons by capturing the free electrons needed for recombination. The light yield can be reduced by a depopulation of the excimer states caused by collisional destruction with impurities like water, nitrogen, or oxygen. Taking into account different lifetimes of the two states, it is clear that this effect primarily influences the triplet state, where a longer lifetime leads to an increased probability to undergo a non-radiative decay. Measurements have shown that a small contamination (on the order of 1 ppm of oxygen/water and/or 10 ppm of nitrogen) leads to a strong reduction (50%) of the light yield and a strong reduction of the triplet lifetime Acciarri et al. (2009, 2010). In Gerda Phase II the observed triplet lifetime did not change significantly from a value of 0.9 s during the course of the experiment. The attenuation length measured before the start of Phase II was about 15 cm, thus significantly lower than the theoretical Rayleigh scattering length of approximately 90 cm. Both parameters indicate some airborne contamination. Either the LAr filled into the Gerda cryostat was initially contaminated or the impurities were introduced during operation with the Ge detectors (the large volume of LAr prevents significant changes due to the dilution effect).
The LEGEND-1000 cryostat has four reentrant tubes filled with UGLAr—the volume of each is about 3.3 m3—which must maintain sufficient purity to preserve its scintillation properties. After initial filling, the UGLAr slowly degenerates over time (i.e., due to internal degassing or operations on the detectors) as compared to the larger volume of LAr (65 m3) in the Gerda cryostat. A circulation loop provides real-time filtration of the UGLAr in the liquid phase to achieve purity at the sub-ppm level. All filtration traps are constructed so that regeneration may be performed in situ, meaning that the traps are regenerated without removing them from the purification system (equipped with appropriate heaters, temperature sensors, and piping). The purification columns and the piping are vacuum insulated in order to minimize the heat load. The circulation speed is tuned to the needs (UGLAr degradation rate) or run periodically when the triplet lifetime reduces to an unacceptable level (below 1 s).
V.1.4. Underground Liquid Argon
Beta decays from the isotope 42K, progeny of 42Ar, is a potential LEGEND-1000 background intrinsic to the LAr shield. The DarkSide collaboration has established that Ar sourced from a deep underground CO2 well (underground argon, UGAr) has a reduced 39Ar content 1400 times less than Ar sourced from the atmosphere Agnes et al. (2018). Since both 42Ar and 39Ar are produced by cosmic-ray interactions, it is expected that 42Ar is similarly or better reduced in UGAr. This level of reduction would strongly reduce the background due to 42K. Therefore, the baseline plan for LEGEND-1000 is to obtain the required quantity of underground-sourced LAr (UGLAr) to immerse the detectors.
The Istituto Nazionale di Fisica Nucleare (INFN) is funding a plant to produce UGLAr in connection to the DarkSide-20k project Aalseth et al. (2018b); Wang et al. (2019). The URANIA project plans to develop 95 t/yr of UGLAr at the Kinder Morgan Doe Canyon Facility in Cortez, CO, USA. The plan is to produce 50 t of UGAr for use in DarkSide-20k. It will be shipped to the ARIA plant in Sardinia to purify the Ar at a rate of up to 1 t/d before it is transported to LNGS. The time scale for the start of operations of the URANIA plant is estimated to be 2022, and it requires about nine months to produce the UGLAr required for DarkSide-20k. It is envisioned that LEGEND receives UGLAr from URANIA starting from 2023, which matches the needed schedule. It would then have to be further chemically purified at ARIA or a dedicated facility at SNOLAB so that the optical properties would be appropriate for the LAr scintillation detection. The estimate of the required contained mass of UGLAr for LEGEND-1000 is approximately 18 t. SNOLAB is making plans to store a few hundred tons of UGLAr for a potential ARGO Agnes et al. (2021a) project. Therefore, that facility is already preparing for transporting and storing large quantities of ultra-pure Ar.
The collaboration is investigating additional strategies to suppress the 42Ar background. New tools could be used in combination with UGLAr to further lower the LEGEND-1000 baseline background level and boost the design sensitivity. The strategies that are currently being explored include: i) producing detectors with thicker n+ dead layers, ii) enclosing the strings with high-purity nylon mini-shrouds with reduced Ar volumes following the LEGEND-200 design, iii) enclosing the Ge detectors with wavelength shifting and scintillating high-purity PEN, iv) improving the pulse-shape discrimination of 42K surface events, v) doping the LAr with a non-quenching impurity to neutralize the 42K ions, and vi) moderately depleting the atmospheric Ar of 42Ar.
V.1.5. LAr Scintillation Detector: An Active Shield
The LAr scintillation-light detector acts as an active shield. It shields the Ge detectors from any background source in the materials surrounding the array, and it suppresses background events that deposit energy in the LAr. In essence, its role is to detect radioactivity in the immediate vicinity of the Ge detectors.
The Gerda collaboration operated a LAr detector system Agostini et al. (2015c); Csáthy et al. (2016); Agostini et al. (2018) that mitigates such external background sources and, with improvements, is used in LEGEND-200. These background sources deposit energy in the LAr, which results in the emission of 128-nm vacuum ultraviolet (VUV) scintillation photons that can be efficiently detected. As was the case in Gerda, this can be accomplished by placing photomultiplier tubes in a position to collect the light or by collecting and guiding the scintillation light through WLS fibers coupled to SiPMs. The SiPMs require the shift in wavelength to better match their spectral response, which peaks at a wavelength around 450 nm with a photon-detection efficiency greater than 35%. The WLS fibers in LEGEND-200 are coated in a vacuum-evaporation process with a 1 m layer of tetraphenyl butadiene (TPB). This layer absorbs the 128-nm VUV scintillation photons from the LAr scintillation and re-emits them in the blue spectrum. This light couples into the WLS fibers and is shifted to a spectrum above 500 nm (with details depending on the transport distance) guided via total internal reflection to the SiPMs. The placement and coverage of the light detection and readout instrumentation are optimized to maximize light collection and reduce shadowing by the Ge array. For LEGEND-200, this optimization led to the placement of two cylindrical fiber “curtains” surrounding the detector strings arranged in a single ring. LEGEND-1000 builds upon the LAr instrumentation system refined for LEGEND-200 to enhance background rejection through an improved geometrical fiber coverage, an increase of the photo-electron yield together with an improved LAr quality to maximize light collection, and improved front-end electronics to discard background events at the single photo-electron level.
LAr Instrumentation Baseline Design
Figure 28 shows the principal components of a LEGEND-1000 single-module LAr veto system within one of the four reentrant tubes of LEGEND-1000. The detector strings are surrounded by a curtain of WLS polystyrene fibers. The fibers are coated with TPB for shifting the LAr scintillation light from 128 nm to into the blue-light range. The TPB emission, peaking around 430 nm, is further shifted in the fiber doped with the K-27 green-emitting (around 500 nm) compound. The shifted light is then transported in fibers that are grouped and coupled to an array of SiPMs mounted on a Suprasil® substrate. Each of the Cu reentrant tubes can contain a wavelength-shifting and reflective surface for enhanced light collection.
The signal from each SiPM array is read out on a differential line by a receiver board placed outside of the cryostat to minimize the amount of radio-impurities in the LAr. Under the default plan, each board is equipped with a voltage operational amplifier at a high-gain value, optimized to ensure a sufficient resolution at a charge equivalent to a single photon above the white noise of the line. Other designs under consideration include an approach whereby the analog amplifier is placed closer to the SiPM to maximize the signal-to-noise ratio. This approach requires further R&D of cryogenic performance and sufficient radio-purity of the components.
Outside of the Cu reentrant tubes, the LAr light collection requirements are less stringent. Two zones are defined in this region with different light collection requirements. First, wavelength-shifting material is mounted directly outside of the reentrant tubes and read out with a scheme similar to that for the inner region. This zone is sensitive to single photo-electron level of detection for inter-module backgrounds. An outer zone instrumentation scheme includes light read out at the outer radius of the LAr cryostat but with a photo-electron trigger raised to the level necessary for detection of cosmic-ray muons and their secondary delayed neutrons that typically produce significant levels of light due to their energy loss. These zones and sub-zones therein are optically isolated to reduce pileup and dead time from the high 39Ar rate in atmospheric LAr. While the exact design of this zone’s instrumentation is under study to determine the needed photocathode coverage for the expected muon flux, likely readout options include 8-in-diameter PMTs or SiPM walls.
Alternatives and R&D
While the baseline design is well tested and incremental improvements are expected, we intend to carry out further R&D and refine the LAr active shield design where improvements are possible: lowering radio-impurities of its components and increasing the efficiency of detecting light from backgrounds in the proximity of the Ge-detector strings.
The current LEGEND-1000 baseline background model assumes the use of the 1 mm-diameter BCF-91A WLS fibers used by Gerda and LEGEND-200, produced by Saint-Gobain Crystals151515Saint-Gobain Crystals, Hiram, OH, USA; https://www.crystals.saint-gobain.com/. While the backgrounds from the fibers are acceptable, a source of cleaner fibers is being pursued to improve upon the present 238U/232Th-chain contamination at the level of 100 Bq/kg (see Table 11). A collaborative effort with Saint-Gobain is helping identify the source or production step that introduces radio-impurities in WLS fibers. This work includes sharing details on the production process and supplying raw materials available for measurements and screening. LEGEND-1000 is also collaborating with Kuraray161616Kuraray Co., Ltd.; https://www.kuraray.com/ who has supplied high-quality fibers to several Fermilab experiments, including MINOS Michael et al. (2008); Adamson et al. (2004) and NOvA Ayres et al. (2007, 2004). Members of the LEGEND collaboration have a long working experience with Kuraray Pahlka et al. (2019) and plan to further engage with them on trial productions to evaluate the radiopurity of their fibers.
While the role of fibers is to efficiently detect scintillation light originating in LAr, other light collection geometries can be conceived of to accomplish the same goal. Instead of using fibers, one may use wavelength-shifting plates or cylinders, possibly made from PEN or doped plastic strips, to more fully enclose the Ge-detector strings. Compared to fibers, the production of plates is much simpler and may result in a higher radiopurity product under the right conditions. With an established relationship with Eljen Technology171717Eljen Technology, Sweetwater, TX, USA; https://eljentechnology.com/, which is a manufacturer of such plates, the potential improvement in radiopurity of plates can be studied. The base material of wavelength-shifting plates from Eljen is polyvinyl-toluene (PVT) with fluors added to give the plastic its desired properties. Eljen is interested in collaborating to achieve the cleanest ingredients as well as casting and polishing plates to achieve a high level of radiopurity. Similarly, members of the collaboration have close contacts with the scintillator manufacturer Envinet181818Envinet Nuvia Group, Prague, Czech Republic, which have produced high-radiopurity scintillator blocks for the main calorimeter wall of the SuperNEMO Demonstrator Barabash et al. (2017). Envinet’s blocks for SuperNEMO are based on polystyrene for which both the monomer and polymerization are different than PVT. We can compare radiopurities of samples produced by Eljen and Envinet to guide our selection of a viable alternative to the WLS fibers.
V.1.6. Front-End Electronics, Cables, and Connectors
The LEGEND-1000 electronics readout chain starts at the detector and requires local amplification to drive the 10-m-long cables that reach the lab environment from the center of the LAr shield. The electronics design follows the general philosophy of amplifying the signal as close to the Ge detector as possible to maintain high signal fidelity, while minimizing the number of nearby components to improve radiopurity. Although the combination of the Gerda and Majorana Demonstrator readout electronics designs is sufficient for LEGEND-200, there are two additional design considerations for the ton-scale LEGEND-1000 phase. First, the radiopurity requirements are more stringent, requiring even fewer (or more radiopure) components close to the enriched Ge detectors. Second, the larger detector array necessitates longer cable paths from the internal detector to an exterior signal digitizer.
The LEGEND-200 design concept of low-mass front-end (LMFE) electronics and the closure of the gain loop in the charge-sensitive amplifier (CSA) about a meter away sets an upper limit on the bandwidth of signals and the rising edge—important for background event discrimination. A significantly increased gain loop length for LEGEND-1000 would prohibitively slow down the rising edge of signals, necessitating an alternative charge-amplification topology.

The LEGEND-1000 design utilizes a CMOS191919Complementary metal–oxide–semiconductor ASIC charge sensitive preamplifier in close proximity to the detector. This concept eliminates the radioactive background of the LEGEND-200 CSA while maintaining or improving the background near the detector. The higher amplification level of the ASIC output compared to the LMFE also reduces the noise-performance specifications of the cables near the detector, allowing for cleaner cable fabrication methods and reduced cable backgrounds. From the signal perspective, the LEGEND-1000 ASIC preamplifier concept improves the bandwidth over the LEGEND-200 implementation while providing a differential output that can be received directly at the digitizer. With the low capacitance of the LEGEND-1000 detectors, the MOSFET202020Metal–oxide–semiconductor field-effect transistor transistors in the CMOS ASIC process offer an electronic noise benefit over their JFET212121Junction-gate field-effect transistor counterparts. A recent demonstration of low electronic noise in a mechanically cooled low-capacitance Ge detector with a commercial CMOS ASIC preamp designed for silicon drift detectors Bombelli et al. (2011) can be found in Ref. Barton et al. (2016). Figure 29 shows a comparison of the noise level that was achieved between this CUBE222222https://www.xglab.it/products/cube/ ASIC and the Majorana Demonstrator LMFE based on a low-noise JFET. Initial assays of this commercially available CUBE ASIC indicate that it meets radiopurity requirements Edzards et al. (2020).
| Description | Design Specifications |
| Threshold | 1 keV |
| Dynamic range | 10 MeV |
| Bandwidth | 50 MHz |
| Assumed detector capacitance | 5 pF |
| Cabling | minimal (power, ground, pulser, diff. out) |
| External components | none |
| Power supply | single |
| Reset | internal |
| Other | observable leakage current, testable warm or cold |
The specifications for the LEGEND-1000 front-end electronics are listed in Table 5. The LEGEND-1000 readout design team is pursuing two ASIC preamplifier implementations. One approach involves broadening the dynamic range of the commercial CUBE ASIC. A recent revision of the chip has shown promising noise levels, bandwidth, and PSD capabilities when coupled with a 1 kg Ge detector in vacuum Edzards et al. (2020). In order to remove the charge integrated on the feedback capacitor, the current prototype ASIC utilizes an external digital reset line. This extra signal cable is disadvantageous from the perspectives of cabling radiopurity and mixed signal noise immunity. Further development is ongoing to incorporate the external reset circuitry, reduce the number of power supplies, and add differential output.
Signal readout baseline design
The primary approach for the LEGEND-1000 ASIC readout is the custom design of a new “L1K” ASIC to match the needs and the operating environment of LEGEND-1000 as set forth in Table 5. This ASIC consists of a CSA and a differential output driver. In contrast to the CUBE chip, L1K is designed with a continuous reset feedback circuit that does not require an external reset pulse. This prevents the need for transmitting potentially noise-inducing digital reset signals to each preamplifier. The L1K ASIC’s differential outputs are transmitted to an external receiver at the DAQ over a meters-long cable, as illustrated in Fig. 30. This low-noise, low-capacitance ASIC was designed to be biased with a single power supply, which minimizes readout complexity, radioactive background from cabling, and the number of feedthroughs required for LEGEND-1000. The number of feedthroughs could further be reduced with an in-cryostat power and pulser distribution system, located far away from the detectors.


Simulations of the L1K performance for a 1 pF detector and leakage current of 5 pA estimate the equivalent noise charge (ENC) to be 70 eV FWHM. For typical ICPC detectors with capacitance of 5 pF and leakage current of 20 pA, the simulated ENC is 130 eV FWHM. Low electronic noise levels aid in achieving a low Ge-detector energy threshold. The design was tested with the TSMC232323Taiwan Semiconductor Manufacturing Company 180-nm mixed signal/RF technology. Alongside variants of the L1K ASIC, test chips of the internal low-dropout voltage regulators intended for use in the next iteration of the design were also produced. These regulators stabilize the power supply voltage delivered from a distance and are undergoing characterization in LAr. Figure 30 also shows this first prototype ASIC attached to a test printed-circuit board.
Preliminary tests of the L1K ASIC prototype at room temperature and in LAr with cables of various lengths indicate good performance. While most continuous-feedback preamplifiers discharge through a resistor, causing an exponential tail pulse, the internal reset method in the L1K ASIC leads to a more linear tail pulse and requires a non-linear digital pole-zero correction filter. The L1K ASIC was observed to have a bandwidth of 35 MHz and consume 0 mW. The chip design is currently being modified to include a low drop-out voltage regulator, which has been fabricated and characterized on a separate chip, and to adjust other internal bias currents and voltages for stable operation.
Cables
The design for cables in LEGEND-1000 is based on Cu on Kapton flat flex cables (FFCs). The FFC design allows for integration of cable and front-end electronics circuits, further reducing parts count, mass, and installation complexity. The FFC used in Gerda has a background too high for use in LEGEND, but recent development work at Pacific Northwest National Laboratory (PNNL) Arnquist et al. (2020a) has isolated and eliminated the main source of 238U backgrounds in Kapton, hence making this convenient and low-mass solution appropriate for use in LEGEND-1000. FFC cables can be sourced from pure Kapton with low friction additives removed from the process, as developed by PNNL for low-background use.
Connections to the Detector Unit
Figure 31 shows the conceptual design of how the ASIC is installed on the detector holder and a prototype flex circuit comprising a front-end board for the L1K ASIC and a 3 m cable. The detector readout electrode is wire-bonded to the same substrate trace as the L1K ASIC input. This end of the cable is secured onto the PEN baseplate using an Ultem™ stiffener plate, EFCu retaining pins, and Ph-Br clips. The high-voltage (HV) cable consists of a single conductor wire-bonded to the detector, as shown in Fig. 31. Wire bonding to the detector can be completed in a glovebox within an underground cleanroom environment in the same manner as for Gerda and LEGEND-200. This technique is well established, reliable, and meets radiopurity requirements for LEGEND.
Connections to the Detector Strings and Feedthrough Connectors
In order to aid in the installation of the array, a cable connection point must be made inside the cryostat between the Ge-detector strings and the point where the feedthroughs exit the cryostat. Custom low-background zero insertion force (ZIF) connectors, based on previous designs used in Gerda, are used above the array to connect the short, 1.5-m (on average) cables attached to the string of Ge detectors with the 10-m-long cable bundle that runs to the feedthrough flange at the top of the cryostat. For signal cables, the feedthrough flange can use vacuum industry standard ultra-high vacuum (UHV) feedthroughs. For HV cables, a commercial HV feedthrough mates to an adapter board on either side of the flange.
V.1.7. Data Acquisition and Slow Controls
The physics events collected by the data acquisition (DAQ) system extend over an energy range from around 1 keV to around 10 MeV. Beside events in the energy region of the and decays, it is necessary to collect events at higher energies to record possible contamination, while events at low energies enable non- physics searches. The Ge detectors are subdivided into modules that contain their own dedicated LAr veto system. The DAQ readout for each module operates as a stand-alone independent system. All together there are four of these modular DAQ readout systems—a separate DAQ system for the muon veto system and a LAr readout system external to the modules, and a slow control system for the modules and centralized systems. Data from all systems include timestamps, allowing sequential event building.
The following describes the DAQ system for each module. The signals from each Ge detector are read out through a digitizer, the characteristics of which are defined by the large energy range to be covered and by the necessity to have excellent energy resolution over the entire range. These requirements require a digitizer with a high number of bits (16-bit as adopted in LEGEND-200) or adopting a solution with lower number of bits but doubling the channel readout per detector for low-gain and high-gain signals (as implemented in the Majorana Demonstrator). Due to the time development of a typical Ge signal and the utilization of PSD methods, a sampling rate of at least 60 MHz is mandatory. The baseline design of the SiPM-based LAr veto system calls for 60 channels of readout. The DAQ of the LAr veto system has a structure similar to the Ge DAQ system and also requires a digitizer for readout. The baseline digitizer for all systems—Ge detectors, LAr SiPMs, and muon veto PMTs—is the FlashCam digitizer being used in LEGEND-200. This digitizer is reconfigurable with an ADC resolution of 16/12 bits at sample rates of 62.5/250 MHz. Table 6 summarizes the baseline DAQ specifications for a LEGEND-1000 module.
| Description | Requirement |
| Number of readout channels per Ge detector | 1 |
| Total number of channels Ge/SiPM | Minimum 100–120/60–80 |
| Clock system | Synchronized clocks between subsystems, GPS timestamp |
| Typical background data rate | 1 Hz/channel; 0.1 GB/s |
| Dead time at typical data rate | 0.01% |
| Typical calibration data rate | 3–4 kHz; 1 GB/s |
| Dead time at calibration data rate | 0.1% |
| Maximum data rate | 3.5 GB/s |
| Dead time at maximum data rate | 1% |
| Digitizer setting validation | Ability to read back digitization settings at run start |
| Digitizer initialization stability | Stable operation of the digitizer across initialization boundaries |
| Channel identification | Unique channel identifier recorded with each raw waveform |
| DAQ data file naming | Unique identifier in addition to run and cycle number |
| DAQ data file size | Adjustable limit set to several GB during normal running |
| DAQ log file storage | Log files stored alongside data files for each run |
| DAQ configuration repeatability | Configuration file stored allowing system to return to any previous configuration |
| DAQ software documentation | Detailed description of the data format, all algorithms used (baseline, triggering, etc.), and readout control features |
| DAQ software version control | Git or svn with version identifier recoverable from data, configuration, and log files |
| DAQ system real-time monitoring | Ability to view waveforms, baselines, rates, and energy histograms in real-time while acquiring data |
| Underground real-time data storage | 50 TB |
| Underground secondary RAID storage | 250 TB |
| Above ground storage | 500 TB |
| Underground-to-surface network bandwidth | 10 Gb/s |
| Digitizer ADC resolution (Ge) | 16 bits |
| Digitizer full-scale range (Ge) | 10 MeV |
| Digitizer intrinsic electronic noise (Ge) | 50 eV |
| Digitization speed (Ge) | 62.5 MHz |
| Digitization record length (Ge) | Adjustable up to 48 s |
| Digitizer ADC resolution (SiPM) | 16 bits |
| Digitization speed (SiPM) | 62.5 MHz |
| Digitization record length (SiPM) | Adjustable up to 48 s |
| Triggering capability | Single-channel readout with independent triggers OR global trigger |
| Triggering functionality | Ability to run ALL trigger schemes for ALL types of physics data |
| Software data reduction | Optional mode for real-time data reduction on the DAQ machine(s) with simple, fully documented techniques |
| Number of HV channels (Ge) | 100–120 |
| HV output range | 0 to 5 kV |
| Maximum current output | A |
| Voltage set precision | 1 V |
| Voltage ripple | 10 mV |
| Voltage monitor resolution | 0.1 V |
| Current monitor resolution | 50 pA |
| Minimum ramping speed | 5 V/s |
The DAQ system has flexible triggering options to maximize the physics capabilities. The trigger capabilities include:
-
•
Local trigger mode: Each readout channel has a threshold that can be set independently of other channels. When an individual channel triggers, ideally only the waveform for that channel is read out. However, if necessitated by the hardware/firmware, all channels on the respective card can be read out.
-
•
Global trigger mode: When a trigger is generated from one subsystem, all channels from one or several subsystems are read out.
-
•
Online data reduction: Upon readout due to one of the above trigger conditions, the DAQ system provides the ability to, in real time, examine the waveforms to determine which channel’s waveforms should be written to disk.
-
•
Special trigger modes: Logic is implemented for specific items, i.e., for delayed coincidences.
Various mixtures of these triggering modes for the different subsystems are required depending on the type of data taking. Through appropriate threshold adjustments and online data reduction, the bandwidth limitations allow for all types of data to be acquired with the same hardware triggering configuration. The Ge and veto DAQ systems can receive a precise time signal from an external time generator so that all of the collected events have a timestamp. Offline, the data streams coming from the Ge and veto DAQ systems can be unified on the basis of the timestamps.
A slow-control system monitors all the important parameters of the subsystems: cryostat, cleanroom, high- and low-voltage power supplies, etc. It uses a database or similar tool to store information collected from a distributed pool of clients that reads sensors within the the sub-systems. The system can support alarm notifications and has an accessible web interface for monitoring the status of all sub-component systems. The DAQ system has access to the slow-control storage area to retrieve all the information useful for the definition of the start running conditions. All high-voltage distribution systems are under the supervision of the slow controls. There are four independent systems corresponding to individual bias supplies for each module’s Ge detectors and a fifth system for the muon veto PMTs. Commercial products, similar to what is used in Gerda, the Majorana Demonstrator, and LEGEND-200, provide autonomous computer-controlled systems with Ethernet interfaces. The main specifications of the HV system are summarized in Table 6.
The DAQ systems monitor key parameters and issue alarms and notifications to operators and experts. They are capable of protecting the hardware and placing modules or other systems into a safe state. A web-based monitoring system provides near-time monitoring access to both the DAQ and slow controls systems. Coupled to a database, it also allows access to historical data. This system is an extension of tools developed for Gerda, the Majorana Demonstrator, and LEGEND-200.
V.1.8. Calibration System
Regular calibrations of the Ge detectors are necessary for LEGEND-1000 to determine, monitor, and maintain a stable energy scale; achieve an optimal energy resolution; and provide event classes for the optimization and monitoring of the PSD parameters. By evaluating the position of lines in the recorded energy spectra, the detectors can be calibrated, their resolution can be determined, and the analysis can be benchmarked to the spectra of well-known sources. Moreover, the calibration system is also needed to provide calibration data for the LAr veto system. Here, the data are used to compare experimental and simulated suppression factors for well-known locations of radioactivity inside the detector array. For this purpose, the Ge detectors and the LAr veto system should be regularly exposed to weak radioactive sources for a limited amount of time.
When not in use, radioactive calibration sources must be stored as far away as possible and shielded from the Ge detectors during physics data taking in order to not contribute to the background budget. During calibrations, a mechanical system lowers the sources into the cryostat and brings them close to the detectors. A weekly schedule of calibrations has proven to be a reasonable time frame to monitor Ge detector performance and account for any instabilities. By tuning the activity and distribution of the source material in the calibration assembly, an array of Ge detectors can be calibrated within several hours.
In general, such a system has to fulfill the following requirements:
-
•
Precision: The deployed sources must be positioned precisely between tightly arranged detector strings. The mechanical system that controls the deployment must ensure full control over the absolute source position, not only to avoid contact with the detectors, but also to ensure sufficiently small source position uncertainty for the purpose of calibration source event modeling.
-
•
Repeatability: The calibration system should position the sources relative to the detector array in a reproducible manner. Since the goal is to monitor the long-term stability of the Ge detectors, the variability of the mechanical positioning should be negligible. To achieve this goal, the deployment system should be capable of repeatedly positioning the source within a one-millimeter range.
-
•
Reliability: After commissioning, the calibration system should be operated over the duration of the project without the need to service components inside the cryostat. Therefore, it must work reliably, needing almost no maintenance or inspection, and keep its full functionality and precision over the course of one decade.
-
•
Background contribution: A source in the storage position should not contribute to the background budget of the experiment. To guarantee this, storage positions must be located outside all major shielding parts, posing a technical challenge of deploying the calibration sources over long distances.
-
•
Safety: The handling of radioactive sources comes with the responsibility to guarantee the safe performance of standard calibrations for all users, new or experienced. The calibration system shall be designed such that safe, remote operation is possible, even by users who are not familiar with the details of the system. The system should consist of several interlocks, mechanical and software, such that no contamination to users or the experiment can occur. Since the deployment mechanism is similar to that of Gerda and LEGEND-200, there is experience to mitigate possible failure modes.
The LEGEND-1000 calibration system is designed to satisfy these requirements with encapsulated 228Th sources. The decay chain following a 228Th decay combines the most beneficial characteristics for Ge-detector calibration. The Majorana Demonstrator Abgrall et al. (2017b) and Gerda Baudis et al. (2013, 2015) both used 228Th sources with activities between 10 and 40 kBq for standard calibrations. The 228Th isotope decays over a series of and decays to 208Pb. The progeny isotopes generate a wide range of intense x- and rays with energies ranging from below 100 keV up to 2.6 MeV. This range of energies can be used for calibration of the energy scale and to explore systematic effects such as ADC nonlinearity. The single- and multi-site events created by the 2615-keV -ray line can be used to tune event selection criteria at energies around .
The activity of the source should allow calibrations in the shortest time reasonable so that the loss of run time for physics data is minimal. Both pile-up rate and the readout electronics play a role in limiting the calibration event rate and source activity. While the DAQ system can be designed to handle higher count rates, a low-count rate, high-resolution calibration approach is preferred for the search of decay. Pileup events—events sitting on baselines that has not been completely restored—are not desirable in calibration since they rarely occur in the physics data. The readout scheme imposes a limitation due to the decay constant of the front-end electronics, which is on the order of 1 ms. To guarantee that most events start after the baseline has settled from a previous event, a rate of less than 300 Hz per individual detector is favorable. Simulations show that an activity of about 5 kBq per source assembly meets these requirements. These low-activity radioactive sources are produced by electrodeposition of thorium on gold, which are then electron-beam welded in capsules and certified for use
Access points along the top of the cryostat accommodate the installation of a mechanical system that can lower radioactive sources from above the detector array into the cryostat for detector calibration. The LEGEND-1000 calibration system is modeled after those used in Gerda and LEGEND-200. The source-insertion system for LEGEND-200 is shown in Fig. 32. Individual source capsules are mounted onto a steel band that can be lowered into the detector array. The advantage of deploying multiple low-activity sources spread across the array is that a number of detector units can be calibrated in parallel with good uniformity of statistics, without exceeding the desired individual rate. In addition, studies have shown that the performance of the PSD cuts in the ICPC detectors depend on the location of the -ray interaction inside the individual crystal. Therefore, it is desirable to irradiate a detector from various angles. A source assembly containing multiple sources would fulfill this requirement in one calibration deployment.
The relatively short 228Th half-life of 1.9 years requires access to the calibrion sources during the runtime of LEGEND-1000 for their replacement. Since the parking positions of sources are outside of the LAr and water shielding, we expect the replacement work to be convenient. The calibration sources of Gerda, the Majorana Demonstrator, and LEGEND-200 all provided such access. Sources were replaced, or swapped in the case of special calibration runs, during the operation of these experiments without any problems. The LEGEND-1000 system will provide this capability. The source adapter design allows for the removal and rearrangement of sources as needed.
In addition to calibrations with 228Th sources, the system has the capability to deploy alternative sources to address specific analysis questions. For example, the isotope 56Co has a short half-life of around 77 days and possesses several transitions around 2.5–3.5 MeV, which produce a number of single- and double-escape peaks surrounding the region. These provide a useful cross-check for data-cleaning and background-rejection cuts developed in the standard 228Th calibrations. The short half-life of 56Co prohibits a long-term installation of this source, but over the 10-years expected run-time, two or three dedicated high-statistics deployments are planned. As another example, sources like 133Ba deliver a number of low energy photons in the 30–400 keV range. These photons can be used to calibrate detectors down to low energies with high precision, which is of interest for physics searches beyond the Standard Model. Finally, in order to study and calibrate the light output of the LAr active veto system as a function of position and compare its performance to the complex Geant4 simulation, special sources can be prepared and installed during specific campaigns.
V.2. Materials and Assay
V.2.1. Clean Materials
Operating decay experiments deep underground mitigates backgrounds originating from cosmic rays. Of equal importance is constructing detector components using ultra-clean materials with the lowest levels of radio-contamination. Various metals and plastics have been found to be clean, after stringent production and handling, allowing their use as detector components. Cu is one such metal; it also has excellent thermal and conductive properties, and can be easily electrolytically isolated, allowing further purification. New sources of scintillating plastics have been developed where structural integrity is needed to take the place of optically passive materials. Further, advances in additive manufacturing techniques would allow the convenience of on-demand printing of custom transparent, and potentially scintillating and wavelength-shifting, plastic parts that meet the stringent low-background specifications.
Advancements have been made in the understanding of post-machining contamination of both plastics and metals in order to maintain the materials as close to their bulk low-background purities as possible. All materials for LEGEND-1000 utilize these cleaning techniques and handling procedures to reduce or eliminate the post-production contamination.
Copper Electroforming
Due to its favorable thermal and electrical properties, ultra-pure Cu is an ideal material when levels of naturally occurring radioactive 238U and 232Th, or troublesome cosmogenically induced radioisotopes such as 60Co, have been significantly reduced. Producing such Cu is possible under stringent cleanroom conditions within an underground electroforming facility.
The Majorana collaboration has extensive experience in setup, operations, and machining of EFCu to the size and thicknesses needed for LEGEND-1000 components. The Majorana Collaboration operated 16 electroforming baths split between its underground space at SURF and at PNNL’s shallow underground laboratory to produce over 2830 kg of EFCu detector components and shield plates. The purity of the produced EFCu was below 0.3 Bq of 232Th and 238U per kg of Cu Abgrall et al. (2016). Although Cu may be viewed as a soft metal, the electroforming process enhances the strength; all Majorana-produced EFCu material exceeded the 10 ksi tensile strength design criteria. The electroforming facility at SURF remains in the Majorana laboratory clean space to supply the necessary clean EFCu detector components for LEGEND-200 as well as further study of low background metal production.
The LEGEND-1000 design calls for the four reentrant tubes surrounding the Ge detectors to be fabricated from underground EFCu. This production of EFCu is a natural evolution of the collaboration’s collective experience with Cu growth, welding of Cu components, and final post-production cleaning for low background use. Engineering calculations show that the EFCu used for the reentrant tubes can be grown in similar baths and on the same size cylindrical mandrels developed for Majorana, yet rolled to form larger-diameter cylindrical portions that can be welded to the necessary size. Testing of the EFCu rolling and welding processes are being performed along with engineering feasibility studies to validate the design. Since the reentrant tubes are constructed from portions of EFCu produced from a single electroforming bath, multiple baths can be operated in parallel to meet the desired production schedule. Additional baths operate to serve the needs for the production of small parts within the Ge-detector array.
Cu may not always be the ideal material of choice for certain parts within the experiment, so development of ultra-pure alloys can be utilized in locations that may need stronger or more durable metals. One example is threaded Cu parts. Testing of Cu threads coated with Cr has shown good structural integrity and the elimination of plastic anti-galling coatings, which would make the components withstand multiple mechanical and temperature cycles while not compromising cleanliness. Further investigation of CuCr alloying could yield materials with the same or better structural capacity though requiring less mass.
Structural Scintillating Plastics: PEN
Structural scintillating plastics are being developed as a replacement for some of the optically opaque and passive materials that support the Ge-detector array in previous experiments. By replacing passive materials within the array with transparent scintillating materials, an improved background rejection can be achieved by enhancing the light collection for the active veto and by creating a self-vetoing capability of the support structures.
PEN is an industrial polyester that scintillates in the blue region with a dominant decay constant of 34.9 ns Nakamura et al. (2011); Majorovits et al. (2018); Wetzel et al. (2020). It also shifts the 128 nm VUV light emitted by LAr into the blue region Kuźniak et al. (2019); Boulay et al. (2021); Garankin et al. (2018), which can be detected easily with standard photo-detection devices. PEN was introduced in LEGEND-200 as the material of the detector baseplate that forms part of the detector unit (see Sect. V.V.1.V.1.2). In addition, PEN material is being considered for additional scintillating support structures within the LEGEND-1000 design, including as encapsulation for an alternative detector mount design to separate the detector from any direct contact with the LAr.
| Property | Value | |
| Atomic composition | [C14H10O4]n | |
| Density: | 1.35 g/cm3 | |
| Melting point | 270∘C | |
| Peak emission | nm | |
| Light yield | 5000 photons/MeV | |
| Index of refraction | 1.62 | |
| Decay constant | 34.91 ns | |
| Attenuation length | 50 mm at 450 nm | |
| Young’s modulus: E [GPa] | (296 K) | (77 K) |
| Yield strength: [MPa] | (296 K) | (77 K) |
PEN, [C14H10O4]n, is primarily composed of only three elements with trace amounts of catalysts. Its mechanical properties have been determined, both at room and cryogenic temperatures Efremenko et al. (2019). The tensile strength of PEN is higher than that of Cu and increases towards cryogenic temperatures (see Table 7). This qualifies PEN as a good structural material in any environment relevant for LEGEND.
The PEN scintillation spectra peaks in the blue region at 445 nm, as shown in Fig. 33 (left panel). For comparison, the emission spectrum of the standard plastic scintillator BC-408 is also shown. Even though the light yield of PEN is significantly lower, it is sufficiently high to make PEN a truly active material. Figure 33 (center panel) demonstrates the wavelength-shifting qualities of PEN Efremenko et al. (2019). The wavelength-dependent efficiency to shift VUV radiation into blue light was measured by comparing the light output of a PEN plate to the light output of a TPB-coated acrylic plate. In the region of the LAr emission spectrum, PEN reaches about 50% of the light yield observed for TPB. Figure 33 (right panel) shows a prototype prototype LEGEND-200 PEN baseplate emitting blue light when excited with a UV lamp. The PEN structure was submerged in LN2 for this test. The scintillation light emerges predominantly from the edges of the plate, which is expected from simulations and is favorable for light collection from a Ge-detector string.
PEN is commercially available as a granulate from Teijin-DuPont. It has been demonstrated that after executing proper cleaning procedures, which mainly remove surface contamination, it is sufficiently radiopure (see Tables 11 and 13) to be used within the LEGEND-1000 detector array. Nevertheless, custom synthesis of PEN is being pursued to reduce radioimpurities and improve upon its properties such as transparency, light yield, and processibility. This has led to the development of an amorphous variation of PEN, which is known as poly(ethylene-1,4-cyclohexanedimethylene-2,6-naphthalate) (PECN). The incorporation of 1,4-cyclohexanedimethylene units into the polyester backbone significantly increases the crystallization half-time and forms highly transparent amorphous material. R&D continues to purify components of PEN and PECN and screen them for radioimpurities prior to use in a custom synthesis.
Clean Additive Manufacturing
Additive manufacturing (AM) can address outstanding R&D challenges for fabrication of intricate scintillating and non-scintillating plastic components. One such AM technology which is well-suited for low-background experiments is laser-based stereolithographic (SLA) 3D printing. Unlike the commonly used fused filament fabrication method which uses a continuous filament of thermoplastic, SLA 3D printing is a contactless fabrication process where components are produced using just laser light. The SLA printing process starts with liquid resin. A laser or patterned light source shines UV light onto the resin, and the light interacts with photo-initiator molecules in the resin to generate free radicals. These free radicals solidify the resin into a polymer through free-radical polymerization. This avoids the plastic coming in contact with cutting tools, extruder nozzles, or injection molds making it ideal for producing low-background materials. The low cost and infrastructure overhead means that SLA 3D printers can be located at the experiment site, further reducing costs.
The aim is to use SLA 3D printing in the fabrication of intricate scintillating and non-scintillating plastic components for LEGEND-1000. Components under consideration include electrical connectors, detector-unit support structures, and detector-encapsulation fixtures. These materials serve not only as an active veto but also as wavelength shifters for LAr scintillation light. R&D efforts focus on performing radio assay measurements of commercial and in-house produced SLA resins, optimization of the scintillation and wavelength-shifting properties of these materials, and detector-encapsulation schemes.
Post-Production Cleaning and Validation
All materials within the experiment have construction procedures that specify the cleaning methods: controlled etching for metals or leaching for plastics. Continuous validation of methods is imperative to ensure that contamination is mitigated during production steps leaving finished parts at the high purity of the original bulk material. As an example, this need is necessary for a material like EFCu, which is initially produced at ultra-low levels of radioactive contamination. The use of EFCU is only beneficial if it is demonstrated that its chemical cleaning, processing, post-production handling protocols, and protection against surface contamination show that the purity of a full part can be maintained. Such actions have been followed through high-sensitivity ICP-MS or other assay techniques through the production cycle of the material Christofferson et al. (2018). This experience is applied to ensure that the custom clean materials described in this section can be produced and maintained at necessary cleanliness levels throughout the experiment’s assembly stages.
Commercially sourced plastics, such as PTFE and Ultem™, have been identified for multiple uses within LEGEND. While not produced in-house, these plastics can be utilized without compromising background. These plastics are of low-mass elements that are essentially radiopure and simply must be selectively cleaned to remove surface imbedded impurities that occur in the machining and molding process. Data from ICP-MS assays by the Majorana collaboration show that if the components are heavily leached in nitric acid after machining and stored in a controlled N2 environment, the plastics remain as clean as the bulk material. Further assay and -counting data have shown that not only must plastics be cleaned prior to use for contamination reduction, but subsequent handling is of greater importance in reducing Rn plate out, leading to contamination with Rn progeny. Plastics fabrication will follow detailed cleaning and handling procedures prior to their use in the experiment, ensuring that additional contamination is not introduced to the clean starting materials.
V.2.2. Material Screening
To ensure the radiopurity required by the background model of all relevant construction and active materials, an aggressive assay program will be followed. Activities will include the selection of candidate materials, the development of material handling, surface cleaning, and clean assembly procedures, the evaluation of impurities that may accumulate on surfaces during construction, and the purification of gases for use in clean environments.
Typically, the 238U and 232Th chains have several pathways of contaminating a material. A range of material screening methods and instruments are necessary to fully qualify a material for low-background use. As an example, the 238U chain can be divided into three subchains. The first subchain contains the long-lived U and Th isotopes found in the bulk of terrestrial materials, which may be assayed with high precision down to a sub-ppt242424ppt = parts per trillion, 10-12 g/g level by applying high-sensitivity ICP-MS techniques LaFerriere et al. (2015). In the second subchain, one finds 226Ra, 222Rn, and its short-lived progeny, which are heavy metals that easily attach to aerosols and deposit on surfaces (the so-called Rn plate-out effect). If not supported by 222Rn, these isotopes decay away within about three hours. Activities in this part of the chain may be investigated either by application of high-sensitivity -ray spectrometry Neder et al. (2000) or high-sensitivity 222Rn emanation techniques Rau and Heusser (2000); Zuzel and Simgen (2009); Zuzel (2005). The final 238U subchain contains the long-lived 222Rn progeny, specifically 210Pb, 210Bi and 210Po, which may be responsible for serious surface activity. Their activities may be present over the duration of the experiment, due to the long half-life of 210Pb (22 yr), yet may not show up immediately due to the ingrowth rate of 210Po (138 d). The long-lived 222Rn progeny (present in the bulk material and on the surface) may be assayed using large-surface, low-background spectrometers Zuzel et al. (2017); Zuzel (2019); Zuzel et al. (2018) or applying appropriate chemical procedures to separate Po from the bulk material with subsequent -counting of its activity Mroz (2019).
Because U, Th, and Ra elements have different chemical properties, materials which undergo some production processes are usually enriched or depleted in Ra relative to the amount of elemental U contained. Therefore, it is not recommended to extract the specific activities of 226Ra (and 222Rn) from ICP-MS measurements. Additionally, due to the 22-yr half-life of 210Pb, there can be disequilibrium between the short- and the long-lived 222Rn progeny. As a result, it is usually not possible to predict the activities in the 210Pb–210Po sub-chain from only the high-sensitivity 222Rn emanation measurements. To predict the background rate in the experiment caused by a specific element of the detector, it is necessary to assay each part of the chain separately. For experiments like LEGEND-1000, the most important are the long-lived decay products from 226Ra and 222Rn. Therefore, strong emphasis has been placed on developing high-sensitivity -ray spectrometers in addition to Rn emanation techniques, as well as spectroscopy capabilities.
The LEGEND collaboration has significant expertise in ultra-low background experiments Heusser (1995); Peurrung et al. (1997); Amsbaugh et al. (2007); Agostini et al. (2014, 2015c, 2017b); Freund et al. (2016); Abgrall et al. (2016); Lubashevskiy et al. (2018); Busch et al. (2018) improved on through past assay campaigns. However, each new phase of an ultra-low background project has new specific challenges. That experience will be relied upon to identify, address, and mitigate the material purity challenges anticipated throughout the fabrication and installation of the LEGEND-1000 experiment. The assays are organized into five main areas: mass spectrometry, direct -ray counting, neutron activation analysis, surface assay (contamination with long-lived Rn progeny), and Rn emanation (determination of Ra/Rn and the short-lived progeny).
| Institution (Location) | Instrument | 238U Sensitivity [ppt] | 232Th Sensitivity [ppt] |
| PNNL (USA) | ICP-MS | 0.01 | 0.02 |
| LBNL (USA) | ICP-MS | 0.1 | 0.06 |
| ORNL (USA) | ICP-MS | 10 | 10 |
| VR Inc. (USA)252525VR Analytica, Bend, OR, USA; http://www.vranalytical.com | ICP-MS | 20 | 20 |
| LNGS (IT)/TUM | ICP-MS | 0.01–10 | 0.01–10 |
| UCL (UK) Dobson et al. (2018) | ICP-MS | 0.1 | 0.1 |
| Comenius Univ. (SK) | AMS | 0.1 | 0.1 |
Mass Spectroscopy Analysis
Glow Discharge Mass Spectroscopy (GD-MS), Inductively-Coupled Plasma Mass Spectrometry (ICP-MS), and Accelerator Mass Spectrometry (AMS) are sensitive methods where a small amount of material (of the order 1 g) is processed. Application of these methods makes it possible to detect 238U and 232Th but not their decay products. Also, 40K cannot be detected directly, whereas concentrations of 39K are measured, and the 40K content is assumed based on its natural abundance of 0.0117%. Glow Discharge Mass Spectroscopy is useful for electrically conductive samples and requires very little sample preparation since the surface can be sputtered cleanly. Sensitivities down to the order of 1 ppt can be achieved for high mass elements such as U and Th. In general, samples for ICP-MS analysis need to be prepared as solutions. This requires preparations of solids through sample digestions. For the most sensitive measurements, chemical separation of matrix elements is required. For the utmost in accuracy and precision, isotope tracer dilution methods are preferred to account for sample preparation effects on the analyte during sample processing as well as plasma perturbations and instrument drift during analysis. Further, samples must be prepared in validated containers and clean room conditions to avoid cross contamination. In Accelerator Mass Spectroscopy, the ions are accelerated to high kinetic energies before mass analysis. This makes separation of masses very effective, and even rare isotopes may be decoupled from an abundant neighboring mass. Sensitivities down to 10-16 g/g may be reached for determination of 238U and 232Th contents. Noble Gas Mass Spectroscopy is used to measure residual (down to ppq in term of gas volume ratio Lindemann and Simgen (2014)) concentrations of noble gases in a carrier gas. Mass spectroscopy facilities available to LEGEND, including the instrument sensitivites to the 238U and 232Th chains, are listed in Table 8.
-Ray Counting
Low-background -ray counting is a sensitive method to look for radioimpurities without the samples being destroyed. The process comprises a sample measured with low-background Ge detector, often operated within a multilayer shield with Rn exclusion and located deep underground. A -ray assay is sensitive to the decay products of 238U and 232Th as well as 40K and 60Co. Table 9 lists the sensitivities given as a 238U and 232Th equivalent (assuming secular equilibrium in the chains). The most sensitive instruments are operated at LNGS by the Max Planck Institute for Nuclear Physics in Heidelberg, reaching sensitivities of 10 Bq/kg Neder et al. (2000).
| Detector | Location | Crystal type | 238U Sensitivity | 232Th Sensitivity | Owner |
| [mBq/kg] | [mBq/kg] | ||||
| Morgan | SURF (USA) 4300 m.w.e. | 2.1 kg p-type | 0.2 | 0.2 | Berkeley |
| Maeve | SURF (USA) 4300 m.w.e. | 1.7 kg p-type | 0.1 | 0.1 | Berkeley |
| Mordred | SURF (USA) 4300 m.w.e. | 1.4 kg p-type | 0.7 | 0.7 | USD/Berkeley |
| Various | LNGS (IT) 3500 m.w.e. | various | 0.01–0.1 | 0.01–0.1 | LNGS/MPIK-HD/UHZ |
| Various | Bulby (UK) 2805 m.w.e. | various | 1 | 1 | UCL |
| Obelix | LSM (FR) 4800 m.w.e. | various | 0.1 | 0.1 | JINR, IEAP, CTU |
| Various | HADES (BE) 500 m.w.e. | various | 0.1 | 0.1 | JRC Geel |
Neutron Activation Analysis
For materials such as hydrocarbons with no long-lived neutron activation products, instrumental neutron activation analysis (NAA) can achieve substantially greater sensitivity than direct -ray counting. In this technique, samples are irradiated with neutrons from a nuclear reactor. When the neutrons are captured on 238U/232Th, the 239Np/233Pa isotopes are generated. After irradiation, the samples are counted by -ray spectrometers to search for characteristic lines at 106 keV and 312 keV from decays of 239Np and 233Pa, respectively. Using known or calibrated neutron capture probabilities, neutron flux, irradiation time, -ray detector efficiencies, and sample mass, the concentrations of 238U and 232Th in a sample can be calculated. In Table 10, facilities suitable for NAA and available to LEGEND are listed.
| Location | Name | Neutron Flux | 238U Sensitivity | 232Th Sensitivity |
| (Power) | n/cm2/s | [ppt] | [ppt] | |
| ORNL (USA) | HFIR (85 MW) | 4.01014 | 0.4 | 0.025 |
| UC-Davis (USA) | MNRC (2 MW) | 1.51013 | 0.4 | 0.09 |
| NC (USA) | PULSTAR (1 MW) | 6.01012 | 2.8 | 0.8 |
| TUM (DE) | FRM II (20 MW) | 1.01014 | 0.1 | 0.1 |
| Pavia (IT) | TRIGA Mark II | - | 0.1–1 | 0.1–1 |
Surface Assay
Exposure to environmental Rn during fabrication, assembly, and installation of a low-background system can lead to buildup of 210Pb on surfaces. 210Pb, which has a 22-yr half-life, will act as an approximately constant source of radiation (from self decays and from decays of 210Bi and 210Po) throughout the full life of an experiment. Sensitive surface and bulk assay of 210Po can be carried out within the LEGEND collaboration using XIA262626XIA LLC, Oakland, CA, USA; https://xia.com/ UltraLo-1800 large-surface low-background spectrometers. Large-surface spectrometers allows for samples to be investigated with respect to their natural bulk and surface contamination with bulk 210Po sensitivities down to about 50 mBq/kg Zuzel et al. (2017) and surface contamination as low as 1 mBq/m2. The spectrometer also allows investigation of the efficiencies of various surface cleaning procedures for the removal of long-lived 222Rn progeny Zuzel et al. (2018), while measurements from higher specific activities (222Rn-spiked samples) may be studied using low-background semiconductor particle spectrometers Christofferson (2019); Guiseppe et al. (2018); Zuzel and Wójcik (2012); Zuzel et al. (2012).
Radon Emanation
Rn emanation from detector components represents an additional pathway of backgrounds in ultra-sensitive experiments and one considered for LEGEND-1000. One of the most sensitive methods of Rn detection is based on application of ultra-low-background proportional counters, which in combination with Rn pre-concentration allow for detection of activities as low as 30 Bq Rau and Heusser (2000); Zuzel and Simgen (2009); Zuzel (2005). Other systems dedicated to Rn emanation studies are based on electrostatic detectors with detection limits in the range of 1 mBq.
V.2.3. LEGEND-1000 Component Activities
The candidate materials used to construct the LEGEND-1000 experiment are selected based on their functional requirements and a certification of an acceptable purity levels. Material screening is performed by the collaboration using the methods and facilities described in Sect. V.V.2.V.2.2. The reference materials initially certified for use in LEGEND-1000 are listed in Table 11, which also states the material screening method used to qualify the component. Many of the candidate materials were used by either the Majorana Demonstrator or Gerda experiments, though a continued pursuit of cleaner materials remains. These measured activity levels and component masses are used as an input to the background projection effort discussed in Sect. V.V.4.
| Component | Isotope | Estimated Activity | Quantity | Total Activity | |||
|---|---|---|---|---|---|---|---|
| Cabling - HV | 238U | Bq/kg (i) | 0.2 | kg | Bq | ||
| 232Th | Bq/kg (i) | Bq | |||||
| Cabling – Signal | 238U | Bq/kg (i) | 0.2 | kg | Bq | ||
| 232Th | Bq/kg (i) | Bq | |||||
| Detector Mount (EFCu) | 238U | Bq/kg (i) | 16 | kg | Bq | ||
| 232Th | Bq/kg (i) | Bq | |||||
| Detector Mount (Ultem™) | 238U | Bq/kg (g) | 0.4 | kg | Bq | ||
| 232Th | Bq/kg (g) | Bq | |||||
| Optical Fibers | 238U | Bq/kg (i) | 15.0 | kg | mBq | ||
| 232Th | Bq/kg (i) | mBq | |||||
| Front End ASIC | 238U | mBq/kg (g) | 0.13 | g | Bq | ||
| 232Th | mBq/kg (g) | Bq | |||||
| PEN Plates | 238U | Bq/kg (g) | 2.0 | kg | Bq | ||
| 232Th | Bq/kg (g) | Bq | |||||
| HV Connector (Ultem™) | 238U | Bq/kg (g) | 0.04 | kg | Bq | ||
| 232Th | Bq/kg (g) | Bq | |||||
| HV Connector (Ph-Br) | 238U | Bq/kg (i) | 0.10 | kg | Bq | ||
| 232Th | Bq/kg (i) | Bq | |||||
| FE Mount (Ultem™) | 238U | Bq/kg (g) | 0.08 | kg | Bq | ||
| 232Th | Bq/kg (g) | Bq | |||||
| FE Mount (Ph-Br) | 238U | Bq/kg (i) | 0.10 | kg | Bq | ||
| 232Th | Bq/kg (i) | Bq | |||||
| CAPs272727Cable Attachment Positions: regions above each detector array with cabling interconnects, SiPMs, and support structures. (Various) | 238U | Bq ea. (g) | 4 | units | mBq | ||
| 232Th | Bq ea. (g) | mBq | |||||
| Re-entrant Vessels (EFCu) | 238U | Bq/kg (i) | 800 | kg | mBq | ||
| 232Th | Bq/kg (i) | mBq | |||||
| Reflectors (Tetratex/TPB) | 238U | Bq/m2 (g) | 10 | m2 | mBq | ||
| 232Th | Bq/m2 (g) | mBq | |||||
V.3. Data Reduction and Analysis Techniques
V.3.1. Software Framework and Analysis Routines
The primary data-processing and analysis routines will follow the same procedures implemented in the Gerda and Majorana Demonstrator experiments, with some low-level improvements implemented for LEGEND-200. Detector signals recorded by the DAQ will be converted into an on-disk format based on HDF5 282828HDF5 Group, http://www.hdfgroup.org/solutions/hdf5, a robust, portable, scientific data format designed for supercomputing applications with large amounts of data. The digital-signal processing (DSP) routines will be implemented using tools and high-performance standard libraries written in Python292929Python Software Foundation, https://www.python.org, NumPy303030NumPy, https://numpy.org, Numba313131Numba, http://numba.pydata.org/, and Julia323232Julia Project, https://julialang.org and will incorporate parallel-processing capabilities. The chief DSP routines will include:
-
•
Digitizer ADC nonlinearity correction based on integral-nonlinearity lookup tables Abgrall et al. (2021).
-
•
Deconvolution of the high-pass components of the electronics response function with multi-pole-zero corrections.
-
•
Offline re-triggering to optimally determine pulse onset times and pileup cases with trapezoidal filters Jordanov and Knoll (1994).
- •
- •
- •
-
•
Data cleaning based on characterization and monitoring of noise and baseline leakage current as well as discrimination of physics pulses from triggers on baseline fluctuations, transients, and other non-physics sources Agostini et al. (2012).
A strict blinded analysis policy will be implemented. All events with energy falling within a wide energy window around will be identified through a very rough energy estimation performed by the DAQ hardware. All evidence of the existence of those events will be removed from the blinded data files, while the original files including those events are stored in a protected area to which collaborators do not have access prior to unblinding at the end of the analysis. Data will be stored and synced among computing centers and processed in Docker333333Docker.com, https://www.docker.com/ virtual environments, ensuring long-term data preservation and redundancy.
The data will be cleaned of non-physical events and data quality assessed through careful monitoring of multiple parameters. Weekly calibration runs will be used to optimize the DSP routines and also to tune parameters derived from the DSP and assess their uncertainties. The associated metadata will be managed using light-weight database tools centered around JSON343434JSON.org, https://www.json.org file repositories managed using Git.353535GIT Project, https://git-scm.com The high-level data are built into event structures that can be used to identify coincidences and perform multivariate spectral analyses. Advanced techniques based on machine learning may be implemented at several steps in this process.
V.3.2. Multivariate Analysis
As described in Sect. IV.IV.1.IV.1.3, in addition to the all-important energy variable, the LEGEND-1000 detector provides multiple extra analysis handles for separating signal from background, based on pulse shape analysis, detector coincidences, and timing information. In this section we discuss in more detail how each of these characteristics are used in the analysis.
Energy
Energy is estimated for every Ge-detector signal using optimized filters as described in Sect. V.V.3.V.3.1. In detectors showing significant charge trapping, a small correction is applied using the DSP parameters characterizing the amplitude of the charge collection or the correlated presence of delayed charge. After this correction, the energies have a variance that is dominated by the Fano contribution, and the detector response function is very well characterized by the dominantly Gaussian function described in Sect. IV.IV.1.IV.1.2. The energy scale and resolution of each detector is extracted from weekly calibration data and monitored regularly by injecting test pulses, permitting spectral analyses in which each event is treated independently and comes with specific systematic uncertainties Agostini et al. (2021e). Such analyses are powerful for identifying a rare signal with a handful of events. High-dimensionality spectral fits treating each detector independently also provide a strong handle on identifying and characterizing backgrounds with spatial variations and will be pursued in the LEGEND-1000 background analysis.
Timing
Event-timing information is obtained essentially without effort from the DAQ system, since the DAQ records detector signals with sub-s triggering precision. Within the recorded traces, pulse-shape analysis can further extract signal start times with precision on the order of 10 ns. This information allows us to tag time-correlated background events as well as properly treat background contributions with a time-varying rate. Experience from Gerda and the Majorana Demonstrator indicate that some backgrounds, such as Bi-Po coincidences in the U/Th decay chains or rapid decays of cosmogenic activation products generated in-situ, can be identified and removed using simple cuts with high efficiency and negligible live time impact Csáthy et al. (2016). The independent detection of neutron capture on 40Ar allows an improvement to the tagging efficiency for muon events with accompanying isotope production, leading to reduced muon-induced background as discussed in Sect. V.V.4.V.4.7 and based on Ref. Wiesinger et al. (2018). An example of a background with a time-varying rate is 68Ga events, the decay daughter of 68Ge which is generated by cosmogenic activation of the detectors during manufacturing and shipping. An analysis accounting for the exponentially decreasing rate of 68Ga events following the half-life of 68Ge allows for the separation of this background from a potential signal. 68Ga background is also preceded within a few hours by an x-ray from the decay of 68Ge. When such a candidate X-ray is identified, subsequent events in the same detector can be vetoed for several half-lives of the 68Ga decay, potentially achieving a factor of 5 to 10 reduction in this background source. The live time loss due to such a veto can be optimized based on the rate of 68Ge decay x-rays observed in the data.
Detector Coincidences
Event coincidences are also obtained without effort from the DAQ system, which records every signal above threshold occurring within a short (10 s) time window in the Ge detectors, the LAr SiPMs, and the PMTs in the water tank. The LEGEND design purposefully minimizes the use of opaque/passive materials, creating a local environment in which coincident depositions are almost always detected. The tagging of rays using coincidences is significantly enhanced if additional energy from the parent decay ( or component) is deposited in another detector component. This is the case for decays inside the LAr, the optical fibers, the PEN holders, or even a cosmogenic background in another Ge detector. On the other hand, surface contaminations of and emitters generate little energy deposition in the LAr and do so in a region that is well-shadowed, thus exhibiting fewer detectable coincidences.
Since decay events are isolated to single Ge crystals, it is almost always optimal to leverage coincidence information in the analysis in the form of an anti-coincidence cut, since essentially 100% of the coincidences arise due to backgrounds. The performance of the LAr veto cut has been successfully demonstrated in Gerda following the same design concept (see Fig. 7 and 15). As an example, a more than three orders of magnitude suppression was achieved for a 228Th source in Ref. Agostini et al. (2015c) using a simple cut-based analysis. However, amplitude and hit pattern information in those coincidences can also be used in a full multivariate analysis to help identify, isolate, and constrain those background contributions, and this will be pursued in the full LEGEND-1000 background analysis.
Ge detector topology reconstruction

Ge detectors are effectively solid-state time projection chambers. Clusters of electrons and holes are created when energy is deposited in the Ge material and then collected through an electric field. The small size of the readout electrode of the ICPC detectors ensures that a strong current signal is induced as the holes approach it. Events with a single-site energy deposition such as those expected by decays will generate a single-peak current signal. Background events due to multi-site Compton-scattered rays will instead exhibit a multi-peak structure. These two typologies of signals are shown on the left and right top panels of Fig. 34, respectively. The ns-scale time-resolution allows the resolution of current peaks generated by clusters which are created only a millimeter apart. A highly sensitive parameter to discriminate single- from multi-site events is the maximum current of the pulse. The maximum current is easily computed from a smoothed derivative of the digitized waveforms. Then, either the variable can be normalized by energy (as in the case of the parameter used by Gerda Budjas et al. (2009)) or its energy variation can be treated more generically (with the parameter used by Majorana Alvis et al. (2019c)). Suppression of or relative to the value typical for single-site events thus indicates the presence and degree of multiple interaction sites in an event.
Figure 35 shows the distributions of the parameter for a selection of event samples. Double-escape peak events are mostly single-site and serve as a good proxy for decay. Compton-continuum events include a significant component of multi-site events, while full-energy peak events are mostly multi-site. These stark differences in spectra can be leveraged in multi-variate analyses to discriminate signal from background and strongly constrain possible background sources. A simple cut in , for example, can reject 90% of the events in full-energy gamma lines and 95% of multi-site single-escape events while retaining 90% of -decay-like events Budjas et al. (2009); Alvis et al. (2019c).
The maximum current can also be used to identify events resulting from energy depositions on the detector surface. These events can be divided into two groups. Energy depositions on the Li-diffused electrode that covers most of the detector results in a cluster of holes that undergoes a s-scale diffusion process in which only a fraction of the holes produced reaches the active volume over an extended timescale. The result is a mm-scale elongation of the hole cluster, and, in turn, a broader current peak and hence lower value of compared to point-like clusters in the Ge bulk. Conversely, energy depositions on the readout electrode are characterized by a signal driven by the cluster of electrons that moves twice as fast as the holes. This creates a stronger current peak. Both topologies of signals are shown in the bottom panels of Fig. 34, and the distribution for events in Gerda is shown in Fig. 35. Pulse-shape discrimination of these surface events based on the method is at the level of or better.
Although the method alone is sufficient to reach the LEGEND-1000 background goals, additional improvements can be made using information in the waveform beyond the current peak. Delayed-charge collection occurs at low levels in every pulse due to the slow release of charges from trapping sites populated by the primary charge cloud during its drift. In some detectors, this signal is strong enough to provide an estimate of the total amount of trapped charge in the event, which then can be used to correct event energies for charge-trapping losses, improving resolution. A stronger source of charge trapping is the detector passivated surface, where trapping sites like charge impurities and crystal defects are abundant. A “delayed charge recovery” (DCR) parameter able to identify the faint current induced by these delayed charges was successfully used in the Majorana Demonstrator to identify and remove -decay events on the surface of PPC detectors which have larger passivated surfaces Arnquist et al. (2020b). Such discrimination could be applied in LEGEND-1000 to achieve further background suppression beyond what is assumed for our background model.
It is also possible to extract even more detailed interaction-location information from the Ge pulses. The leading edge of a pulse records the history of how the drifting charges traversed the detector’s weighting potential. This information can be inverted to reconstruct the location of the interaction site from which the drift started. Initial studies with Majorana Demonstrator PPC detectors indicate that interaction sites can be localized with sub-mm resolution in distance from the point contact and 1-mm resolution in the transverse radial direction. Although we do not require these methods to reach LEGEND-1000’s background goal, we plan to explore these options further to help gain further sensitivity out of the LEGEND-1000 data.
V.3.3. Efficiencies and Systematic Uncertainties
As mentioned above, the LEGEND-1000 detectors provide an abundance of event-topology information beyond just the event energy. However, for ultra-faint signal levels at the very edge of the experiment’s reach, the signal will not have sufficient statistics to be constrained by any analysis variable besides energy. All of the signal sensitivity then comes from the relative count of events within a FWHM or so of with respect to the rate of background events in surrounding energies, and the primary effect of the other analysis variables is the assignment of low or high signal likelihood to those events. Thus, the ultimate sensitivity of LEGEND-1000’s multivariate analysis can be well approximated by a simple analysis based on the application of cuts in each variable. We adopt this approach in planning purposes for LEGEND, as it provides a straightforward and efficient means of computing the background impact of design changes and their ultimate effect on sensitivity. This in turn leads to lower risk, as it decouples our sensitivity estimates from our ability to maximize a high-dimensionality likelihood function with a very low statistics dataset, which itself is a significant challenge Buuck (2019).
For LEGEND-1000 background and sensitivity estimates, we assume just two basic cuts, as introduced in Sect. IV.IV.1.IV.1.3. The first is an AC cut, in which events which generate any coincident signal in the LAr, the water veto, or in multiple Ge detectors are rejected as background. The second is a PSD cut, in which a cut on the parameter is used to remove multi-site events and surface events from and decays. Although time-varying backgrounds, time coincidence searches, delayed charge identification, and ionization localization will certainly be pursued in the full LEGEND-1000 analysis to achieve the lowest ultimate background and maximize sensitivity, in this document we conservatively do not rely on any of these variables for removing background. This makes our background estimates conservative with known room for improvement.
Of the two primary cuts, only the PSD cut has a significant impact on the signal efficiency. Double-escape peak (DEP) events from the 208Tl 2614-keV ray from calibration-source data can be used as signal proxies to extract the peak in for single-site events. The cut is then tuned to keep a large fraction of the DEP peak, with 90% being very close to optimal, since this is roughly the fraction of decay events that do not generate bremsstrahlung photons that lead to a multi-site topology nor lie too close to the point contact so as to generate a sharp surface-like signal. The dominant multi-site background near that is removed by this cut is from Compton scatters of higher-energy rays, which are reduced by a factor of 2–3. Surface decays are very strongly discriminated by this cut. All 210Po events observed in Gerda were removed by the PSD cut, and an upper limit for their survival probability of 0.16% (90% CL) was established. Slow pulses from 42K-decay betas traversing the Li-diffused outer contact are also very efficiently rejected by this cut with survival fractions at the 1% level.
For the sensitivity estimates in this document, we assume a 90% combined efficiency for the AC and PSD cuts to retain decay signal events. For accuracy of the simplified Poisson-counting analysis, we also have to account for the 95% efficiency of a 2 energy cut around that optimizes the width of the energy ROI for a quasi-background-free experiment Agostini et al. (2017a). The energy cut also effectively removes signal events in which not all of the energy is collected by the detector. This includes approximately 8% of events which originate in the outer 1 mm n+ contact and thus suffer significant energy loss, giving an active volume fraction of 92%. The energy cut also removes an additional 8% of events which originate inside the active volume but whose emitted particles at least partially traverse the dead regions, where their energy depositions do not contribute to the signal, or generate bremsstrahlung photons that leave the active region. This loss is represented by a 92% “containment” efficiency. With exposure defined in terms of the total mass of Ge in the experiment, an additional efficiency factor capturing the level of isotopic enrichment is included.
Systematic uncertainties in this simplified analysis picture arise only in the estimates of the efficiencies and in the overall exposure of the experiment. The analysis cut efficiency uncertainty dominates at the few percent level, as pulse shape simulations must be used to translate the efficiencies observed in DEP events from 208Tl to decay events. The latter have a more uniform spatial distribution in the detector and lie at higher energy, with continuous individual energy spectra for the emitted particles. Uncertainties in the active volume fraction and the containment efficiency are at the percent level and are dominated by uncertainty in measurements of the dead-layer thickness. The containment efficiency also includes sub-dominant contributions from imperfections in the Monte Carlo modeling of ranges and bremsstrahlung production. Uncertainties in the enrichment fraction, and in the livetime estimates and total mass measurements that go into the exposure calculation, are all well below the percent level and are negligible. Uncertainties in energy are governed by the uncertainties in the detector-resolution function shape and its energy and time dependence as described above, which are typically on the order of 0.1 keV or less. This translates to a negligible ROI cut efficiency uncertainty. The total systematic uncertainty is % and is mostly irrelevant unless a strong signal is observed in LEGEND-200, in which case LEGEND-1000 would collect hundreds of signal counts. A full multivariate analysis would result in a modest increase in systematic uncertainty that comes with the benefit of a small boost in sensitivity.
V.4. Background and Sensitivity Projections
The comprehensive background projection for LEGEND-1000 is derived from high-fidelity Monte Carlo simulations and detailed detector response models. A summary of the background projections is given in Sect. IV.IV.1.IV.1.4, which includes a chart of the expected background contributors shown in Fig. 18. This section presents a more detailed description of the inputs, tools, analysis methods, and the major background components that lead to the total anticipated background index of cts/(keV kg yr).
V.4.1. Simulation Inputs and Methods
Each material considered in constructing the LEGEND-1000 background model has been assayed for radioactive impurities (see Sect. V.V.2.V.2.2 for a description of the material screening techniques), and several of these materials are in use by either the Majorana Demonstrator or Gerda experiment. The lowest-background material appropriate for each purpose has been selected from among those presently in use, and their activities are summarized in Table 11 in Sect. V.V.2.V.2.3.
Extensive Monte Carlo simulations of the LEGEND-1000 design are performed using MaGe Boswell et al. (2011). MaGe is a Geant4-based Agostinelli et al. (2003) simulation framework jointly developed by the Gerda and Majorana Collaborations, which has been successfully used in the modeling of the backgrounds in both experiments. For this report, backgrounds are simulated for the full LEGEND-1000 array based on the baseline technical design.
Radioactive decay backgrounds originating from the following sources were simulated in MaGe based on their activities tabulated in Table 11:
-
•
A total of 392 identical enriched Ge detectors with the average mass of 2.6 kg. See Fig. 12 for the arrangement of the Ge detectors in the array.
-
•
EFCu and Ultem™ polyetherimide mounting hardware with PEN baseplates, and Ultem™ and phosphor bronze electronic and cable mounting hardware (see Fig. 23).
-
•
Low-mass ASIC-based front-end electronics mounted on a signal readout board (see Fig. 31).
-
•
Signal and high-voltage cabling spanning the distance between each individual detector and the interconnects at a region called the Cable Attachment Positions (CAPs) above each module’s detector array.
-
•
Inner and outer optical fiber curtains encompassing the ring of detector strings. See Fig. 28 for the arrangement of the fiber curtains.
-
•
The CAPs region above each detector array representing cabling interconnects, SiPMs, and support structures.
-
•
The Cu reentrant tubes that encapsulate the UGLAr volume. See Fig. 12 for the arrangement of the reentrant tubes.
Radioactive decays are simulated uniformly throughout each of the components and, in some cases, uniformly across component surfaces. Particle steps that result in energy deposition in active materials (Ge, LAr, PEN, optical fiber) are recorded. Post-processing is applied to model the observables necessary for analysis cuts. For this report, we only model the use of AC and PSD cuts. Other analysis variables such as timing information will lead to improved sensitivity but are not used here.
As described in Sect. IV.IV.1.IV.1.3, the AC cut comprises the following: the granularity cut, which removes events triggering multiple Ge detectors; the LAr veto cut, which removes events producing scintillation in active materials (LAr, PEN, optic fibers) that trigger the SiPMs; and the external water Cherenkov muon veto cut. Events which produce coincidences in the Ge detectors or the SiPMs within a fixed time window (200 s in the model presented here) are removed by the AC cut. The water Cherenkov muon veto is not currently modeled in the post-processing; this only impacts muon-related events, which are treated independently.
The modeling of the granularity cut is achieved by requiring only one Ge detector to have any non-zero energy deposition after the energy corrections described below; the result is insensitive to the application of energy thresholds up to 10 keV. To accurately model the LAr veto, separate optical simulations have been performed in MaGe to calculate the conversion probability of a VUV scintillation photon to the visible spectrum in wavelength-shifter-coated materials. This is followed by the coupling of optical photons into fibers and detection in the SiPMs. For each set of scintillating materials, a three-dimensional spatial map of photon detection probabilities is generated (see Fig. 36 for an example). For each energy deposition in these materials, the expected number of photo-electrons generated in the SiPMs is calculated from the scintillation yield of the material (LAr: 20 /keV, PEN: 5.0 /keV, fibers: 8.0 /keV) and the probability of photon detection from the location of the energy deposition in the map. The expected number of detected photons is then summed for the whole event.


The use of three-dimensional maps to describe the LAr veto cut performance has been successfully demonstrated in Gerda which follows the same design concept for the LAr veto and Monte Carlo post-processing Wiesinger (2020); Pertoldi (2021).
The PSD cut is simulated with a multi-step post-processing procedure. First, energy depositions within the 1-mm partially-inactive transition region of the n+ high-voltage electrode are corrected for reduced charge collection efficiency or removed, depending on the deposition’s distance from the surface. The remaining energy depositions are summed within each detector, and an energy resolution function is applied to smear the energies. Energy depositions within each detector are then accumulated into spatially localized clusters. For each cluster, a charge drift time is calculated using a drift-time map independently calculated using siggen.363636Software for the field and signal generation in Ge detectors. https://github.com/radforddc/icpc_siggen Clusters that are separated in drift time by more than an energy-dependent threshold (approximately 25 ns at 1 MeV) are rejected as multi-site, simulating the effect of the PSD cut. This pulse-shape emulation technique has been previously used in the Majorana Demonstrator with reasonable accuracy at the decay energy region. PSD post-processing of Ge surface interactions has not yet been implemented in the full LEGEND-1000 Monte Carlo simulations. Rejection efficiencies for and surface events are inserted manually based on observations in characterization data and validations in stand-alone simulations.
V.4.2. Internal 238U, 232Th, and 40K Contaminations in the Array
Because of their long half-lives and natural abundances, 238U, 232Th, and 40K of terrestrial origin are expected to be present in trace quantities in the materials used in the fabrication of all experimental components. The 238U and 232Th chains decay through a series of unstable, shorter-lived progeny until arriving at 206Pb and 208Pb, respectively. Of primary concern for decay searches are 214Bi and 208Tl decays, each of which produce rays of sufficiently high energy to Compton scatter near the region at 2039 keV. Although it is not a direct background for decay at 2039 keV, the 1461-keV ray from the decay of 40K can impact the -decay spectral analysis and can also hinder the performance of analysis cuts based on signals at lower energies. This section considers only backgrounds from 238U, 232Th, and 40K decays occurring in the components that define each of the detector arrays; external backgrounds from the cryostat walls and beyond are covered separately in Sect. V.V.4.V.4.6.
For each component group included in the MaGe model, the full 238U- and 232Th-decay chains are simulated assuming secular equilibrium, with decays generated uniformly throughout the component volumes. It is possible, however, that secular equilibrium in the 238U- and 232Th-decay chains may be broken. When direct assays of the bottom halves of the chains (Ra and below) are available, they are therefore preferred as more direct measurements of the activities of 214Bi and 208Tl, the leading contributors to the background index from these chains. The efficiency at which a decay generates an event at is calculated from the post-processed simulation output and scaled by the material activities and component masses listed in Table 11.
The 2.6-kg average detector mass considered in the LEGEND-1000 baseline design reduces backgrounds from components that scale with channel count (cables, front-ends, plastic insulators). Additionally, the adoption of ASIC-based front-end readouts and low-background flex cables for signal and high voltage provide significant background reduction from these components. Finally, the reduced background from 42Ar/42K (see Sect. V.V.4.V.4.4) allows for the elimination of nylon shrouds used to limit K-ion drift in Gerda and LEGEND-200.
Figure 37 (left) shows the sums of expected 238U chain, 232Th chain, and 40K backgrounds from all internal components of the detector array after each analysis cut stage: Before cuts, after the AC cut, and after applying both the AC cut and the PSD cut. The combination of analysis cuts provides very strong suppression of both 238U- and 232Th-chain events in the decay region. With 208Tl decays releasing 5 MeV of decay energy and 214Bi releasing 3.2 MeV, approximately 2 MeV must be deposited in a single detector with the remainder left in inactive (not Ge, LAr, PEN, or fiber) volumes for those decays to contribute to the background index at . The low-mass design of the array minimizes inactive volumes effectively, ensuring that energy depositions in active regions are highly likely. The AC cut rejects greater than of 232Th-chain backgrounds (208Tl) and greater than of 238U-chain backgrounds (214Bi), depending on the source volume and location.
For those events that are not rejected by the AC cut, the PSD cut is particularly effective. These events have a high likelihood of multiply scattering within a detector, as only -ray interactions confined to a single Ge detector survive the AC cut. The drift-time heuristic PSD emulation predicts a 5–25% survival probability for 238U-chain backgrounds that pass the AC cut and a 2–20% survival probability for 232Th-chain backgrounds. The cuts are less effective in rejecting events from the Ultem™ detector holders than the other components owing to their direct contact with the detector surfaces. The cut performance estimated with the simulations are consistent with the experimental values obtained in Gerda and Majorana. Not included in the figure, though included in the overall background index tabulation, are the contributions from 238U and 232Th contamination within the bulk of the Ge detectors. A preliminary analysis of the full-exposure Gerda dataset has shown no evidence of 238U or 232Th contaminants in the Ge detectors, from which upper limits of nBq/kg in each isotope have been derived. These upper limits on the 238U- and 232Th-chain activities are assumed to hold for the LEGEND-1000 purified Ge material.
Neutrons can also be generated in 238U and 232Th chains due to (,n) reactions and spontaneous fission. Due to the extra-low radioactivities of all internal components, their contributions are estimated to be negligible. Components that are more massive and less clean are the dominant radiogenic neutron contributors in LEGEND-1000, but they are far away from the Ge detectors; their contributions are discussed in Sect. V.V.4.V.4.6.
V.4.3. Cosmogenic Isotopes in Ge
Cosmic-ray exposure of the enriched Ge material and fabricated detectors leads to the production of 60Co and 68Ge in the detector volume. Production of these isotopes is mitigated though control of cosmic-ray exposure throughout the production and transportation of the enriched material and detectors, as described in Sect. V.V.1.V.1.2.
At sea level, 60Co is produced in enriched Ge material at a rate of 2.55 atoms/(kg d) Elliott et al. (2010). The zone-refining and crystal-pulling processes effectively remove the 60Co produced in the feedstock, but once detector fabrication is complete, subsequent cosmic-ray exposure leads to the accumulation of 60Co. The decay of 60Co has a value of 2.8 MeV and of 5.3 yr, and includes the emission of coincident 1173-keV and 1333-keV rays. The combined effect of the two rays can contribute background at 2039 keV in the case of one or more Compton scatters leaving partial energy deposition. The particle with endpoint energy of 318 keV can also contribute to the background signature, leading to a high-energy tail attached to each of the peaks. For background estimation purposes, we assume 20 d of sea-level cosmic-ray exposure following the detector fabrication process, followed by a cool-down period underground prior to data taking. The cosmogenic activity of each detector varies as LEGEND-1000 ramps up its data taking in phases and operates over 10 yr to reach the total exposure goal. Following the baseline schedule for crystal fabrication and deployment, we compute an array-wide average rate over the data taking period that is 0.43 times the initial activity level. The expected background from 60Co activated in the detectors of LEGEND-1000 before and after cuts is shown in Fig. 37 (right). Because the pair of rays emitted in 60Co decay give rise to summed energy depositions at leaving 784 keV of excess event energy, the events are highly multi-site and very effectively cut by the AC and PSD cuts, with a survival probability of .
The 68Ge isotope, with a half-life of 217 d, is produced in the detector material at a rate of 2.12 atoms/(kg d) Elliott et al. (2010). It is removed by the enrichment process but not by zone refinement or crystal pulling. While its decay is not a background contributor, its shorter-lived 68Ga progeny decays through electron capture or emission with a 2.9-MeV value. To deposit energy at , the particle and one or both of the annihilation rays must contribute, resulting in an inherently multi-site topology. The expected activity assumed for 68Ge is based on 40 d of sea-level activation, and the detector production and deployment schedule gives an average rate over the data taking period that is only 0.02 times the initial activity. The expected background spectrum from 68Ge–68Ga decays in the detectors before and after analysis cuts is also shown in Fig. 37 (right). The analysis cuts are effective at removing these events due to their multi-site nature. Depending on the detector energy threshold and the background rate near 10 keV and below, additional suppression of the 68Ga background is possible through time-coincidence tagging of the 10-keV and 1-keV Ga x-rays emitted in the initial 68Ge decay. No such time-coincidence cut is assumed here.
V.4.4. 42Ar in Liquid Argon
Cosmic-ray exposure of atmospheric Ar produces the long-lived radionuclide 42Ar, which decays with a value of 599 keV and of 32.9 yr. While 42Ar decays are not sufficiently energetic to be a background for decay, its short-lived progeny 42K can drift toward the detectors before decaying ( keV, h), in some cases with enough energy to pose a background near .
Gerda mitigated this background risk by encapsulating detector strings in nylon shrouds Lubashevskiy et al. (2018) (using nylon film produced for BOREXINO Benziger et al. (2007)) to limit the total volume of Ar from which 42K ions can drift to detector surfaces. Whereas this technique is used in LEGEND-200 and is sufficient to meet its background goals, LEGEND-1000 surrounds the Ge detectors with UGLAr to meet its more aggressive background goals. The DarkSide collaboration has found that underground Ar contains at least times less 39Ar than atmospheric Ar Agnes et al. (2021b). Both 42Ar and 39Ar are produced from 40Ar by cosmic-ray and hadronic interactions, with 39Ar having a wider variety of production channels with lower reaction thresholds than 42Ar. We thus expect reduction factor for 42Ar greater than has been measured for 39Ar, though for this report, we conservatively assume only DarkSide’s demonstrated reduction factor of 1400. See Sect. V.V.1.V.1.4 for more details concerning the procurement plan for UGLAr.
The background contribution from 42Ar depends not only on the activity of the LAr but also on ion drift in electric fields, which in turn depends on the Ar purity, the detector bias voltage, the location of grounded components, and the detector geometry. Given the uncertainties associated with unfolding the effects of each of these factors, we instead choose to estimate the 42Ar background index directly from measurements in the post-Gerda test (PGT) prior to the start of LEGEND-200 assembly. This approach relies on the fact that the geometry of the detector strings and mounting components in the LEGEND-1000 design is similar to that used in the PGT, including operating without 42Ar-background-reducing mini-shrouds surrounding the detectors. In the PGT, the background index contribution of 42Ar decays before cuts is found to be 0.72 cts/(keV kg yr). Applying the reduction factor for UGLAr, we expect the background contribution from 42Ar to fall to cts/(keV kg yr) before analysis cuts.
The AC cuts have limited effect on removing 42K events due to their decay location near detector surfaces, yielding only a 19% suppression of the background index. PSD, however, provides a further suppression by two orders of magnitude due to the slowness of the charge signal for events penetrating the transition layer at the n+ electrode. This effect has not yet been fully modeled in the post-processing of the LEGEND-1000 simulations; instead we assume an experimentally-derived survival probability of 1% Lubashevskiy et al. (2018), which is also confirmed by dedicated stand-alone simulations Lehnert (2016). The resulting background index from 42Ar after cuts is found to be cts/(keV kg yr) and is the dominant singular background component in the LEGEND-1000 model—albeit with conservative assumptions.
Validated pulse-shape simulations are being added to the simulation post processing in order to refine this estimate. In addition, the detector response to 42K decays is being studied to optimize the detector’s electrode geometry, since the background index is strongly dependent on the thickness of the n+ surface dead layer that absorbs part of the energy. While a 1-mm-thick dead layer is assumed in the current projections, this thickness can be optimized to balance the reduction in the background rate from a thicker dead layer with the greater pulse-shape information from a thinner dead layer.
V.4.5. Surface Alpha Backgrounds
During detector and component fabrication, storage, and assembly, surface contaminants such as 210Po ( d) and 210Pb ( yr) can be introduced either as dust or through the deposition of ionized progeny of 222Rn decays. On the detector surfaces, these contaminants can emit high-energy particles (e.g., 5.3 MeV in the case of 210Po decay) capable of partial energy depositions in the active Ge detector volume. Careful handling of the detectors in clean Rn-mitigated environments can limit the surface contamination introduced during handling and construction, and point-contact Ge detectors have been shown to be highly effective in removing -induced surface events through a set of complementary pulse-shape cuts based on their fast rise-time or delayed-charge collection characteristics.
It is difficult to model a priori the detector response to surface events. However, efforts are under way to introduce ICPC event modeling into the Monte Carlo post-processing, based on the effective pulse-shape discriminators applied to the PPC and BEGe detectors. At present, we use the contamination level and PSD performance demonstrated in Gerda Phase II as the basis of our -background estimates. The -induced event rate at energies of 3.5 to 5.3 MeV is 15 cts/(detector yr), corresponding to a rate of cts/(keV kg yr) at . Scaling to the 2.6 kg average detector mass expected in LEGEND-1000, this results in an -induced background rate of cts/(keV kg yr) before the PSD is applied. From the total elimination of background events above 3.5 MeV, where -induced events dominate the background spectrum, we can extrapolate an upper limit on the -induced event survival probability of 0.16% (90% CL). Applying this survival probability to the expected -background rate, we find an expected background contribution of less than cts/(keV kg yr) in LEGEND-1000, which is a small component of the overall background composition.
V.4.6. External -Ray and Neutron Backgrounds
In addition to backgrounds from components internal to the array modules discussed in the previous sections, the stainless steel cryostat, water tank, and the laboratory environment can potentially contribute to the background via rays and neutrons. A stand-alone Geant4-based simulation module Barton (2021) handles the computationally intensive simulations of the of external sources through representative geometries of the water shield, cryostat, the LAr volume, and the Ge detectors in a fashion similar to Ref. Barabanov et al. (2009).
For a stainless steel cryostat, the main -ray background contributor is the 2615-keV ray from 208Tl decay in the 232Th chain. For the steel used in Gerda, batches with low concentrations of primordial radioisotopes in the range of 1 mBq/kg and below have been measured Maneschg et al. (2008). We assume that steel with similar radiopurity can be sourced for LEGEND-1000. The -ray background contribution is found to be cts/(keV kg yr) before analysis cuts. A previous Gerda analysis suggests a combined conservative suppression factor of for the PSD and LAr veto cuts; we are refining this estimate for LEGEND-1000 with further Monte Carlo studies. With the present inputs, the total expected background contribution from cryostat material rays is cts/(keV kg yr).
Neutrons are another potential source of background originating from the cryostat material. Alpha decays from the 238U and 232Th chains within the apparatus can generate neutrons via (,n) reactions, adding to neutrons from the spontaneous fission at a rate of n/(s Bq) for 238U Westerdale and Meyers (2017). To estimate the neutron yield from (,n) reactions, the open-source application NeuCBOT Westerdale and Meyers (2017) is used. Together, the total neutron flux from (,n) and fission is estimated to be n/s. These radiogenic neutrons are not associated with muon-induced triggers and difficult to tag. They can be captured on 76Ge nuclei, producing 77Ge and Ge states that can contribute to the background with probabilities and cut efficiencies reported in Ref. Wiesinger et al. (2018). If the referenced delayed-coincidence is not applied, the radiogenic neutron contribution is found to be cts/(keV kg yr).
The water tank enclosure and the laboratory environment can also contribute to the total background, which is dominated by the surrounding rock wall within the experimental hall. While neutrons can be very effectively moderated by the thick water shield surrounding the cryostat, the 2615-keV ray from 208Tl decay is considered. Given its extremely small survival probability in traversing the water shield and LAr volume, its estimation is computationally intensive, so approximations were used. Similar to the approach in Ref. Barabanov et al. (2009), the flux of 2615-keV rays in the laboratory is assumed to be isotropic and to amount to up to , consistent with the expectation at SNOLAB Smith (2012). Similar to the cryostat rays, a conservative suppression factor of for the PSD and LAr veto cuts is assumed for the laboratory environmental backgrounds. A conservative estimate of this contribution to the background index is approximately cts/(keV kg yr)and therefore negligible.
The total external gamma and neutron background in the LEGEND-1000 baseline design is below of the background goal due to, in part, a sufficient LAr shielding that is much larger than the LAr shielding of Gerda. With a smaller LAr shield, in the alternate case of siting LEGEND-1000 in Hall C at LNGS (discussed in Sect. VI.VI.2.VI.2.2), additional measures such as adding Cu shielding can be considered.
V.4.7. Muon-Induced Background
Cosmic-ray muons penetrating the laboratory’s rock overburden are able to induce prompt and delayed backgrounds. Prompt events (in coincidence with the muon) are predominantly generated by accompanying secondaries in the muon-induced shower or by the muon itself, and they are efficiently reduced by the muon veto. In Gerda, a background contribution of cts/(keV kg yr) before the LAr veto and PSD cuts was estimated Freund et al. (2016). The same study pointed out that the muon-induced background without a veto condition would be cts/(keV kg yr) and indicated that the rejection efficiency for coincident muon-Ge events is . The LAr veto and PSD cuts are expected to reduce the prompt background below the level of cts/(keV kg yr) in LEGEND-200 with the LNGS overburden. The factor of 100 reduction in the muon flux and associated prompt background at SNOLAB overburden is expected to render prompt cosmic-ray-induced backgrounds negligible.
Delayed cosmic-ray-induced backgrounds are associated with the production of long-lived isotopes produced in Ge detectors or experimental components, primarily through photo-nuclear interactions or interactions with spallation neutrons. Of these, production of isotopes in Ge detectors dominates, and backgrounds from other components are negligible. Cosmogenic 77Ge production in LEGEND-1000 was first studied in Ref. Wiesinger et al. (2018) for a Gerda-like geometry at LNGS. Analysis cuts and corresponding efficiencies for both ground (77Ge) and meta-stable (Ge) states were carefully studied. A highly effective delayed coincidence cut to substantially suppress Ge contributions was proposed. After all cuts, Ref. Wiesinger et al. (2018) found the summed cosmogenic 77Ge and Ge background contributions in a Gerda-like geometry at LNGS is cts/(keV kg yr).
The LEGEND-1000 geometry has LAr shielding that is much larger than the shielding deployed in Gerda. The effect of increased LAr thickness on cosmogenically-induced neutrons is studied in a stand-alone Geant4-based module Barton (2021), which implements representative baseline and alternative geometries of LEGEND-1000. The increased LAr thickness at LEGEND-1000 develops greater muon showers, increasing the rate of neutron production and thereby increasing the rate of cosmogenic 77Ge production per unit mass of Ge. As a result, the final after-cut contributions to the background index by the 77Ge and Ge states in the LEGEND-1000 baseline design is higher than that in a Gerda-like geometry. Table 12 compares the after-cut contributions in the baseline design at the separate depths of three underground laboratories, which are discussed in Sect. VI.VI.2. The analysis cuts and corresponding efficiencies reported in Ref. Wiesinger et al. (2018) are applied here. With the exception of the delayed coincidence cut, these efficiencies have been cross-checked with simulations of the LEGEND-1000 baseline geometry. At the reference SNOLAB depth, the total muon-induced contribution to the background index is cts/(keV kg yr).
| BI before DC | BI after DC | ||
| Source | Location | cts/(keV kg yr) | cts/(keV kg yr) |
| 77Ge | SNOLAB | N/A | |
| 77Ge | SURF | N/A | |
| 77Ge | LNGS | N/A | |
| Ge | SNOLAB | ||
| Ge | SURF | ||
| Ge | LNGS |
V.4.8. Total Background Projection
The expected contributions to the background at are summarized in Table 13. All values therein are normalized to the total detector mass and integrated over an analysis range of 1985–2095 keV around . For all background sources, with the exception of emitters on the detector surfaces, Monte Carlo simulations were performed with the isotope or decay chain of interest uniformly distributed throughout component volumes or across surfaces. Following post-processing, energy spectra are produced for each component group listed, scaling efficiency spectra by the expected activities listed in Table 11, at each stage of analysis cut application in order to examine the effect of each cut.
| BI Before Cuts | Survival Probabilities | BI After Cuts | ||||
| Source | Location | cts/(keV kg yr) | AC | PSD | PSD After AC | cts/(keV kg yr) |
| 238U chain | Cabling—HV | 11 | 19 | 5.0 | ||
| 238U chain | Cabling—Signal | 11 | 19 | 5.0 | ||
| 238U chain | Det. Mount (EFCu) | 22 | 19 | 6.1 | ||
| 238U chain | Det. Mount (Ultem™) | 21 | 23 | 15 | ||
| 238U chain | Optical Fibers | 4.3 | 22 | 10 | ||
| 238U chain | Front End ASIC | 16 | 19 | 6.3 | ||
| 238U chain | PEN Plates | 2.7 | 20 | 6.5 | ||
| 238U chain | HV Conn. (Ultem™) | 17 | 21 | 7.4 | ||
| 238U chain | HV Conn. (Ph-Br) | 17 | 21 | 7.4 | ||
| 238U chain | FE Mount (Ultem™) | 19 | 18 | 6.0 | ||
| 238U chain | FE Mount (Ph-Br) | 19 | 18 | 6.0 | ||
| 238U chain | CAPs | 3.6 | 22 | 9.2 | ||
| 238U chain | Re-entrant Vessels | 13 | 22 | 11 | ||
| 238U chain | Tetratex & TPB | 13 | 22 | 11 | ||
| 232Th chain | Cabling—HV | 0.068 | 35 | 4.6 | ||
| 232Th chain | Cabling—Signal | 0.068 | 35 | 4.6 | ||
| 232Th chain | Det. Mount (EFCu) | 0.31 | 35 | 8.2 | ||
| 232Th chain | Det. Mount (Ultem™) | 0.32 | 36 | 6.8 | ||
| 232Th chain | Optical Fibers | 0.049 | 38 | 33 | ||
| 232Th chain | Front-End ASIC | 0.32 | 35 | 5.4 | ||
| 232Th chain | PEN Plates | 0.19 | 35 | 3.5 | ||
| 232Th chain | HV Conn. (Ultem™) | 0.18 | 37 | 9.3 | ||
| 232Th chain | HV Conn. (Ph-Br) | 0.18 | 37 | 9.3 | ||
| 232Th chain | FE Mount (Ultem™) | 0.35 | 35 | 8.4 | ||
| 232Th chain | FE Mount (Ph-Br) | 0.35 | 35 | 8.4 | ||
| 232Th chain | CAPs | 0.14 | 32 | 3.2 | ||
| 232Th chain | Re-entrant Vessels | 1.2 | 37 | 17 | ||
| 232Th chain | Tetratex & TPB | 1.2 | 37 | 17 | ||
| 68Ge | Detector Material | 35 | 3.6 | 1.0 | ||
| 60Co | Detector Material | 3.7 | 1.1 | 0.67 | ||
| 238U chain | Detector Material | 65 | 53 | 77 | ||
| 232Th chain | Detector Material | 50 | 43 | 69 | ||
| 42Ar | Detector n+ Surf. | 81 | 1.0 | 1.0 | ||
| 222Rn | Underground Ar | 0.48 | 21 | 6.4 | ||
| Surface s | 100 | 0.16 | 0.16 | |||
| 238U/232Th | External () | |||||
| 238U/232Th | External (n) | |||||
| 77Ge | -induced | |||||
| 77mGe | -induced | |||||
| All Sources | ||||||
The energy spectrum near is shown after all analysis cuts in Fig. 38. Table 13 also shows the anticipated survival probabilities evaluated from simulations and measured values. Monte Carlo simulations provide the AC and PSD cut survival probabilities and are in agreement with what has previously been observed experimentally. The 232Th chain backgrounds are generally strongly removed by the AC cut, owing to the large value for 208Tl decays. The 238U decays are less strongly rejected, with backgrounds from components farther from the detectors (e.g., CAPs) being more strongly rejected than those nearby (Detector Mount EFCu & Ultem™).
The AC cut pre-selects events which do not deposit significant energy outside of a single detector, increasing the likelihood that the PSD cut finds that an event is multi-site within that detector. For this reason, we separately list the PSD survival probability and the PSD survival probability after the AC cut. As mentioned in the previous section, 42K decays are expected to be strongly rejected by the PSD because of energy depositions in the transition layer giving rise to slow pulses. As we have not yet implemented this expectation in our simulation post-processing, we insert this PSD survival probability by hand in Table 13. Similarly, - and -induced backgrounds from contamination of the detector p+ surface are very efficiently removed by PSD, as described in Sect. V.V.4.V.4.5. The active background suppression performance for these surface events are also taken from experimental data.
The last column of Table 13 shows the anticipated background indices near integrated over the 1985–2095 keV energy range after active background suppression based on the modeled survival probabilities; in total we expect a final background index of cts/(keV kg yr) after all cuts. The dominant background component after all analysis cuts are applied is attributed to the 42Ar content of the UGLAr. As mentioned in Sect. V.V.4.V.4.4, we expect the estimated activity for this background source to be quite conservative; there is a strong likelihood the actual activity, and resulting background index, will be significantly lower than what is projected here. Backgrounds originating in optical fibers are the next-leading contributor. The anti-coincidence suppression of backgrounds from this source is quite effective, due to the production of scintillation in the fibers from the primary / decay of the nucleus. We are currently refining our estimates of this suppression with additional dedicated Monte Carlo studies. Finally, cosmogenic activation of 68Ge in the detectors is the remaining background component estimated to contribute at a level above cts/(keV kg yr). With a 271-day half-life, most of these events are expected to occur in the first year of data-taking, and additional operational lifetime time can effectively reduce the contribution from this source. This background can also potentially be vetoed by a significant factor due to its time coincidence with x-rays from its progenitor’s decay.
V.4.9. Signal Extraction and Sensitivity
With a background level of cts/(keV kg yr) and a resolution of 2.5 keV, a total of 0.4 background events are expected in the region of interest () at the end of LEGEND-1000. Such a low background expectation makes LEGEND-1000 able to identify a decay signal based on a handful of signal events. Using a simple Poisson counting, three events in the ROI would be sufficient to provide a statistical significance for a decay signal.
While an excess of counts can be observed by eye, Gerda and Majorana have developed sophisticated statistical methods for the signal extraction. Unbinned likelihood analyses treating the full amount of information available for each event have been applied in both Frequentists and Bayesian frameworks Agostini et al. (2020b); Alvis et al. (2019b). Event-specific systematic uncertainties on the energy scale and detection efficiency are fully propagated with these techniques, which will incorporate additional multi-variate parameters in the final LEGEND-1000 analysis.
LEGEND-1000’s sensitivity is accurately estimated using a simplified analysis based on Poisson counting with known background. A full multi-variate analysis will well-constrain the background using sidebands in energy and other observables. An optimized energy window of , which has 95% probability of containing the signal, is used for the inversion of Poisson probabilities described in the appendix of Ref. Agostini et al. (2017a). Using the key experimental parameters of Table 4, including an overall decay detection efficiency of 69%, we obtain a 90% CL exclusion sensitivity of yr and a 99.7% CL discovery sensitivity of yr. The exclusion sensitivity is defined as the median half-life value that will be excluded assuming there is no signal, while the discovery sensitivity gives the half-life value at which LEGEND-1000 has a 50% chance of a 3 discovery. These half-life sensitivities can be converted into a range of values as discussed in Sect. II.II.3. Using a range of matrix element values from 2.66 to 6.04 from the four primary many-body methods (see Table 1) and the quenching and phase space factors reported in Table 4, we obtain meV and meV for the 90% CL exclusion and 99.7% CL discovery sensitivity, respectively.
The central value of the interval for the discovery sensitivity is shown in Fig. 39 as a function of exposure and background index. The LEGEND-1000 background goal and baseline exposure corresponds to 15.4 meV, well below the bottom of the inverted ordering parameter space. The current uncertainties on the background model correspond to a modest variation in terms of sensitivity. As new information becomes available and our conservative upper limits on some background contributions decrease (e.g. 42Ar activity in UGLAr), the discovery sensitivity may improve further.
VI. Underground Laboratory
The host laboratory provides a clean environment and necessary infrastructure located deep underground to assemble and operate the LEGEND-1000 experiment. Due to the experiment’s low-background requirements and strict material handling protocols, a clean-room environment with a series of dedicated clean work spaces is required for assembly of the detector. The size and scope of the experimental apparatus requires a range of facility space and process systems allowances. This section summarizes the facility requirements and elaborates on the candidate underground laboratories.
VI.1. Facility Requirements
The principal facility requirement of LEGEND-1000 is an underground detector cavity that can accommodate the full experimental apparatus. The Ge detectors will be housed within a LAr cryostat situated within a water tank. Figure 12 shows the cryostat and water tank concept. The water tank is approximately 12 m in diameter and 11 m in height. The nominal total height of the experimental hall including the water tank and an upper work deck area is 18 m. Part of the overhead space must allow substantial lifting devices to support the cryostat and water tank installation plan. Some flexibility exists in the technical design to accommodate slight differences in an available cavity size. However, the module assembly and deployment above the work deck does impose strict working height requirements while the background considerations set requirements on the diameter of the shielding provided by the LAr cryostat and water tank.
The work deck space above the cryostat and water tank and adjacent areas need to operate as a clean space, either facility-wide or through dedicated clean spaces limited to LEGEND’s exclusive use. Additionally, clean environments are established through the use of N2-purged glove boxes and part storage cabinets. A series of glove boxes directly above the cryostat provide the means to perform final assembly of the Ge detector array and LAr instrumentation prior to deployment into one of the four reentrant tubes that complete a module. This space would include some hoisting capabilities to maneuver portions of the apparatus and the detector array during deployment. The adjacent clean spaces support purged glove boxes and cabinets for part storage, detector mounting, and testing activities that take place in advance of detector installation. In addition, a separate clean space is used for final chemical cleaning of internal detector parts, which will require systems such as a fume hood, chemical storage and waste handling, and purified water. A unique feature of the LEGEND-1000 design is the use of detector components fabricated from ultra-pure EFCu. It is preferable to operate the electroforming system underground to avoid cosmic activation of the Cu material, which requires a separate space with proper exhaust, chemical handling, and electrical services. Beyond the dedicated clean spaces, work areas at general cleanliness levels are required. An area housing the electronics racks and data acquisition systems must be located close to the cryostat for detector readout while a nearby control room offers an additional interface to the experiment. A designated lay-down, storage, and assembly space supports construction work in the main detector hall.
The underground facility space must also support the detector process systems and services. A water plant is necessary to supply the 980 m3 water tank and supply purified water for chemical and cleaning activities. An LN2 generator and/or buffer tanks will provide cooling of the LAr cryostat, support pre-cooling and heat exchangers for the LAr cryogenic systems, and N2 purge gas for the glove boxes and part storage cabinets. The LAr cryogenic systems will surround the detector to support the cryostat initial fill and operations. Transport vessels that deliver the atmospheric and underground-sourced Ar will be staged near the detector hall. Several process loops will provide the needed Ar condensers, purifications systems, compressors, recovery, storage, and exhaust systems complete with system flow and monitoring controls. A volume of 240 m3 of LAr cryogen and 13.3 m3 of low-background UGLAr cryogen will be housed within the cryostat.
Specialized production and fabrication facilities are needed, though they may be located on the surface or fulfilled with existing facility capabilities. A standard machine shop may be used for fabrication of detector mounting parts, as well as housing specialized tools to support the needs of the LEGEND-1000 EFCu production. Surface clean space for production of plastic components and chemical cleaning activities, where cosmic activation is not a concern, may also be desirable. Short- and long-term surface storage is required for staging materials and detector components in advance of transportation to the underground laboratory, while components needing protection from cosmic activation should be immediately stored underground upon arrival. Computing and electronic storage infrastructure on the surface is necessary to serve as a buffer for the experiment’s data stream from the underground and as a gateway to the collaboration’s offsite computing resources. Modest surface space for office and administrative work is beneficial.
Uninterrupted electrical power is critical to maintain a smooth operation of the experiment, nominally demanding the use of uninterrupted power supplies and back-up power generators within the facility electrical infrastructure. Supplemental cooling and ventilation infrastructure may be needed for the separate clean spaces and electronics racks if not already covered by the facility’s HVAC capacity. High-speed networking capability between the underground and the surface with a bandwidth of greater than 10 Gb/s is necessary to sustain the experiments’s data stream and offsite detector monitoring.
VI.2. Existing Laboratories
While there is a wide range of worldwide underground laboratories that could potentially host LEGEND-1000, the top sites considered for LEGEND-1000 are summarized in Table 14. As the deepest laboratory, SNOLAB represents the preferred underground site with features that accommodate the LEGEND-1000 technical design and provides the reference for the experimental details covered in Sect. V. A brief description of the SNOLAB site is described in the next section. A more thorough discussion of the LNGS alternative site follows, including its implications on the LEGEND-1000 technical design and background model.
The two other underground laboratories warrant consideration for LEGEND-1000, but do not have immediate space available. The Sanford Underground Research Facility (SURF) Heise (2020) is located in Lead, South Dakota in the former Homestake Gold mine and is the host laboratory for the Majorana Demonstrator. While the DUNE project Abi et al. (2020) has begun excavation of several large cavities at SURF, the schedule for DUNE may not dove-tail well with the LEGEND-1000 schedule. The construction of a new cavity for LEGEND-1000 would take 2–3 years and could only start after DUNE has completed its construction (in 2025 or 2026). Nonetheless, the collaboration is holding ongoing discussions with the SURF management regarding these issues. The Boulby Underground Laboratory is the United Kingdom’s (UK) deep underground science facility located in a working polyhalite and salt mine in North-East England. This underground laboratory offers a flat overburden of 1100 m (2850 m.w.e.) and hosts several small experiments and an extensive radio-assay facility. The UK funding agency, STFC, recently funded a feasibility study for creating a new underground laboratory space with the aim to host a major international rare-event search experiment. The two main use-cases considered are a generation-three dark matter experiment with a noble liquid target and a LEGEND-1000-like decay detector. Two sites for the new cavern are considered: one at the current depth of 1100 m and a deeper site at 1400 m. The Boulby Feasibility Study report is expected to be published in July 2021.
| Site | Depth | Cavity | Muon Flux | Occ. Date |
| [m.w.e.] | [m-2 s-1] | |||
| Boulby (Upgrade-1) | 2850 | 25 m ⌀ x 25 m | Reichhart et al. (2013) | 2028 |
| Boulby (Upgrade-2) | 3600 | 25 m ⌀ x 25 m | Boulby Feasibility Study Report (2021) | 2030 |
| LNGS | 3500 | Hall A: 14.9 m x 15.7 m | Agostini et al. (2016b) | 2022 |
| Hall C: 17.7 m x 19.0 m | ||||
| SURF | 4300 | 50 m x 20 m x 20 m | Abgrall et al. (2017c) | 2028/29 |
| SNOLAB | 6010 | Cryopit 15 m ⌀x 19.0 m | Smith (2012) | Immediate |
VI.2.1. Reference Site: SNOLAB
SNOLAB Duncan et al. (2010); Smith (2012) is located in the Canadian granite shield, close to the town of Sudbury inside a working nickel mine. It is accessed through the mine shaft. It is a well established laboratory with all the required expertise in running underground experiments with international collaborations requiring a clean environment. The SNOLAB facility is at a depth of 6010 m.w.e. and operates all experimental areas as Class 2000 clean rooms and accommodates additional cleanliness requirements as needed.
The access through the mine shaft would complicate some aspects of the LEGEND-1000 construction. The collaboration has been in close contact with SNOLAB management, and their engineering and project management staff to work through an experimental layout at the space referred to as the cryopit, a large cavity 15 m in diameter, 19 m in height designed to house a large liquid cryogen experiment; SNOLAB management has assigned the cryopit to a future decay experiment. The placement of the LEGEND-1000 cryostat and water tank within the cryopit is shown earlier in Fig. 27. Since the available cryopit is compatible with our technical requirements and the muon flux at this depth introduces a negligible background contribution, the SNOLAB site sets the reference overburden depth and cavity size in the LEGEND-1000 design. The LEGEND-1000 technical design described in Sect. V.V.1 and background model described in Sect. V.V.4 are based on the SNOLAB site location.
VI.2.2. Alternative Site: LNGS
The alternative site considered for LEGEND-1000 is LNGS, the laboratory where LEGEND-200 is currently under construction. The LNGS site is located under the Gran Sasso mountain in central Italy and allows for easy access through a freeway tunnel. It is owned by the Italian state and operated by the Istituto Nazionale di Fisica Nucleare (INFN). LNGS has about 3500 m.w.e. overburden, and the muon flux is m-2 s-1, about two orders of magnitude larger than at SNOLAB. Consequently, the muon-induced background rate is greater, discussed below in Sec. VI.VI.2.VI.2.3.


We consider two options for conducting the experiment at LNGS, the site of LVD Aglietta et al. (1992) in Hall A and Borexino Alimonti et al. (2009) in Hall C (see Fig. 40), which will both be decommissioned in 2022. Hall C (height 19.0 m, width 17.7 m) is large enough to accommodate the baseline cryostat design, either in the existing Borexino water tank – after reducing its height (see Fig. 40 left) – or at a nearby site. The latter requires the construction of a new water tank. The load cases for the large cryostat are identical to that at SNOLAB, except for seismic acceleration due to earthquakes, which are smaller than those from the mining activities at SNOLAB. The cryostat would be built according to the European pressure vessel code, which allows for larger maximum stress on the steel, and thus smaller wall thicknesses and 30% less total steel mass. The dimensions of Hall A (height 15.69 m, width 14.88 m) require smaller cryostats. Up to four copies of the Gerda-sized cryostat (4-m diameter) could be placed at this location, with each of them holding up to 250 kg of Ge detectors (Fig. 40 right). Including LEGEND-200, this arrangement would total a maximum of five cryostats. The advantage here is that these cryostats would be built outside the laboratory, with no underground on-site welding for the cryostat construction. The impact of a reduced LAr shielding on the external background from the cryostat steel, dominated by the 2.6-MeV 208Tl line, has been studied with Monte Carlo simulations. This background can be efficiently suppressed by LAr instrumentation outside the reentrant tubes, and 10 cm of Cu inner shield attached to the wall of the cryostat, compared to 6 cm used in LEGEND-200.
VI.2.3. Background Considerations at Reduced Overburden
Siting the LEGEND-1000 experiment at LNGS-depth results in a higher in-situ production of radioactive isotopes due to cosmic muon interactions, and requires special mitigation techniques. As discussed extensively in Refs. Pandola et al. (2007); Wiesinger et al. (2018), this depends critically on the experimental design, the available instrumentation, and the related analysis strategy.
The underground production of 77Ge and Ge, together referred to as Ge, through capture of fast neutrons on 76Ge, has been identified as the main in-situ cosmogenic background for LEGEND-1000 at LNGS. Figure 41 shows the production rates obtained from Monte Carlo simulations for a Gerda-like geometry. This result has been reproduced in independent studies and a recent analysis of the Gerda Phase-II data corroborates the accuracy of the predictions. In 103.7 kg yr exposure, the expected number of Ge decays with energy deposition between 1900–2600 keV and within 3 life-times is counts. The background derived from side-bands corresponds to counts. Hence, the signal-plus-background expectation is 1.5 counts, compared to 3 counts observed in the Gerda data set (-value = 19%). Similarly, the Majorana Demonstrator at SURF compared predictions for Ge and Ge rates with experimental data. Geant4 and Fluka simulations predicted 11 and 1 events for Ge and Ge compared to 7 and 0 observed events, respectively. LEGEND-200 will allow a further test of the predictions with increased accuracy.
Applying event topology discrimination—but without delayed coincidence cuts— Ge generates a background count rate at of cts/(keV kg yr) for a 4-m-diameter cryostat at LNGS. A delayed coincidence cut of 6 min subsequent to each muon-veto signal in coincidence with a Ge energy deposition reduces the Ge background by almost a factor 20 Wiesinger et al. (2018). This results in a background contribution of cts/(keV kg yr) for the 4-m-diameter cryostats, with equal contributions from 77Ge and Ge at a one-percent-level dead time. The results for the 7-m-diameter cryostat are about a factor two larger, since the increased shower depth in the LAr results in a higher neutron yield. Additional techniques to reduce the in-situ cosmogenic background are under study, and summarized below.
First, 19% of the Ge decays proceed via isomeric transition (IT), i.e., 160 keV radiation or conversion electron emission from the excited metastable state to the 77Ge ground state. Identifying the Ge detector in which the neutron capture has occurred by detecting this IT within 6 min of the muon event, this detector can be removed from the analysis for several days (T1/2 = 11 h). This reduces the ground-state 77Ge background contribution to cts/(keV kg yr) with negligible dead-time losses.
Second, exploiting the full sequence of muon-induced isotope production and their decays, based on the respective event topologies in the Ge, LAr, and water Cherenkov detector systems, the background contribution of Ge can be reduced to cts/(keV kg yr) as well. Crucial to this technique is the tagging of muon-induced showers with high neutron multiplicity, commonly referred to as showering muons. Monte Carlo simulations predict that the median neutron multiplicity is approximately 75 in those showers in which Ge is produced. Only a minor fraction of these sibling neutrons are captured in LAr while the larger fraction is captured by H in the water, or by Gd if such a compound is loaded in the instrumented water shield. In about 70% of muon-induced Ge productions, more than 10 neutrons are captured on Gd in the water shield (see Fig. 42). The high number of sibling captures on Gd or Ar gives an additional handle to identify potential Ge production and to improve the delayed coincidence cut efficiency.
Last, passive shielding options with low-Z materials installed within the LAr active shield moderate neutrons and reduce the Ge production Barton (2021). If made from clean—possibly scintillating—material, their radiogenic contribution can be marginal.
In summary, the LEGEND-1000 baseline design is compatible with siting at LNGS. The in-situ cosmogenic contribution to the total background, however, can be up to 50% for the 7-m-diameter cryostat and 20% for the 4-m-diameter option without further measures. Additional neutron moderators, improved analysis cuts (i.e., IT tagging) and muon shower identification will reduce this contribution further, potentially below 10%, which is subdominant for the overall background budget. The exposure loss due to dead-time from the delayed coincidence cuts may be compensated by faster underground construction and an earlier data taking start.
Appendix A Design Specifications
| Parameter | Specification |
| Underground Site | |
| Depth | 6010 m.w.e. |
| Isotope Production | |
| Isotope | 76Ge |
| Enrichment fraction | 92% 76Ge |
| Enrichment process | Gaseous centrifuge of GeF4 |
| Chemical form | GeO2 |
| Acquisition | 1100 kg Ge |
| Overall detector yield | 70–80% |
| Detectors | |
| Detector technology | ICPC: P-type inverted coaxial, point contact |
| Total Ge detector mass | 1000 kg |
| New detector mass | 870 kg |
| Reused LEGEND-200 mass | 130 kg |
| Number of detectors | 392 |
| Avg. detector mass | 2.6 kg |
| Energy resolution at | 2.5 keV FWHM |
| Detector Cooling | |
| Technology | Vacuum-superinsulated cryostat |
| Cryostat vessel material | Stainless steel |
| Cryogen | Atmospheric liquid Ar |
| Cryogen volume | 240 m3 |
| Cryostat outer diameter | 7.2 m |
| Cryostat cylindrical height | 4 m |
| Cryostat overall height | 10.7 m |
| Detector Deployment | |
| Strategy | Modular |
| Number of modules | 4 |
| Detector mass per module | 250 kg |
| Module vessel material | Electroformed Cu |
| Module cryogen | Underground liquid Ar |
| Module cryogen volume | 3.31 m3 |
| Parameter | Specification |
| Detector Mounting | |
| Configuration | Strings of detectors |
| String length | 1.2 m |
| Detectors per string | 12 |
| String detector mass | 30 kg |
| Strings per module | 14 |
| Support rod material | Underground electroformed Cu |
| Electrical isolation material | Ultem™ |
| Baseplate material | PEN |
| Detector Active Shield | |
| Protection | Backgrounds that deposit energy in a medium surrounding the Ge detector array |
| Scintillating medium | Liquid Ar |
| Scintilation light wavelength | 128 nm |
| Attenuation length (at 128 nm) | 60 cm |
| LAr triplet lifetime | 1.3 s |
| Wavelength shifting material | Tetraphenyl butadien (TPB) |
| Light guide | TPB-coated polystyrene fibers |
| Light collection and readout | Silicon photo-multipliers (SiPM) |
| Detector Water Shield | |
| Protection | Environmental rays and low energy neutrons |
| Medium | Liquid H2O |
| Water tank diameter | 12.3 m |
| Water tank height | 10.6 m |
| Water volume | 980 m3 |
| Cables and Connectors | |
| Cable style | Kapton flat flex cables |
| Connection to the detector | Wire bond |
| Inter-cable connection | Custom low background ZIF connectors |
| Signal feedthrough connection | D-sub UHV feedthrough |
| HV feedthrough connection | Epoxy potted or commercial HV feedthrough |
| Parameter | Specification |
| Detector Front-End Electronics | |
| Style | ASIC |
| Noise/threshold | 1 keV |
| Dynamic range | 10 MeV |
| Bandwidth | 50 MHz |
| Minimum detector capacitance | 1 pF |
| Cabling needs | 4: power, ground, pulser, diff. output |
| Data Acquisition—Per Module | |
| Number of readout channels per Ge detector | 1 |
| Total number of channels Ge/SiPM | Minimum 100–120/60–80 |
| Typical background data rate | 1 Hz/channel; 0.1 GB/s |
| Typical calibration data rate | 3-4 kHz; 1 GB/s |
| Maximum data rate of system | 3.5 GB/s |
| Dead time at maximum data rate | 1% |
| Underground real-time data storage | 50 TB |
| Underground secondary RAID storage | 250 TB |
| Above ground storage | 500 TB |
| Underground-to-surface network bandwidth | 10 Gb/s |
| Digitizer ADC resolution (Ge) | 16 bits |
| Digitizer full-scale range (Ge) | 10 MeV |
| Digitizer intrinsic electronic noise (Ge) | 50 eV |
| Digitization speed (Ge) | 62.5 MHz |
| Digitization record length (Ge) | Adjustable up to 48 s |
| Digitizer ADC resolution (SiPM) | 16 |
| Digitization speed (SiPM) | 62.5 MHz |
| Digitization record length (SiPM) | Adjustable up to 48 s |
| Triggering capability | Single channel readout with independent triggers OR global trigger |
Appendix B Glossary of Acronyms and Abbreviations
-
Neutrinoless double-beta decay
-
Two-neutrino double-beta decay
- AC
-
Anticoincidence; an analysis cut
- ADC
-
Analog to digital converter; “digitizer”
- AM
-
Additive manufacturing
- ASIC
-
Application specific integrated circuit
-
A double-beta decay process, with or without neutrinos
- BEGe
-
Broad-energy Ge detector; a point contact detector manufactured by MIRION
- BSM
-
Beyond the standard model
- CL
-
Confidence level
- CSA
-
Charge sensitive amplifier
- DAQ
-
Data acquisition system; including detector readout and slow controls
- DCR
-
Delayed charge recovery; an analysis cut
- DEP
-
Double escape peak; refers to escaping annihilation rays
- DSP
-
Digital signal processing
- EFCu
-
Electroformed copper
- ENC
-
Equivalent noise charge
- FEP
-
Full energy peak
- FFC
-
Flat flex cable
- FWHM
-
Full-width, half-maximum; a measure of a peak width
- GUT
-
Grand unified theory
- HV
-
High voltage
- IC
-
Impurity concentration
- ICPC
-
Inverted-coax point-contact Ge detector
- ICP-MS
-
Inductively-coupled plasma mass spectrometry
- IO
-
Inverted ordering; of neutrino masses
- LAr
-
Liquid argon
- LEGEND
-
Large Enriched Germanium Experiment for Neutrinoless Decay
- LEGEND-200
-
The 200-kg phase of LEGEND
- LEGEND-1000
-
The 1000-kg phase of LEGEND
- LMFE
-
Low-mass front-end electronics
- LN2
-
Liquid nitrogen
- LNGS
-
Laboratori Nazionali del Gran Sasso, Italy
-
Effective Majorana neutrino mass in decay
- NO
-
Normal ordering; of neutrino masses
- PCB
-
Printed-circuit board
- PEN
-
Poly(ethylene napthalate)
- PGT
-
Post-Gerda test
- PMT
-
Photomultiplier tube
- PPC
-
p-type, point-contact Ge detector, manufactured by ORTEC (AMETEK)
- PSD
-
Pulse shape discrimination; an analysis cut
- PTFE
-
Polytetrafluoroethylene; commercially known as Teflon™
- PVT
-
Polyvinyl-toluene
-
-value of the double beta decay
- ROI
-
Region of interest
- SEP
-
Single escape peak; refers to escaping annihilation rays
- SiPM
-
Silicon photomultiplier
- SLA
-
Stereolithographic printing
- SM
-
Standard Model of particle physics
- SNOLAB
-
A deep underground research laboratory in Sudbury, Canada
- SURF
-
Sanford Underground Research Facility, South Dakota
- TPB
-
Tetraphenyl butadiene
- TPC
-
Time projection chamber
- UGAr
-
Underground sourced Ar
- UGLAr
-
Underground sourced LAr
- UHV
-
Ultra-high vacuum
- VUV
-
Vacuum ultraviolet, 10 to 100 nm light
- WIMP
-
Weakly interacting massive particle
- WLS
-
wavelength shifting
- ZIF
-
Zero insertion force; a connector design
References
- Weinberg (2018) S. Weinberg, Phys. Rev. Lett. 121, 220001 (2018).
- de Gouvea and Vogel (2013) A. de Gouvea and P. Vogel, Prog. Part. Nucl. Phys. 71, 75 (2013), arXiv:1303.4097 [hep-ph] .
- Rodejohann (2011) W. Rodejohann, Int. J. Mod. Phys. E 20, 1833 (2011), arXiv:1106.1334 [hep-ph] .
- ’t Hooft (1976) G. ’t Hooft, Phys. Rev. Lett. 37, 8 (1976).
- Davidson et al. (2008) S. Davidson, E. Nardi, and Y. Nir, Phys. Rept. 466, 105 (2008), arXiv:0802.2962 [hep-ph] .
- Fukugita and Yanagida (1986) M. Fukugita and T. Yanagida, Phys. Lett. B 174, 45 (1986).
- Haxton and Stephenson (1984) W. C. Haxton and G. J. Stephenson, Prog. Part. Nucl. Phys. 12, 409 (1984).
- Barabash (2020) A. Barabash, Universe 6, 159 (2020), arXiv:2009.14451 [nucl-ex] .
- Schwingenheuer (2013) B. Schwingenheuer, Annalen Phys. 525, 269 (2013), arXiv:1210.7432 [hep-ex] .
- Cremonesi (2013) O. Cremonesi, Proceedings, Neutrino Oscillation Workshop (NOW 2012): Lecce, Italy, September 9-15, 2012, Nucl. Phys. Proc. Suppl. 237-238, 7 (2013), arXiv:1212.4885 [nucl-ex] .
- Elliott and Franz (2015) S. R. Elliott and M. Franz, Rev. Mod. Phys. 87, 137 (2015), arXiv:1403.4976 [cond-mat.supr-con] .
- Engel (2017) J. Engel, J. and Menéndez, Rep. Prog. Phys. 80, 046301 (2017), arXiv:1610.06548 [nucl-th] .
- Henning (2016) R. Henning, Rev. Phys. 1, 29 (2016).
- Barabash (2019) A. S. Barabash, Front. in Phys. 6, 160 (2019), arXiv:1901.11342 [nucl-ex] .
- Dolinski et al. (2019) M. J. Dolinski, A. W. Poon, and W. Rodejohann, Ann. Rev. Nucl. Part. Sci. 69, 219 (2019), arXiv:1902.04097 [nucl-ex] .
- Cirigliano et al. (2018a) V. Cirigliano, W. Dekens, J. de Vries, M. L. Graesser, and E. Mereghetti, JHEP 12, 097 (2018a), arXiv:1806.02780 [hep-ph] .
- Cirigliano et al. (2018b) V. Cirigliano, W. Dekens, J. De Vries, M. L. Graesser, E. Mereghetti, S. Pastore, and U. Van Kolck, Phys. Rev. Lett. 120, 202001 (2018b), arXiv:1802.10097 [hep-ph] .
- Zyla et al. (2020) P. Zyla et al. (Particle Data Group), Prog. Theor. Exp. Phys. 2020, 083C01 (2020).
- Esteban et al. (2017) I. Esteban, M. C. Gonzalez-Garcia, M. Maltoni, I. Martinez-Soler, and T. Schwetz, J. High Energ. Phys. 2017, 087 (2017), arXiv:1611.01514 [hep-ph] .
- Agostini et al. (2017a) M. Agostini, G. Benato, and J. Detwiler, Phys. Rev. D 96, 053001 (2017a), arXiv:1705.02996 [hep-ex] .
- Agostini et al. (2021a) M. Agostini, G. Benato, J. A. Detwiler, J. Menéndez, and F. Vissani, (2021a), arXiv:2107.09104 [hep-ph] .
- Kotila and Iachello (2012) J. Kotila and F. Iachello, Phys. Rev. C 85, 034316 (2012), arXiv:1209.5722 [nucl-th] .
- Mirea et al. (2015) M. Mirea, T. Pahomi, and S. Stoica, Rom. Rep. Phys. 67, 872 (2015).
- McKeown et al. (2014) R. McKeown et al., “Neutrinoless Double Beta Decay: Report to the Nuclear Science Advisory Committee,” (2014), available at https://science.osti.gov/-/media/np/nsac/pdf/docs/2014/NLDBD_Report_2014_Final.pdf.
- Belley et al. (2021) A. Belley, C. G. Payne, S. R. Stroberg, T. Miyagi, and J. D. Holt, Phys. Rev. Lett. 126, 042502 (2021), arXiv:2008.06588 [nucl-th] .
- Horoi and Neacsu (2016) M. Horoi and A. Neacsu, Phys. Rev. C 93, 024308 (2016), arXiv:1511.03711 [nucl-th] .
- Menéndez (2018) J. Menéndez, J. Phys. G 45, 014003 (2018), arXiv:1804.02105 [nucl-th] .
- Coraggio et al. (2020) L. Coraggio, A. Gargano, N. Itaco, R. Mancino, and F. Nowacki, Phys. Rev. C 101, 044315 (2020), arXiv:2001.00890 [nucl-th] .
- Mustonen and Engel (2013) M. T. Mustonen and J. Engel, Phys. Rev. C 87, 064302 (2013), arXiv:1301.6997 [nucl-th] .
- Hyvärinen and Suhonen (2015) J. Hyvärinen and J. Suhonen, Phys. Rev. C 91, 024613 (2015).
- Šimkovic et al. (2018) F. Šimkovic, A. Smetana, and P. Vogel, Phys. Rev. C 98, 064325 (2018), arXiv:1808.05016 [nucl-th] .
- Fang et al. (2018) D.-L. Fang, A. Faessler, and F. Simkovic, Phys. Rev. C 97, 045503 (2018), arXiv:1803.09195 [nucl-th] .
- Barea et al. (2015) J. Barea, J. Kotila, and F. Iachello, Phys. Rev. C 91, 034304 (2015), arXiv:1506.08530 [nucl-th] .
- Rodriguez and Martinez-Pinedo (2010) T. R. Rodriguez and G. Martinez-Pinedo, Phys. Rev. Lett. 105, 252503 (2010), arXiv:1008.5260 [nucl-th] .
- Rodriguez and Martinez-Pinedo (2013) T. R. Rodriguez and G. Martinez-Pinedo, Phys. Lett. B 719, 174 (2013), arXiv:1210.3225 [nucl-th] .
- López Vaquero et al. (2013) N. López Vaquero, T. R. Rodríguez, and J. L. Egido, Phys. Rev. Lett. 111, 142501 (2013), arXiv:1401.0650 [nucl-th] .
- Song et al. (2017) L. Song, J. Yao, P. Ring, and J. Meng, Phys. Rev. C 95, 024305 (2017), arXiv:1702.02448 [nucl-th] .
- Towner (1987) I. S. Towner, Phys. Rept. 155, 263 (1987).
- Šimkovic et al. (2013) F. Šimkovic, V. Rodin, A. Faessler, and P. Vogel, Phys. Rev. C 87, 045501 (2013), arXiv:1302.1509 [nucl-th] .
- Ejiri and Suhonen (2015) H. Ejiri and J. Suhonen, J. Phys. G 42, 055201 (2015).
- Suzuki et al. (2018) T. Suzuki, S. Chiba, T. Yoshida, K. Takahashi, and H. Umeda, Phys. Rev. C 98, 034613 (2018), arXiv:1807.02367 [nucl-th] .
- Lovato et al. (2020) A. Lovato, J. Carlson, S. Gandolfi, N. Rocco, and R. Schiavilla, Phys. Rev. X 10, 031068 (2020), arXiv:2003.07710 [nucl-th] .
- Pastore et al. (2018) S. Pastore, A. Baroni, J. Carlson, S. Gandolfi, S. C. Pieper, R. Schiavilla, and R. B. Wiringa, Phys. Rev. C 97, 022501 (2018), arXiv:1709.03592 [nucl-th] .
- Gysbers et al. (2019) P. Gysbers et al., Nature Phys. 15, 428 (2019), arXiv:1903.00047 [nucl-th] .
- Cirigliano et al. (2019) V. Cirigliano, W. Dekens, J. De Vries, M. L. Graesser, E. Mereghetti, S. Pastore, M. Piarulli, U. Van Kolck, and R. B. Wiringa, Phys. Rev. C 100, 055504 (2019), arXiv:1907.11254 [nucl-th] .
- Wirth et al. (2021) R. Wirth, J. M. Yao, and H. Hergert, (2021), arXiv:2105.05415 [nucl-th] .
- Davoudi et al. (2021) Z. Davoudi, W. Detmold, K. Orginos, A. Parreño, M. J. Savage, P. Shanahan, and M. L. Wagman, Phys. Rep. 900, 1 (2021), arXiv:2008.11160 [hep-lat] .
- Acero et al. (2019) M. A. Acero et al. (NOvA), Phys. Rev. Lett. 123, 151803 (2019), arXiv:1906.04907 [hep-ex] .
- Abe et al. (2020) K. Abe et al. (T2K), Nature 580, 339 (2020), [Erratum: Nature 583, E16 (2020)], arXiv:1910.03887 [hep-ex] .
- Esteban et al. (2020) I. Esteban, M. C. Gonzalez-Garcia, M. Maltoni, T. Schwetz, and A. Zhou, JHEP 09, 178 (2020), arXiv:2007.14792 [hep-ph] .
- Kelly et al. (2021) K. J. Kelly, P. A. N. Machado, S. J. Parke, Y. F. Perez-Gonzalez, and R. Z. Funchal, Phys. Rev. D 103, 013004 (2021), arXiv:2007.08526 [hep-ph] .
- Capozzi et al. (2020) F. Capozzi, E. Di Valentino, E. Lisi, A. Marrone, A. Melchiorri, and A. Palazzo, Phys. Rev. D 101, 116013 (2020).
- de Salas et al. (2021) P. F. de Salas, D. V. Forero, S. Gariazzo, P. Martínez-Miravé, O. Mena, C. A. Ternes, M. Tórtola, and J. W. F. Valle, JHEP 02, 071 (2021), arXiv:2006.11237 [hep-ph] .
- Lu (2021) H. Lu (JUNO), Phys. Scripta 96, 094013 (2021).
- Aiello et al. (2021) S. Aiello et al. (KM3NeT), (2021), arXiv:2103.09885 [hep-ex] .
- Abi et al. (2020) B. Abi et al. (DUNE), JINST 15, T08008 (2020), arXiv:2002.02967 [physics.ins-det] .
- Abe et al. (2018) K. Abe et al. (Hyper-Kamiokande), (2018), arXiv:1805.04163 [physics.ins-det] .
- Caldwell et al. (2017) A. Caldwell, A. Merle, O. Schulz, and M. Totzauer, Phys. Rev. D 96, 073001 (2017), arXiv:1705.01945 [hep-ph] .
- Agostini et al. (2021b) M. Agostini, G. Benato, S. Dell’Oro, S. Pirro, and F. Vissani, Phys. Rev. D 103, 033008 (2021b), arXiv:2012.13938 [hep-ph] .
- Lahav and Liddle (2019) O. Lahav and A. R. Liddle, (2019), arXiv:1912.03687 [astro-ph.CO] .
- Aker et al. (2021) M. Aker et al. (KATRIN), (2021), arXiv:2103.04755 [physics.ins-det] .
- Ashtari Esfahani et al. (2017) A. Ashtari Esfahani et al. (Project 8), J. Phys. G 44, 054004 (2017), arXiv:1703.02037 [physics.ins-det] .
- Dvorkin et al. (2019) C. Dvorkin et al., (2019), arXiv:1903.03689 [astro-ph.CO] .
- Peng et al. (2016) T. Peng, M. J. Ramsey-Musolf, and P. Winslow, Phys. Rev. D 93, 093002 (2016), arXiv:1508.04444 [hep-ph] .
- Abgrall et al. (2017a) N. Abgrall et al. (Majorana), Phys. Rev. Lett. 118, 161801 (2017a), arXiv:1612.00886 [nucl-ex] .
- Agostini et al. (2020a) M. Agostini et al. (Gerda), Phys. Rev. Lett. 125, 011801 (2020a), arXiv:2005.14184 [hep-ex] .
- Xu and Elliott (2017) W. Xu and S. R. Elliott, Astropart. Phys. 89, 39 (2017), arXiv:1610.03886 [hep-ex] .
- Agostini et al. (2015a) M. Agostini et al., Eur. Phys. J. C 75, 416 (2015a), arXiv:1501.02345 [nucl-ex] .
- Bolton et al. (2021) P. D. Bolton, F. F. Deppisch, L. Gráf, and F. Šimkovic, Phys. Rev. D 103, 055019 (2021), arXiv:2011.13387 [hep-ph] .
- Agostini et al. (2021c) M. Agostini, E. Bossio, A. Ibarra, and X. Marcano, Phys. Lett. B 815, 136127 (2021c), arXiv:2012.09281 [hep-ph] .
- Díaz et al. (2013) J. S. Díaz, A. Kostelecký, and R. Lehnert, Phys. Rev. D 88, 071902 (2013), arXiv:1305.4636 [hep-ph] .
- Díaz (2014) J. S. Díaz, Phys. Rev. D 89, 036002 (2014), arXiv:1311.0930 [hep-ph] .
- Azzolini et al. (2019) O. Azzolini et al. (CUPID), Phys. Rev. D 100, 092002 (2019), arXiv:1911.02446 [nucl-ex] .
- Deppisch et al. (2020) F. F. Deppisch, L. Graf, and F. Šimkovic, Phys. Rev. Lett. 125, 171801 (2020), arXiv:2003.11836 [hep-ph] .
- Arnold et al. (2020) R. Arnold et al. (NEMO-3), (2020), arXiv:2011.07657 [nucl-ex] .
- Liu et al. (2019) Z. Z. Liu et al. (CDEX), Phys. Rev. Lett. 123, 161301 (2019), arXiv:1905.00354 [hep-ex] .
- Alvis et al. (2019a) S. Alvis et al. (Majorana), Phys. Rev. D 99, 072004 (2019a), arXiv:1812.01090 [hep-ex] .
- Alvis et al. (2018) S. Alvis et al. (Majorana), Phys. Rev. Lett. 120, 211804 (2018), arXiv:1801.10145 [hep-ex] .
- Dror et al. (2020) J. A. Dror, G. Elor, and R. Mcgehee, JHEP 02, 134 (2020), arXiv:1908.10861 [hep-ph] .
- Ha et al. (2019) C. Ha et al. (COSINE-100), Phys. Rev. Lett. 122, 131802 (2019), arXiv:1811.09344 [astro-ph.IM] .
- Agostini et al. (2016a) M. Agostini et al. (Gerda), Eur. Phys. J. C 76, 652 (2016a), arXiv:1605.01756 [nucl-ex] .
- Blum et al. (2018) K. Blum, Y. Nir, and M. Shavit, Phys. Lett. B 785, 354 (2018), arXiv:1802.08019 [hep-ph] .
- Piscicchia et al. (2015) K. Piscicchia et al., Acta Phys. Polon. B 46, 147 (2015), arXiv:1501.04462 [quant-ph] .
- Graesser et al. (2021) M. L. Graesser, I. M. Shoemaker, and N. T. Arellano, (2021), arXiv:2105.05769 [hep-ph] .
- Aprile et al. (2020) E. Aprile et al. (XENON), Phys. Rev. D 102, 072004 (2020), arXiv:2006.09721 [hep-ex] .
- Klapdor-Kleingrothaus et al. (2001) H. V. Klapdor-Kleingrothaus et al., Eur. Phys. J. A 12, 147 (2001), arXiv:hep-ph/0103062 .
- Aalseth et al. (2002) C. E. Aalseth et al. (IGEX), Phys. Rev. D 65, 092007 (2002), arXiv:hep-ex/0202026 .
- Klapdor-Kleingrothaus et al. (2004) H. V. Klapdor-Kleingrothaus, I. V. Krivosheina, A. Dietz, and O. Chkvorets, Phys. Lett. B 586, 198 (2004), arXiv:hep-ph/0404088 .
- Andreotti et al. (2011) E. Andreotti et al., Astropart. Phys. 34, 822 (2011), arXiv:1012.3266 [nucl-ex] .
- Arnold et al. (2015) R. Arnold et al. (NEMO-3), Phys. Rev. D 92, 072011 (2015), arXiv:1506.05825 [hep-ex] .
- Agostini et al. (2020b) M. Agostini et al. (Gerda), Phys. Rev. Lett. 125, 252502 (2020b), arXiv:2009.06079 [nucl-ex] .
- Aalseth et al. (2018a) C. Aalseth et al. (Majorana), Phys. Rev. Lett. 120, 132502 (2018a), arXiv:1710.11608 [nucl-ex] .
- Alvis et al. (2019b) S. I. Alvis et al. (Majorana), Phys. Rev. C 100, 025501 (2019b), arXiv:1902.02299 [nucl-ex] .
- Anton et al. (2019) G. Anton et al. (EXO-200), Phys. Rev. Lett. 123, 161802 (2019), arXiv:1906.02723 [hep-ex] .
- Gando et al. (2016) A. Gando et al. (KamLAND-Zen), Phys. Rev. Lett. 117, 082503 (2016), [Addendum: Phys. Rev. Lett.117, no.10, 109903(2016)], arXiv:1605.02889 [hep-ex] .
- Adams et al. (2020) D. Q. Adams et al. (CUORE), Phys. Rev. Lett. 124, 122501 (2020), arXiv:1912.10966 [nucl-ex] .
- Adams et al. (2021) D. Q. Adams et al. (CUORE), (2021), arXiv:2104.06906 [nucl-ex] .
- Adhikari et al. (2021) G. Adhikari et al. (nEXO), (2021), arXiv:2106.16243 [nucl-ex] .
- Armstrong et al. (2019) W. R. Armstrong et al. (CUPID), (2019), arXiv:1907.09376 [physics.ins-det] .
- Avignone and Elliott (2019) F. T. Avignone and S. R. Elliott, Front. in Phys. 7, 6 (2019), arXiv:1901.02805 [nucl-ex] .
- Luke et al. (1989) P. Luke, F. Goulding, N. Madden, and R. Pehl, IEEE Transactions on Nuclear Science 36, 926 (1989).
- Agostini et al. (2015b) M. Agostini et al. (Gerda), Eur. Phys. J. C 75, 39 (2015b), arXiv:1410.0853 [physics.ins-det] .
- Cooper et al. (2011) R. J. Cooper, D. C. Radford, P. A. Hausladen, and K. Lagergren, Nucl. Instrum. Methods Phys. Res., Sect. A 665, 25 (2011).
- Comellato et al. (2021) T. Comellato, M. Agostini, and S. Schönert, Eur. Phys. J. C 81, 76 (2021), arXiv:2007.12910 [physics.ins-det] .
- Agostini et al. (2021d) M. Agostini et al. (Gerda), Eur. Phys. J. C 81, 505 (2021d), arXiv:2103.15111 [physics.ins-det] .
- Agostini et al. (2020c) M. Agostini et al. (Gerda), JHEP 03, 139 (2020c), arXiv:1909.02522 [nucl-ex] .
- Abgrall et al. (2016) N. Abgrall et al. (Majorana), Nucl. Instrum. Meth. A 828, 22 (2016), arXiv:1601.03779 [physics.ins-det] .
- Buuck (2019) M. Buuck, A Radiogenic Background Model for the Majorana Demonstrator, Ph.D. thesis, University of Washington (2019).
- Gilliss (2019) T. F. Gilliss, Statistical Modeling and Markov Chain Monte Carlo Inference of Majorana Demonstrator Background Data, Ph.D. thesis, University of North Carolina, Chapel Hill (2019).
- Agostini et al. (2021e) M. Agostini et al. (Gerda), (2021e), arXiv:2103.13777 [physics.ins-det] .
- Arnquist et al. (2020a) I. J. Arnquist, C. Beck, M. L. di Vacri, K. Harouaka, and R. Saldanha, Nucl. Instrum. Meth. A 959, 163573 (2020a), arXiv:1910.04317 [physics.ins-det] .
- Edzards et al. (2020) F. Edzards et al., JINST 15, P09022 (2020), arXiv:2005.10366 [physics.ins-det] .
- Terasaki (2020) J. Terasaki, Phys. Rev. C 102, 044303 (2020), arXiv:2003.03542 [nucl-th] .
- Deppisch et al. (2015) F. F. Deppisch, P. S. Bhupal Dev, and A. Pilaftsis, New J. Phys. 17, 075019 (2015), arXiv:1502.06541 [hep-ph] .
- Abgrall et al. (2018) N. Abgrall et al. (Majorana), Nucl. Instrum. Meth. A 877, 314 (2018), arXiv:1707.06255 [physics.ins-det] .
- Barabanov et al. (2006) I. Barabanov, S. Belogurov, L. B. Bezrukov, A. Denisov, V. Kornoukhov, and N. Sobolevsky, Nucl. Instrum. Meth. B 251, 115 (2006), arXiv:nucl-ex/0511049 .
- Bruyneel et al. (2016) B. Bruyneel, B. Birkenbach, and P. Reiter, Eur. Phys. J. A 52, 70 (2016).
- Agostini et al. (2019) M. Agostini et al. (Gerda), Eur. Phys. J. C 79, 978 (2019), arXiv:1901.06590 [physics.ins-det] .
- Barabanov et al. (2009) I. Barabanov, L. Bezrukov, E. Demidova, V. Gurentsov, S. Kianovsky, K. T. Knopfle, V. Kornouhkov, B. Schwingenheuer, and A. Vasenko, Nucl. Instrum. Meth. A 606, 790 (2009).
- Acciarri et al. (2009) R. Acciarri et al., Nucl. Phys. B Proc. Suppl. 197, 70 (2009).
- Acciarri et al. (2010) R. Acciarri et al. (WArP), JINST 5, P05003 (2010), arXiv:0804.1222 [nucl-ex] .
- Agnes et al. (2018) P. Agnes et al. (DarkSide), Phys. Rev. D 98, 102006 (2018), arXiv:1802.07198 [astro-ph.CO] .
- Aalseth et al. (2018b) C. E. Aalseth et al. (DarkSide-20k), Eur. Phys. J. Plus 133, 131 (2018b), arXiv:1707.08145 [physics.ins-det] .
- Wang et al. (2019) Y. Wang et al., “A Global Liquid Dark Matter Search Program,” (2019), Presentation at APS April Meeting 2019, Session H17: WIMP DARK matter II.
- Agnes et al. (2021a) P. Agnes et al. (DarkSide 20k), JCAP 03, 043 (2021a), arXiv:2011.07819 [astro-ph.HE] .
- Agostini et al. (2015c) M. Agostini et al., Eur. Phys. J. C 75, 506 (2015c), arXiv:1501.05762 [physics.ins-det] .
- Csáthy et al. (2016) J. J. Csáthy, T. Bode, J. Kratz, S. Schönert, and C. Wiesinger, (2016), arXiv:1606.04254 [physics.ins-det] .
- Agostini et al. (2018) M. Agostini et al. (Gerda), Eur. Phys. J. C 78, 388 (2018), arXiv:1711.01452 [physics.ins-det] .
- Michael et al. (2008) D. Michael et al. (MINOS), Nucl. Instrum. Meth. A 596, 190 (2008), arXiv:0805.3170 [physics.ins-det] .
- Adamson et al. (2004) P. Adamson et al., Nucl. Instrum. Meth. A 521, 361 (2004).
- Ayres et al. (2007) D. Ayres et al. (NOvA), (2007), 10.2172/935497, https://www.osti.gov/biblio/935497.
- Ayres et al. (2004) D. Ayres et al. (NOvA), (2004), arXiv:hep-ex/0503053 .
- Pahlka et al. (2019) R. Pahlka, G. Elpers, J. Huang, K. Lang, and M. Proga, (2019), arXiv:1911.03790 [physics.ins-det] .
- Barabash et al. (2017) A. Barabash et al., Nucl. Instrum. Meth. A 868, 98 (2017), arXiv:1707.06823 [physics.ins-det] .
- Barton et al. (2016) P. Barton, M. Amman, R. Martin, and K. Vetter, Nucl. Instrum. Meth. A 812, 17 (2016), arXiv:1512.00574 [physics.ins-det] .
- Bombelli et al. (2011) L. Bombelli, C. Fiorini, T. Frizzi, R. Alberti, and A. Longoni, in 2011 IEEE Nuclear Science Symposium Conference Record (2011) pp. 1972–1975.
- Abgrall et al. (2017b) N. Abgrall et al., Nucl. Instrum. Meth. A 872, 16 (2017b), arXiv:1702.02466 [physics.ins-det] .
- Baudis et al. (2013) L. Baudis, A. D. Ferella, F. Froborg, and M. Tarka, Nucl. Instrum. Meth. A729, 557 (2013), arXiv:1303.6679 [physics.ins-det] .
- Baudis et al. (2015) L. Baudis, G. Benato, P. Carconi, C. M. Cattadori, P. De Felice, K. Eberhardt, R. Eichler, A. Petrucci, M. Tarka, and M. Walter, JINST 10, P12005 (2015), arXiv:1508.05731 [physics.ins-det] .
- Nakamura et al. (2011) H. Nakamura, Y. Shirakawa, S. Takahashi, and H. Shimizu, EPL (Europhysics Letters) 95, 22001 (2011).
- Majorovits et al. (2018) B. Majorovits, S. Eck, F. Fischer, C. Gooch, C. Hayward, T. Kraetzschmar, N. van der Kolk, D. Muenstermann, O. Schulz, and F. Simon, AIP Conf. Proc. 1921, 090001 (2018), arXiv:1708.09265 [physics.ins-det] .
- Wetzel et al. (2020) J. Wetzel, N. Bostan, O. K. Köseyan, E. Tiras, and B. Bilki, Turk. J. Phys. 44, 437 (2020), arXiv:1912.11342 [physics.ins-det] .
- Kuźniak et al. (2019) M. Kuźniak, B. Broerman, T. Pollmann, and G. R. Araujo, Eur. Phys. J. C 79, 291 (2019), arXiv:1806.04020 [physics.ins-det] .
- Boulay et al. (2021) M. G. Boulay et al., (2021), arXiv:2106.15506 [physics.ins-det] .
- Garankin et al. (2018) J. Garankin, A. Plukis, R. Plukienė, E. Lagzdina, and V. Remeikis, IEEE Transactions on Nuclear Science 65, 739 (2018).
- Efremenko et al. (2019) Y. Efremenko et al., JINST 14, P07006 (2019), arXiv:1901.03579 [physics.ins-det] .
- Heindl et al. (2010) T. Heindl, T. Dandl, M. Hofmann, R. Krucken, L. Oberauer, W. Potzel, J. Wieser, and A. Ulrich, EPL 91, 62002 (2010), arXiv:1511.07718 [physics.ins-det] .
- Christofferson et al. (2018) C. D. Christofferson et al. (Majorana), AIP Conf. Proc. 1921, 060005 (2018), arXiv:1711.10361 [physics.ins-det] .
- LaFerriere et al. (2015) B. LaFerriere, T. Maiti, I. Arnquist, and E. Hoppe, Nucl. Instrum. Meth. A 775, 93 (2015).
- Neder et al. (2000) H. Neder, G. Heusser, and M. Laubenstein, Applied Radiation and Isotopes 53, 191 (2000).
- Rau and Heusser (2000) W. Rau and G. Heusser, Applied Radiation and Isotopes 53, 371 (2000).
- Zuzel and Simgen (2009) G. Zuzel and H. Simgen, Applied Radiation and Isotopes 67, 889 (2009), 5th International Conference on Radionuclide Metrology - Low-Level Radioactivity Measurement Techniques ICRM-LLRMT’08.
- Zuzel (2005) G. Zuzel, AIP Conf. Proc. 785, 142 (2005).
- Zuzel et al. (2017) G. Zuzel, K. Pelczar, and M. Wójcik, Applied Radiation and Isotopes 126, 165 (2017), proceedings of the 7th International Conference on Radionuclide Metrology – Low-Level Radioactivity Measurement Techniques.
- Zuzel (2019) G. Zuzel, in 7th Topical Workshop on Low Radioactivity Techniques (LRT 2019): Jaca, Spain, May 19 - 23 (2019).
- Zuzel et al. (2018) G. Zuzel, K. Pelczar, and M. Wójcik, Proceedings, 6th Topical Workshop on Low Radioactivity Techniques (LRT 2017): Seoul, Korea, May 24-26, 2017, AIP Conf. Proc. 1921, 070004 (2018).
- Mroz (2019) K. Mroz, in 7th Topical Workshop on Low Radioactivity Techniques (LRT 2019): Jaca, Spain, May 19 - 23 (2019).
- Heusser (1995) G. Heusser, Ann. Rev. Nucl. Part. Sci. 45, 543 (1995).
- Peurrung et al. (1997) A. J. Peurrung, T. W. Bowyer, R. A. Craig, and P. L. Reeder, Nucl. Instrum. Meth. A 396, 425 (1997).
- Amsbaugh et al. (2007) J. F. Amsbaugh et al., Nucl. Instrum. Meth. A 579, 1054 (2007), arXiv:0705.3665 [nucl-ex] .
- Agostini et al. (2014) M. Agostini et al. (Gerda), Eur. Phys. J. C 74, 2764 (2014), arXiv:1306.5084 [physics.ins-det] .
- Agostini et al. (2017b) M. Agostini et al. (Gerda), Astropart. Phys. 91, 15 (2017b), arXiv:1611.06884 [physics.ins-det] .
- Freund et al. (2016) K. Freund et al., Eur. Phys. J. C 76, 298 (2016), arXiv:1601.05935 [physics.ins-det] .
- Lubashevskiy et al. (2018) A. Lubashevskiy et al., Eur. Phys. J. C 78, 15 (2018), arXiv:1708.00226 [physics.ins-det] .
- Busch et al. (2018) M. Busch et al., Proceedings, 6th Topical Workshop on Low Radioactivity Techniques (LRT 2017): Seoul, Korea, May 24-26, 2017, AIP Conf. Proc. 1921, 070002 (2018), arXiv:1712.04985 [physics.ins-det] .
- Dobson et al. (2018) J. Dobson, C. Ghag, and L. Manenti, Nucl. Instrum. Meth. A879, 25 (2018), arXiv:1708.08860 [physics.ins-det] .
- Lindemann and Simgen (2014) S. Lindemann and H. Simgen, Eur. Phys. J. C 74, 2746 (2014), arXiv:1308.4806 [physics.ins-det] .
- Christofferson (2019) C. D. Christofferson, in 7th Topical Workshop on Low Radioactivity Techniques (LRT 2019): Jaca, Spain, May 19 - 23 (2019).
- Guiseppe et al. (2018) V. E. Guiseppe, C. D. Christofferson, K. R. Hair, and F. M. Adams, AIP Conf. Proc. 1921, 070003 (2018), arXiv:1712.08167 [physics.ins-det] .
- Zuzel and Wójcik (2012) G. Zuzel and M. Wójcik, Nuclear Instruments and Methods in Physics Research Section A: Accelerators, Spectrometers, Detectors and Associated Equipment 676, 140 (2012).
- Zuzel et al. (2012) G. Zuzel, M. Wójcik, B. Majorovits, M. Lampert, and P. Wendling, Nuclear Instruments and Methods in Physics Research Section A: Accelerators, Spectrometers, Detectors and Associated Equipment 676, 149 (2012).
- Abgrall et al. (2021) N. Abgrall et al. (Majorana), IEEE Trans. Nucl. Sci. 68, 359 (2021), arXiv:2003.04128 [physics.ins-det] .
- Jordanov and Knoll (1994) V. T. Jordanov and G. F. Knoll, Nuclear Instruments and Methods in Physics Research A 345, 337 (1994).
- Agostini et al. (2015d) M. Agostini et al. (Gerda), Eur. Phys. J. C 75, 255 (2015d).
- Agostini et al. (2015e) M. Agostini et al. (Gerda), Eur. Phys. J. C 75, 255 (2015e), arXiv:1502.04392 [physics.ins-det] .
- Arnquist et al. (2020b) I. Arnquist et al. (Majorana), (2020b), arXiv:2006.13179 [physics.ins-det] .
- Budjas et al. (2009) D. Budjas, M. Barnabe Heider, O. Chkvorets, N. Khanbekov, and S. Schonert, JINST 4, P10007 (2009), arXiv:0909.4044 [nucl-ex] .
- Alvis et al. (2019c) S. Alvis et al. (Majorana), Phys. Rev. C 99, 065501 (2019c), arXiv:1901.05388 [physics.ins-det] .
- Agostini et al. (2012) M. Agostini, L. Pandola, and P. Zavarise, J. Phys. Conf. Ser. 368, 012047 (2012), arXiv:1111.3582 [physics.data-an] .
- Wiesinger et al. (2018) C. Wiesinger, L. Pandola, and S. Schönert, Eur. Phys. J. C 78, 597 (2018), arXiv:1802.05040 [hep-ex] .
- Agostini et al. (2013) M. Agostini et al. (Gerda), Eur. Phys. J. C 73, 2583 (2013).
- Boswell et al. (2011) M. Boswell et al., IEEE Trans. Nucl. Sci. 58, 1212 (2011), arXiv:1011.3827 [nucl-ex] .
- Agostinelli et al. (2003) S. Agostinelli et al. (GEANT4), Nucl. Instrum. Meth. A 506, 250 (2003).
- Wiesinger (2020) C. Wiesinger, No neutrinos not found, Ph.D. thesis, Technische Universität München, München (2020).
- Pertoldi (2021) L. Pertoldi, Search for new physics with two-neutrino double-beta decay in GERDA data, Ph.D. thesis, Universitá degli Studi di Padova (2021).
- Elliott et al. (2010) S. Elliott, V. Guiseppe, B. LaRoque, R. Johnson, and S. Mashnik, Phys. Rev. C 82, 054610 (2010), arXiv:0912.3748 [nucl-ex] .
- Benziger et al. (2007) J. Benziger et al., Nucl. Instrum. Meth. A 582, 509 (2007), arXiv:physics/0702162 .
- Agnes et al. (2021b) P. Agnes et al. (DarkSide-20k), Eur. Phys. J. C 81, 359 (2021b), arXiv:2101.08686 [physics.ins-det] .
- Lehnert (2016) B. Lehnert, Search for 2 Excited State Transitions and HPGe Characterization for Surface Events in GERDA Phase II, Ph.D. thesis, Technische Universität Dresden (2016).
- Barton (2021) C. Barton (LEGEND), PoS ICHEP2020, 195 (2021).
- Maneschg et al. (2008) W. Maneschg, M. Laubenstein, D. Budjas, W. Hampel, G. Heusser, K. T. Knopfle, B. Schwingenheuer, and H. Simgen, Nucl. Instrum. Meth. A 593, 448 (2008).
- Westerdale and Meyers (2017) S. Westerdale and P. D. Meyers, Nucl. Instrum. Meth. A 875, 57 (2017), arXiv:1702.02465 [physics.ins-det] .
- Smith (2012) N. J. T. Smith, Eur. Phys. J. Plus 127, 108 (2012).
- Heise (2020) J. Heise, J. Phys. Conf. Ser. 1342, 012085 (2020), arXiv:1710.11584 [physics.ins-det] .
- Reichhart et al. (2013) L. Reichhart et al., Astropart. Phys. 47, 67 (2013), arXiv:1302.4275 [physics.ins-det] .
- Boulby Feasibility Study Report (2021) Boulby Feasibility Study Report, In preparation (2021).
- Agostini et al. (2016b) M. Agostini et al. (Gerda), Astropart. Phys. 84, 29 (2016b), arXiv:1601.06007 [physics.ins-det] .
- Abgrall et al. (2017c) N. Abgrall et al. (Majorana), Astropart. Phys. 93, 70 (2017c), arXiv:1602.07742 [nucl-ex] .
- Duncan et al. (2010) F. Duncan, A. Noble, and D. Sinclair, Annu. Rev. Nucl. Part. Sci. 60, 163 (2010).
- Aglietta et al. (1992) M. Aglietta et al., Nuovo Cim. A 105, 1793 (1992).
- Alimonti et al. (2009) G. Alimonti et al. (Borexino), Nucl. Instrum. Meth. A 600, 568 (2009), arXiv:0806.2400 [physics.ins-det] .
- Pandola et al. (2007) L. Pandola, M. Bauer, K. Kroninger, X. Liu, C. Tomei, S. Belogurov, D. Franco, A. Klimenko, and M. Knapp, Nucl. Instrum. Meth. A 570, 149 (2007).