Detecting Partial Reachability In The Internet Core
released 2021-07-23, updated 2022-05-24, 2022-03-20, 2023-10-26
Abstract.
The Internet core should seamlessly connect home and mobile users to servers, CDNs, and the cloud. Yet seamless, universal connectivity is challenged in several ways. Political pressure threatens fragmentation due to de-peering; architectural changes such as carrier-grade NAT and firewalls can impede connectivity; and operational problems and commercial disputes result in unreachability for days or even years. We must recognize that partial reachability is a fundamental part of the Internet’s core. To understand reachability we define peninsulas, persistent, partial connectivity; and islands, when one or more computers are partitioned from the main Internet. We develop new algorithms to measure the number, size, and duration of peninsulas and islands. These algorithms follow from a conceptual definition of the Internet’s core defined by connectivity, not special authority. Recognizing peninsulas and islands can improve existing measurement systems in several ways. We show how to improve the sensitivity of DNSmon, removing measurement error and persistent problems are to larger than its operationally important signal. Partial connectivity clarifies results seen in several outage detection systems that otherwise appear self-contradictory. Our analysis also informs policy questions and confirming the international nature of the Internet: no single country today unilaterally controls the Internet core, but countries can choose to leave. We validate and evaluate these algorithms with rigorous measurements from two complementary measurement systems, one observing 5M networks from a few locations, and the other a few destinations from 10k locations, and with external data. Results show that peninsulas (partial connectivity) are about as common as Internet outages, quantifying this long-observed problem. Root causes show that most peninsula events (45%) are routing transients, but most peninsula-time (90%) is from a few long-lived events (7%).
- AS
- Autonomous System
- RDNS
- Reverse DNS
- VP
- Vantage Point
1. Introduction
What is the Internet’s core? In 1982, Smallberg’s census of the IPv4 Internet showed 83 telnet-reachable hosts in the Internet, a globally reachable core. And in 1995, the Federal Networking Council defined “Internet” in 1995 as (i) a global address space, (ii) supporting TCP/IP and its follow-ons, that (iii) provides services (Federal Networking Council (FNC), 1995), with later work considering DNS (Internet Architecture Board, 2000) and IPv6. But today’s Internet is dramatically different than 1995: Users at home and work access the Internet indirectly through Network Address Translation (NAT) (Tsuchiya and Eng, 1993). Most access is from mobile devices, often behind Carrier-Grade NAT (CG-NAT) (Richter et al., 2016). Many public services are operated from the cloud, visible through rented or imported IP addresses, but backed with complex services built on virtual networks (for example (Greenberg et al., 2009)). Content is replicated in Content Delivery Networks. Access to each is mediated by firewalls. Today’s Internet services are so seamless that technical details recede into the background and laypeople consider the web, Facebook, or their mobile phone as their “Internet”.
Challenges: Yet universal reachability in Internet core today is often challenged. Political pressure and threats of disconnection suggest national borders may balkanize the core: the 2019 “sovereign Internet” law in Russia (News, 2019; daily, 2021; Reuters, 2021), and a national “Internet kill switch” has been debated (including the U.S. (GovTrack.us, 2020) and U.K.), and employed (Cowie, 2011; Coca, 2018; Griffiths, 2019; Taye and Cheng, 2019) These pressures prompted policy discussions about fragmentation (Drake et al., 2016; (moderator), 2022). We suggest that technical methods can help inform policy discussions and show what is at risk for the global Internet from threats such as de-peering. We will show that no single country can unilaterally control the Internet today (§ 6.1). We also show that de-peering can fragment the Internet into pieces (§ 6.2).
Architecturally, twenty-five years of evolution have segmented the Internet, services gatewayed through proprietary cloud APIs, users increasingly relegated to second-class status as clients, often behind CG-NAT, firewalls interrupt connectivity, and a world straddling a mix of IPv4 and IPv6. Architecture sometimes follows politics, with China’s Great Firewall managing international communication (Anonymous, 2012, 2014), and Huawei proposing “new Internet” protocols (Engadget, 2020). We suggest that technical methods to detect can help us reason about changes to Internet architecture, both to understand the implications of partial address reachability and evaluate the maturity of IPv6.
Operationally, ISP peering is mature, but today peering disputes cause long-term partial unreachability (Knowledge, 2009). This unevenness has been recognized and detected experimentally (Dhamdhere et al., 2018), and in systems that detect and bypass partial reachability (Andersen et al., 2001; Katz-Bassett et al., 2008; Katz-Bassett et al., 2012). We show several operational uses of our work. We show that accounting partial reachability can make existing measurement systems more sensitive, applying these results to widely used RIPE DNSmon (§ 6.4). DNSmon sees persistent high query loss (5–8%) in DNS Root Server System (Root Operators, 2016), but most of this loss is due to measurement error or persistent partial connectivity, factors that are and larger than the operationally important signal in IPv4 and IPv6. Our analysis also helps uncertainty in multiple, independently developed outage detection systems (§ 6.3). All existing outage detection systems encounter “corner cases” (Schulman and Spring, 2011; Quan et al., 2013; Shah et al., 2017; Richter et al., 2018; Guillot et al., 2019) and conflicting observations. We show those are due to partial reachability, and we show partial reachability is as common as complete outages (§ 5.1). Our work also helps quantify the applicability of systems that, since 2001, route around partial reachability (Andersen et al., 2001; Katz-Bassett et al., 2008; Katz-Bassett et al., 2012), and show that clouds can improve reliability with egress selection (for example, (Schlinker et al., 2017)).
Contributions: The first contribution of this paper is to recognize partial reachability is a fundamental part of the Internet’s core. We define peninsulas, when a network sees persistent, partial connectivity to part of the Internet, and islands, when one or more computers are partitioned from the main Internet. We develop algorithms to measure each (§ 3). Taitao detects peninsulas that often result from peering disputes or long-term firewalls. Our second algorithm, Chiloe, detects islands. These algorithms are operational, able to estimate the presence of peninsulas and islands in existing measurement data from two different Internet-wide measurement systems.
A rigorous definition of peninsulas and islands requires that we identify the Internet’s core. The Internet’s core is the connected component of more than 50% of active, public IP addresses that can initiate communication with each other (§ 2.1). This definition has several unique characteristics. First, requiring bidirectional initiation captures the uniform, peer-to-peer nature of the Internet’s core necessary for first-class services. Second, it defines one, unique Internet core by requiring reachability of more than 50%—there can be only one since multiple majorities are impossible. Finally, unlike prior work, this conceptual definition avoids dependence on any specific measurement system, nor does it depend on historical precedent, special locations, or central authorities. Although our operational measurements of peninsulas and islands may reflect observation error, the conceptual Internet core defines an asymptote against which our current and future measurements can compare, unlike prior definitions from specific systems (Andersen et al., 2001; Katz-Bassett et al., 2008; Katz-Bassett et al., 2012).
Our second contribution is to use peninsulas and islands to address current operational questions. As described earlier, we bring technical light to policy choices around national networks (§ 6.1) and de-peering (§ 6.2). We improve sensitivity of RIPE Atlas’ DNSmon (Amin et al., 2015) (§ 6.4), resolve corner cases in outage detection (§ 5.1), and quantify opportunities for route detouring.
Our final contribution is to support these claims with rigorous measurements from two measurement systems. We evaluate our new algorithms with publicly available, existing measurements of connectivity to 5M networks from six Vantage Points over multiple years (Quan et al., 2013). While a handful of locations cannot represent the entire Internet, each observer scans most of the ping-responsive Internet from a unique geographic and network location, providing a wide range of results over time. Our analysis shows that combinations of any three independent VPs provide a result that is statistically indistinguishable from the asymptote § 5.1. We show our algorithms provide consistent results, offering reproducible and useful estimates of Internet reachability and partial connectivity. We also validate interesting events with selective traceroutes.
We also evaluate about 10k globally distributed VPs (RIPE Atlas, (RIPE NCC Staff, 2015)) observing connectivity to 13 anycast destinations (the Root Server System (Root Operators, 2016)). These observations from thousands of locations over multiple years validate the occurrence of rare events like islands, and demonstrate how pervasive peninsulas are. They confirm our results of Internet-wide scans, and allow us to tune DNSmon, as described earlier.
Artifacts: All of the data used (§ 3.1) and created (ANT Project, 2022) in this paper is available at no cost. We review ethics in detail in § A, but our bulk analysis of IP addresses does not associate them with individuals. Our work was IRB reviewed and identified as non-human subjects research (USC IRB IIR00001648).
This technical report was first released in July 2021. In May 2022 it was updated with several additions: a more careful definitions in § 2.1 and § 2.2, new information about island durations § 5.5 and sizes § 5.6, expanded applications in § 3.5 and § 6.1 and § 6.2, considerable additional details and supporting data in appendices, and many writing improvements. In October 2023 we updated it to address typos and missing references.
2. The Problem of Partial Reachability
To understand partial reachability, we first must define what is being reached. Our goal is to rigorously define the Internet’s core. Historically it was assumed that “the Internet” was whatever was reached by the global IPv4 address space over a common TCP/IP protocol (Cerf and Kahn, 1974; Postel, 1980; Federal Networking Council (FNC), 1995). However, today’s challenges impose two new requirements. First, a definition should be both conceptual and operational (Dunn, 2021). Our conceptual definition in § 2.1 articulates what we would like to observe. In § 3 we operationalize it, describing how actual measurement systems can use it to evaluate peninsulas and islands relative to the Internet’s core. The conceptual definition suggests a limit that implementations can approach (§ 5.1), even if it cannot be directly implemented. Prior definitions are too vague to operationalize.
Second, a definition must give both sufficient and necessary conditions to be part of the Internet’s core. Prior work gave properties the core must have (sufficient conditions, like supporting TCP). We add necessary conditions that indicate when networks leave the Internet’s core.
Finally, the “challenges” listed in § 1 motivate why we define the Internet’s core: doing so will help answer political, architectural, and operational questions.
2.1. The Internet: A Conceptual Definition
We define the Internet core as the connected component of more than 50% of active, public IP addresses that can initiate communication with each other. Computers behind NAT and in the cloud are on branches, participating but not part of the core, typically with dynamically allocated or leased public IP addresses. This conceptual definition gives two Internet cores, one for the IPv4 address space and one for IPv6.
This definition follows from the terms “interconnected networks”, “IP protocol”, and “global address space” used in prior, informal definitions (Cerf and Kahn, 1974; Postel, 1980; Federal Networking Council (FNC), 1995)—they all share the common assumption that two computers on the Internet should be able to communicate directly with each other at the IP layer.
We formalize “an agreement of networks to interconnect” by considering reachability over public IP addresses: addresses and are interconnected if traffic from can reach and vice versa (that is: and can reach each other). Networks are groups of addresses that can reach each other.
Why More than 50%? We take as an axiom that there should be one Internet core, or reason a single Internet core no longer exists. Thus we require a definition to unambiguously identify “the” Internet core given conflicting claims.
We require that the Internet core include more than 50% of active addresses so that the majority can settle conflicting claims. Only one group can control a majority of addresses, while any smaller fraction could allow two groups to make valid claims. A strict majority ensures that there is always a well-defined Internet core even if a major nation (or group of nations) chose to secede, because it defines a unique, unambiguous partition that keeps the Internet.
Prior discussions of the Internet identified “Tier-1” ISPs, but strict definitions of that term remain elusive. Our definition allows us to reason about differences between what ISPs see, even when ISPs have long-term peering disputes and partial connectivity.
This definition suggests that it is possible for the Internet to fragment: if the current Internet breaks into three disconnected components when none has a majority of active addresses. Such a result would end a single, global Internet.
Why all and active addresses? In each of IPv4 and IPv6 we consider all addresses equally. The Internet is global, and was intentionally designed without a hierarchy (Clark, 1988). Our definition should not create a hierarchy or designate special addresses by age or importance, consistent with trends towards Internet decentralization (DINRG, 2021).
Active addresses as blocks that are reachable, as defined below. Our goal is to exclude the influence of large allocated, but unused, space. Large unused space is present in IPv4 legacy /8 allocations and in large new IPv6 allocations.
Reachability with Protocols and Firewalls: This conceptual definition allows for different definitions of reachability. Reachability can be tested through measurements with specific protocols, such as ICMP echo-request (pings), or TCP or UDP queries. Such a test will result in an operational realization of our conceptual definition. Particular tests will differ in how closely each approaches the conceptual ideal. In § 5.1 we examine how well one test converges.
Our conceptual definition considers reachability, observations of this potential are complicated by firewalls (which are sometimes conditional or unidirectional). Answers may vary with different protocols or observations at different times. One could define reachability narrowly, or using firewall-friendly protocols. Measurement allows us to evaluate policy-driven unreachability in § E.3.
Our operational data uses ICMP echo requests (§ 3.1), following prior work that compared alternatives (Bartlett et al., 2007; Quan et al., 2013; Durumeric et al., 2014) and showed ICMP provides better coverage than alternatives, and can avoid attenuation from rate limiting (Guo and Heidemann, 2018).
Why reachability and not applications? Users care about applications, and a user-centric view might emphasize reachability of HTTP or to Facebook rather than at the IP layer. We recognize this attention, but intentionally measure reachability at the IP layer as a more fundamental concept. IP has changed only twice since 1969 with IPv4 and IPv6, but dominant applications ebb and flow, and some applications extend beyond the Internet. (E-mail has been transparently relayed to UUCP and FidoNet, and the web to pre-IP mobile devices with WAP.) Future work may look at applications, but we see IP-level reachability as an essential starting point.
Why bidirectional reachability? Most computers today are on branches off the core, behind NAT or in the cloud. While such computers are useful as Internet clients, they are second-class servers. NAT’ed computers may use protocols such as STUN (Rosenberg et al., 2003) to rendezvous through the core, or UPnP (Miller et al., 2001) or PMP (Cheshire and Krochmal, 2013) that reconfigure a NAT on the core. Huge services run in the cloud by leasing public IP addresses from the cloud operator or importing their own (BYOIP).
Similarly, services may be implemented as many computers that share a single public IP address with load balancing or IP anycast (Partridge et al., 1993), perhaps with cloud-based address translation (Greenberg et al., 2009). Computers with only application-level availability are also not fully part of the Internet core.
2.2. The Internet Landscape
Our definition of the Internet’s core highlights its “rough edges”. Using our conceptual definition of the Internet as the fully connected component (§ 2.1), we identify three specific problems: an address is a peninsula when it has partial connectivity to the Internet’s core, an island when it cannot reach any of the Internet’s core, and an outage only when it is off.
2.2.1. Outages
A number of groups have examined Internet outages (Schulman and Spring, 2011; Quan et al., 2013; Richter et al., 2018; Guillot et al., 2019). These systems observe the IPv4 Internet and identify networks that are no longer reachable—they have left the Internet. Often these systems define outages operationally (network is out because none of our VPs can reach it). Conceptually, an outage is when all computers in a block are off, such as due to a power outage. When the computers are on but cannot reach the Internet, we consider them islands, a special case of outage that we defined next.
2.2.2. Islands: Isolated Networks
An island is a group of public IP addresses partitioned from the Internet’s core, but still able to communicate among themselves. Operationally outages and islands are both unreachable from an external VP, but computers in an island can reach each other.
Islands occur when an organization that has a single connection to the Internet loses its router or link to its ISP. A single-office business may become an island when its router’s upstream connection fails, but computers in the office can still reach each other and in-office servers. In the smallest case, an address island, a computer can ping only itself. Islands are a special case of outages, and we suspect that most outages are actually temporary islands. 2023-02-13
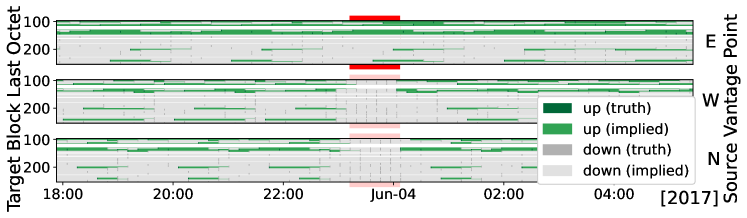
A Brief Island: Figure 1 shows an example of an island we have observed. In this graph, each strip shows a different VP’s view of the last 156 addresses from the same IPv4 /24 block over 12 hours. In each strip, the darkest green dots show positive responses of that address to an ICMP echo request (a “ping”) from that observer, and medium gray dots indicate a non-response to a ping. We show inferred state as lighter green or lighter gray until the next probe. We show 3 of the 6 VPs, with probes intervals of about 11 minutes (for methodology, see § 3.1).
The island starts at 2017-06-03t23:06Z and is indicated by the red bar in the middle of the graph, where VP E continues to get positive responses from several other addresses (the continuous green bars along the top). By contrast, the other 5 VPs (2 VPs here, others in § D.2) show many non-responses during this period. For this whole hour, VP E and this network are part of an island, cut off from the rest of the Internet and the other VPs. Although this island is brief and affects only this /24 block we have also seen country-sized islands (in § D.1 for space).
2.2.3. Peninsulas: Partial Connectivity
Link and power failures create islands, but a more pernicious problem is partial connectivity, when one can reach some destinations, but not others. We call a group of public IP addresses with partial connectivity to the Internet’s core a peninsula. (In a geographic peninsula, the mainland may be visible over water, but reachable only with a detour. In a network peninsula, routing between two points may require a relay through a third location.) Peninsulas occur when some upstream providers of a multi-homed network accept traffic but then drop it due to outages, peering disputes, or firewalls. Peninsula existence has long been recognized, with overlay networks designed to route around them in RON (Andersen et al., 2001), Hubble (Katz-Bassett et al., 2008), and LIFEGUARD (Katz-Bassett et al., 2012).
Examples in IPv6: An example of a persistent peninsula is the IPv6 peering dispute between Hurricane Electric (HE) and Cogent. These ISPs decline to peer in IPv6, nor are they willing to forward their IPv6 traffic through another party. This problem was noted in 2009 (Knowledge, 2009) and is visible as of June 2020 in DNSMon (RIPE NCC, 2020) (§ 6.4). We confirm unreachability between HE and Cogent users in IPv6 with traceroutes from looking glasses (Electric, 2021; Cogent, 2021) (HE at 2001:470:20::2 and Cogent at 2001:550:1:a::d). Neither can reach their neighbor’s server, but both reach their own. (Their IPv4 reachability is fine.)
Other IPv6 disputes are Cogent with Google (Rayburn, 2016), and Cloudflare with Hurricane Electric (forums, 2017). Disputes are often due to an inability to agree to settlement-free or paid peering.
An Example in IPv4: We next explore a real-world example of partial reachability to several Polish ISPs. Our algorithms found that on 2017-10-23, for a period of 3 hours starting at 22:02Z, five Polish Autonomous Systems had 1716 /24 blocks that were unreachable from five VPs, but they remained reachable from a sixth VP.
Before the peninsula, all blocks that became partially unreachable received service through Multimedia Polska (AS21021, or MP), via Cogent (AS174), with an alternate path through Tata (AS6453). When the peninsula occurred, traffic continued through Cogent but was blackholed; it did not shift to Tata (see § C). One VP (W) could reach MP through Tata for the entire event, proving MP was connected. After 3 hours, we see a burst of BGP updates (more than 23k), making MP reachable again from all VPs.
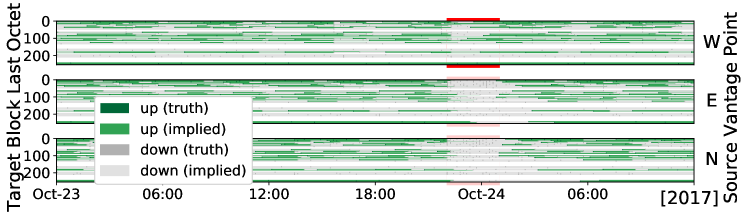
To show how our algorithms detect this event, Figure 2 shows responses for one block. In this case the top VPs always reach the block, but the lower two are unreachable (all address gray) for 3 hours.
We can confirm this peninsula with additional observations from traceroutes taken by CAIDA’s Archipelago (CAIDA, 2007) (Ark). During the event we see 94 unique Ark VPs attempted 345 traceroutes to the affected blocks. Of the 94 VPs, 21 VPs (22%) have their last responsive traceroute hop in the same AS as the target address, and 68 probes (73%) stopped before reaching that AS. The remaining 5 VPs were able to reach the destination AS for some probes, while not for others. (Sample traceroutes are in § C.)
Although we do not have a root cause for this peninsula from network operators, large number of BGP Update messages suggests a routing problem. In § E.2 we show peninsulas are mostly due to policy choices.
3. Detecting Partial Connectivity
We use observations from multiple, independent VPs to detect partial outages and islands (from § 2) with our new algorithms: Taitao detects peninsulas, and Chiloe, islands. (Algorithm names are from Patagonian geography.)
3.1. Suitable Data Sources
We use publicly available data from three systems: USC Trinocular (Quan et al., 2013), RIPE Atlas (RIPE NCC Staff, 2015), and CAIDA’s Archipelago (CAIDA, 2017) (Ark). We list all datasets in Table 7 in § B.
Our algorithms use data from Trinocular (Quan et al., 2013) because it is available at no cost (USC/LANDER Project, 2014), provides data since 2014, and covers most of the responsive IPv4 Internet (Baltra and Heidemann, 2020). Briefly, Trinocular watches about 5M out of 5.9M responsive IPv4 /24 blocks. In each probing round of 11 minutes, it sends up to 15 ICMP echo-requests (pings), stopping early if it proves the block is reachable. It interprets the results using Bayesian inference, and merges the results from six geographically distributed VPs. VPs are in Los Angeles (W), Colorado (C), Tokyo (J), Athens (G), Washington, DC (E), and Amsterdam (N). In § 4.4 we show they are topologically independent. Our algorithms should work with other active probing data as future work.
We use RIPE Atlas (RIPE NCC Staff, 2015) for islands (§ 3.4) and to see how partial connectivity affects monitoring (§ 6.4). As of 2022, it has about 12k VPs, distributed globally in over 3572 different IPv4 ASes. Atlas VPs carry out both researcher-directed measurements and periodic scans of DNS servers. We use Atlas scans of DNS root servers in our work.
We validate our results using CAIDA’s Ark (CAIDA, 2017), and use AS numbers from Routeviews (Meyer, 2018).
We generally use recent data, but in some cases we chose older data to avoid known problems in measurement systems. Many of our findings are demonstrated over multiple years, as we show in § F. We use Trinocular measurements for 2017q4 because this time period had six active VPs, allowing us to make strong statements about how multiple perspectives help. We use 2020q3 data in § E.2 because Ark observed a very large number of loops in 2017q4. Problems with different VPs reduced coverage for 2019 and 2020, but we verify and find quantitatively similar results in 2020 in § F).
3.2. Taitao: a Peninsula Detector
Peninsulas occur when portions of the Internet are reachable from some locations and not others. They can be seen by two VPs disagreeing on reachability. With multiple VPs, non-unanimous observations suggest a peninsula.
Detecting peninsulas presents three challenges. First, we do not have VPs everywhere. If all VPs are on the same “side” of a peninsula, their reachability agrees even though other potential VPs may disagree. Second, VP observations are not synchronized. For Trinocular, they are spread over an 11-minute interval, so different VPs test reachability at slightly different times. When observations are made just before and after a network change, both are true but the disagreement is from unsynchronized measurement and not a peninsula. Third, connectivity problems near the observer (or when an observer is an island) should not reflect on the intended destination.
We identify peninsulas by detecting disagreements in block state by comparing valid VP observations that occur at about the same time. Since probing rounds occur every 11 minutes, we compare measurements within an 11-minute window. This approach will see peninsulas that last at least 11 minutes, but may miss briefer ones, or peninsulas where VPs are not on “both sides”.
Formally, is the set of observers with valid observations about block at round . We look for disagreements in , defining as the set of observers that measure block as up at round . We detect a peninsula when:
| (1) |
3.3. Detecting Country-Level Peninsulas
Taitao detects peninsulas based on differences in observations. Long-lived peninsulas are likely intentional, from policy choices. One policy is filtering based on national boundaries, possibly to implement legal requirements about data sovereignty or economic boycotts.
We identify country-specific peninsulas as a special case of Taitao where a given destination block is reachable (or unreachable) from only one country, persistently for an extended period of time. (In practice, the ability to detect country-level peninsulas is somewhat limited because the only country with multiple VPs in our data is the United States. However, we augment non-U.S. observers with data from other non-U.S. sites such as Ark or RIPE Atlas.)
A country level peninsula occurs when all available VPs from the same country as the target block successfully reach the target block and all available VPs from different countries fail. Formally, we say there is a country peninsula when the set of observers claiming block is up at time is equal to the set of all available observers with valid observations at country .
| (2) |
3.4. Chiloe: an Island Detector
According to our definition in § 2.2.2, islands occur when the Internet is partitioned, and the smaller component (that with less than half the active addresses) is the island. Typical islands are much, much smaller.
We can find islands by looking for networks that are only reachable from less than half of the Internet. However, to classify such networks as an island and not merely a peninsula, we need to show that it is partitioned. Without global knowledge, it is difficult to prove disconnection. In addition, if islands are partitioned from VPs, we cannot tell an island from an outage. An island is disconnected but still active inside, but for an outage, the computers are disconnected from the Internet’s core and from each other.
For these reasons, we must look for islands that include VPs in their partition. Because we know the VP is active and scanning we can determine how much of the Internet is in its partition, ruling out an outage. We also can confirm the Internet is not reachable, to rule out a peninsula.
Formally, we say that is the set of all blocks on the Internet responding in the last week. are blocks reachable from observer at round , while is its complement. We detect that observer is in an island when it thinks half or more of the observable Internet is down:
| (3) |
This method is independent from measurement systems, but is limited to detecting islands that contain VPs. We evaluate islands in two systems with thousands of VPs in § 5.4. Finally, because observations are not instantaneous, we must avoid confusing short-lived islands with long-lived peninsulas. For islands lasting longer than an observation period, we also require . When , then we have an address island.
3.5. Applications
Architectural: Our work helps understand risk by showing reachability is not binary, but often partial. We explore this issue in § 5; one key result is that users see peninsulas as often as outages (§ 5.1). It helps clarify prior studies of Internet outages (Schulman and Spring, 2011; Quan et al., 2013; Shah et al., 2017; Richter et al., 2018; Guillot et al., 2019) (more detail is in § 6.3).
4. Validating our approach
We validate our algorithms, comparing Taitao peninsulas and Chiloe islands to independent data (§ 4.1 and § 4.3), and examining country-level peninsulas (§ 4.2).
| Ark | |||||
| Sites Up | Conflicting | All Down | All Up | ||
| Trinocular | Conflicting | 1 | 20 | 6 | 15 |
| 2 | 13 | 5 | 11 | ||
| 3 | 13 | 1 | 5 | ||
| 4 | 26 | 4 | 19 | ||
| 5 | 83 | 13 | 201 | ||
| Agree | 0 | 6 | 97 | 6 | |
| 6 | 491,120 | 90 | 1,485,394 | ||
| Ark | ||||
| Peninsula | Non Peninsula | |||
| Taitao | Peninsula | 184 | 251 (strict) | 40 (loose) |
| Non Peninsula | 12 | 1,976,701 | ||
| Ark | |||||
|---|---|---|---|---|---|
| U.S. VPs | Domestic Only | Foreign | Foreign | Total | |
| Trinocular | WCE | 211 | 171 | 47 | 429 |
| WCe | 0 | 5 | 1 | 6 | |
| WcE | 0 | 1 | 0 | 1 | |
| wCE | 0 | 0 | 0 | 0 | |
| Wce | 3 | 40 | 11 | 54 | |
| wcE | 0 | 4 | 5 | 9 | |
| wCe | 0 | 1 | 1 | 2 | |
| Marginal distr. | 214 | 222 | 65 | 501 | |
4.1. Can Taitao Detect Peninsulas?
We compare Taitao detections from 6 VPs to independent observations taken from more than 100 VPs in CAIDA’s Ark (CAIDA, 2017). This comparison is challenging, because both Taitao and Ark are imperfect operational systems that differ in probing frequency, targets, and method. Neither defines perfect ground truth, but agreement suggests likely truth.
Although Ark probes targets much less frequently than Trinocular, Ark makes observations from 171 global locations, providing a diverse perspective. Ark traceroutes also allow us to assess where peninsulas begin. We expect to see a strong correlation between Taitao peninsulas and Ark observations. (We considered RIPE Atlas as another external dataset, but its coverage is sparse, while Ark covers all /24s.)
Identifying comparable blocks: We study 21 days of Ark observations from 2017-10-10 to -31. Ark covers all networks with two strategies. With team probing, a 40 VP “team” traceroutes to all routed /24 about once per day. For prefix probing, about 35 VPs each traceroute to .1 addresses of all routed /24s every day. We use both types of data: the three Ark teams and all available prefix probing VPs. We group results by /24 block of the traceroute’s target address.
Ark differs from Taitao’s Trinocular input in three ways: the target is a random address or the .1 address in each block; it uses traceroute, not ping; and it probes blocks daily, not every 11 minutes. Sometimes these differences cause Ark traceroutes to fail when a simple ping succeeds. First, Trinocular’s targets respond more often because it uses a curated hitlist (Fan and Heidemann, 2010) while Ark does not. Second, Ark’s traceroutes can terminate due to path loops or gaps in the path, (in addition to succeeding or reporting target unreachable). We do not consider results with gaps, so problems on the path do not bias results for endpoints reachable by direct pings.
To correct for differences in target addresses, we must avoid misinterpreting a block as unreachable when the block is online but Ark’s target address is not, we discard traces sent to never-active addresses (those not observed in 3 years of complete IPv4 scans), and blocks for which Ark did not get a single successful response.(Even with this filtering, dynamic addressing means Ark still sometimes sees unreachables.)
To correct for Ark’s less frequent probing, we compare long-lived Trinocular down-events (5 hours or more). Ark measurements are infrequent (once every 24 hours) compared to Trinocular’s 11-minute reports, so short Trinocular events are often unobserved by Ark. To confirm agreements or conflicting reports from Ark, we require at least 3 Ark observations within the peninsula’s span of time.
We filter out blocks with frequent transient changes or signs of network-level filtering. We define the “reliable” blocks suitable for comparison as those responsive for at least 85% of the quarter from each of the 6 Trinocular VPs. (This threshold avoids diurnal blocks or blocks with long outages; values of 90% or less have similar results.) We also discard flaky blocks whose responses are frequently inconsistent across VPs. (We consider more than 10 combinations of VP as frequently inconsistent.) For the 21 days, we find 4M unique Trinocular /24 blocks, and 11M Ark /24 blocks, making 2M blocks in both available for study.
Results: Table 3 provides details and Table 3 summarizes our interpretation. Here dark green indicates true positives (TP): when (a) either both Taitao and Ark show mixed results, both indicating a peninsula, or when (b) Taitao indicates a peninsula (1 to 5 sites up but at least one down), Ark shows all-down during the event and up before and after. We treat Ark in case (b) as positive because the infrequency of Ark probing (one probe per team every 24 hours) means we cannot guarantee VPs in the peninsula will probe responsive targets in time. Since peninsulas are rare, so too are true positives, but we see 184 TPs.
We show true negatives as light green and neither bold nor italic. In almost all of these cases (1.4M) both Taitao and Ark both reach the block, agreeing. Because of dynamic addressing (Padmanabhan et al., 2016), many Ark traceroutes end in a failure at the last hop (even after we discard never-reachable). We therefore count this second most-common result (491k cases) as a true negative. For the same reason, we include the small number (97) of cases where Ark reports conflicting results and Taitao is all-up, assuming Ark terminates at an empty address. We include in this category the 90 events where Ark is all-down and Trinocular is all-up. We attribute Ark’s failure to reach its targets to infrequent probing.
We mark false negatives as red and bold. For these few cases (only 12), all Trinocular VPs are down, but Ark reports all or some responding. We believe these cases indicate blocks that have chosen to drop Trinocular traffic.
Finally, yellow italics shows cases where a Taitao peninsula is a false positive, since all Ark probes reached the target block. This case occurs when either traffic from some Trinocular VPs is filtered, or all Ark VPs are “inside” the peninsula. Light yellow (strict) shows all the 251 cases that Taitao detects. For most of these cases (201), five Trinocular VPs responding and one does not, suggesting network problems are near one of the Trinocular VPs (since five of six independent VPs have working paths). Discarding these cases we get 40 (orange); still conservative but a looser estimate.
The strict scenario sees precision 0.42, recall 0.94, and score 0.58, and in the loose scenario, precision improves to 0.82 and score to 0.88. We consider these results good, but with some room for improvement.
4.2. Detecting Country-Level Peninsulas
Next, we verify detection of country-level peninsulas (§ 3.3). We expect that legal requirements sometimes result in long-term network unreachability. For example, blocking access from Europe is a crude way to comply with the EU’s GDPR (eu_gdpr).
Identifying country-level peninsulas requires multiple VPs in the same country. Unfortunately the source data we use only has multiple VPs for the United States. We therefore look for U.S.-specific peninsulas where only these VPs can reach the target and the non-U.S.-VPs cannot, or vice versa.
We first consider the 501 cases where Taitao reports that only U.S. VPs can see the target, and compare to how Ark VPs respond. For Ark, we follow § 4.1, except retaining blocks with less than 85% uptime. We only consider Ark VPs that are able to reach the destination (that halt with “success”). We note blocks that can only be reached by Ark VPs within the same country as domestic, and blocks that can be reached from VPs located in other countries as foreign.
In Table 3 we show the number of blocks that uniquely responded to all U.S. VP combinations during the quarter. We contrast these results against Ark reachability.
True positives are when Taitao shows a peninsula responsive only to U.S. VPs and nearly all Ark VPs confirm this result. We see 211 targets are U.S.-only, and another 171 are available to only a few non-U.S. countries. The specific combinations vary: sometimes allowing access from the U.K., or Mexico and Canada. Together these make 382 true positives, most of the 501 cases. Comparing all positive cases, we see a very high precision of 0.99 (382 green of 385 green and red reports)—our predictions are nearly all confirmed by Ark.
In yellow italics we show 47 cases of false positives where more than five non-U.S. countries are allowed access. In many cases these include many European countries. Our recall is therefore 0.89 (382 green of 429 green and yellow true country peninsulas).
In light green we show true negatives. Here we include blocks that filter one or more U.S. VPs, and are reachable from Ark VPs in multiple countries, amounting to a total of 69 blocks. There are other categories involving non-U.S. sites, along with other millions of true negatives, however, we only concentrate in these few.
In red and bold we show three false negatives. These three blocks seem to have strict filtering policies, since they were reachable only from one U.S. site (W) and not the others (C and E) in the 21 days period.
4.3. Can Chiloe Detect Islands?
Chiloe (§ 3.4) detects islands when a VP within the island can reach less than half the rest of the world. When less than 50% of the network replies, it means that the VP is either in an island (for brief events, or when replies drop near zero) or a peninsula (long-lived partial replies).
To validate Chiloe’s correctness, we compare when a single VP believes to be in an island, against what the rest of the world believes about that VP.
We define ground truth at a block level granularity—if VP can reach its own block when believes to be in an island, while other external VPs can’t reach ’s block, then ’s island is confirmed. On the other hand, if an external VP can reach ’s block, then is not in island, but in a peninsula. In § 4.4 we show that Trinocular VPs are independent, and therefore no two VPs live within the same island. We believe this definition is the best possible ground truth, but of course a perfect identification of island or peninsula requires instant, global knowledge and so cannot be measured in practice.
We take 3 years worth of data from all six Trinocular VPs. Because Trinocular spreads measurements over 11 minutes, we group results into 11-minute bins.
| Chiloe | |||
|---|---|---|---|
| Island | Peninsula | ||
| Trinocular | Blk Island | 2 | 0 |
| Addr Island | 19 | 8 | |
| Peninsula | 2 | 566 | |
| Sites | Events | Per Year |
|---|---|---|
| W | 5 | 1.67 |
| C | 11 | 3.67 |
| J | 1 | 0.33 |
| G | 1 | 0.33 |
| E | 3 | 1.00 |
| N | 2 | 0.67 |
| All (norm.) | 23 | 7.67 (1.28) |
In Table 4a we show that Chiloe detects 23 islands across three years. In 2 of these events, the block is unreachable from other VPs, confirming the island with our ground-truth methodology. Manual inspection confirms that the remaining 19 events are islands too, but at the address level—the VP was unable to reach anything but did not lose power, and other addresses in its block were reachable from VPs at other locations. These observations suggest a VP-specific problem making it an island. Finally, for 2 events, the prober’s block was reachable during the event by every site including the prober itself which suggests partial connectivity (a peninsula), and therefore a false positive.
In the 566 non-island events (true negatives), a single VP cannot reach more than 5% but less than 50% of the Internet core. In each of these cases, one or more other VPs were able to reach the affected VP’s block, showing they were not an island (although perhaps a peninsula). We omit the very frequent events when less than 5% of the network is unavailable from the VP from the table, although they too are true negatives.
Bold red shows 8 false negatives. These are events that last about 2 Trinocular rounds or less (22 min), often not enough time for Trinocular to change its belief on block state.
4.4. Are the Sites Independent?
Our evaluation assumes VPs do not share common network paths. Two VPs in the same location would share the same local outages, but those in different physical locations will often use different network paths, particularly with a “flatter” Internet graph (Labovitz et al., 2010). We next quantify this similarity to validate our assumption.
We next measure similarity of observations between pairs of VPs. We examine only cases where one of the pair disagrees with some other VP, since when all agree, we have no new information. If the pair agrees with each other, but not with the majority, the pair shows similarity. If they disagree with each other, they are dissimilar. We quantify similarity for a pair of sites as , where indicates the pair agrees on the network having state of up (1) or down (0) and disagrees with the others, and for , the pair disagrees with each other. ranges from 1, where the pair always agrees, to 0, where they always disagree.
Table 6(a) shows similarity values for each pair of the 6 Trinocular VPs. (We show only half of the symmetric matrix.) No two sites have a similarity more than 0.14, and most pairs are under 0.08. This result shows that no two sites are particularly correlated.
5. Internet Islands and Peninsulas
We now examine islands and peninsulas in the Internet core.
5.1. How Common are Peninsulas?
We estimate how common peninsulas occur in the Internet core in three ways. First, we directly measure the visibility of peninsulas in the Internet by summing the duration of peninsulas as seen from six VPs. Second, we confirm the accuracy of this estimate by evaluating its convergence as we vary the number of VPs—more VPs show more peninsula-time, but if the result converges we predict we are approaching the limit. Third, we compare peninsula-time to outage-time, showing that, in the limit, observers see both for about the same duration. Outages correspond to service downtime (Woodhams and Migliano, 2021), and are a recognized problem in academia and industry. Our results show that peninsulas are as common as outages, suggesting peninsulas are an important new problem deserving attention.
Peninsula-time: We estimate the duration an observer can see a peninsula by considering three types of events: all up, all down, and disagreement between six VPs. Disagreement, the last case, suggests a peninsula, while agreement (all up or down), suggests no problem or an outage. We compute peninsula-time by summing the time each target /24 has disagreeing observations from Trinocular VPs.
We have computed peninsula-time by evaluating Taitao over Trinocular data for 2017q4 (USC/LANDER Project, 2014). Figure 3 shows the distribution of peninsulas measured as a fraction of block-time for an increasing number of sites. We consider all possible combinations of the six sites.
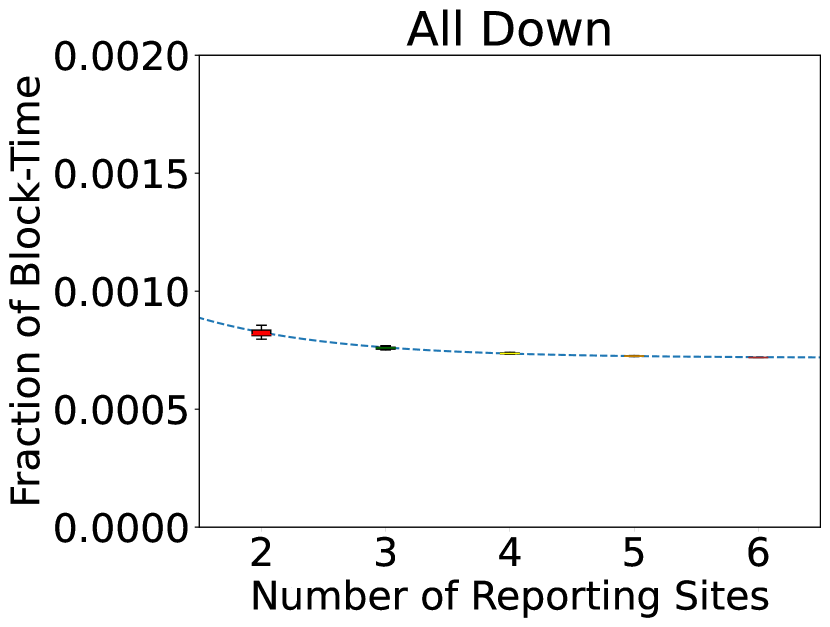
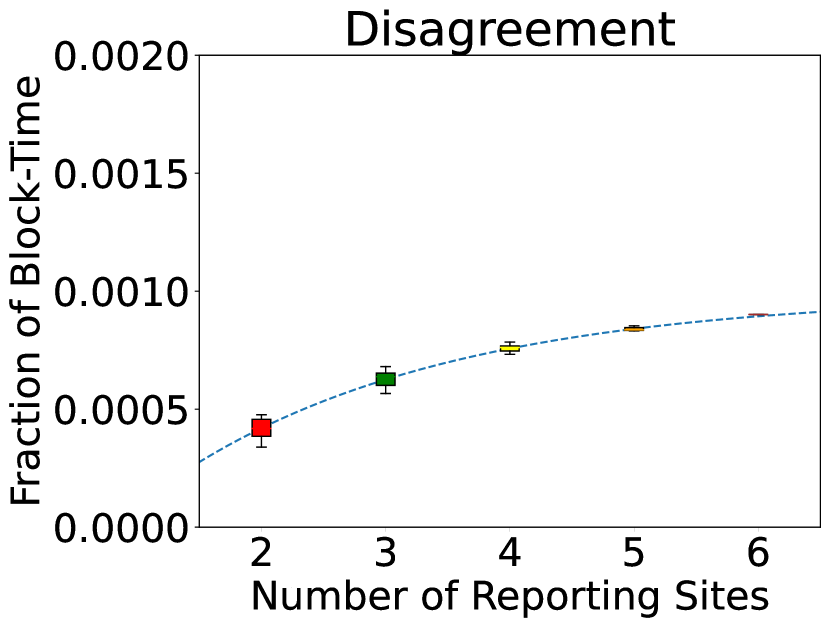
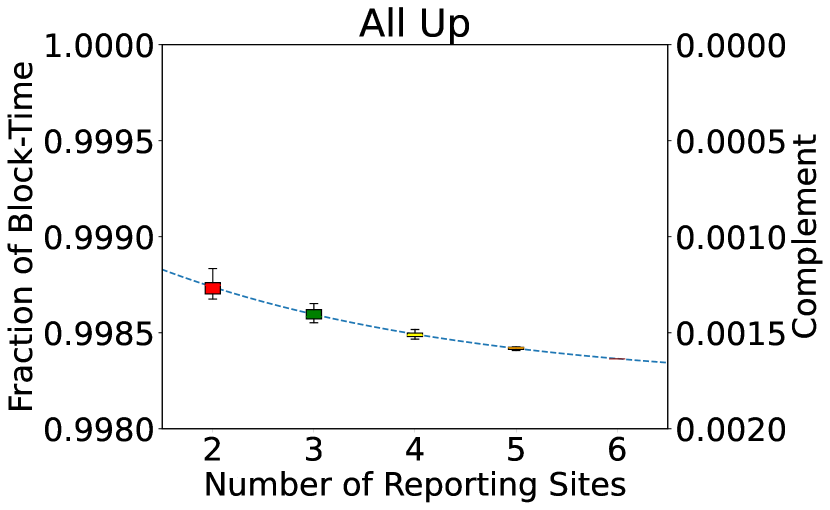
First we examine the data with all 6 VPs—the rightmost point on each graph. We see that peninsulas (the middle, disagreement graph) are visible about 0.00075 of the time. This data suggests peninsulas are rare, occurring less than 0.1% of the time, but do regularly occur.
Convergence: With more VPs we get a better view of the Internet’s overall state. As more reporting sites are added, more peninsulas are discovered. That is previously inferred outages (all unreachable) should have been peninsulas, with partial reachability. All-down (left) decreases from an average of 0.00082 with 2 VPs to 0.00074 for 6 VPs. All-up (right) goes down a relative 47% from 0.9988 to 0.9984, while disagreements (center) increase from 0.0029 to 0.00045. Outages (left) converge after 3 sites, as shown by the fitted curve and decreasing variance. Peninsulas and all-up converge more slowly. We conclude that a few sites (3 or 4) converge on a good estimate of true islands and peninsulas, provided they are independently located.
We can support this claim by comparing all non-overlapping combinations of 3 sites. If any combination is equivalent with any other, then a fourth site would not add new information. There are 10 possible pairs of 3 sites from 6 observers, and we examine those combinations for each of 21 quarters, from 2017q2 to 2020q1. When we compare the one-sample Student -test to evaluate if the difference of each pair of combinations of those 21 quarters is greater than zero. None of the combinations are rejected at confidence level 99.75%, suggesting that any combination of three sites is statistically equivalent and confirm our claim that a few sites are sufficient for estimation.
Relative impact: Finally, comparing outages (the left graph) with peninsulas (the middle graph), we see both occur about the same fraction of time (around 0.00075). This comparison shows that peninsulas are about as common as outages, suggesting they deserve more attention.
Generalizing: We confirm these results with other quarters in § F. While we reach a slightly different limit (in that case, peninsulas and outages appear about in 0.002 of data), we still see good convergence after 4 VPs.
5.2. How Long Do Peninsulas Last?
Peninsulas have multiple root causes: some are short-lived routing misconfigurations while others may be long-term disagreements in routing policy. In this section we determine the distribution of peninsulas in terms of their duration to determine the prevalence of persistent peninsulas. We will show that there are millions of brief peninsulas, likely due to transient routing problems, but that 90% of peninsula-time is in long-lived events (5 h or more, following § 4.1).
To see peninsula duration we use Taitao to detect peninsulas that occurred during 2017q4. For all peninsulas, we see 23.6M peninsulas affecting 3.8M unique blocks. If instead we look at long-lived peninsulas (at least 5 h), we see 4.5M peninsulas in 338k unique blocks.
§ 5.4 examines the duration of these peninsulas in three ways: the cumulative distribution of the number of peninsulas for all events (left, solid, purple line), the cumulative distribution of the number of peninsulas for VP down events longer than 5 hours (middle, solid green line), and the cumulative size of peninsulas for VP down events longer than 5 hours (right, green dashes).
We see that there are many very brief peninsulas (purple line). About 65% last from 20 to 60 minutes (about 2 to 6 measurement rounds). Such events are not just one-off loss, since they last at least two observation periods. These results suggest that while the Internet is robust, there are many small connectivity glitches (7.8M events). Events that are two rounds (20 minutes) or shorter may be due to BGP-induced transient blackholes or measurement packet loss.
The number of day-long or multi-day peninsulas is small, only 1.7M events (2%, the purple line). However, about 57% of all peninsula-time is in such longer-lived events (the right, dashed line), and 20% of time is in events lasting 10 days or more, even when longer than 5 hours events are less numerous (compare the middle, green line to the left, purple line). Events lasting a day last long enough that they can be debugged by human network operators, and events lasting longer than a week suggest potential policy disputes and intentional unreachability. Together, these long-lived events suggest that there is benefit to identifying non-transient peninsulas and addressing the underlying routing problem.
5.3. Additional Peninsula Results
We summarize findings omitted due to space (more in § E).
We evaluate peninsula size measured as a fraction of the affected routable prefix. We find that a third of peninsulas are much smaller than their public, routable prefix. This evaluation suggests that peninsulas often happen inside an ISP and are not due to interdomain routing. Further, 20% of all peninsula-time is due to peninsulas covering their full routable prefixes, suggesting that longer-lived peninsulas are likely due to routing or policy choices (§ E.1).
We also use traceroutes to estimate peninsula size. We detect where the Internet breaks into peninsulas, by looking at traceroutes that failed to reach their target address, and find more traceroutes halt at or inside the target AS, but they more often terminate before reaching the target prefix. This result suggests policy is implemented at or inside ASes, but not at routable prefixes. By contrast, outages more often terminate before reaching the target AS. Because peninsulas are more often at or in an AS, while outages occur in many places, it suggests that peninsulas are policy choices (§ E.2).
Country-specific filtering is a routing policy made by networks to restrict traffic they receive. We next look into what type of organizations actively block overseas traffic. For example, good candidates to restrain who can reach them for security purposes are government related organizations.
5.4. How Common Are Islands?
Multiple groups have shown that there are many network outages in the Internet (Schulman and Spring, 2011; Quan et al., 2013; Shah et al., 2017; Richter et al., 2018; Guillot et al., 2019). We have described (§ 2) two kinds of outages: full outages where all computers at a site are down (perhaps due to a loss of power), and islands, where the site is cut off from the Internet but computers at the site can talk between themselves. We next use Chiloe to determine how often islands occur. We study islands in two systems with 6 VPs for 3 years and 13k VPs for 3 months.
Trinocular: We first consider three years of Trinocular data (described in § 3.1), from 2017-04-01 to 2020-04-01. We run Chiloe across each VP for this period.
Table 4b shows the number of islands per VP over this period. Over the 3 years, all six VPs see from 1 to 5 islands. In addition, we see that islands do not always cause the entire Internet to be unreachable, and there are a number of cases where from 20% to 50% of the Internet is inaccessible. We believe these cases represent brief islands, since islands shorter than an 11 minute complete scan will only be partially observed. We find 12 in the 20% to 50% range, all are short, and 4 are less than 11 minutes (see § D.3 for details).
RIPE Atlas: For broader coverage we next consider RIPE Atlas’ 13k VPs for all of 2021q3 (NCC, 21q3a). While Atlas does not scan the whole Internet, they do scan most root DNS servers every 240 s. Chiloe would like to observe the whole Internet, and while Trinocular scans 5M /24s, it does so with only 6 VPs. To use RIPE Atlas’ 10k VPs, we approximate a full scan with probes to 12 of the DNS root server systems (G-Root was unavailable in 2021q3). Although far fewer than 5M networks, these targets provide a very sparse sample of usually independent destinations since each is independently operated. Thus we have complementary datasets with sparse VPs and dense probing, and many VPs but sparse probing. In other words, to get many VP locations we relax our conceptual definition by decreasing our target list.
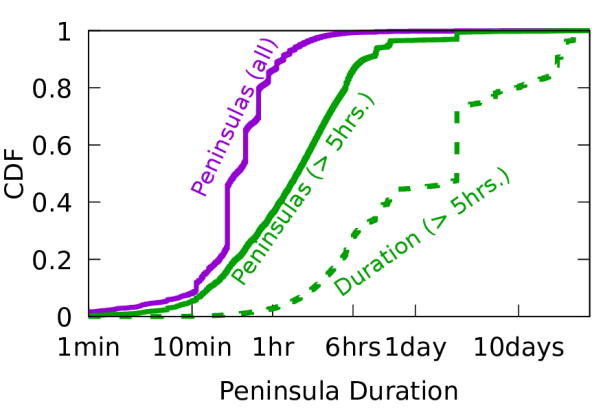
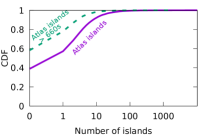
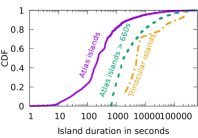
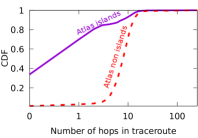
Figure 5a shows the CDF of the number of islands detected per RIPE Atlas VP during 2021q3. During this period, 55% of VPs observed one or no islands (solid line). To compare to Trinocular, we consider events longer than 660 s with the dashed line. In the figure, 60% of VPs saw no islands, 19% see one, and the remainder see more. The annualized island rate of just the most stable VPs (those that see 2 or less islands) is 1.75 islands per year (a lower bound, since we exclude less stable VPs), compared to 1.28 for Trinocular (Table 4b). We see islands are more common in Atlas, perhaps because it includes many VPs at home.
We conclude that islands do happen, but they are rare, and at irregular times. This finding is consistent with importance of the Internet at the locations where we run VPs.
5.5. How Long Do Islands Last?
Islands can occur starting from brief connectivity losses to long standing policy changes. We next compare island duration measured across Trinocular and Atlas.
We compare the distributions of island durations observed from RIPE Atlas (the left line) and Trinocular (right) in Figure 5b. Since Atlas’ frequent polling means it detects islands lasting seconds, while Trinocular sees only islands of 660 s or longer, we split out Atlas events lasting at least 660 s (middle line). All measurements follow a similar S-shaped curve, but for Trinocular, the curve is truncated at 660 s. With only 6 VPs, Trinocular sees far fewer events (23 in 3 years compared to 235k in a yearly quarter with Atlas), so the Trinocular data is quantized. In both cases, about 70% of islands are between 1000 and 6000 s. This graph shows that Trinocular’s curve is similar in shape to Atlas-660 s, but about longer. All Trinocular observers are in datacenters, while Atlas devices are at homes, so this difference may indicate that datacenter islands are rarer, but harder to resolve.
5.6. What Sizes Are Islands?
In § 2.2 we described different sizes of islands starting from as small as an address island, as opposed to LAN- or AS-sized islands, to country-sized islands potentially capable of partitioning the Internet. Here, we evaluate the size of islands by counting the number of hops in a traceroute sent towards a target outside the island before the traceroute fails.
We use traceroutes from RIPE Atlas VPs sent to 12 root DNS servers for 2021q3 (NCC, 21q3b). In Figure 5c in green the distribution of the number of hops when traceroute reach their target. In purple, we plot the distribution of the number of hops of traceroutes that failed to reach the target for VPs in islands detected in § 5.4.
We find that most islands are small, 70% show one hop or none (address islands). We consider very large islands (10 or more hops) as false positives.
6. Applying These Tools
Given partial connectivity, we now apply our approach to Internet sovereignty, partitioning, and DNSmon sensitivity.
6.1. Policy Applications of the Definition
We next examine how a clear definition of the Internet’s core can inform policy tussles (Clark et al., 2002). Our hope is that our conceptual definition can make sometimes amorphous concepts like “Internet fragmentation” more concrete, and an operational definition can quantify impacts and identify thresholds.
Secession and Sovereignty: The U.S. (Rockefeller, 2009), China (Anonymous, 2012, 2014), and Russia (CNBC, 2019) have all proposed unplugging from the Internet. Egypt did in 2011 (Cowie, 2011), and several countries have during exams (Gibbs, 1996; Dhaka Tribune Desk, 2018; Henley, 2018; Economist Editors, 2018). When the Internet partitions, which part is still “the Internet’s core”? Departure of a ISP or small country do not change the Internet’s core much, but what if a large country, or group of countries, leave together?
Our definition resolves this question, defining the Internet’s core from reachability of the majority of the active, public IP addresses (§ 2.1). Requiring a majority uniquely provides an unambiguous, externally evaluable test for the Internet’s core that allows one possible answer (the partition with more than 50%). In § 6.2 we discuss the corollary: the internet can end, turning into multiple partitions, if none retain a majority. (A plurality is insufficient.)
Sanction: An opposite of secession is expulsion. Economic sanctions are one method of asserting international influence, and events such as the 2022 war in Ukrainian prompted several large ISPs to discontinue service to Russia (Reuters, 2022). De-peering does not affect reachability for ISPs that purchase transit, but Tier-1 ISPs that de-peer create peninsulas for their users. As described below in § 6.2, no single country can eject another by de-peering with it. However, a coalition of multiple countries could de-peer and eject a country from the Internet’s core if they, together, control more than half of the address space.
Repurposing Addresses: Given full allocation of IPv4, multiple parties proposed re-purposing currently allocated or reserved IPv4 space, such 0/8 (“this” network), 127/8 (loopback), and 240/4 (reserved) (Fuller et al., 2008). New use of these long-reserved addresses is challenged by assumptions in widely-deployed, difficult to change, existing software and hardware. Our definition demonstrates that an RFC re-assigning this space for public traffic cannot make it a truly effective part of the Internet core until implementations used by a majority of active addresses can route to it.
IPv4 Squat Space: IP squatting is when an organization requiring private address space beyond RFC1918 takes over allocated but currently unrouted IPv4 space (Aronson, 2015). Several IPv4 /8s allocated to the U.S. DoD have been used this way (Richter et al., 2016) (they were only publicly routed in 2021 (Timberg and Sonne, 2021)). By our definition, such space is not part of the Internet’s core without public routes, and if more than half of the Internet is squatting on it, reclamation may be challenging.
The IPv4/v6 Transition: We have defined two Internet cores: IPv4 and IPv6. Our definition can determine when one supersedes the other. The networks will be on par when more than half of all IPv4 hosts are dual-homed. After that point, IPv6 will supersede IPv4 when a majority of hosts on IPv6 can no longer reach IPv4. Current limits on IPv6 measurement mean evaluation here is future work. IPv6 shows the strength and limits of our definition: since IPv6 is already economically important, our definition seems irrelevant. However, it may provide sharp boundary that makes the maturity of IPv6 definitive, helping motivate late-movers.
6.2. Can the Internet’s Core Partition?
In § 6.1 we discussed secession and expulsion qualitatively. Threats to secede or sanction have been by countries or groups of countries. If a country were to exert control over their allocated addresses this would result in a country level island or peninsula. We next use our reachability definition of more than 50% to quantify control of the IP address space. Our question: Does any country or group have enough addresses to secede and claim to be “the Internet’s core” with a majority of addresses.
| IPv4 Addresses | IPv6 Addresses | |||||
|---|---|---|---|---|---|---|
| RIR | Active | Allocated | Allocated | |||
| AFRINIC | 15M | 2% | 121M | 3.3% | 9,661 | 3% |
| APNIC | 223M | 33% | 892M | 24.0% | 88,614 | 27.8% |
| China | 112M | 17% | 345M | 9.3% | 54,849 | 17.2% |
| ARIN | 150M | 22% | 1,673M | 45.2% | 56,172 | 17.6% |
| U.S. | 140M | 21% | 1,617M | 43.7% | 55,026 | 17.3% |
| LACNIC | 82M | 12% | 191M | 5.2% | 15,298 | 4.8% |
| RIPE NCC | 206M | 30% | 826M | 22.3% | 148,881 | 46.7% |
| Germany | 40M | 6% | 124M | 3.3% | 22,075 | 6.9% |
| Total | 676M | 100% | 3,703M | 100% | 318,626 | 100% |

To evaluate the power of any country or RIR to control the Internet core, Table 5 reports the number of active IPv4 addresses as determined by Internet censuses (Heidemann et al., 2008) for each Regional Internet Registry (RIR) and selected countries. Although we define the Internet by active addresses, we cannot current measure active IPv6 addresses, so we also provide allocated addresses for both v4 and v6 (NRO, 2021; IANA, 2021). IPv4 is fully allocated, except for special purpose addresses: loopback (127/8), local and private space (0/8, 10/8, etc. (Rekhter et al., 1996)), multicast, and reserved Class E addresses.
Table 5 shows that no individual RIR or country can secede and take the Internet’s core, because none controls the majority of IPv4 addresses. ARIN has the largest share with 1673M allocated (45.2%). Of countries, U.S. has the largest share of allocated IPv4 (1617M, 43.7%). Active addresses are more evenly distributed with APNIC (223M, 33%) and the U.S. (40M, 21%) the largest RIR and country.
This claim also applies to IPv6, where no RIR or country surpasses a 50% allocation. RIPE (an RIR) is close with 46.7%, and China and the U.S. have large country allocations. With most of IPv6 unallocated, these fractions may change. Distribution of active IPv4 addresses is similar to allocated IPv6 addresses, suggesting IPv4 allocations are perhaps skewed by unused legacy addresses.
Our analysis demonstrates that no country can unilaterally claim to control the IPv4 Internet core, nor the currently allocated IPv6 core—today’s Internet is an international collaboration.
6.3. Reexamining Outages Given Partial Reachability
We next re-evaluate reports from existing outage detection systems, considering how to resolve conflicting information in light of our new algorithms. We compare findings to external information in traceroutes from CAIDA Ark.
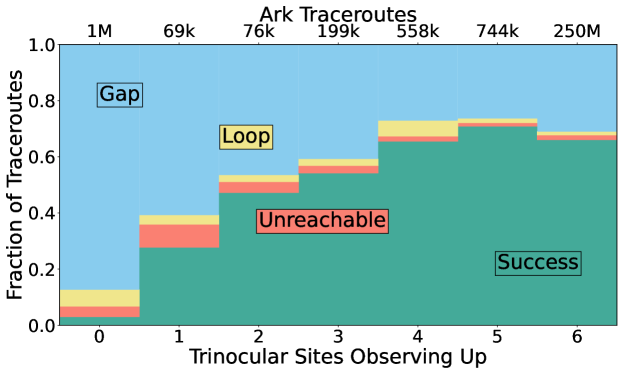
Figure 8 compares Trinocular with 21 days of Ark topology data, from 2017-10-10 to -31 from all 3 probing teams. For each Trinocular outage we classify the Ark result as success or three types of failure: unreachable, loop, or gap.
| C | J | G | E | N | |
|---|---|---|---|---|---|
| W | 0.017 | 0.031 | 0.019 | 0.035 | 0.020 |
| C | 0.077 | 0.143 | 0.067 | 0.049 | |
| J | 0.044 | 0.036 | 0.046 | ||
| G | 0.050 | 0.100 | |||
| E | 0.058 |
Trinocular’s 6-site-up case suggests a working network, and we consider this case as typical. However, we see that about 25% of Ark traceroutes are “gap”, where several hops fail to reply. We also see about 2% of traceroutes are unreachable (after we discard traceroutes to never reachable addresses). Ark probes a random address in each block; many addresses are non-responsive, explaining these.
With 1 to 11 sites up, Trinocular is reporting disagreement. We see that the number of Ark success cases (the green, lower portion of each bar) falls roughly linearly with the number of successful observers. This consistency suggests that Trinocular and Ark are seeing similar behavior, and that there is partial reachability—these events with only partial Trinocular positive results are peninsulas.
We observe that 5 sites show the same results as all 6, so single-VP failures likely represent problems local to that VP. This suggests that all-but-one is a good algorithm to determine true outages.
With only partial reachability, with 1 to 4 VPs (of 6), we see likely peninsulas. These cases confirm that partial connectivity is common: while there are 1M traceroutes sent to outages where no VP can see the target (the number of events is shown on the 0 bar), there are 1.6M traceroutes sent to partial outages (bars 1 to 5), and 850k traceroutes sent to definite peninsulas (bars 1 to 4). This result is consistent with the convergence we see in Figure 3.
6.4. Improving DNSmon Sensitivity
DNSmon (Amin et al., 2015) monitors the Root Server System (Root Operators, 2016), built over the RIPE Atlas distributed platform (RIPE NCC Staff, 2015) For years, DNSmon has often reported IPv6 loss rates of 4-10%. Since the DNS root is well provisioned and distributed, we expect minimal congestion or loss and find these values surprisingly high.
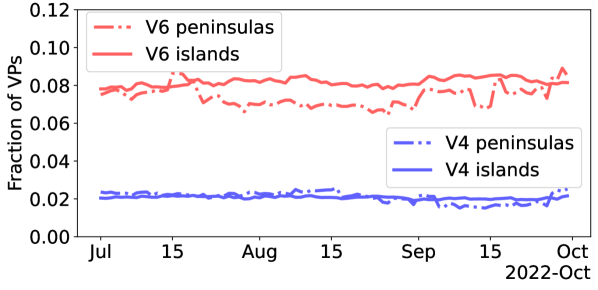
RIPE Atlas operators are aware of problems with some Atlas VPs. Some support IPv6 on their LAN, but not to the global IPv6 Internet—such VPs are IPv6 islands. They periodically tag these VPs and cull them from DNSmon. However, we studied RIPE Atlas with our algorithms to detect islands and peninsulas. Full details of our analysis are in our workshop paper (Saluja et al., 2022); but it builds on the concepts pioneered here (§ 2 and § 3). We also provide the first long-term data that shows these results persist for 4 months (Figure 6).
Each groups of bars in Figure 7 show query loss for each of the 13 root service identifiers, as observed from all available Atlas VPs (10,082 IPv4, and 5,173 IPv6) on 2022-07-23. (We are similar to DNSmon, but it uses only about 100 well-connected “anchors”, so our analysis is wider.) The first two groups show loss rates for IPv4 (light blue, left most) and IPv6 (light red), showing IPv4 losses around 2%, and IPv6 from 9 to 13%.
We apply Chiloe to these VPs, detecting as islands those VPs that cannot see any of the 13 root identifiers over 24 hours. (This definition is stricter than regular Chiloe because these VPs attempt only 13 targets, and we apply it over a full day to consider only long-term trends.) The middle two groups of bars show IPv4 and IPv6 loss rates after removing VPs that are islands. Without island VPs, IPv4 loss rates drop to 0.005 from 0.01, and IPv6 to about 0.01 from 0.06. We suggest this represents a more accurate view of how most people perceive the root queries. Islands represent misconfigured VPs; they should not be used for measurement until they can route outside their LAN.
The third bar in each red cluster of IPv6 is an outlier: that root identifier shows 13% IPv6 loss with all VPs, and 6% loss after islands are removed. This result is explained by persistent routing disputes between Cogent (the operator of C-Root) and Hurricane Electric (Miller, 2009). Omitting islands (the middle bars) makes this difference is much clearer.
We then apply Taitao to detect peninsulas. Peninsulas suggest persistent routing problems deserving consideration by ISPs and root operators. The darker, rightmost two groups show loss from VPs that are neither islands nor peninsulas, representing loss if routing problems were addressed. This data confirms routing problems explain the difference for C-Root, which now shows IPv6 loss similar to other identifiers.
This example shows how understanding of partial reachability can improve the sensitivity of existing measurement systems. Filtering out islands makes it easy to identify persistent routing problems. Further removing peninsulas leaves observations that are more sensitive to transient changes, perhaps from failure, DDoS attack, or temporary routing changes—Figure 7 shows that the raw data (left two groups) are or times larger than this remaining interesting “signal” (the right two groups). Improved sensitivity also clarifies the need to improve IPv6 provisioning, since IPv6 loss is statistically higher than IPv4 loss (compare the right blue and red groups), even after correcting for known problems.
While application of our algorithms to this system is imperfect, we suggest that it is useful. Atlas VPs do not ping the entire Internet, so our evaluation of islands over the 13 root identifiers is very rough. While we suggest islands represent misconfiguration, peninsulas show actual, persistent connectivity problems (fortunately not harming users because of the redundancy with 13 separate services). We have shared these results with several root operators and RIPE Atlas; two operators are using them in regular operation, showing their utility.
7. Related Work
A number of works have suggested definitions of the Internet (Cerf and Kahn, 1974; Postel, 1980; Federal Networking Council (FNC), 1995; Engadget, 2020). As discussed in § 2, they distinguish the Internet from other networks of their time, but do not address today’s network disputes and secession threats.
Previous work has looked into the problem of partial outages. RON provides alternate-path routing around failures for a mesh of sites (Andersen et al., 2001). HUBBLE monitors in real-time reachability problems in which a working physical path exists. LIFEGUARD, proposes a route failure remediation system by generating BGP messages to reroute traffic through a working path (Katz-Bassett et al., 2012). While both solve the problem of partial outages, neither quantifies the amount, duration, or scope of partial outages in the Internet.
Prior work studied partial reachability, showing it is a common transient occurrence during routing convergence (Bush et al., 2009). They reproduced partial connectivity with controlled experiments; we study it from Internet-wide vantage points.
Internet scanners have examined bias by location (Heidemann et al., 2008), more recently looking for policy-based filtering (Wan et al., 2020). We measure policies with our country specific algorithm, and we extend those ideas to defining the Internet.
Outage detection systems have encountered partial outages. Thunderping recognizes the “hosed” state of partial replies as something that occurs, but leaves its study to future work (Schulman and Spring, 2011). Trinocular discards partial outages by reporting the target block “up” if any VP can reach it (Quan et al., 2013). To the best of our knowledge, prior outage detection systems have not both explained and reported partial outages as part of the Internet, nor studied their extent.
8. Conclusions
This paper provided a new definition of the Internet’s core. We developed the algorithm Taitao, to find peninsulas of partial connectivity, and Chiloe, to find islands. We showed that partial connectivity events are more common than simple outages, and suggest they help clarify questions around Internet sovereignty and evolution.
Acknowledgements.
The authors would like to thank John Wroclawski, Wes Hardaker, Ramakrishna Padmanabhan, Ramesh Govindan, Eddie Kohler, and the Internet Architecture Board for their input on on an early version of this paper. The work is supported in part by the National Science Foundation, CISE Directorate, award CNS-2007106 and NSF-2028279. The U.S. Government is authorized to reproduce and distribute reprints for Governmental purposes notwithstanding any copyright notation thereon.References
- (1)
- Amin et al. (2015) Christopher Amin, Massimo Cándela, Daniel Karrenberg, Robert Kisteleki, and Andreas Strikos. 2015. Visualization and Monitoring for the Identification and Analysis of DNS Issues. In Proceedings of the International Conference on the Internet Monitoring and Protection. Brussels, Belgium. https://www.researchgate.net/profile/Massimo-Candela/publication/279516870_Visualization_and_Monitoring_for_the_Identification_and_Analysis_of_DNS_Issues/links/559468c808ae793d13798901/Visualization-and-Monitoring-for-the-Identification-and-Analysis-of-DNS-Issues.pdf
- Andersen et al. (2001) David G. Andersen, Hari Balakrishnan, M. Frans Kaashoek, and Robert Morris. 2001. Resilient Overlay Networks. In Proceedings of the Symposium on Operating Systems Principles. ACM, Chateau Lake Louise, Alberta, Canada, 131–145. http://www-cse.ucsd.edu/sosp01/papers/andersen.pdf
- Anonymous (2012) Anonymous. 2012. The collateral damage of Internet censorship by DNS injection. ACM Computer Communication Review 42, 3 (July 2012), 21–27. https://doi.org/10.1145/2317307.2317311
- Anonymous (2014) Anonymous. 2014. Towards a Comprehensive Picture of the Great Firewall’s DNS Censorship. In Proceedings of the USENIX Workshop on Free and Open Communciations on the Internet. USENIX, San Diego, CA, USA, 7 pages. https://www.usenix.org/system/files/conference/foci14/foci14-anonymous.pdf
- ANT Project (2022) ANT Project. 2022. ANT IPv4 Island and Peninsula Data. https://ant.isi.edu/datasets/ipv4_partial/. https://ant.isi.edu/datasets/ipv4_partial/
- Aronson (2015) Cathy Aronson. 2015. To Squat Or Not To Squat? blog https://teamarin.net/2015/11/23/to-squat-or-not-to-squat/. https://teamarin.net/2015/11/23/to-squat-or-not-to-squat/
- Baltra and Heidemann (2020) Guillermo Baltra and John Heidemann. 2020. Improving Coverage of Internet Outage Detection in Sparse Blocks. In Proceedings of the Passive and Active Measurement Workshop. Springer, Eugene, Oregon, USA.
- Bartlett et al. (2007) Genevieve Bartlett, John Heidemann, and Christos Papadopoulos. 2007. Understanding Passive and Active Service Discovery. In Proceedings of the ACM Internet Measurement Conference. ACM, San Diego, California, USA, 57–70. https://doi.org/10.1145/1298306.1298314
- Birge-Lee et al. (2018) Henry Birge-Lee, Yixin Sun, Anne Edmundson, Jennifer Rexford, and Prateek Mittal. 2018. Bamboozling certificate authorities with BGP. In 27th USENIX Security Symposium. USENIX, Baltimore, Maryland, USA, 833–849.
- Bush et al. (2009) Randy Bush, Olaf Maennel, Matthew Roughan, and Steve Uhlig. 2009. Internet optometry: assessing the broken glasses in Internet reachability. In Proceedings of the 9th ACM SIGCOMM conference on Internet measurement. ACM, Chicago, Illinois, USA, 242–253. http://www.maennel.net/2009/imc099-bush.pdf
- CAIDA (2007) CAIDA. 2007. Archipelago (Ark) Measurement Infrastructure. website https://www.caida.org/projects/ark/. https://www.caida.org/projects/ark/
- CAIDA (2017) CAIDA. 2017. The CAIDA UCSD IPv4 Routed /24 Topology Dataset - 2017-10-10 to -31. https://www.caida.org/data/active/ipv4_routed_24_topology_dataset.xml.
- CAIDA (2020) CAIDA. 2020. The CAIDA UCSD IPv4 Routed /24 Topology Dataset - 2020-09-01 to -31. https://www.caida.org/data/active/ipv4_routed_24_topology_dataset.xml.
- Cerf and Kahn (1974) Vint Cerf and Robert Kahn. 1974. A Protocol for Packet Network Interconnection. IEEE Transactions on Communications COM-22, 5 (May 1974), 637–648. http://sysnet.ucsd.edu/classes/cse222/wi03/papers/cerf-tcp-toc74.pdf
- Cheshire and Krochmal (2013) S. Cheshire and M. Krochmal. 2013. NAT Port Mapping Protocol (NAT-PMP). RFC 6886. Internet Request For Comments. https://doi.org/10.17487/RFC6886
- Clark (1988) David D. Clark. 1988. The Design Philosophy of the DARPA Internet Protocols. In Proceedings of the 1988 Symposium on Communications Architectures and Protocols. ACM, 106–114.
- Clark et al. (2002) David D. Clark, John Wroclawski, Karen Sollins, and Robert Braden. 2002. Tussle in Cyberspace: Defining Tomorrow’s Internet. In Proceedings of the ACM SIGCOMM Conference. ACM, Pittsburgh, PA, USA, 347–356. http://www.acm.org/sigcomm/sigcomm2002/papers/tussle.pdf
- CNBC (2019) CNBC. 2019. Russia just brought in a law to try to disconnect its Internet from the rest of the world. https://www.cnbc.com/2019/11/01/russia-controversial-sovereign-internet-law-goes-into-force.html.
- Coca (2018) N. Coca. 2018. China’s Xinjiang surveillance is the dystopian future nobody wants. Engadget (Feb. 22 2018). https://www.engadget.com/2018-02-22-china-xinjiang-surveillance-tech-spread.html
- Cogent (2021) Cogent. 2021. Looking Glass. https://cogentco.com/en/looking-glass.
- Cowie (2011) James Cowie. 2011. Egypt Leaves the Internet. Renesys Blog http://www.renesys.com/blog/2011/01/egypt-leaves-the-internet.shtml. http://www.renesys.com/blog/2011/01/egypt-leaves-the-internet.shtml
- daily (2021) RBC daily. 2021. Russia, tested the Runet when disconnected from the Global Network. website https://www.rbc.ru/technology_and_media/21/07/2021/60f8134c9a79476f5de1d739. https://www.rbc.ru/technology_and_media/21/07/2021/60f8134c9a79476f5de1d739
- Dhaka Tribune Desk (2018) Dhaka Tribune Desk. 2018. Internet services to be suspended across the country. Dhaka Tribune (Feb. 11 2018). http://www.dhakatribune.com/regulation/2018/02/11/internet-services-suspended-throughout-country/
- Dhamdhere et al. (2018) Amogh Dhamdhere, David D. Clark, Alexander Gamero-Garrido, Matthew Luckie, Ricky K. P. Mok, Gautam Akiwate, Kabir Gogia, Vaibhav Bajpai, Alex C. Snoeren, and kc claffy. 2018. Inferring Persistent Interdomain Congestion. In Proceedings of the ACM SIGCOMM Conference. ACM, Budapest, Hungary, 1–15. https://doi.org/10.1145/3230543.3230549
- DINRG (2021) DINRG. 2021. Decentralized Internet Infrastructure Research Group. https://irtf.org/dinrg.
- Drake et al. (2016) William J. Drake, Vinton G. Cerf, and Wolfgang Kleinwächter. 2016. Internet Fragmentation: An Overview. Technical Report. World Economic Forum. https://www3.weforum.org/docs/WEF_FII_Internet_Fragmentation_An_Overview_2016.pdf
- Dunn (2021) Peter K. Dunn. 2021. Scientific Research Methods. https://bookdown.org/pkaldunn/Book/.
- Durumeric et al. (2014) Zakir Durumeric, Michael Bailey, and J Alex Halderman. 2014. An Internet-wide view of Internet-wide scanning. In 23rd USENIX Security Symposium (USENIX Security 14). USENIX, San Diego, California, USA, 65–78. https://jhalderm.com/pub/papers/scanning-sec14.pdf
- Economist Editors (2018) Economist Editors. 2018. Why some countries are turning off the internet on exam days. The Economist (July 5 2018). https://www.economist.com/middle-east-and-africa/2018/07/05/why-some-countries-are-turning-off-the-internet-on-exam-days (Appeared in the Middle East and Africa print edition).
- Electric (2021) Hurricane Electric. 2021. Looking Glass. http://lg.he.net/.
- Engadget (2020) Engadget. 2020. China, Huawei propose internet protocol with a built-in killswitch. https://www.engadget.com/2020-03-30-china-huawei-new-ip-proposal.html.
- Fan and Heidemann (2010) Xun Fan and John Heidemann. 2010. Selecting Representative IP Addresses for Internet Topology Studies. In Proceedings of the ACM Internet Measurement Conference. ACM, Melbourne, Australia, 411–423. https://doi.org/10.1145/1879141.1879195
- Federal Networking Council (FNC) (1995) Federal Networking Council (FNC). 1995. Definition of “Internet”. https://www.nitrd.gov/historical/fnc/internet_res.pdf.
- forums (2017) HE forums. 2017. Cloudflare Blocked on Free Tunnels now? https://forums.he.net/index.php?topic=3805.0.
- Fuller et al. (2008) V. Fuller, E. Lear, and D. Meyer. 2008. Reclassifying 240/4 as usable unicast address space. (March 2008). https://datatracker.ietf.org/doc/html/draft-fuller-240space-02 Work in progress (Internet draft draft-fuller-240space-02.txt).
- Gibbs (1996) Samuel Gibbs. 1996. Iraq shuts down the Internet to stop pupils cheating in exams. The Guardian (18 May 1996). https://www.theguardian.com/technology/2016/may/18/iraq-shuts-down-internet-to-stop-pupils-cheating-in-exams
- GovTrack.us (2020) GovTrack.us. 2020. Unplug the Internet Kill Switch Act would eliminate a 1942 law that could let the president shut down the internet. https://govtrackinsider.com/unplug-the-internet-kill-switch-act-would-eliminate-a-1942-law-that-could-let-the-president-shut-78326f0ef66c. https://govtrackinsider.com/unplug-the-internet-kill-switch-act-would-eliminate-a-1942-law-that-could-let-the-president-shut-78326f0ef66c
- Greenberg et al. (2009) Albert Greenberg, James R. Hamilton, Navendu Jain, Srikanth Kandula, Changhoon Kim, Parantap Lahiri, David A. Maltz, and Parveen Pat. 2009. VL2: A Scalable and Flexible Data Center Network. In Proceedings of the ACM SIGCOMM Conference. ACM, Barcelona, Spain, 51–62. http://ccr.sigcomm.org/online/files/p51.pdf
- Griffiths (2019) James Griffiths. 2019. Democratic Republic of Congo internet shutdown shows how Chinese censorship tactics are spreading. CNN (Jan. 2 2019). https://edition.cnn.com/2019/01/02/africa/congo-internet-shutdown-china-intl/index.html
- Guillot et al. (2019) Andreas Guillot, Romain Fontugne, Philipp Winter, Pascal Merindol, Alistair King, Alberto Dainotti, and Cristel Pelsser. 2019. Chocolatine: Outage Detection for Internet Background Radiation. In Proceedings of the IFIP International Workshop on Traffic Monitoring and Analysis. IFIP, Paris, France, 8 pages. https://clarinet.u-strasbg.fr/~pelsser/publications/Guillot-chocolatine-TMA2019.pdf
- Guo and Heidemann (2018) Hang Guo and John Heidemann. 2018. Detecting ICMP Rate Limiting in the Internet. In Proceedings of the Passive and Active Measurement Workshop. Springer, Berlin, Germany, to appear.
- Heidemann et al. (2008) John Heidemann, Yuri Pradkin, Ramesh Govindan, Christos Papadopoulos, Genevieve Bartlett, and Joseph Bannister. 2008. Census and Survey of the Visible Internet. In Proceedings of the ACM Internet Measurement Conference. ACM, Vouliagmeni, Greece, 169–182. https://doi.org/10.1145/1452520.1452542
- Henley (2018) Jon Henley. 2018. Algeria blocks internet to prevent students cheating during exams. The Guardian (22 June 2018). https://www.theguardian.com/world/2018/jun/21/algeria-shuts-internet-prevent-cheating-school-exams
- IANA (2021) IANA. 2021. IPv6 RIR Allocation Data. https://www.iana.org/numbers/allocations/.
- Internet Architecture Board (2000) Internet Architecture Board. 2000. IAB Technical Comment on the Unique DNS Root. RFC 2826. Internet Request For Comments. https://www.rfc-editor.org/rfc/rfc2826
- Katz-Bassett et al. (2008) Ethan Katz-Bassett, Harsha V Madhyastha, John P John, Arvind Krishnamurthy, David Wetherall, and Thomas E Anderson. 2008. Studying Black Holes in the Internet with Hubble. In Proceedings of the USENIX Conference on Networked Systems Design and Implementation. ACM, San Francisco, CA, 247–262.
- Katz-Bassett et al. (2012) Ethan Katz-Bassett, Colin Scott, David R. Choffnes, Ítalo Cunha, Vytautas Valancius, Nick Feamster, Harsha V. Madhyastha, Tom Anderson, and Arvind Krishnamurthy. 2012. LIFEGUARD: Practical Repair of Persistent Route Failures. In Proceedings of the ACM SIGCOMM Conference. ACM, Helsinki, Finland, 395–406. https://doi.org/10.1145/2377677.2377756
- Knowledge (2009) DataCenter Knowledge. 2009. Peering Disputes Migrate to IPv6. https://www.datacenterknowledge.com/archives/2009/10/22/peering-disputes-migrate-to-ipv6.
- Labovitz et al. (2010) Craig Labovitz, Scott Iekel-Johnson, Danny McPherson, Jon Oberheide, and Farnam Jahanian. 2010. Internet Inter-Domain Traffic. In Proceedings of the ACM SIGCOMM Conference. ACM, New Delhi, India, 75–86. https://doi.org/10.1145/1851182.1851194
- Lamport (1998) Leslie Lamport. 1998. The Part-Time Parliament. ACM Transactions on Computer Systems 16, 2 (May 1998), 133–169. https://doi.org/10.1145/279227.279229
- Lamport et al. (1982) Leslie Lamport, Robert Shostak, and Marshall Pease. 1982. The Byzantine Generals Problem. ACM Transactions on Programming Languages and Systems 4, 3 (July 1982), 382–401.
- Meyer (2018) D. Meyer. 2018. University of Oregon Routeviews. http://www.routeviews.org.
- Miller et al. (2001) Brent A. Miller, Toby Nixon, Charlie Tai, and Mark D. Wood. 2001. Home Networking with Universal Plug and Play. IEEE Communications Magazine 39, 12 (Dec. 2001), 104–109. https://doi.org/10.1109/35.968819
- Miller (2009) Rich Miller. 2009. Peering Disputes Migrate to IPv6. website https://www.datacenterknowledge.com/archives/2009/10/22/peering-disputes-migrate-to-ipv6. https://www.datacenterknowledge.com/archives/2009/10/22/peering-disputes-migrate-to-ipv6
- (moderator) (2022) William J. Drake (moderator). 2022. Internet Fragmentation, Reconsidered. CITI Seminar on Global Digital Governance at IETF 115. https://www8.gsb.columbia.edu/citi/GlobalDigitalGovernance
- Nakamoto (2009) Satoshi Nakamoto. 2009. Bitcoin: A Peer-to-Peer Electronic Cash System. Released publically http://bitcoin.org/bitcoin.pdf. http://bitcoin.org/bitcoin.pdf
- NCC (21q3a) RIPE NCC. 2021q3a. RIPE Atlas IP echo measurements in IPv4. https://atlas.ripe.net/measurements/[1001,1004,1005,1006,1008,1009,1010,1011,1012,1013,1014,1015,1016]/.
- NCC (21q3b) RIPE NCC. 2021q3b. RIPE Atlas IP traceroute measurements in IPv4. https://atlas.ripe.net/measurements/[5001,5004,5005,5006,5008,5009,5010,5011,5012,5013,5014,5015,5016]/.
- News (2019) BBC News. 2019. Russia internet: Law introducing new controls comes into force. website https://www.bbc.com/news/world-europe-50259597. https://www.bbc.com/news/world-europe-50259597
- NRO (2021) NRO. 2021. IPv4 Address Space Registry. https://www.nro.net/about/rirs/statistics/.
- Padmanabhan et al. (2016) Ramakrishna Padmanabhan, Amogh Dhamdhere, Emile Aben, kc claffy, and Neil Spring. 2016. Reasons Dynamic Addresses Change. In Proceedings of the ACM Internet Measurement Conference. ACM, Santa Monica, CA, USA, 183–198. https://doi.org/10.1145/2987443.2987461
- Partridge et al. (1993) C. Partridge, T. Mendez, and W. Milliken. 1993. Host Anycasting Service. RFC 1546. Internet Request For Comments. https://www.rfc-editor.org/rfc/rfc1546.txt
- Postel (1980) Jonathan B. Postel. 1980. Internetwork Protocol Approaches. IEEE Trans. Comput. 28, 4 (April 1980), 604–611. https://doi.org/10.1109/TCOM.1980.1094705
- Quan et al. (2013) Lin Quan, John Heidemann, and Yuri Pradkin. 2013. Trinocular: Understanding Internet Reliability Through Adaptive Probing. In Proceedings of the ACM SIGCOMM Conference. ACM, Hong Kong, China, 255–266. https://doi.org/10.1145/2486001.2486017
- Rayburn (2016) Dan Rayburn. 2016. Google Blocking IPv6 Adoption With Cogent, Impacting Transit Customers. https://seekingalpha.com/article/3948876-google-blocking-ipv6-adoption-cogent-impacting-transit-customers.
- Rekhter et al. (1996) Y. Rekhter, B. Moskowitz, D. Karrenberg, G. J. de Groot, and E. Lear. 1996. Address Allocation for Private Internets. RFC 1918. Internet Request For Comments. ftp://ftp.rfc-editor.org/in-notes/rfc1918.txt
- Reuters (2021) Reuters. 2021. Russia disconnected from internet in tests as it bolsters security. website https://www.reuters.com/technology/russia-disconnected-global-internet-tests-rbc-daily-2021-07-22/. https://www.reuters.com/technology/russia-disconnected-global-internet-tests-rbc-daily-2021-07-22/
- Reuters (2022) Reuters. 2022. website https://www.reuters.com/technology/us-firm-cogent-cutting-internet-service-russia-2022-03-04/. https://www.reuters.com/technology/us-firm-cogent-cutting-internet-service-russia-2022-03-04/
- Richter et al. (2018) Philipp Richter, Ramakrishna Padmanabhan, Neil Spring, Arthur Berger, and David Clark. 2018. Advancing the Art of Internet Edge Outage Detection. In Proceedings of the ACM Internet Measurement Conference. ACM, Boston, Massachusetts, USA, 350–363. https://doi.org/10.1145/3278532.3278563
- Richter et al. (2016) Philipp Richter, Florian Wohlfart, Narseo Vallina-Rodriguez, Mark Allman, Randy Bush, Anja Feldmann, Christian Kreibich, Nicholas Weaver, and Vern Paxson. 2016. A Multi-perspective Analysis of Carrier-Grade NAT Deployment. In Proceedings of the ACM Internet Measurement Conference. ACM, Santa Monica, CA, USA. https://doi.org/10.1145/2987443.2987474
- RIPE NCC (2020) RIPE NCC. 2020. DNSMON. https://atlas.ripe.net/dnsmon.
- RIPE NCC Staff (2015) RIPE NCC Staff. 2015. RIPE Atlas: A Global Internet Measurement Network. The Internet Protocol Journal 18, 3 (Sept. 2015), 2–26.
- Rockefeller (2009) Sen. John D. Rockefeller. 2009. Cybersecurity Act of 2010. https://www.congress.gov/bill/111th-congress/senate-bill/773.
- Root Operators (2016) Root Operators. 2016. http://www.root-servers.org.
- Rosenberg et al. (2003) J. Rosenberg, J. Weinberger, C. Huitema, and R. Mahy. 2003. STUN—Simple Traversal of User Datagram Protocol (UDP) Through Network Address Translators (NATs). RFC 3489. Internet Request For Comments. ftp://ftp.rfc-editor.org/in-notes/rfc3489.txt
- Saluja et al. (2022) Tarang Saluja, John Heidemann, and Yuri Pradkin. 2022. Differences in Monitoring the DNS Root Over IPv4 and IPv6. In Proceedings of the National Symposium for NSF REU Research in Data Science, Systems, and Security. IEEE, Portland, OR, USA, to appear.
- Schlinker et al. (2017) Brandon Schlinker, Hyojeong Kim, Timothy Cui, Ethan Katz-Bassett, Harsha V. Madhyastha, Italo Cunha, James Quinn, Saif Hasan, Petr Lapukhov, and Hongyi Zeng. 2017. Engineering Egress with Edge Fabric: Steering Oceans of Content to the World. In Proceedings of the ACM SIGCOMM Conference. ACM, Los Angeles, CA, USA, 418–431. https://doi.org/10.1145/3098822.3098853
- Schulman and Spring (2011) Aaron Schulman and Neil Spring. 2011. Pingin’ in the Rain. In Proceedings of the ACM Internet Measurement Conference. ACM, Berlin, Germany, 19–25. https://doi.org/10.1145/2068816.2068819
- Shah et al. (2017) Anant Shah, Romain Fontugne, Emile Aben, Cristel Pelsser, and Randy Bush. 2017. Disco: Fast, Good, and Cheap Outage Detection. In Proceedings of the IEEE International Conference on Traffic Monitoring and Analysis. Springer, Dublin, Ireland, 1–9. https://doi.org/10.23919/TMA.2017.8002902
- Song and Heidemann (2021) Xiao Song and John Heidemann. 2021. Measuring the Internet during Covid-19 to Evaluate Work-from-Home. Technical Report arXiv:2102.07433v2 [cs.NI]. USC/ISI. https://www.isi.edu/%7ejohnh/PAPERS/Song21a.html
- Taye and Cheng (2019) Berhan Taye and Sage Cheng. 2019. Report: the state of internet shutdowns. blog https://www.accessnow.org/the-state-of-internet-shutdowns-in-2018/. https://www.accessnow.org/the-state-of-internet-shutdowns-in-2018/
- Timberg and Sonne (2021) Craig Timberg and Paul Sonne. 2021. Minutes before Trump left office, millions of the Pentagon’s dormant IP addresses sprang to life. The Washington Post (Apr. 24 2021). https://www.washingtonpost.com/technology/2021/04/24/pentagon-internet-address-mystery/
- Tsuchiya and Eng (1993) Paul F. Tsuchiya and Tony Eng. 1993. Extending the IP Internet Through Address Reuse. ACM Computer Communication Review 23, 1 (Jan. 1993), 16–33. http://www.cs.cornell.edu/People/francis/tsuchiya93extending.pdf
- USC/ISI ANT project (2017) USC/ISI ANT project. 2017. https://ant.isi.edu/datasets/all.html. Accessed: 2019-01-08.
- USC/LANDER Project (2014) USC/LANDER Project. 2014. Internet Outage Measurements. listed on web page https://ant.isi.edu/datasets/outage/.
- Wan et al. (2020) Gerry Wan, Liz Izhikevich, David Adrian, Katsunari Yoshioka, Ralph Holz, Christian Rossow, and Zakir Durumeric. 2020. On the Origin of Scanning: The Impact of Location on Internet-Wide Scans. In Proceedings of the ACM Internet Measurement Conference. ACM, Pittsburgh, PA, USA, 662–679. https://doi.org/10.1145/3419394.3424214
- Woodhams and Migliano (2021) Samuel Woodhams and Simon Migliano. 2021. The Global Cost of Internet Shutdowns in 2020. https://www.top10vpn.com/cost-of-internet-shutdowns/.
Appendix A Research Ethics
Our work poses no ethical concerns for several reasons.
First, we collect no additional data, but instead reanalyze data from several existing sources listed in § B. Our work therefore poses no additional risk in data collection.
Our analysis poses no risk to individuals because our subject is network topology and connectivity. There is a slight risk to individuals in that we examine responsiveness of individual IP addresses. With external information, IP addresses can sometimes be traced to individuals, particularly when combined with external data sources like DHCP logs. We avoid this risk in three ways. First, we do not have DHCP logs for any networks (and in fact, most are unavailable outside of specific ISPs). Second, we commit, as research policy, to not combine IP addresses with external data sources that might de-anonymize them to individuals. Finally, except for analysis of specific cases as part of validation, all of our analysis is done in bulk over the whole dataset.
We do observe data about organizations such as ISPs, and about the geolocation of blocks of IP addresses. Because we do not map IP addresses to individuals, this analysis poses no individual privacy risk.
Finally, we suggest that while our work poses minimal privacy risks to individuals, to also provides substantial benefit to the community and to individuals. For reasons given in the introduction it is important to improve network reliability and understand now networks fail. Our work contributes to that goal.
Our work was reviewed by the Institutional Review Board at our university and because it poses no risk to individual privacy, it was identified as non-human subjects research (USC IRB IIR00001648).
Appendix B Data Sources Used Here
| Dataset Name | Source | Start Date | Duration | Where Used |
| internet_outage_adaptive_a28w-20170403 | Trinocular (USC/ISI ANT project, 2017) | 2017-04-03 | 90 days | |
| Polish peninsula subset | 2017-06-03 | 12 hours | § 2.2.2, § C | |
| internet_outage_adaptive_a28c-20170403 | Trinocular | 2017-04-03 | 90 days | |
| Polish peninsula subset | 2017-06-03 | 12 hours | § C | |
| internet_outage_adaptive_a28j-20170403 | Trinocular | 2017-04-03 | 90 days | |
| Polish peninsula subset | 2017-06-03 | 12 hours | § C | |
| internet_outage_adaptive_a28g-20170403 | Trinocular | 2017-04-03 | 90 days | |
| Polish peninsula subset | 2017-06-03 | 12 hours | § C | |
| internet_outage_adaptive_a28e-20170403 | Trinocular | 2017-04-03 | 90 days | |
| Polish peninsula subset | 2017-06-03 | 12 hours | § 2.2.2, § C | |
| internet_outage_adaptive_a28n-20170403 | Trinocular | 2017-04-03 | 90 days | |
| Polish peninsula subset | 2017-06-03 | 12 hours | § 2.2.2, § C | |
| internet_outage_adaptive_a28all-20170403 | Trinocular | 2017-04-03 | 89 days | § 4.3, § 5.4, § 5.5, § D.3 |
| internet_outage_adaptive_a29all-20170702 | Trinocular | 2017-07-02 | 94 days | § 2.2.2, § 4.3, § 5.4, § 5.5, § D.3 |
| internet_outage_adaptive_a30w-20171006 | Trinocular | 2017-10-06 | 85 days | |
| Site E Island | 2017-10-23 | 36 hours | § 2.2.3, § C | |
| internet_outage_adaptive_a30c-20171006 | Trinocular | 2017-10-06 | 85 days | |
| Site E Island | 2017-10-23 | 36 hours | § C | |
| internet_outage_adaptive_a30j-20171006 | Trinocular | 2017-10-06 | 85 days | |
| Site E Island | 2017-10-23 | 36 hours | § C | |
| internet_outage_adaptive_a30g-20171006 | Trinocular | 2017-10-06 | 85 days | |
| Site E Island | 2017-10-23 | 36 hours | § C | |
| internet_outage_adaptive_a30e-20171006 | Trinocular | 2017-10-06 | 85 days | |
| Site E Island | 2017-10-23 | 36 hours | § 2.2.3, § C | |
| internet_outage_adaptive_a30n-20171006 | Trinocular | 2017-10-06 | 85 days | |
| Site E Island | 2017-10-23 | 36 hours | § 2.2.3, § C | |
| internet_outage_adaptive_a30all-20171006 | Trinocular | 2017-10-06 | 85 days | § 4.3, § 5.4, § 5.5, § 4.4, § D.3 |
| Oct. Nov. subset | 2017-10-06 | 40 days | § 4.2, § 5.2, § E.1 | |
| Oct. subset | 2017-10-10 | 21 days | § 4.1, § 6.3 | |
| internet_outage_adaptive_a31all-20180101 | Trinocular | 2018-01-01 | 90 days | § 4.3, § 5.4, § 5.5, § D.3 |
| internet_outage_adaptive_a32all-20180401 | Trinocular | 2018-04-01 | 90 days | § 4.3, § 5.4, § 5.5, § D.3 |
| internet_outage_adaptive_a33all-20180701 | Trinocular | 2018-07-01 | 90 days | § 4.3, § 5.4, § 5.5, § D.3 |
| internet_outage_adaptive_a34all-20181001 | Trinocular | 2018-10-01 | 90 days | § 4.3, § 5.4, § 5.5, § F.1, § D.3 |
| internet_outage_adaptive_a35all-20190101 | Trinocular | 2019-01-01 | 90 days | § 4.3, § 5.4, § 5.5, § D.3 |
| internet_outage_adaptive_a36all-20190401 | Trinocular | 2019-01-01 | 90 days | § 4.3, § 5.4, § 5.5, § D.3 |
| internet_outage_adaptive_a37all-20190701 | Trinocular | 2019-01-01 | 90 days | § 4.3, § 5.4, § 5.5, § D.3 |
| internet_outage_adaptive_a38all-20191001 | Trinocular | 2019-01-01 | 90 days | § 4.3, § 5.4, § 5.5, § D.3 |
| internet_outage_adaptive_a39all-20200101 | Trinocular | 2020-01-01 | 90 days | § 4.3, § 5.4, § 5.5, § D.3 |
| internet_outage_adaptive_a41all-20200701 | Trinocular | 2020-07-01 | 90 days | § E.2 |
| prefix-probing | Ark (CAIDA, 2007) | |||
| Oct. 2017 subset | 2017-10-10 | 21 days | § 4.1, § 6.3 | |
| 2020q3 subset | 2020-07-01 | 90 days | § E.2 | |
| probe-data | Ark | |||
| Oct 2017 subset | 2017-10-10 | 21 days | § 4.1, § 6.3 | |
| 2020q3 subset | 2020-07-01 | 90 days | § E.2 | |
| routeviews.org/bgpdata | Routeviews (Meyer, 2018) | 2017-10-06 | 40 days | § 4.2, § C |
| Atlas Recurring Root Pings (id: 1001 to 1016) | Atlas (NCC, 21q3a) | 2021-07-01 | 90 days | § 5.1, § 5.5 |
| nro-extended-stats | NRO (NRO, 2021; IANA, 2021) | 1984 | 41 years | § 6.2 |
Table 7 provides a full list of datasets used in this paper and where they may be obtained.
Appendix C Validation of the Polish Peninsula
On 2017-10-23, for a period of 3 hours starting at 22:02Z, five Polish ASes had 1716 blocks that were unreachable from five VPs while the same blocks remained reachable from a sixth VP.
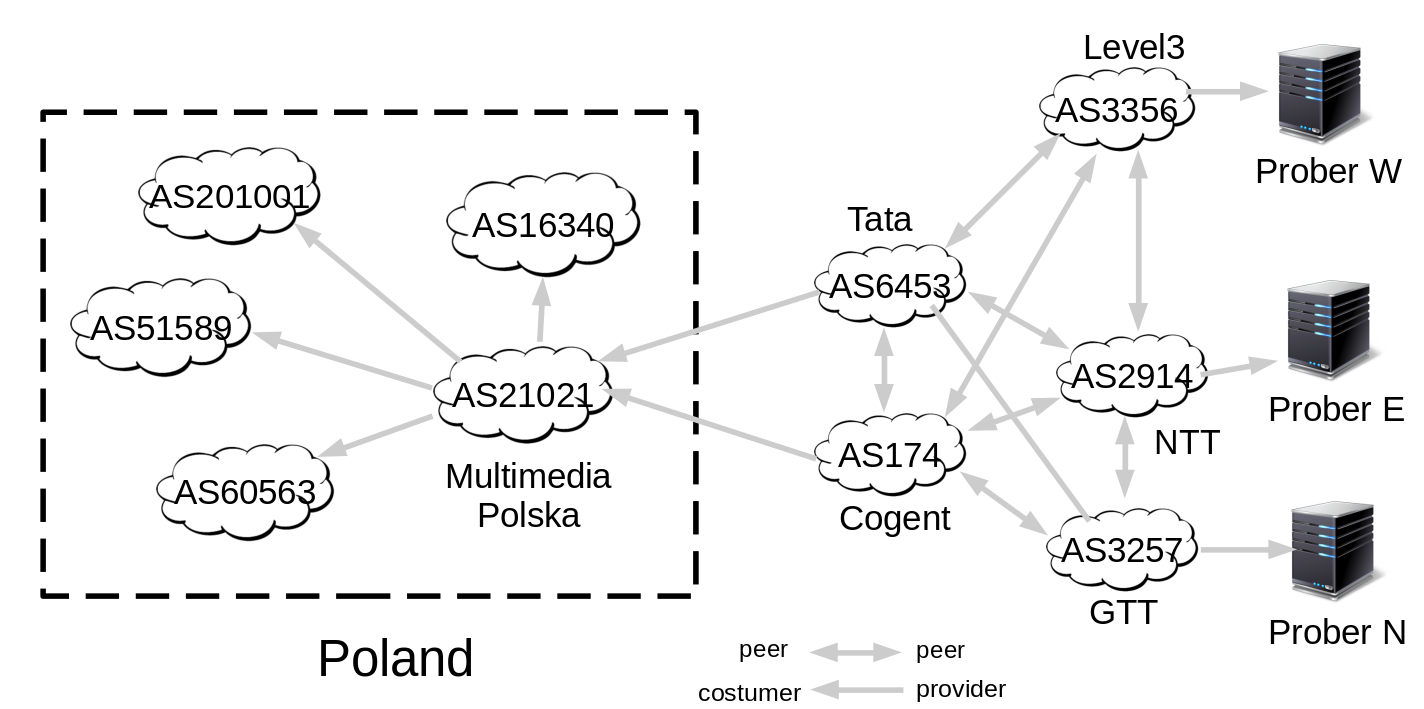
Figure 9 shows the AS-level relationships at the time of the peninsula. Multimedia Polska (AS21021, or MP) provides service to the other 4 ISPs. MP has two Tier-1 providers: Cogent (AS174) and Tata (AS6453). Before the peninsula, our VPs see MP through Cogent.
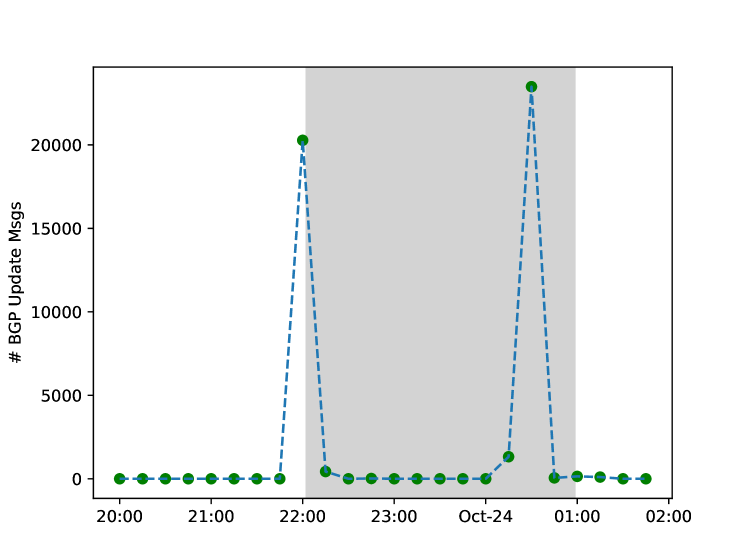
At event start, we observe many BGP updates (20,275) announcing and withdrawing routes to the affected blocks(see Figure 10). These updates correspond to Tata announcing MP’s prefixes. Perhaps MP changed its peering to prefer Tata over Cogent, or the MP-Cogent link failed.
Initially, traffic from most VPs continued through Cogent and was lost; it did not shift to Tata. One VP (W) could reach MP through Tata for the entire event, proving MP was connected. After 3 hours, we see another burst of BGP updates (23,487 this time), making MP reachable again from all VPs.
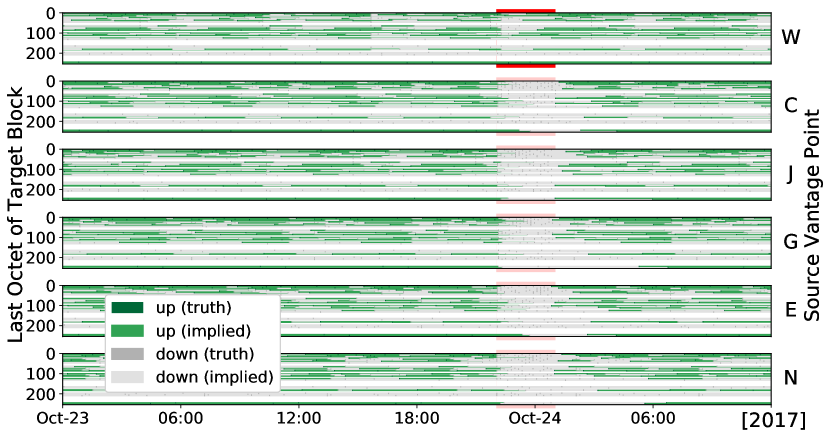
In Figure 11 we provide data from our 6 external VPs, where W is uniquely capable of reaching the target block, thus living in the same peninsula.
| src block | dst block | time | traces |
|---|---|---|---|
| c85eb700 | 50f5b000 | 1508630032 | q, 148.245.170.161, 189.209.17.197, 189.209.17.197, 38.104.245.9, 154.24.19.41, 154.54.47.33, 154.54.28.69, 154.54.7.157, 154.54.40.105, 154.54.40.61, 154.54.43.17, 154.54.44.161, 154.54.77.245, 154.54.38.206, 154.54.60.254, 154.54.59.38, 149.6.71.162, 89.228.6.33, 89.228.2.32, 176.221.98.194 |
| c85eb700 | 50f5b000 | 1508802877 | q, 148.245.170.161, 200.38.245.45, 148.240.221.29 |
We further verify this event by looking at traceroutes. During the event we see 94 unique Ark VPs attempted 345 traceroutes to the affected blocks. Of the 94 VPs, 21 VPs (22%) have their last responsive traceroute hop in the same AS as the target address, and 68 probes (73%) stopped before reaching that AS. Table 8 shows traceroute data from a single CAIDA Ark VP before and during the peninsula described in § 2.2.3 and Figure 2. This data confirms the block was reachable from some locations and not others. During the event, this trace breaks at the last hop within the source AS.
Appendix D Additional Details about Islands
D.1. Country-sized Islands
In § 2.2.2 we defined islands and gave a sample. We also have seen country-sized islands.
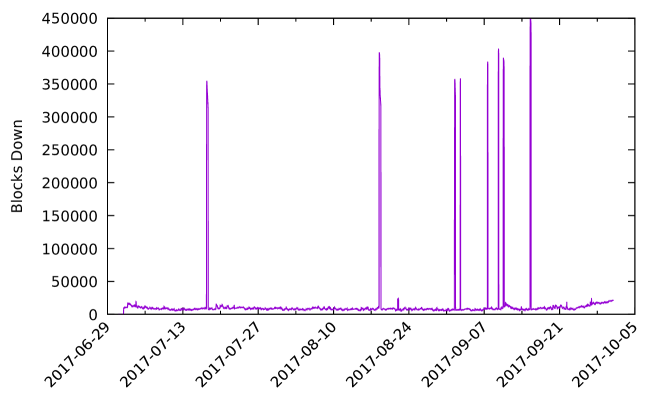
In 2017q3 we observed 8 events when it appears that most or all of China stopped responding to external pings. Figure 12 shows the number of /24 blocks that were down over time, each spike more than 200k /24s, between two to eight hours long. We found no problem reports on network operator mailing lists, so we believe these outages were ICMP-specific and likely did not affect web traffic. In addition, we assume the millions of computers inside China continued to operate. We consider these cases examples of China becoming an ICMP-island.
D.2. Validation of the Sample Island
In § 2.2.2 we reported an island affecting a /24 block where VP E lives. During the time of the event, E was able to successfully probe addresses within the same block, however, unable to reach external addresses. This event started at 2017-06-03t23:06Z, and can be observed in Figure 14.
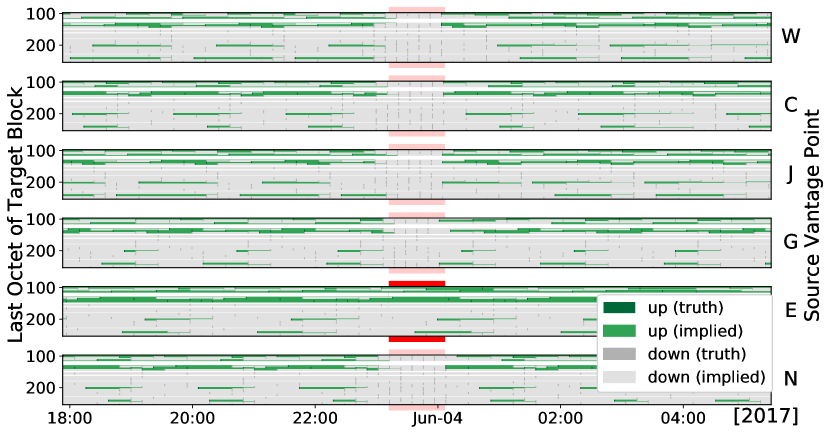
D.3. Longitudinal View Of Islands

Appendix E Additional Details about Peninsulas
E.1. What Sizes Are Peninsulas?
When network issues cause connectivity problems like peninsulas, the size of those problems may vary, from country-size(see § E.3), to AS-size, and also for routable prefixes or fractions of prefixes. We next examine peninsula sizes.
We begin with Taitao peninsula detection at a /24 block level. We match peninsulas across blocks within the same prefix by start time and duration, both measured in one hour timebins. This match implies that the Trinocular VPs observing the blocks as up are also the same.
We compare peninsulas to routable prefixes from Routeviews (Meyer, 2018), using longest prefix matches with /24 blocks.
Routable prefixes consist of many blocks, some of which may not be measurable. We therefore define the peninsula-prefix fraction for each routed prefix as fraction of blocks in the peninsula that are Trinocular-measurable blocks. To reduce noise provided by single block peninsulas, we only consider peninsulas covering 2 or more blocks in a prefix.
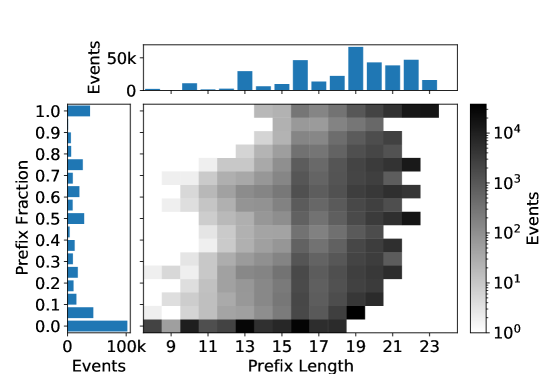
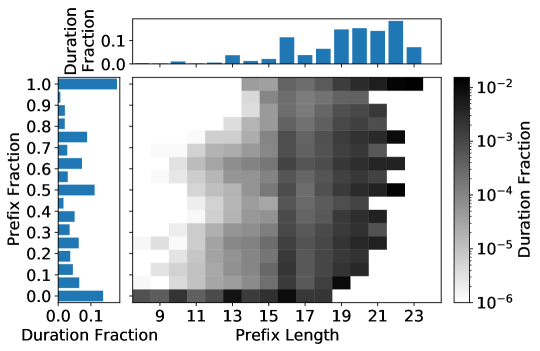
Figure 15a shows the number of peninsulas for different prefix lengths and the fraction of the prefix affected by the peninsula as a heat-map, where we group them into bins.
We see that about 10% of peninsulas are likely due to routing problems or policies, since 40k peninsulas affect the whole routable prefix. However, a third of peninsulas (101k, at the bottom of the plot) affect only a very small fraction of the prefix. These low prefix-fraction peninsulas suggest that they happen inside an ISP and are not due to interdomain routing.
Finally, we show that longer-lived peninsulas are likely due to routing or policy choices. Figure 15b shows the same data source, but weighted by fraction of time each peninsula contributes to the total peninsula time during 2017q4. Here the larger fraction of weight are peninsulas covering full routable prefixes—20% of all peninsula time during the quarter (see left margin).
E.2. Where Do Peninsulas Occur?
Firewalls, link failures, and routing problems cause peninsulas on the Internet. These can either occur inside a given AS, or in upstream providers.
To detect where the Internet breaks into peninsulas, we look at traceroutes that failed to reach their target address, either due to a loop or an ICMP unreachable message. Then, we find where these traces halt, and take note whether halting occurs at the target AS and target prefix, or before the target AS and target prefix.
For our experiment we run Taitao to detect peninsulas at target blocks over Trinocular VPs, we use Ark’s traceroutes (CAIDA, 2020) to find last IP address before halt, and we get target and halting ASNs and prefixes using RouteViews.
| Target AS | Target Prefix | |||
| Sites Up | At | Before | At | Before |
| 0 | 21,765 | 32,489 | 1,775 | 52,479 |
| 1 | 587 | 1,197 | 113 | 1,671 |
| 2 | 2,981 | 4,199 | 316 | 6,864 |
| 3 | 12,709 | 11,802 | 2,454 | 22,057 |
| 4 | 117,377 | 62,881 | 31,211 | 149,047 |
| 5 | 101,516 | 53,649 | 27,298 | 127,867 |
| 1-5 | 235,170 | 133,728 | 61,392 | 307,506 |
| 6 | 967,888 | 812,430 | 238,182 | 1,542,136 |
In Table 9 we show how many traces halt at or before the target network. The center, gray rows show peninsulas (disagreement between VPs) with their total sum in bold. For all peninsulas (the bold row), more traceroutes halt at or inside the target AS (235k vs. 134k, the left columns), but they more often terminate before reaching the target prefix (308k vs. 61k, the right columns). This difference suggests policy is implemented at or inside ASes, but not at routable prefixes. By contrast, outages (agreement with 0 sites up) more often terminate before reaching the target AS. Because peninsulas are more often at or in an AS, while outages occur in many places, it suggests that peninsulas are policy choices.
E.3. Country-Level Peninsulas
Country-specific filtering is a routing policy made by networks to restrict traffic they receive. We next look into what type of organizations actively block overseas traffic. For example, good candidates to restrain who can reach them for security purposes are government related organizations.
| Industry | ASes | Blocks |
|---|---|---|
| ISP | 23 | 138 |
| Education | 21 | 167 |
| Communications | 14 | 44 |
| Healthcare | 8 | 18 |
| Government | 7 | 31 |
| Datacenter | 6 | 11 |
| IT Services | 6 | 8 |
| Finance | 4 | 6 |
| Other (6 types) | 6 (1 per type) | |
Appendix F Additional Results
Our paper body uses Trinocular measurements for 2017q4 because this time period had six active VPs, allowing us to make strong statements about how multiple perspectives help. In this section, we verify our results using newer datasets to confirm our prior results still hold. They do—we find quantitatively similar results between 2017 and 2020.
F.1. Additional Confirmation of the Number of Peninsulas
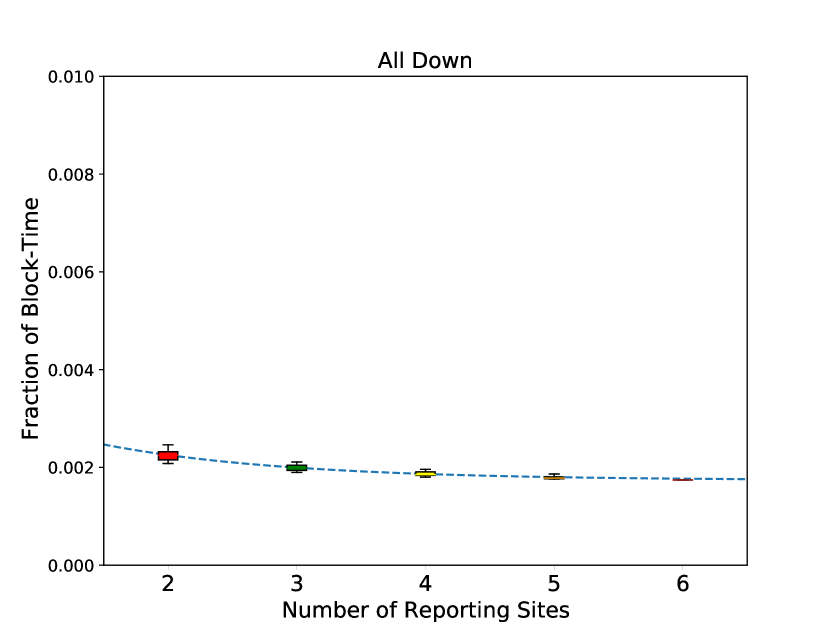
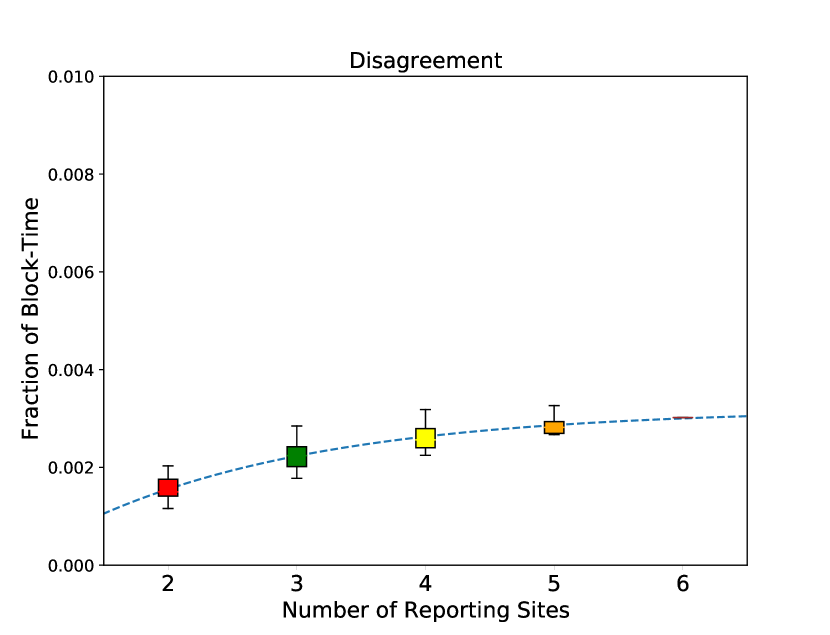
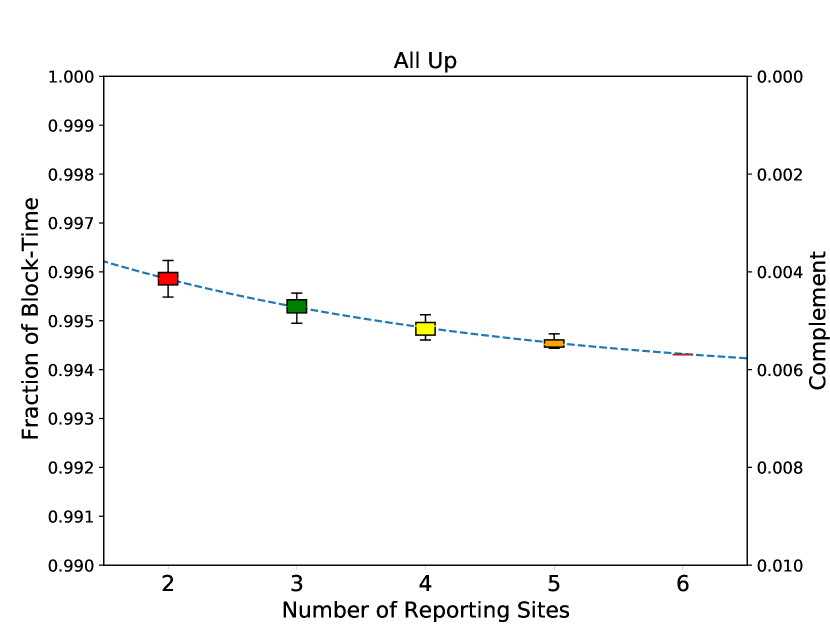
Similarly, as in § 5.1, we quantify how big the problem of peninsulas is, this time using Trinocular 2018q4 data.
In Figure 16 we confirm, that with more VPs more peninsulas are discovered, providing a better view of the Internet’s overall state.
Outages (left) converge after 3 sites, as shown by the fitted curve and decreasing variance. Peninsulas and all-up converge more slowly.
At six VPs, here we find and even higher difference between all down and disagreements. Confirming that peninsulas are a more pervasive problem than outages.
F.2. Additional Confirmation of Peninsula Duration
In § 5.2 we characterize peninsula duration for 2017q4, to determine peninsula root causes. To confirm our results, we repeat the analysis, but with 2020q3 data.
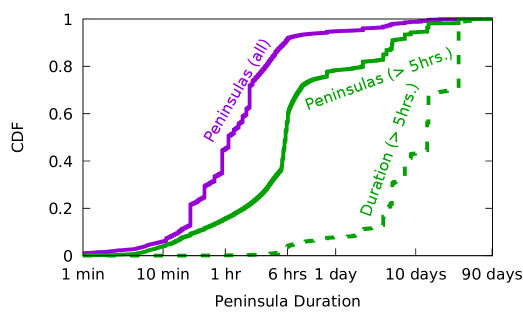
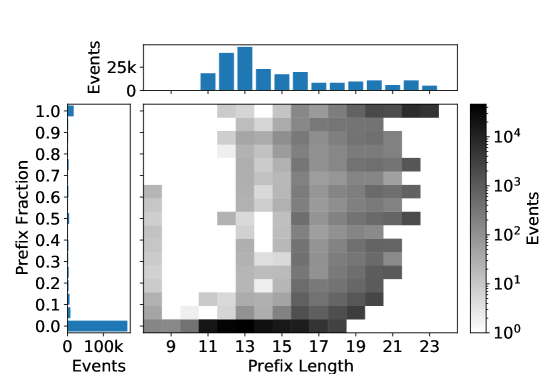
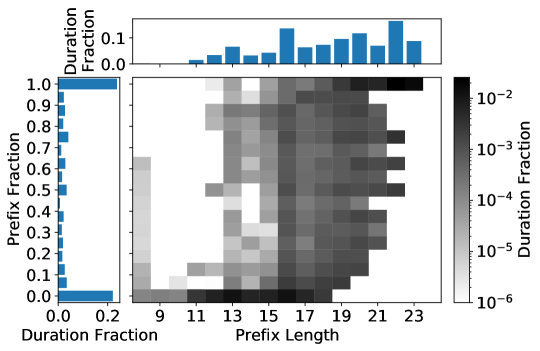
As Figure 17a shows, similarly, as in our 2017q4 results, we see that there are many very brief peninsulas (from 20 to 60 minutes). These results suggest that while the Internet is robust, there are many small connectivity glitches.
Events shorter than two rounds (22 minutes), may represent BGP transients or failures due to random packet loss.
The number of multi-day peninsulas is small, However, these represent about 90% of all peninsula-time. Events lasting a day are long-enough that can be debugged by human network operators, and events lasting longer than a week are long-enough that they may represent policy disputes. Together, these long-lived events suggest that there is benefit to identifying non-transient peninsulas and addressing the underlying routing problem.
F.3. Additional Confirmation of Size
In § E.1 we discussed the size of peninsulas measured as a fraction of the affected routable prefix. In the latter section, we use 2017q4 data. Here we use 2020q3 to confirm our results.
Figure 17b shows the peninsulas per prefix fraction, and Figure 17c. Similarly, we find that while small prefix fraction peninsulas are more in numbers, most of the peninsula time is spent in peninsulas covering the whole prefix. This result is consistent with long lived peninsulas being caused by policy choices.