Cyano radical emission at small spatial scales towards massive protostars
Abstract
Context. The cyano radical (CN), one of the first detected interstellar molecular species, is a key molecule in many astrochemical chains. Particularly, it is detected towards molecular cores, the birth places of the stars, and it is known that it is involved in the rich chemistry that takes place in these sites.
Aims. At present there are not so many studies about the emission of this molecular species at small spatial scales towards massive young stellar objects. Thus, we present a high-angular resolution CN study towards a sample of massive protostars, with the aim of unveiling the spatial distribution at the small scale of the emission of this radical in relation to the star-forming processes.
Methods. The interstellar CN has a strong emission line at the rest frequency 226874.764 MHz, thus, we search for observing projects in the ALMA database regarding high-mass star-forming regions observed at Band 6. The used data set was observed in the ALMA Cycle 3 with angular and spectral resolutions of 07 and 1.13 MHz, respectively. A sample of ten high-mass star-forming regions located at the first Galactic quadrant were selected in base on that they present a clear emission of CN at the mentioned frequency.
Results. We found that the CN traces both molecular condensations and diffuse and extended gas surrounding them. In general, the molecular condensations traced by the maximums of the CN emission do not spatially coincide with the peaks of the continuum emission at 1.3 mm, which trace the molecular cores where the massive stars born. Based on the presence or lack of near-IR emission associated with such cores, we suggest that our sample is composed by sources at different stages of evolution. The CN is present at both, suggesting that this radical may be ubiquitous along the different star formation stages, and hence it may be involved in different chemical reactions occurring along the time in the formation of the stars. Additionally, other molecules such as CH3OCHO and CH2CHCN were detected towards the continuum peaks of some of the analyzed cores. We found that the missing flux coming from extended spatial-scales that are filtered out by the interferometer is an important issue to take into account in the analysis of some spectral features and the spatial distribution of the emission.
Key Words.:
Stars: formation — Stars: protostars — ISM: molecules1 Introduction
Chemical studies towards protostars are important because they provide an useful tool for investigating the physical processes involved in the formation of massive and low-mass stars (see Gerner et al. 2014 and Jørgensen et al. 2004, respectively). In particular, the evolution of the high-mass star-forming regions is accompanied by an increasing in the chemical complexity in the molecular environment (e.g. Tan et al. 2014; van Dishoeck & Blake 1998). Thus, high-mass star-forming regions are a very suitable laboratory to study astrochemistry, and particularly, the formation of complex molecules (Coletta et al. 2020).
The cyano radical (CN), one of the first detected interstellar molecular species (Adams 1941; McKellar 1940), is a key molecule in many astrochemical chains. For instance, it is related to the chemistry of HCN and HNC, which are ubiquitous species in different interstellar environments (Loison et al. 2014). Given that CN is very reactive with molecules possessing C=C double and CC triple bonds, it is involved in the formation of cyanopolyynes (Gans et al. 2017), molecules observed in high-mass star-forming regions and hot cores, and proposed as ‘chemical clocks’ in determining the age of this kind of sources (Taniguchi et al. 2018; Chapman et al. 2009).
From interferometric observations, the CN emission has been used to study protoplaneatry disks (Artur de la Villarmois et al. 2019; van Terwisga et al. 2019; Öberg et al. 2011) and some hot molecular cores (Qiu et al. 2012; Zapata et al. 2008). Beuther et al. (2004), based on the investigation towards two massive star-forming regions, pointed out that CN does not trace the central molecular condensations, but mainly gas in their near vicinity. They suggested that CN appears not well suited for disk studies in massive protostars as in the case of the low-mass stars, and thus, they recommended the use of different molecules. Additionally, it was proposed that CN probes material in the boundary between the bulk protostellar envelope and its outflow cavity (Jørgensen et al. 2004). Besides some of the mentioned works, in the literature there are not abundant works regarding the detection of CN towards massive protostars or high-mass star-forming regions using interferometric observations. Han et al. (2015) presented a study of CN, HCN and HNC towards 38 high-mass star-forming regions, which included high-mass starless cores (HMSC), high-mass protostellar objects (HMPO), and HII regions, but using single-dish observations. Hence, we point out that it is necessary studying the CN emission with high-angular resolution towards a sample of massive protostars with the aim of unveiling the spatial distribution at the small scale of the emission of this molecular species in relation to the star-forming processes. The Atacama Large Millimeter Array (ALMA) database offers the opportunity to perform that.
According to the NIST database111https://dx.doi.org/10.18434/T4JP4Q, the interstellar CN has a strong emission line at the rest frequency 226874.764 MHz, corresponding to the N2–1 J5/2–3/2 F7/2–5/2 transition, which can be blended with the F5/2–3/2 and F3/2–1/2 lines (at 226874.183 and 226875.896 MHz, respectively). Thus, we search for observing projects in the ALMA database regarding high-mass star-forming regions observed at Band 6. In the following section we describe the data used in this work and the source selection.
2 Data and source selection
Data were obtained from the ALMA Science Archive222http://almascience.eso.org/aq/. We used data from the project entitled ‘Tracing the evolution of massive protostars’ (Code: 2015.1.01312.S, PI: G. Fuller), that was observed in the ALMA Cycle 3 in configurations C36-2 and C36-3 in the 12 m array, at Band 6. We used the calibrated data which passed the second level of Quality Assurance (QA2). The theoretical maximum recoverable scale is about 6 arcsec. The angular resolution of this data set is about 07, with a beam almost circular of 0608 (PA=829), and the spectral resolution is 1.13 MHz. The Common Astronomy Software Applications (CASA) was used to handle and analyse the data. The task imcontsub was used to subtract the continuum from the spectral lines and a first order polynomial was used. The 1 rms noise level is about 1.5 mJy beam-1 for both the continuum and the line emission.
It is important to remark that even though the data passed the QA2 quality level, which assures a reliable calibration for a “science ready” data, the automatic pipeline imaging process may give raise to a clean image with some problems/artefacts. For example, an inappropriate setting of the parameters of the clean task in CASA could generate artificial dips in the spectra. Thus, we reprocessed the raw data set of sources whose spectra exhibit conspicuous dips in, or close to, the main component of the CN emission to check whether the imaging process is responsible of such spectral features. Particular care was taken with the clean task. The images obtained from our data reprocessing are very similar to those obtained from the archival, and hence we conclude that such absorption features are not due to the clean.
The ALMA programme 2015.1.01312.S observed several young high-mass embedded sources based on previous surveys of the Galactic plane that have identified large populations of candidate young massive protostars. From these sources, we selected a sample that have been observed in the spectral window in which the above mentioned CN line lies. Additionally, we selected sources whose spectra present conspicuous lines that allow us to properly identify the CN emission. The sources, with their velocities, distances, and the spatial resolution of the data in each case are presented in Table 1. The velocity and distance were obtained from Wienen et al. (2012), who observed ammonia towards cold high-mass clumps in the inner Galactic disk. Given that G23.389 and G34.821 are not included in the Wienen et al.’s survey, the corresponding velocity and distance were obtained from Maud et al. (2015) and Navarete et al. (2019), respectively.
Additionally, we used near-IR data at the Ks-band obtained from the the UKIRT InfraRed Deep Sky Surveys (UKIDSS)333http://wsa.roe.ac.uk/index.html, release DR11, and IRAC-Spitzer data obtained from the Galactic Legacy Infrared Mid-Plane Survey Extraordinaire444https://irsa.ipac.caltech.edu/data/SPITZER/GLIMPSE/.
| Source | RA | Dec. | vLSR | Distance | Resol. |
|---|---|---|---|---|---|
| (J2000) | (J2000) | (km s-1) | (kpc) | (pc) | |
| G13.656 | 18:17:24.2 | 17:22:12.6 | 47.0 | 4.1 | 0.014 |
| G18.825 | 18:26:58.8 | 12:44:43.9 | 62.9 | 4.3 | 0.014 |
| G20.747 | 18:29:16.3 | 10:52:10.7 | 59.0 | 3.9 | 0.013 |
| G20.762 | 18:29:12.1 | 10:50:34.8 | 57.0 | 3.9 | 0.013 |
| G23.389 | 18:33:14.3 | 08:23:57.6 | 75.4 | 4.5 | 0.015 |
| G24.464 | 18:35:11.2 | 07:26:31.7 | 119.0 | 6.2 | 0.021 |
| G29.862 | 18:45:59.5 | 02:45:06.8 | 100.0 | 5.6 | 0.019 |
| G30.198 | 18:47:03.0 | 03:30:35.9 | 105.9 | 5.9 | 0.020 |
| G33.133 | 18:52:08:1 | 00:08:12.9 | 76.0 | 4.5 | 0.015 |
| G34.821 | 18:53:37.9 | 01:50:28.7 | 56.5 | 1.6 | 0.005 |
3 Results
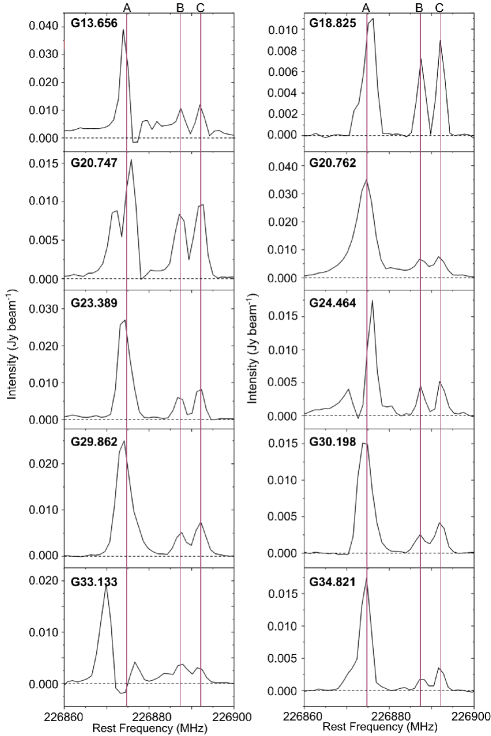
To identify CN lines, from the data cubes we extracted spectra of the averaged emission obtained from regions of about 5′′ in radius centered in each source. They are presented in Fig. 1. The frequency was converted to rest frequency using the velocities listed in Table 1, and it is displayed the frequency range 226860–226900 MHz, in which according to the NIST database, only appears lines of CN, except for one weak line of CH3OCHO at 226862.239 MHz. The strongest emission in all cases correspond to the CN N2–1 J5/2–3/2 F7/2–5/2 transition, which as mentioned above, it may be blended with the weaker F5/2–3/2 and F3/2–1/2 lines, but the spectral resolution of the data do not allow us to resolve them properly. Additionally, the CN lines N2–1 J5/2–3/2, F3/2–3/2 and F1/2–1/2 at 226887.399 and 226892.151 MHz, respectively, appear clearly in all spectra. In some cases (see spectra of sources G13.656, G20.747, G24.464, and G33.133), the main component presents probably absorption or self-absorption features. This will be specially discussed below.
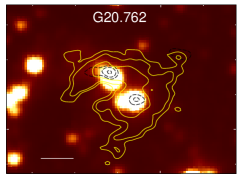
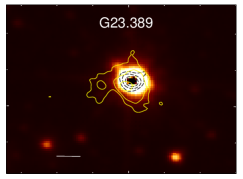
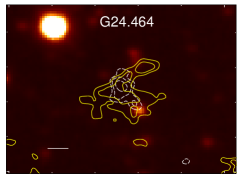
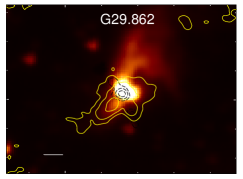
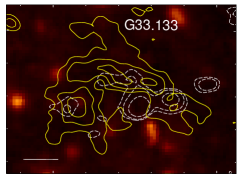
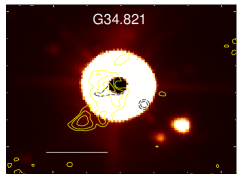
To appreciate the spatial distribution of the CN emission, we present in Fig. 2 maps of the CN emission averaged along the frequency interval of the main component. Additionally, the continuum emission at 1.3 mm is displayed in contours. Source G18.825 does not present continuum emission above the noise level. Given that we are presenting here the spectrum of the millimeter emission of source G29.862, we point out that in a previous work, in which we performed a detailed multiwavelength study of this source (see Areal et al. 2020), the CN line was misinterpreted as CH3OCHO (erratum in preparation).
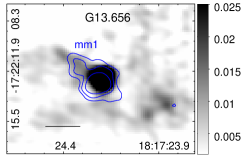
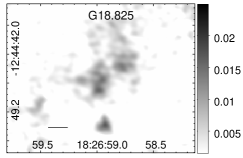
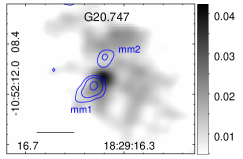
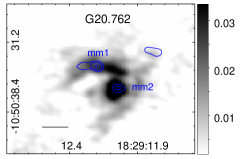
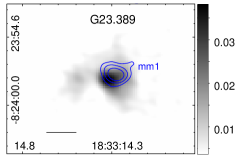
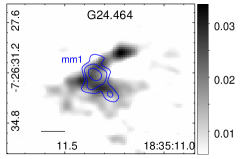

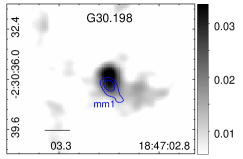
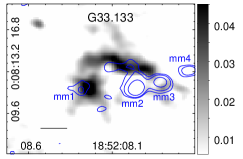
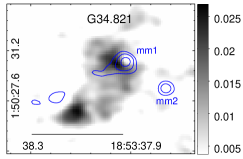
Table 2 presents the parameters of the cores observed at 1.3 mm obtained from a two dimensional Gaussian fitting. The peak intensity and the integrated flux density corrected for primary beam response are presented in Cols. 2 and 3, the source size in arcsec deconvolved from beam is presented in Col. 4, and in Col. 5, a rough estimate of the core size in astronomical units considering the average between the size of the semi-axes presented in Col. 4 and the distances listed in Table 1. The source of the errors in the size is mainly the uncertainties in the distances, and it can be about 20.
| Core | Size | |||
|---|---|---|---|---|
| (mJy beam-1) | (mJy) | (′′) | au | |
| G13.656-mm1 | 114.05.7 | 22416 | 0.820.64 | 3000 |
| G20.747-mm1 | 22.21.4 | 69.65.8 | 1.480.73 | 4100 |
| G20.747-mm2 | 10.41.0 | 25.53.4 | 1.270.48 | 3400 |
| G20.762-mm1 | 17.12.2 | 43.97.8 | 1.870.28 | 4200 |
| G20.762-mm2 | 11.51.0 | 18.72.6 | 0.870.36 | 2400 |
| G23.389-mm1 | 44.42.1 | 91.56.0 | 0.910.68 | 3500 |
| G24.464-mm1 | 24.92.4 | 11213 | 1.631.04 | 8300 |
| G29.862-mm1 | 26.21.9 | 51.65.3 | 0.770.66 | 4000 |
| G29.862-mm2 | 10.01.1 | 30.44.4 | 0.800.39 | 3300 |
| G30.198-mm1 | 12.61.5 | 40.26.1 | 1.600.62 | 6500 |
| G33.133-mm1 | 11.41.6 | 30.35.8 | 1.150.72 | 4200 |
| G33.133-mm2 | 102.44.9 | 20714 | 0.850.56 | 3100 |
| G33.133-mm3 | 67.82.9 | 113.17.1 | 0.720.47 | 2600 |
| G33.133-mm4 | 22.21.2 | 35.63.0 | 0.850.28 | 2500 |
| G34.821-mm1 | 24.72.4 | 64.08.4 | 1.030.81 | 1500 |
| G34.821-mm2 | 16.10.4 | 21.70.8 | 0.490.32 | 650 |
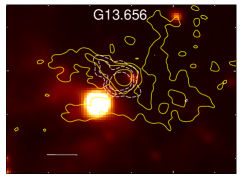
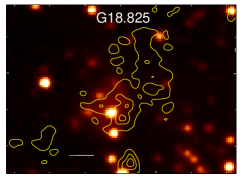
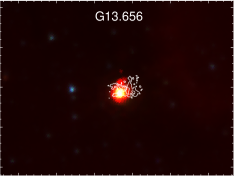
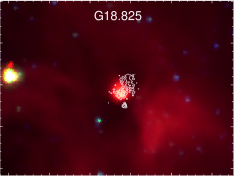
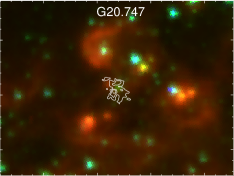
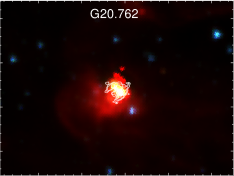
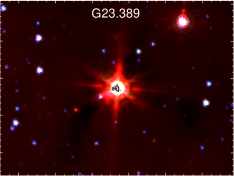
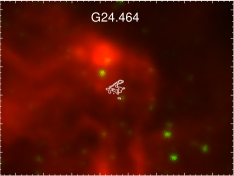
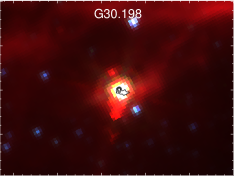
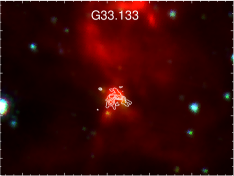
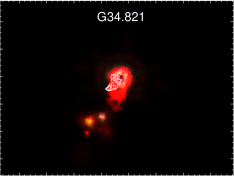
The near-IR emission usually is useful to identify the central point-like sources of the young stellar objects (YSOs) and traces diffuse emission arising mainly from warm dust and scattered light in the material surrounding the protostar(s), particularly in cavities carved out by jets on an infalling envelope of material (e.g. Muzerolle et al. 2013; Bik et al. 2006, 2005). Even though the near-IR observations can sometimes miss deeply embedded protostars, the lack of near-IR emission or a point-like source at this wavelength in a molecular core can indicate that it is an starless core, which represents the transition between a diffuse molecular cloud and the next generation of stars to form therein (Schnee et al. 2012). Thus, it is interesting to analyze the Ks-band emission in comparison with the ALMA data with the aim of finding any connection relating the extended CN and near-IR emissions, and near-IR point-like sources with the 1.3 mm continuum cores. This comparison is presented in Fig. 3 for each source. Additionally, in order to make a similar comparison, but in a larger spatial scale, in Fig. 4 we present similar panels as presented in Fig. 3 but using the 3.6, 4.5, and 8 m emission observed with Spitzer-IRAC. While in some cases the emission is saturated, this is still useful to analyze the sources and the surrounding medium.


4 Discussion
A first important result is that by analyzing the spatial morphology of the CN emission at each source (see Fig. 2), we can conclude that the CN traces both molecular condensations and diffuse and extended gas surrounding them. It is worth noting that, in general, these condensations traced by the maximums of the CN emission do not spatially coincide with the peaks of the continuum emission at 1.3 mm, that may have contributions from both ionized gas emission and from the dust (Hernández-Hernández et al. 2014) usually associated with the smallest structures related to star formation. This phenomenon was also observed towards IRAS 20293+3952 by Beuther et al. (2004) using interferometric data of the CN N=1–0 line with a similar angular resolution as the data presented in this work. The authors found that the CN emission avoids the core peaks traced by the millimeter continuum emission, and based on that optical depth effects appear to be negligible, they suggest two likely main causes for the lack of CN emission towards the cores: (1) the source is too deeply embedded to excite the surface layers of the potential disk, and (2) the source is in such an early evolutionary stage that it does not generate enough UV photons to produce CN emission. Taking into account that some spectra presented in Fig. 1 show probably absorption or self-absorption features, and considering the works of Qiu et al. (2012) and Zapata et al. (2008) in which the CN emission presents kinematical indications of infalling envelopes of gas, we point out that the non coincidence between the CN bulk emission and the cores traced by the continuum deserves a deeper analysis (see Sect. 4.1).
From Fig. 3, it can be observed that in five sources (G20.762, G23.389, G29.862, G30.198, and G34.821) the continuum at 1.3 mm coincides with a point-like source (or almost point-like) at the near-IR, while in the others sources, there is not any near-IR emission associated with the 1.3 mm continuum. This suggests that our core sample is likely composed by regions at different stages of evolution in star formation: YSOs already emitting at the near-IR, and the ‘IR quiet’ sources representing YSOs in an earlier stage of evolution, or even, starless cores (e.g. Motte et al. 2018; Schnee et al. 2012).
The difference in the evolutionary stages of the sources can be also appreciated in Fig. 4. The IR emission obtained from Spitzer-IRAC shows that the above mention more evolved sources present point-like morphologies in these bands. Moreover, the excess in 8 m suggests photodissociated gas due ultraviolet photons from young stars. In the case of G13.656 it is important to note that, as also shown in Fig. 3, there is a point-like source in the field not related to the CN emission and the 1.3 mm continuum source.
It is important to remark that in all cases, extended CN emission appears. In the cases that we observe a point-like source at near-IR related to the 1.3 mm continuum, the related CN should be tracing gas in the near vicinity of the protostar as proposed by Beuther et al. (2004) and Jørgensen et al. (2004), and in the case of the ‘IR quiet’ sources, the CN emission may arise from a molecular core in a pre-stellar phase. Indeed, it can be observed that in regions with near-IR point-like sources associated with the 1.3 mm continuum, the morphology of the CN emission appears, in general, more localized than in the ‘IR quite’ sources. Whatever, we conclude that the presence of CN may be ubiquitous along the different star formation stages.
4.1 Analysis of sources with spectral absorption features
The spectra obtained towards sources G13.656, G20.747, G24.464, and G33.133 present some absorption features (see Fig. 2), and hence we decided to analyze them in more detail. Firstly, we note that these sources are those that their continuum cores are not associated with near-IR sources (see Fig. 3) suggesting that, as mention above, they can be cores in a pre-stellar phase. In that sense, the absorption features could be due to high optical depth effects. The cores with IR sources may have lower densities than the ‘IR quiet’ cores because outflow activity could have generated cavities in the molecular envelopes (Wheelwright et al. 2012), and the high optical depth effects affecting the CN emission, if there are any, are not so evident.
In addition, the spectra may present absorption features like regular or inverse P-cygni profiles, indicating expanding gas or that a gaseous envelope is falling into an accreting object as observed in CN transitions by Qiu et al. (2012) and Zapata et al. (2008). If the absorption features appear repeatedly along the observed frequency/velocity range, also it could be occurring absorption in the diffuse gas along the line of sight against a continuum source. Godard et al. (2010) studied this phenomenon towards star-forming regions using lines of HCO+, HCN, HNC, and CN from single dish observations.
As mention in Sect. 2, we discarded that such absorption features are due to the imaging process. However, it is important to take into account that they also could be due to instrumental effects. The interferometric emission not combined with single dish data can be affected by the missing flux coming from more extended spatial-scales that are filtered out by the interferometer that can not be recovered even with the most accurate imaging process. This issue can produce not only missing flux but also such absorption features (e.g. Rodón et al. 2012; Beuther et al. 2004). Hence, it is necessary to analyze this possibility, or at least to take it into account, before to conclude anything about the nature of the observed spectral absorptions. Thus, for each of the mentioned sources, we analyze the spectra at the positions of the continuum cores.
4.1.1 At core G13.656-mm1
Figure 5 shows the spectrum obtained from a circle of 15 in radius at the position of G13.656-mm1. It can be observed a very complex spectrum in which a quite deep and narrow absorption feature related to CN appears at 226877 MHz. Additionally, it can be observed emission lines of CH3OCHO (transitions 20(1,19)–19(1,18)E and A), and according to the NIST database, CH2CHCN (transition 24(2,23)–23(2,22)), which are complex molecules usually detected towards hot molecular cores and pre-stellar cores (Jiménez-Serra et al. 2016; Herbst & van Dishoeck 2009; Friedel & Snyder 2008). The CH2CHCN is a complex cyanide whose observation and analysis, among other cyanides, can be used as a chemical clock of hot cores (Allen et al. 2018). Particularly, the CN is important for the formation of this molecular species, because it results from the reaction between CN and ethylene (Agúndez et al. 2008; Herbst & Leung 1990).

Even though the absorption feature at 226877 MHZ is narrow, it could be interpreted as a P-cygni profile suggesting expanding gas in this molecular core. However, we cannot discard that it could be due to the instrumental effect discussed above.
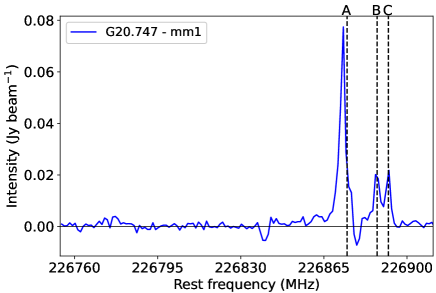
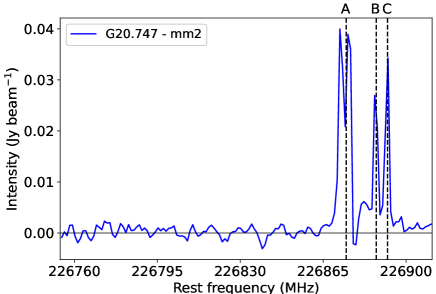
4.1.2 At cores G20.747-mm1/2
Figure 6 displays the spectra obtained towards cores G20.747-mm1 and -mm2 from a circle of 12 in radius. In both spectra, an absorption feature related to the CN main component appears at 226877 MHz suggesting a P-cygni profile, and in the case of core G20.742-mm2, the CN main component has a dip at about 226873 MHz, which could be explained as a self-absorption suggesting that the emission is optically thick. As in the above case, we cannot discard that the P-cygni like feature is due to the mentioned instrumental effect. But the dip at the CN main component coincides exactly with the systemic velocity of the source, suggesting that it could be due to a high optical depth.
The profile of G20.747-mm1 presents an small absorption at 226838 MHz, which does not appear in others regions, showing that it is not due to an instrumental effect and it should be real. The frequency of this absorption is close to the that of the CH2CHCN transition mentioned in the case of core G13.656-mm1, and hence, we wonder if it may be due to absorption in a molecular envelope containing this molecular species against the bright continuum.
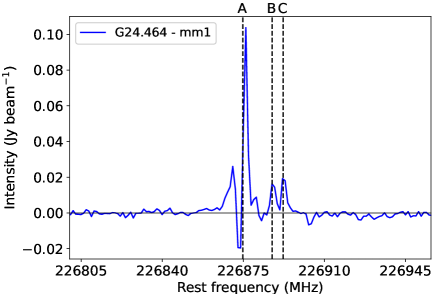
4.1.3 At core G24.464-mm1
The spectrum obtained from a circle of 13 in radius at the position of core G24.464-mm1 is presented in Fig. 7. It presents a conspicuous absorption dip at 226874 MHz, very close to the systemic velocity of the source, suggesting that it could be due to high optical depths, but missing flux coming from more extended spatial-scales filtered out by the interferometer cannot be discarded.
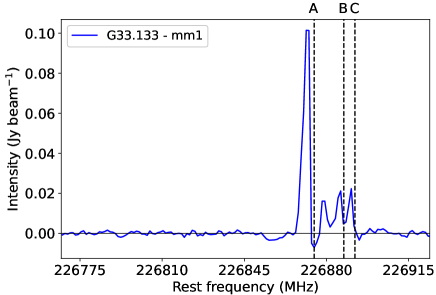
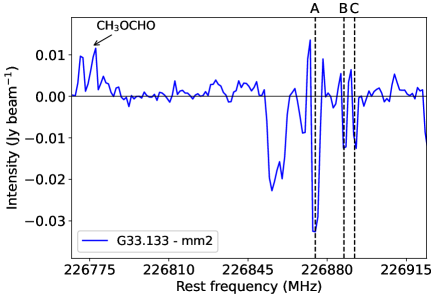
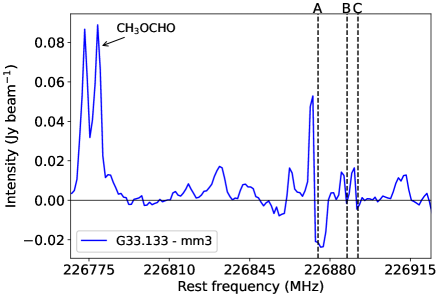
4.1.4 At cores G33.133-mm1/2/3
Spectra obtained from a circle of 1′′ in radius towards cores G33.133-mm1, -mm2, and -mm3 are displayed in Fig. 8. All the spectra present absorption at the main CN line. In the cases of G133.133-mm2 and -mm3 it could be due to absorption in a molecular envelope against the bright continuum. Again, missing flux produced in the interferometric observation cannot be discarded in any of these three cores. Emission of CH3OCHO is evident in G33.133-mm2 and -mm3. From the spectra obtained towards these cores, we can say that it is clear that the non-coincidence between CN maximums and the continuum cores can be due to a combination of physical absorption with the described instrumental issue.
The spectrum of G33.133-mm2 presents a conspicuous absorption at 226856 MHz, which also appears in the spectrum of G33.133-mm1. This absorption does not seem to be produced by instrumental effects. It should be real, and we wonder the same possibility as in the case of the absorption found in G20.747-mm1.
In conclusion, in most of the analyzed absorption features cannot be discarded that they are produced, totally, or in part, by the missing flux coming from more extended spatial-scales that are filtered out by the interferometer. In the case of the other sources, i.e. the sources that does not present any absorption feature in the spectra shown in Fig. 1, we inspect the emission at the position of the associated 1.3 mm continuum cores, and they do not present any important absorption feature. It is possible that as these sources could be more evolved, given that they present near-IR point-like sources, the surrounding molecular envelopes at the more extended spatial-scales can be more diluted/evacuated due to the action of winds and outflows, and hence, the mentioned instrumental effect and/or the probable optical depth effects are not so notorious.
Finally, we found that in cores with the largest integrated flux density at 1.3 mm continuum emission (cores G13.656-mm1, G24.464-mm1, and G33.133-mm2) the deepest absorption features in the whole field of view related to the CN emission positionally coincides with the peaks of the continuum emission. This suggests that high optical depth effects can be combined with the discussed instrumental issue.
5 Summary and concluding remarks
Given that the CN radical is very reactive with molecules possessing C=C double and CC triple bonds, it is involved in the formation of complex molecules in dark clouds, and in particular, in those related to star-forming processes. Hence, the study of its emission at small spatial scales towards massive protostars is important. Using high-angular resolution data we investigate the CN emission in a sample of ten massive young stellar objects located at the first Galactic quadrant, and the main results found are summarized as follows.
(a) All analyzed sources present emission of CN in the transitions N2–1 J5/2–3/2 F7/2–5/2, F3/2–3/2 and F1/2–1/2. We observe that the CN traces both molecular condensations and diffuse and extended gas surrounding them.
(b) In general, the molecular condensations traced by the maximums of the CN emission do not spatially coincide with the peaks of the continuum emission at 1.3 mm as found in other works.
(c) Our sample of sources are divided in those that present near-IR emission associated with the continuum at 1.3 mm, and those that are ‘IR quiet’ sources, suggesting that they are protostellar objects at different stages of evolution. The CN is present at both, suggesting that this radical may be ubiquitous along the different star formation stages, and hence it may be involved in different chemical reactions occurring along the time in the formation of the stars. For instance, the CN participates in the formation of vinyl cyanide (CH2CHCN), molecule detected in core G13.656-mm1.
Finally, it is worth noting that a molecular line emission analysis at such small spatial scales can be affected by the missing flux coming from more extended spatial-scales that are filtered out by the interferometer. This is an important issue because it can introduce artificial absorption features in the spectra that can be misinterpreted. We found that ‘IR-quite’ sources are in general more affected by this issue, and we suggest that in the more evolved sources, the surrounding molecular envelopes at the more extended spatial-scales can be more diluted/evacuated due to the action of winds and outflows, and hence, this effect is not so notorious. We cannot discard high optical depth effects combined with missing flux. Interferometric observations of the analyzed CN line in a more compact configuration would be useful to properly evaluate this issue.
Acknowledgements.
We thank the anonymous referee for her/his very useful comments. A.M. and M.B.A. are doctoral fellows of CONICET, Argentina. S.P. and M.O. are members of the Carrera del Investigador Científico of CONICET, Argentina. This work is based on the following ALMA data: 2015.1.01312.S. ALMA is a partnership of ESO (representing its member states), NSF (USA) and NINS (Japan), together with NRC (Canada), MOST and ASIAA (Taiwan), and KASI (Republic of Korea), in cooperation with the Republic of Chile. The Joint ALMA Observatory is operated by ESO, AUI/NRAO and NAOJ.References
- Adams (1941) Adams, W. S. 1941, ApJ, 93, 11
- Agúndez et al. (2008) Agúndez, M., Fonfría, J. P., Cernicharo, J., Pardo, J. R., & Guélin, M. 2008, A&A, 479, 493
- Allen et al. (2018) Allen, V., van der Tak, F. F. S., & Walsh, C. 2018, A&A, 616, A67
- Areal et al. (2020) Areal, M. B., Paron, S., Fariña, C., et al. 2020, A&A, 641, A104
- Artur de la Villarmois et al. (2019) Artur de la Villarmois, E., Kristensen, L. E., & Jørgensen, J. K. 2019, A&A, 627, A37
- Beuther et al. (2004) Beuther, H., Schilke, P., & Wyrowski, F. 2004, ApJ, 615, 832
- Bik et al. (2005) Bik, A., Kaper, L., Hanson, M. M., & Smits, M. 2005, A&A, 440, 121
- Bik et al. (2006) Bik, A., Kaper, L., & Waters, L. B. F. M. 2006, A&A, 455, 561
- Chapman et al. (2009) Chapman, J. F., Millar, T. J., Wardle, M., Burton, M. G., & Walsh, A. J. 2009, MNRAS, 394, 221
- Coletta et al. (2020) Coletta, A., Fontani, F., Rivilla, V. M., et al. 2020, A&A, 641, A54
- Friedel & Snyder (2008) Friedel, D. N. & Snyder, L. E. 2008, ApJ, 672, 962
- Gans et al. (2017) Gans, B., Boyé-Péronne, S., Garcia, G. A., et al. 2017, The Journal of Physical Chemistry Letters, 8, 4038, pMID: 28796511
- Gerner et al. (2014) Gerner, T., Beuther, H., Semenov, D., et al. 2014, A&A, 563, A97
- Godard et al. (2010) Godard, B., Falgarone, E., Gerin, M., Hily-Blant, P., & de Luca, M. 2010, A&A, 520, A20
- Han et al. (2015) Han, X. H., Zhou, J. J., Wang, J. Z., et al. 2015, A&A, 576, A131
- Herbst & Leung (1990) Herbst, E. & Leung, C. M. 1990, A&A, 233, 177
- Herbst & van Dishoeck (2009) Herbst, E. & van Dishoeck, E. F. 2009, ARA&A, 47, 427
- Hernández-Hernández et al. (2014) Hernández-Hernández, V., Zapata, L., Kurtz, S., & Garay, G. 2014, ApJ, 786, 38
- Jiménez-Serra et al. (2016) Jiménez-Serra, I., Vasyunin, A. I., Caselli, P., et al. 2016, ApJ, 830, L6
- Jørgensen et al. (2004) Jørgensen, J. K., Schöier, F. L., & van Dishoeck, E. F. 2004, A&A, 416, 603
- Loison et al. (2014) Loison, J.-C., Wakelam, V., & Hickson, K. M. 2014, MNRAS, 443, 398
- Maud et al. (2015) Maud, L. T., Lumsden, S. L., Moore, T. J. T., et al. 2015, MNRAS, 452, 637
- McKellar (1940) McKellar, A. 1940, PASP, 52, 187
- Motte et al. (2018) Motte, F., Bontemps, S., & Louvet, F. 2018, ARA&A, 56, 41
- Muzerolle et al. (2013) Muzerolle, J., Furlan, E., Flaherty, K., Balog, Z., & Gutermuth, R. 2013, Nature, 493, 378
- Navarete et al. (2019) Navarete, F., Leurini, S., Giannetti, A., et al. 2019, A&A, 622, A135
- Öberg et al. (2011) Öberg, K. I., Qi, C., Fogel, J. K. J., et al. 2011, ApJ, 734, 98
- Qiu et al. (2012) Qiu, K., Zhang, Q., Beuther, H., & Fallscheer, C. 2012, ApJ, 756, 170
- Rodón et al. (2012) Rodón, J. A., Beuther, H., & Schilke, P. 2012, A&A, 545, A51
- Schnee et al. (2012) Schnee, S., Di Francesco, J., Enoch, M., et al. 2012, ApJ, 745, 18
- Tan et al. (2014) Tan, J. C., Beltrán, M. T., Caselli, P., et al. 2014, in Protostars and Planets VI, ed. H. Beuther, R. S. Klessen, C. P. Dullemond, & T. Henning, 149
- Taniguchi et al. (2018) Taniguchi, K., Miyamoto, Y., Saito, M., et al. 2018, ApJ, 866, 32
- van Dishoeck & Blake (1998) van Dishoeck, E. F. & Blake, G. A. 1998, ARA&A, 36, 317
- van Terwisga et al. (2019) van Terwisga, S. E., van Dishoeck, E. F., Cazzoletti, P., et al. 2019, A&A, 623, A150
- Wheelwright et al. (2012) Wheelwright, H. E., de Wit, W. J., Oudmaijer, R. D., et al. 2012, A&A, 540, A89
- Wienen et al. (2012) Wienen, M., Wyrowski, F., Schuller, F., et al. 2012, A&A, 544, A146
- Zapata et al. (2008) Zapata, L. A., Palau, A., Ho, P. T. P., et al. 2008, A&A, 479, L25