Current affiliation: ]Nippon Steel Corporation, Steel Research Laboratories.
Reduced magnetocrystalline anisotropy of thin films studied by angle-dependent x-ray magnetic circular dichroism
Abstract
Spinel-type is a ferrimagnetic insulator with the Néel temperature exceeding 790 K, and shows a strong cubic magnetocrystalline anisotropy (MCA) in bulk materials. However, when a film is grown on other materials, its magnetic properties are degraded so that so-called magnetically dead layers are expected to be formed in the interfacial region. We investigate how the magnetic anisotropy of is modified at the interface of / bilayers grown on Si(111) using x-ray magnetic circular dichroism (XMCD). We find that the thinner films have significantly smaller MCA values than bulk materials. The reduction of MCA is explained by the reduced number of Co2+ ions at the site reported by a previous study [Y. K. Wakabayashi et al., Phys. Rev. B 96, 104410 (2017)].
pacs:
71.30.+h, 75.25.Dk, 75.47.Lx, 78.70.Dm, 78.20.LsI Introduction
Spinel-type cobalt ferrite is a classical ferrimagnetic insulator having the Néel temperature exceeding 790 K and exhibits a strong cubic magnetocrystalline anisotropy (MCA). The cubic MCA has been successfully explained by the single-ion anisotropy of the Co2+ ions at the inequivalent sites Tachiki (1960). Recently, heterostructures incorporating thin layers have attracted much attention as spintronics devices Moussy (2013) because of the spin-dependent band gap Szotek et al. (2006) and high Néel temperature of Sawatzky et al. (1968). For example, a -based tunnel barrier acts as a spin filter because electrons have spin-dependent tunneling probabilities Chapline and Wang (2006). However, the experimentally obtained spin-filtering efficiency of -based tunnel barriers still remains lower than theoretical values of Matzen et al. (2012); Moodera et al. (2007); Moussy (2013). As a possible cause of the low spin-filtering efficiency, it has been proposed that structural and/or chemical disorder lead to the formation of impurity states in the spin-dependent gap Ramos et al. (2007); Takahashi et al. (2010); Szotek et al. (2006). In order to improve the spin filtering efficiency, it is thus essential to understand the electronic and magnetic phenomena at the interfaces.
In a recent work Wakabayashi et al. (2017), the magnetic properties of (111)/(111)/Si(111) structures Bachelet et al. (2014) were studied using the element-specific probe of x-ray absorption spectroscopy (XAS) and x-ray magnetic circular dichroism (XMCD). A schematic illustration of the stacking structure of the sample and an example of cross sectional transmission-electron-microscope (TEM) image are shown in Fig. 1(a).
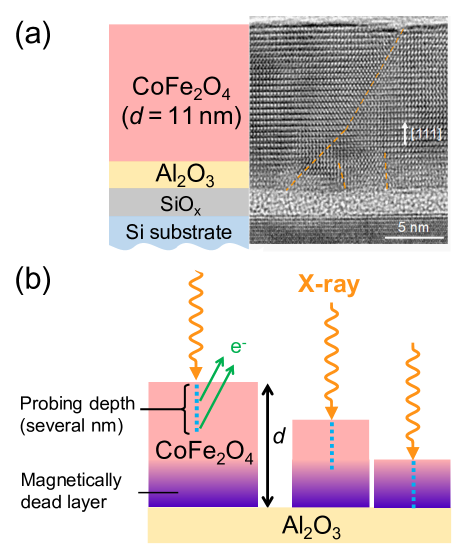
Because they employed the total-electron yield (TEY) method to detect the absorption signals, several nanometers from the surface were preferentially probed Thole et al. (1985); Frazer et al. (2003). By reducing the film thicknesses below the probing depth of a few nm, they obtained XAS and XMCD spectra reflecting the magnetically dead layers of 1.4 nm thickness and the cation redistribution near the / interface as illustrated in Fig. 1(b). They revealed a high density of Co-Fe antisite defects and the reduced concentration of the Co2+ ions at the sites in the magnetically dead layers. Since the Co2+ ions at the sites are considered to be the origin of the cubic MCA in bulk , a significant modification of the magnetic anisotropy is expected in the interfacial region. In the present study, we investigate how the strong cubic MCA of is affected at the / interface by angle-dependent XMCD that is a powerful local probe to study element-specific magnetic anisotropies Shibata et al. (2018); Sakamoto et al. (2021). The surface-sensitive XMCD method allowed us to investigate the magnetic properties in the interfacial region with high sensitivity. Furthermore, by using XMCD, diamagnetic signals from substrates, which prevent us from the observation of intrinsic paramagnetic signals, can be automatically excluded.
II Experimental Methods
Epitaxial (111) thin films with the thicknesses of d = 1.4, 2.3, 4, and 11 nm were grown on a 2.4 nm-thick -(111) buffer layer/-Si(111) substrate using the pulsed laser deposition method. In order to avoid charging of the samples during the XAS and XMCD measurements, we used heavily phosphorus-doped Si(111) wafers with low resistivities of 2 m cm. For the epitaxial growth of the - buffer layers on the Si substrates, we used solid-phase reaction of Al and . A more detailed description of the sample preparation and characterization is given in Ref. Wakabayashi et al. (2017).
Magnetic field-angle-dependent XAS and XMCD measurements were performed at room temperature using a superconducting vector-magnet XMCD apparatus Furuse et al. (2013) installed at the undulator beamline BL-16A of Photon Factory, High Energy Accelerator Research Organization (KEK-PF). The magnetization of thin film is rotated by the magnetic field . The magnetic field angle and magnetization angle are defined relative to the surface normal. The absorption signals were detected in the TEY mode. The XMCD signals were collected by switching the photon helicity at the rate of 10 Hz Amemiya et al. (2013). In order to eliminate the saturation effect Nakajima et al. (1999), which induces an extrinsic angle dependence to spectral line shapes, we fixed the x-ray incident angle at and applied magnetic fields of 0.7 T to the sample along various directions. The geometry of the present measurements is illustrated in Fig. 2(a).
III Results and Discussion
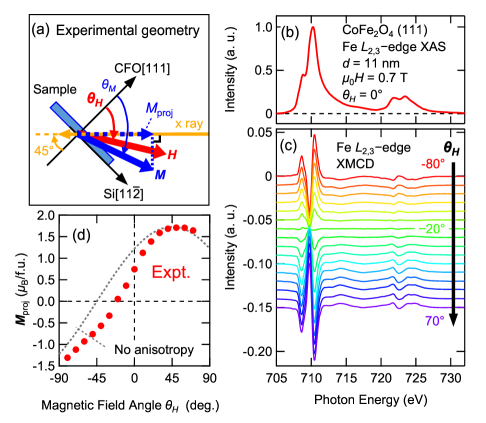
Figures 2(b) and (c) show the Fe -edge XAS () and XMCD () spectra of the 11 nm-thick thin film. Here, () denotes the absorption coefficient for photons with positive (negative) helicity. Since the spectral line shape of XAS did not show any appreciable dependence, only the spectrum at is shown. Figure 2(c) shows that the XMCD spectrum systematically changes with . Since the XMCD intensity is proportional to the magnetic moment projected onto the x-ray incident direction (), its dependence reflects the change of the magnetization direction under varying . Since the total magnetic moment and the Fe -edge XMCD spectra of these samples were already obtained in Ref.Wakabayashi et al. (2017), we deduced from the intensity of Fe -edge XMCD under the assumption that the Fe -edge XMCD intensity is proportional to M. Figure 2(d) shows the dependence of . If this film has neither magnetocrystalline nor magnetic shape anisotropy, M would be fully aligned to the magnetic field direction () and thus should be , as shown by a gray dashed curve. The deviation of the experimental data from thus shows the magnetic anisotropy.
In order to analyze the obtained dependence of , we use the Stoner-Wohlfarth model Stoner and Wohlfarth (1948); Shibata et al. (2018). According to the model, the magnetic energy density E of a thin film is given by:
| (1) |
where is the vacuum permeability, and the other variables are defined in Fig. 2(a). In Eq. (1), E is the sum of the Zeeman energy [] and the magnetic anisotropy energy. The magnetic anisotropy energy consists of two contributions. One is the shape anisotropy (SA) energy, which originates from the demagnetizing field of the film, and the other is the MCA energy, which has a microscopic origin. Note that the Stoner-Wohlfarth model is applicable not only to the ferromagnetic state but also to the paramagnetic state if the actual magnetization M lower than the saturation magnetization is used. Since has a cubic MCA in addition to the uniaxial anisotropy and has crystal domains in the present samples Wakabayashi et al. (2017), the MCA term cannot be fully calculated with the Stoner-Wohlfarth model. Therefore, we have calculated by incorporating only the Zeeman and SA terms in Eq. (1), and attribute the difference between the measured and the calculated to the MCA.
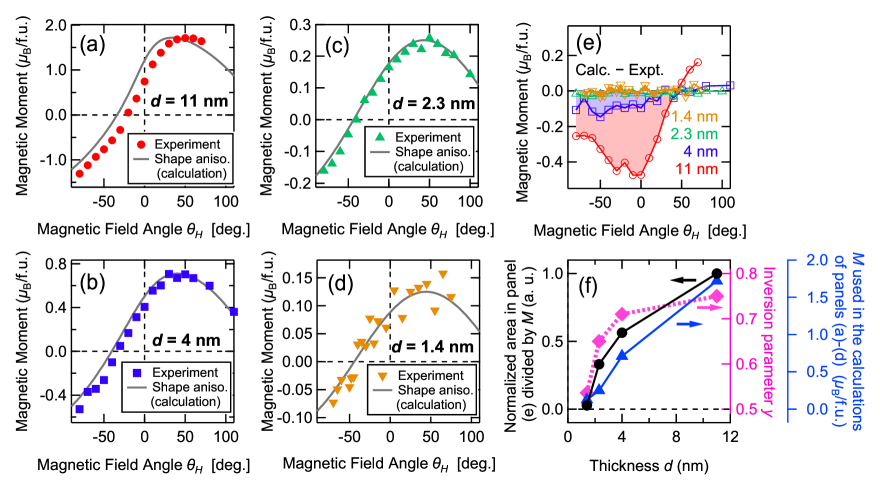
Figures 3(a)–(d) show the measured and calculated for all the samples, where colored dots are measurements and black solid lines are calculations. One can see a clear difference between the calculation and the experiment for the 11 nm-thick film as shown in Fig. 3(a), and the difference decreases with decreasing thickness as shown in Figs. 3(b), 3(c), and 3(d). (The 11 nm-thick film is ferrimagnetic with hysteresis but the magnetic field of 0.7 T was not sufficient to saturate the magnetization. The ferrimagnetic behavior is gradually lost with decreasing thickness and the 1.4 nm-thick film is almost paramagnetic Wakabayashi et al. (2017).) For each film thickness, the difference is the largest at around , as shown in Fig. 3(e),which is consistent with the cubic magnetic anisotropy of bulk with the [111] hard axis Shenker (1957). Considering that the relative contribution of the interface to the XAS and XMCD increases with decreasing film thickness, the present observation indicates a weakening of the MCA of in the interfacial region including the magnetically dead layer. The magnitude of the difference between the calculation and measurement is plotted as a function of thickness d in Fig. 3(f).
Now we discuss the microscopic origin of the reduction of the MCA near the interface. The MCA of bulk is well explained by a single-ion model Tachiki (1960), according to which the exceptionally high single-ion anisotropy of Co governs the MCA. Therefore, the distribution of Co is expected have dominant effects on the MCA. Such modifications of magnetic anisotropy induced by the distribution of Co are also reported for the nanoparticles Daffé et al. (2018); Moya et al. (2021); Fantauzzi et al. (2019). The cation distribution in these films has been studied using XMCD by Wakabayashi et al. Wakabayashi et al. (2017), according to which the inversion parameter y, defined by the chemical formula , suddenly decreases in the nm region as shown in Fig. 3(f). From the comparison of y and the normalized MCA (the magnitude of MCA divided by M) as functions of the film thickness d plotted in Fig. 3(f), one can see that the reduction of MCA with decreasing film thickness qualitatively follows the reduction of y. This result implies that the reduction of the normalized MCA originates from the reduction of the Co ions in the interfacial region.
IV Conclusion
We have investigated the magnetic anisotropy of the epitaxial (111) thin films (thicknesses 11, 4, 2.3, and 1.4 nm) grown on the 2.4 nm-thick -(111) buffer layer/-Si(111) substrates using magnetic field-angle-dependent XAS and XMCD. We have found that the MCA of the interfacial region including the magnetically dead layer is reduced. We attribute the reduction of MCA to the thickness-dependent cation redistribution in the interfacial region, that is, to the abrupt reduction of the Co-ion concentration in the interfacial region.
Acknowledgements.
We would like to thank Kenta Amemiya and Masako Suzuki-Sakamaki for technical support at KEK-PF BL-16. This work was supported by a Grant-in-Aid for Scientific Research from JSPS (15H02109, 26289086, 15K17696, and 19K03741). The experiment was done under the approval of the Photon Factory Program Advisory Committee (Proposal No. 2016S2-005). Y. K. W. and Z. C. acknowledges financial support from Materials Education Program for the Futures leaders in Research, Industry and Technology (MERIT). S. S. and Y. W. acknowledges financial support from Advanced Leading Graduate Course for Photon Science (ALPS). Y. K. W. and S. S. also acknowledge support from the JSPS Research Fellowship Program for Young Scientists. A.F. is an adjunct member of Center for Spintronics Research Network (CSRN), the University of Tokyo, under Spintronics Research Network of Japan (Spin-RNJ).Data Availability Statement
The data that support the findings of this study are available from the corresponding author upon reasonable request.
References
- Tachiki (1960) M. Tachiki, Prog. Theor. Phys. 23, 1055 (1960).
- Moussy (2013) J.-B. Moussy, J. Phys. D. Appl. Phys. 46, 143001 (2013).
- Szotek et al. (2006) Z. Szotek, W. M. Temmerman, D. Ködderitzsch, A. Svane, L. Petit, and H. Winter, Phys. Rev. B 74, 174431 (2006), arXiv:0608168 [cond-mat] .
- Sawatzky et al. (1968) G. A. Sawatzky, F. van der Woude, and A. H. Morrish, J. Appl. Phys. 39, 1204 (1968).
- Chapline and Wang (2006) M. G. Chapline and S. X. Wang, Phys. Rev. B 74, 14418 (2006).
- Matzen et al. (2012) S. Matzen, J. B. Moussy, R. Mattana, K. Bouzehouane, C. Deranlot, and F. Petroff, Appl. Phys. Lett. 101, 042409 (2012).
- Moodera et al. (2007) J. S. Moodera, T. S. Santos, and T. Nagahama, J. Phys.: Condens. Matter 19, 165202 (2007).
- Ramos et al. (2007) A. V. Ramos, M.-J. Guittet, J.-B. Moussy, R. Mattana, C. Deranlot, F. Petroff, and C. Gatel, Appl. Phys. Lett. 91, 122107 (2007), arXiv:0707.3823 .
- Takahashi et al. (2010) Y. K. Takahashi, S. Kasai, T. Furubayashi, S. Mitani, K. Inomata, and K. Hono, Appl. Phys. Lett. 96, 072512 (2010).
- Wakabayashi et al. (2017) Y. K. Wakabayashi, Y. Nonaka, Y. Takeda, S. Sakamoto, K. Ikeda, Z. Chi, G. Shibata, A. Tanaka, Y. Saitoh, H. Yamagami, M. Tanaka, A. Fujimori, and R. Nakane, Phys. Rev. B 96, 104410 (2017).
- Bachelet et al. (2014) R. Bachelet, P. de Coux, B. Warot-Fonrose, V. Skumryev, G. Niu, B. Vilquin, G. Saint-Girons, and F. Sánchez, CrystEngComm 16, 10741 (2014).
- Thole et al. (1985) B. T. Thole, G. van der Laan, J. C. Fuggle, G. A. Sawatzky, R. C. Karnatak, and J.-M. Esteva, Phys. Rev. B 32, 5107 (1985).
- Frazer et al. (2003) B. H. Frazer, B. Gilbert, B. R. Sonderegger, and G. De Stasio, Surf. Sci. 537, 161 (2003).
- Shibata et al. (2018) G. Shibata, M. Kitamura, M. Minohara, K. Yoshimatsu, T. Kadono, K. Ishigami, T. Harano, Y. Takahashi, S. Sakamoto, Y. Nonaka, K. Ikeda, Z. Chi, M. Furuse, S. Fuchino, M. Okano, J.-i. Fujihira, A. Uchida, K. Watanabe, H. Fujihira, S. Fujihira, A. Tanaka, H. Kumigashira, T. Koide, and A. Fujimori, npj Quantum Mater. 3, 3 (2018), arXiv:arXiv:1706.05183v3 .
- Sakamoto et al. (2021) S. Sakamoto, G. Zhao, G. Shibata, Z. Deng, K. Zhao, X. Wang, Y. Nonaka, K. Ikeda, Z. Chi, Y. Wan, M. Suzuki, T. Koide, A. Tanaka, S. Maekawa, Y. J. Uemura, C. Jin, and A. Fujimori, ACS Appl. Electron. Mater. 3, 789 (2021).
- Furuse et al. (2013) M. Furuse, M. Okano, S. Fuchino, A. Uchida, J. Fujihira, and S. Fujihira, IEEE Trans. Appl. Supercond. 23, 4100704 (2013).
- Amemiya et al. (2013) K. Amemiya, M. Sakamaki, T. Koide, K. Ito, K. Tsuchiya, K. Harada, T. Aoto, T. Shioya, T. Obina, S. Yamamoto, and Y. Kobayashi, J. Phys. Conf. Ser. 425, 152015 (2013).
- Nakajima et al. (1999) R. Nakajima, J. Stöhr, and Y. Idzerda, Phys. Rev. B 59, 6421 (1999).
- Stoner and Wohlfarth (1948) E. C. Stoner and E. P. Wohlfarth, Philos. Trans. R. Soc. London. Ser. A 240, 599 (1948).
- Shenker (1957) H. Shenker, Phys. Rev. 107, 1246 (1957).
- Daffé et al. (2018) N. Daffé, F. Choueikani, S. Neveu, M.-A. Arrio, A. Juhin, P. Ohresser, V. Dupuis, and P. Sainctavit, J. Magn. Magn. Mater. 460, 243 (2018).
- Moya et al. (2021) C. Moya, A. Fraile Rodríguez, M. Escoda-Torroella, M. García del Muro, S. R. V. Avula, C. Piamonteze, X. Batlle, and A. Labarta, J. Phys. Chem. C 125, 691 (2021).
- Fantauzzi et al. (2019) M. Fantauzzi, F. Secci, M. Sanna Angotzi, C. Passiu, C. Cannas, and A. Rossi, RSC Adv. 9, 19171 (2019).