Revisiting the storage capacity limit of graphite battery anodes: spontaneous lithium overintercalation at ambient pressure
Abstract
The market quest for fast-charging, safe, long-lasting and performant batteries drives the exploration of new energy storage materials, but also promotes fundamental investigations of materials already widely used. Presently, revamped interest in anode materials is observed – primarily graphite electrodes for lithium-ion batteries. Here, we focus on the upper limit of lithium intercalation in the morphologically quasi-ideal highly oriented pyrolytic graphite (HOPG), with a \ceLiC6 stoichiometry corresponding to 100% state of charge (SOC). We prepared a sample by immersion in liquid lithium at ambient pressure and investigated it by static \ce^7Li nuclear magnetic resonance (NMR). We resolved unexpected signatures of superdense intercalation compounds, \ceLiC_. These have been ruled out for decades, since the highest geometrically accessible composition, \ceLiC2, can only be prepared under high pressure. We thus challenge the widespread notion that any additional intercalation beyond \ceLiC6 is not possible under ambient conditions. We monitored the sample upon calendaric aging and employed ab initio calculations to rationalise the NMR results. The computed relative stabilities of different superdense configurations reveal that non-negligible overintercalation does proceed spontaneously beyond the currently accepted capacity limit.
I Introduction
For a reduction in greenhouse gas emission to tackle global warming, mass market penetration of electric vehicles (EVs) is a key element for a nearly \ceCO2-free transportation sector.[1] Powerful, durable and safe lithium-ion batteries (LIBs) are crucial for consumer acceptance of electromobility on a larger scale. In particular, the fast-charging capability is regarded as a pivotal selling point. The necessity of fast-charging batteries brought some intrinsic limitations of the materials back into the spotlight, which historically did not matter in commonplace applications of LIBs, such as portable electronics. Primarily for the negative electrode, notable issues are still largely unaddressed to this day, including increasing the active site density, earlier detection of dendrite formation, or a quantitative description of mass and charge transport.[2, 3, 4, 5] Extensive amount of work is ongoing to identify alternatives to the carbon-based anode materials. Even within the class of carbonaceous materials, different options were screened for usage as negative electrodes, from soft to hard carbon, carbon foam, carbon nanotubes, graphene sheets, artificial graphite, or mesocarbon microbeads graphite (MCMB).[6] Nonetheless, with its intrinsic capacity and wide availability, graphite is still the most employed anode material. Its working principle is based on the intercalation of lithium ions. Upon lithium intercalation during charging, graphite reaches its maximum reversible Li storage capacity at a lithium-to-carbon ratio of 1:6 (\ceLiC6). Theoretically this compound yields a capacity of 372 mAh/g, commonly defining 100% state of charge (SOC).[7, 6, 8] However, the highest geometrically accessible composition – not considering lithium carbide (\ceLi2C2) but only the family of graphite intercalation compounds (GICs) – is not \ceLiC6, but \ceLiC2, with a capacity three times higher. Nevertheless, the latter is metastable at ambient conditions and its non-electrochemical preparation was only reported under high pressure, with superdense decomposition products, \ceLiC_ with , stable over an extended time period.[9, 10]
Despite extensive experimental efforts, in-depth understanding of in operando battery processes is still sparse.[11, 12, 13, 14] One major problem is that the interconnection of many relevant electrochemical processes renders the analysis of experimental data difficult and complicates the understanding of actual limits and causes of battery cell failure.[4] Furthermore, theoretical investigations over large compositional Li/C ratios, and on time scales relevant for Li dynamics in graphite without unrealistic simplifications have only become possible recently. Therefore, concomitant theoretical and experimental research is scarce.
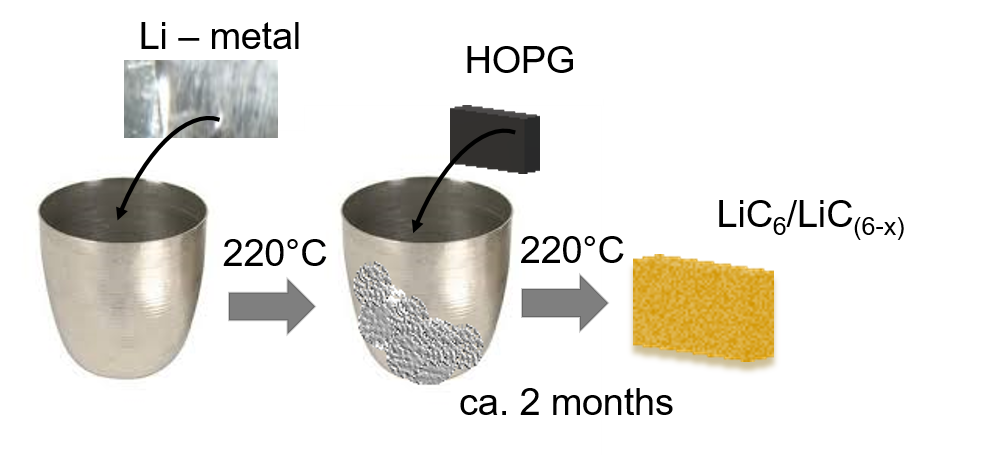
Here, we use HOPG as a model system to investigate lithium ion intercalation, providing nuclear magnetic resonance (NMR) reference data from a system as well-defined as possible for further in operando studies of LIBs. To exclude any external influence on the intercalation process, we opted for an infiltration technique under ambient pressure.[15, 16, 17] Figure 1 shows a sketch of the synthesis workflow, using lithium metal and HOPG as precursors. More details on the preparation are provided in the Methods section and in Supplementary Fig. S1.a-b. Using this slow intercalation route, we obtained a sample that, repeatedly analysed in detail, showed spectroscopic evidence of superdense structures. We assessed the plausibility of such an assignment of spectral features by ab initio calculations. Eventually, we analysed the long-term evolution of the sample over several months, concluded by heating it up to 60 ∘C.
I.1 What do we know about superdense \ceLiC2 and \ceLiC_6-x?

Superdense realisations of lithium GICs were reported at high pressure and temperature conditions since the 1980s.[18, 9, 19, 20, 21, 22, 23, 24] Fig. 2 schematically shows possible high-symmetry structures for some intermediate stoichiometries between \ceLiC6 and \ceLiC2.
The occurrence of \ceLiC2 was excluded a priori from any working battery for a long time. Since its non-electrochemical synthesis was always performed at high pressure and temperature, it is considered unlikely to be found in secondary batteries.[19, 25, 10] Alternatively to high-pressure synthesis, ball-milling also allows \ceLiC2 to be prepared using artificial graphite, MCMB, and carbon foam.[23, 26, 25] However, one may argue that ball-milling produces high pressure and temperature locally.[27] Once the pressure is released, the \ceLiC2 composition becomes unstable and approaches \ceLiC_2.2-2.7,3.4.[19, 28] Nevertheless, \ceLiC_2.7 and \ceLiC_3.4 as decomposition products of \ceLiC_2 were reported to be stable enough to allow measurements at ambient conditions.[20, 21] Bindra et al. stabilised superdense GICs using boron doping, in an attempt to enable higher capacity electrode materials, yet they still used high-pressure synthesis.[20]
For electrochemical intercalation, Conard et al. reported that the electric field actuates only as far as the gallery entrance, and therefore is not sufficiently attractive to drive the intercalation up to \ceLiC2.[29] Notwithstanding, superdense phases were observed for electrochemical systems using different carbon-based matrices, leading to the concept of overcharged LIBs.[30, 31, 32] In the latter works, lithium ions appeared to continue intercalating after \ceLiC6 was formally reached, yet before being plated as lithium metal. Unfortunately, such overcharged anodes show irreversible capacity loss after the first deintercalation cycle.[31] More recently Paronyan et al. successfully used carbon foam as anode material to investigate overlithiation.[33]
A systematic investigation of the relative stability of overlithiated compounds, especially the intermediate stoichiometries between \ceLiC6 and \ceLiC2, is currently missing, both from the experimental and the computational standpoint. On the experimental side, there is widespread consensus[34, 35, 36, 37] that the free energy of intercalation of \ceLiC6 falls in the range of -6 to -14 kJ/mol (-0.06 to -0.14 eV). Yet little is known about the free energies of overintercalation, except that the formation of \ceLiC2 is assumed endergonic at ambient conditions. On the computational side, previous studies based on Density Functional Theory (DFT) only report total energy calculations of \ceLiC6 and – less often – \ceLiC2.[38, 10, 39, 40]. Two main limitations are recurring among these. First, dispersion interactions, which are crucial in intercalation chemistry, were not included in all the studies. Secondly, total energies only provide a “virtual” zero-temperature picture, while finite temperature and pressure require a description in terms of free energies. Despite these limitations, the reported total energies are compatible with the measured thermochemistry. However, no coherent body of literature exists that addresses the energetics of the entire \ceLiC_ range on the same footing.
II Materials and Methods
II.1 Experimental
Synthesis and sample preparation
The \ceLiC6 sample was prepared using an infiltration technique. Metallic lithium with 99.9 purity (Sigma-Aldrich) was intercalated into highly oriented pyrolytic graphite HOPG (Goodfellow purchased by Sigma-Aldrich). The lithium metal was heated after the melting point up to 220 ∘ C. The lithium’s self-cleaning properties ensure a higher purity of the molten lithium metal. Afterwards the HOPG was added. In order to ensure complete lithium intercalation, the intercalation process has been allowed to take place for a period of over 2 months. This long infiltration time was necessary due to the dimension of the host material (pre-intercalation size = mm). [16, 15, 17] The ageing process was performed in a closed container in a glove box under argon atmosphere. The sample was left to age for 5 months initially, followed by an additional period of 2 months. For the 5 months aged sample, a series of temperature dependency spectra of \ce^7Li static NMR were recorded.
NMR measurements and data analysis
All \ce^7Li NMR spectra were acquired using a Bruker BioSpin spectrometer Avance IIITM HD 600 XWB MHx at = 14.1 T (\ce^7Li Larmor frequency = 233.3 MHz) equipped with a Bruker DiffBB 5 mm BBO-H/F-Z Gradient diffusion probe-head. A single 90 ∘ pulse excitation of 11 s with recovery delays of 10 s on 7Li was employed. The raw data were analysed using MATLAB. An exponential window function was employed before a fast Fourier transform (FFT). The spectra were zero- and first-order phase corrected as well as background corrected.
II.2 Computational
DFT calculations and ab initio thermodynamics
All the DFT calculations were performed using the plane-wave code VASP[41] v.5.4.4, with the GGA-PBE functional[42] and the Projector Augmented-Wave (PAW) pseudopotentials.[43] Dispersion interactions were taken into account with the D3 method.[44] To ensure well converged total energies, a basis-set cutoff of 599 eV was chosen. All the calculated geometries were represented in appropriate periodic supercells and the Brillouin zone was sampled at a fixed k-point density of 0.1 Å-1. The vibrational densities of states were calculated using phonopy[45] at the harmonic approximation level. The chemical potential of lithium was mapped to temperature in a 0-600 K range using Janaf thermochemical tables[46] up to the fusion temperature (453.69 K) and employing a linear approximation for higher temperatures (cf. SI 2). AIMD simulations were performed by means of the DFTB[47] code dftb+[48] v.19.1 using the parametrisation developed in our group[49]. Trajectories of variable length were propagated with a time step of 1 fs in the canonical ensemble at 500, 750 and 1000 K, using a Nosé-Hoover thermostat[50] with a coupling strength of 41 THz, corresponding to the highest vibrational mode of \ceLiC6 as calculated with phonopy.
III Results and discussion
III.1 Static \ce^7Li nuclear magnetic resonance on lithium intercalated HOPG
Static \ce^7Li NMR spectroscopy is a valuable tool to distinguish different degrees of lithiation in carbonaceous materials.[11] The \ce^7Li nucleus possesses spin 3/2, making observations of central transitions and quadrupolar satellite transitions possible. Satellite transitions allow conclusions on ordered structures with low Li-ion mobility,[16, 29] whereas their absence may indicate a lack of perfectly ordered motifs and/or a motional averaging of the quadrupolar interaction.[29]
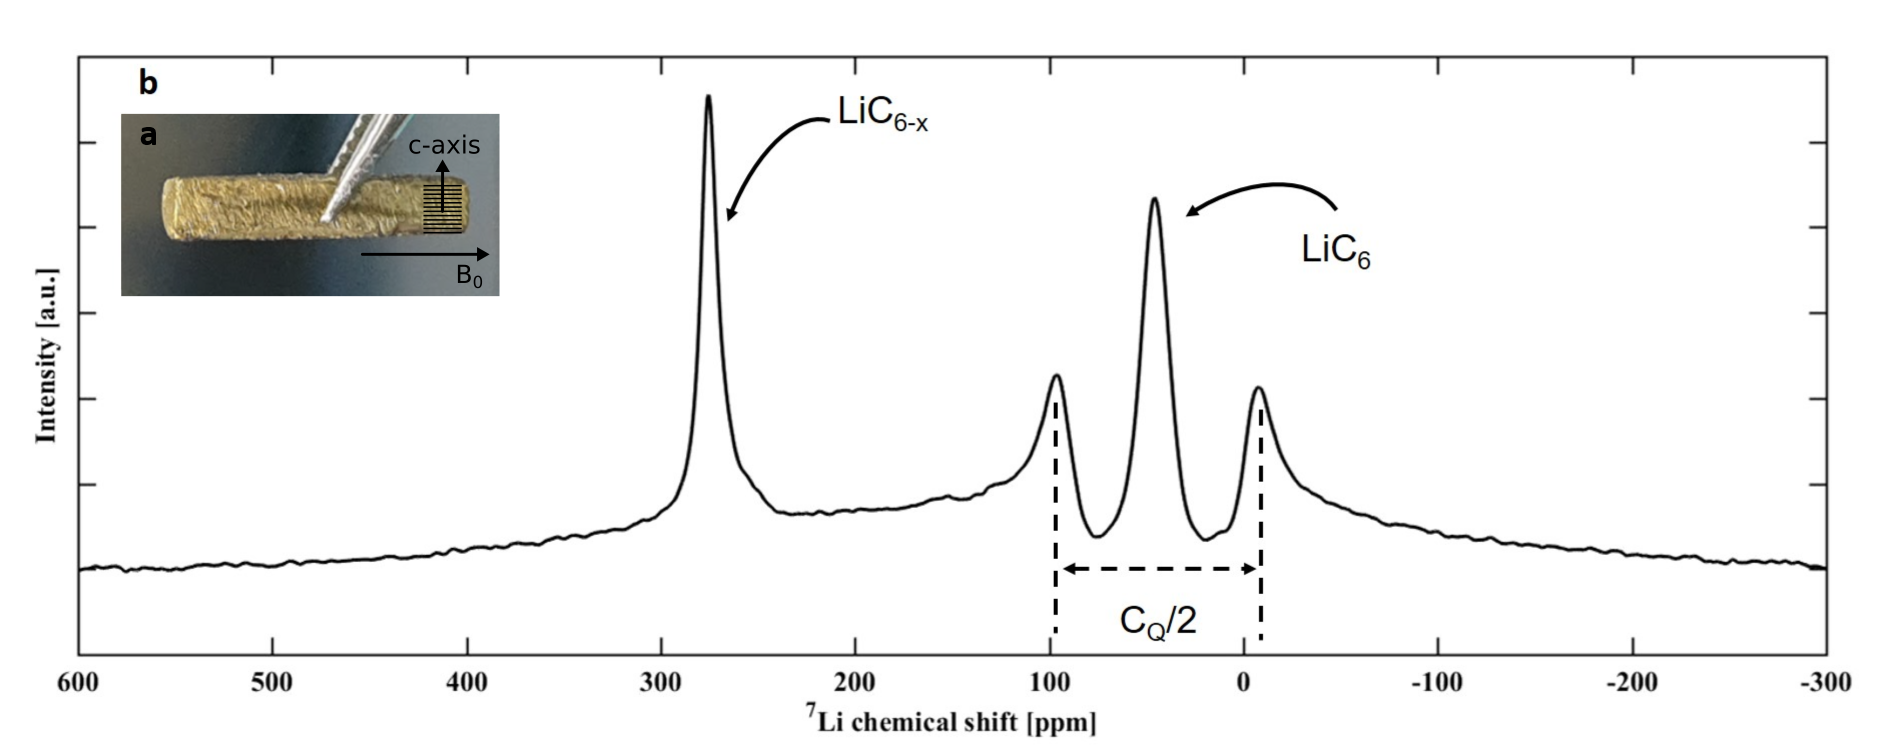
Fig. 3.a shows a photograph of the fully intercalated HOPG sample. The golden colour is characteristic of \ceLiC6. However, overlithiated compounds were also reported to appear golden.[20, 25] Fig. 3.b represents the static \ce^7Li solid state NMR spectrum of the polished sample. All chemical shifts are reported against an external reference of a 1.0 M solution of LiCl in \ceD2O. We assign the isotropic chemical shift at 45 ppm with quadrupolar satellites to \ceLiC6, compatibly with previous works.[51, 52, 13] Additionally, an asymmetric signal with a sharp peak at 274 ppm and a shoulder at ca. 256 ppm is present. We also observe a broad spectral feature around 100-200 ppm, that is not background distortion (cf. SI 1). At first, the high-ppm signals may be attributed to plated lithium on the sample. The HOPG surface was polished using sand paper (Supplementary 1c-d), but residual metallic Li may persist. However, the intensity is too high for only trace amounts of lithium metal on the surface that are not detectable by visual inspection. Moreover, HOPG can be considered a defect-free single crystal, thus lacking internal pores that could accommodate pockets of metallic lithium.[53]
At this point, we must consider the possibility that these high-ppm signatures are generated by superdense phases instead. We are aware that superdense Li-GICs were never reported before without harsh pressure conditions. However, the uncertainty raised in our sample reflects the ambiguity of assignments present in literature. Azaïs et al. assigned a 259 ppm \ce^7Li NMR resonance to lithium metal, despite using the exact ratio of Li/C to form \ceLiC2 with a ball-milling synthesis. Interestingly, they found no Li metal signal in the X-ray spectrum, which is explained by intensive milling applied to the sample.[32] Conversely, Conard et al. assigned a peak at 259 ppm to \ceLiC2.[9] Since the spectrum was recorded after releasing the pressure, the true \ceLiC2 chemical shift might be closer to the Li metal shift. The 259 ppm peak could then be attributed to \ceLiC_2.2-2.4.[9, 19, 28]
As shown in Fig. 2, two local structural motifs are recurring in superdense compositions: a \ceLi4 pattern in the shape of a three-pronged “star” (highlighted in cyan) and a denser \ceLi7 pattern in the shape of a flat cluster, or “flower” (highlighted in red). The central Li atom is coordinated by three or six nearest Li neighbors, respectively. It is therefore expected to exhibit pseudo-metallic character. This was already suggested to explain the high-ppm signals associated to \ceLiC2 decomposition products.[19, 25, 29]
Chang et al. showed that variable shifts at high-ppm can arise from different microstructures of lithium metal in electrochemical systems.[54] Since no current or potential was applied during sample preparation, the formation of dendrites or mossy-type microstructures is not expected here. Trease et al. showed that lithium metal in non-spherical shapes is also sensitive to the direction of the magnetic field, with resonances shifting between about 245 and 270 ppm if a planar sample is placed perpendicular or parallel to , respectively.[55] This is known as orientation-dependent shift due to the bulk magnetic susceptibility effect. All our comparative measurements were performed using the same sample orientation, with the c-axis perpendicular to (Fig. 3). In a control experiment, we also cut part of the sample to measure at parallel orientation. The high-ppm signature only moved to 264 ppm (Supplementary Fig. S2) within the limits set by the original 274 and 256 ppm signals. This indicates a susceptibility effect also for the quasi-metallic superdense species, as it has been observed for Li metal, before.
III.2 Calendar ageing and post-ageing temperature dependent static \ce^7Li NMR of lithium intercalated HOPG
We aged the sample to investigate the long term (meta-)stability as well as changes in composition of \ceLiC_ over time. In addition, more invasive temperature dependent NMR experiments were performed after five months, followed by another two months of ageing.
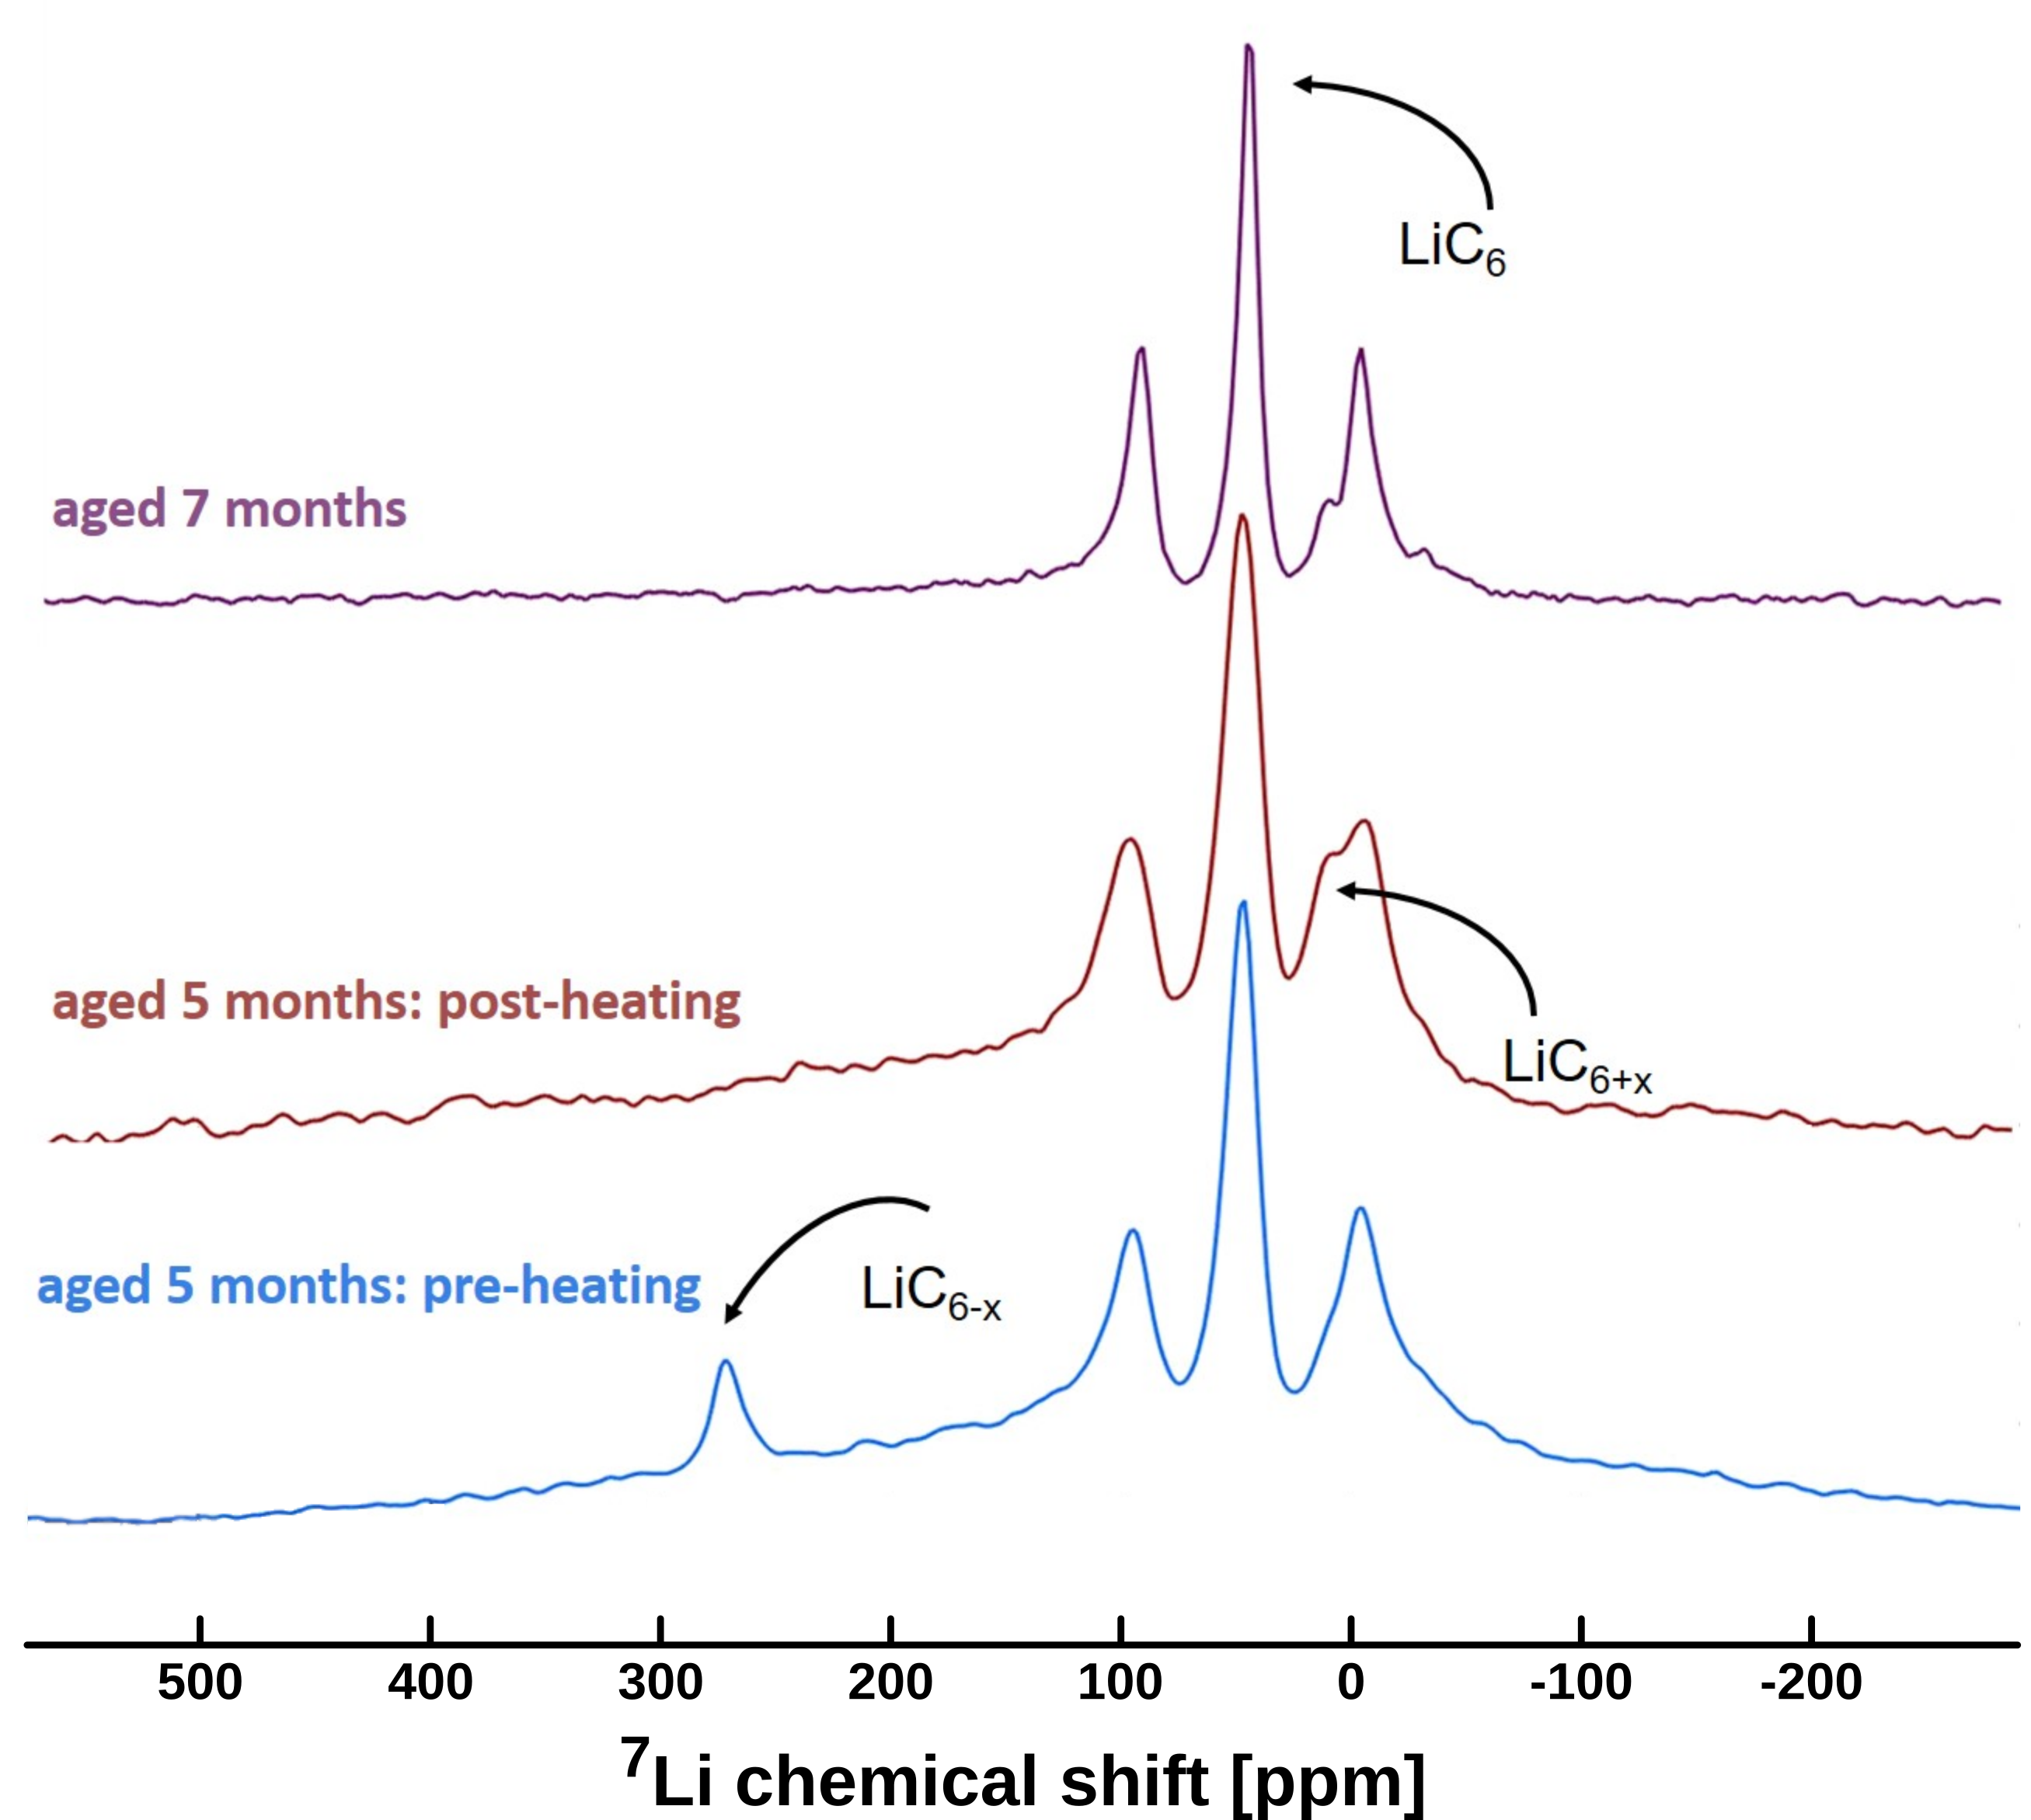
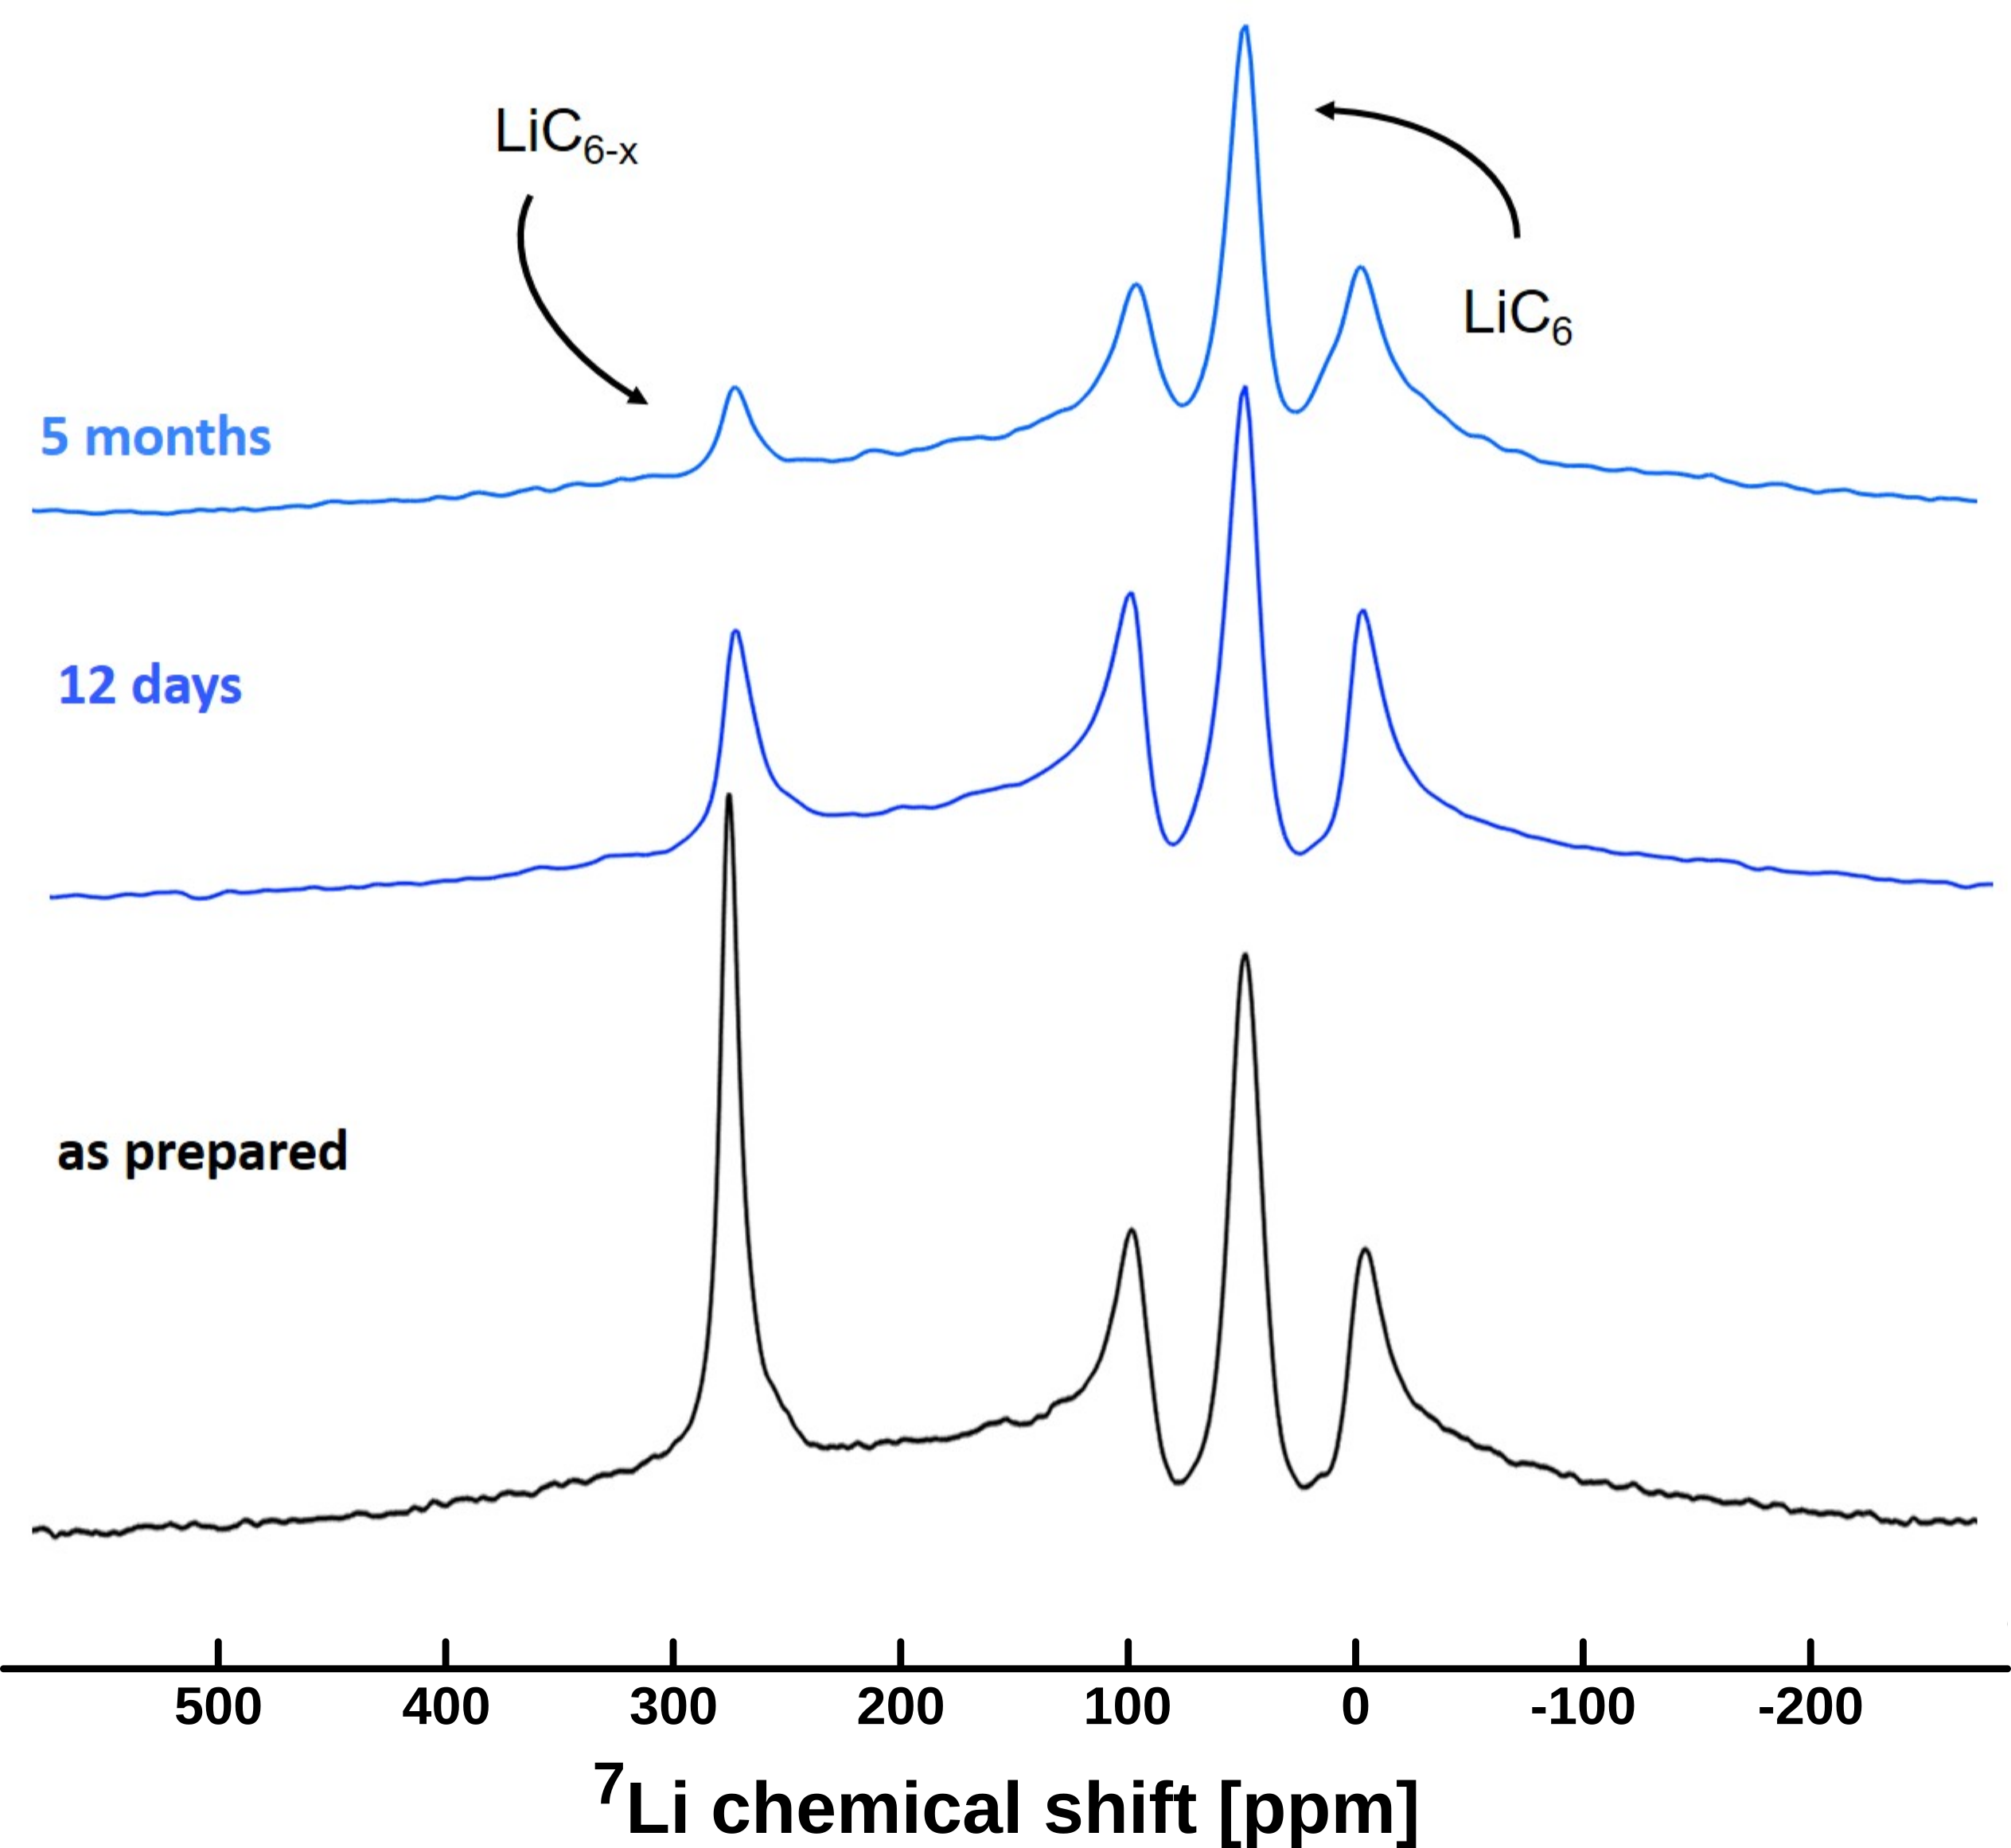
We recorded static \ce^7Li NMR spectra after twelve days (dark blue curve in Fig. 4) and after five months (light blue curve Fig. 4). The sample was thoroughly cleaned before each measurement, exposing golden shiny faces on each side of the HOPG crystal. We observe a decrease in the high-ppm peak intensities, suggesting a partial degradation of the corresponding structures. The degradation process appeared incomplete, with a residual broad signal that appears as the overlap of both shifts present in the fresh sample spectrum. The stability of the structures associated with these signals over several months is compatible with Nalimova et al.[19] The 274 ppm signal seems to decrease the most during this timeframe but cannot be fully disentangled from the 256 ppm (light blue vs. black curve Fig. 4) A new Li environment with a chemical shift of 10–13 ppm forms concomitantly. Signatures in this region are commonly associated to lower SOC and generically identified as \ceLiC_,[13] or, in other works, attributed to Li–Li dimers.[56]
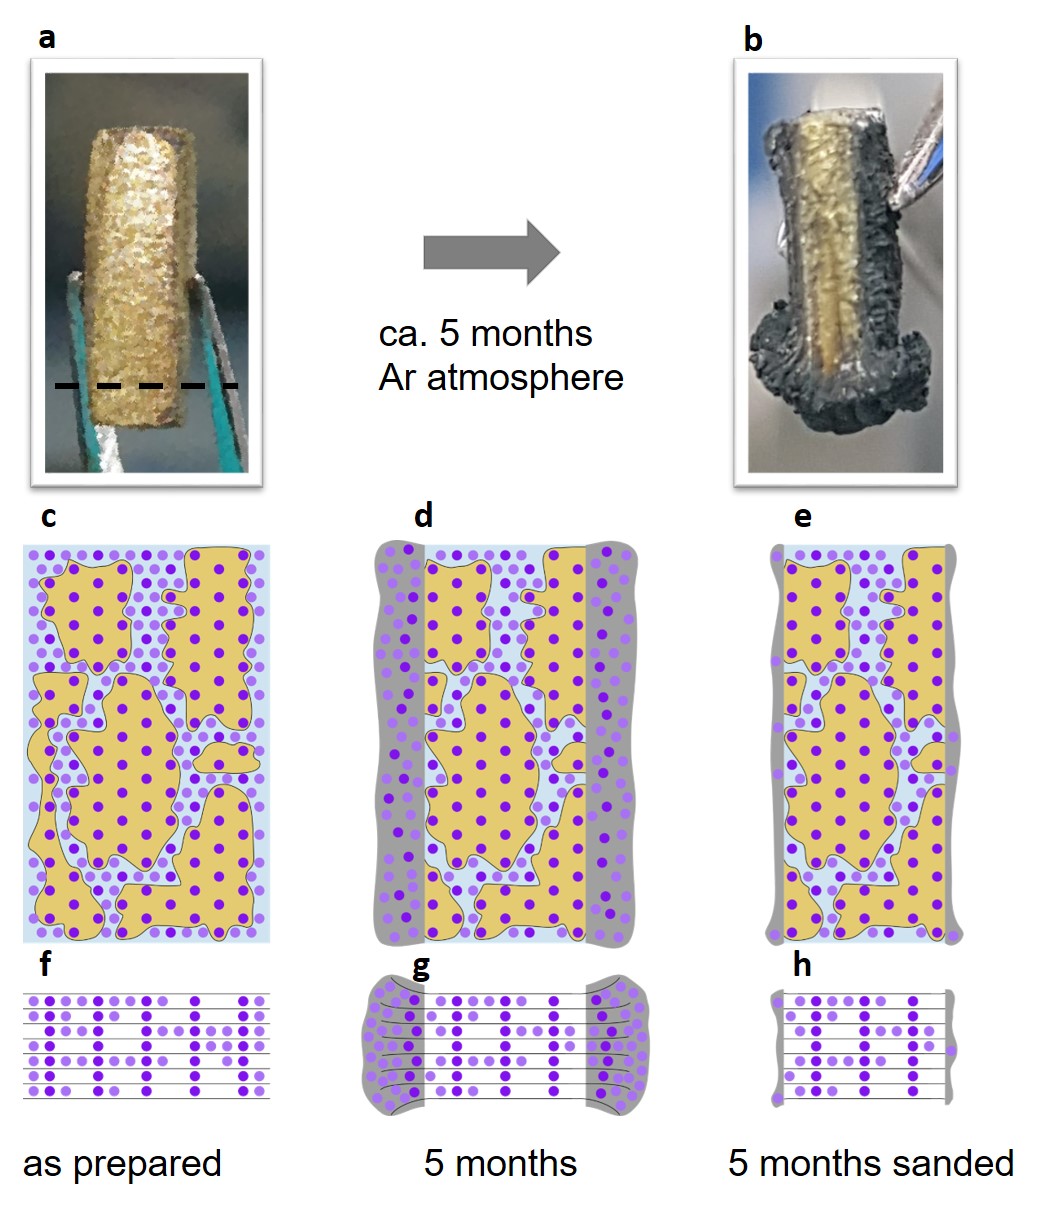
After five months the sample decomposed visibly as shown in Fig. 5. The observed drastic delamination is only compatible with the expulsion of lithium from inside the sample, thus it would not have occurred if the high-ppm signal was caused by surface metal only. The opening of the graphite sheets also indicates pressure release from within the bulk material.[19, 25, 28] This is a further indicator towards the degradation of a superdense structure. Fig. 5 also shows a schematic model of the possible microscopic configuration of sample (Panels a, f), with ordered \ceLiC6 domains and overlithiated interdomain regions. Panels d, g show the schematic delamination after five months. Panels e, h represent the sample after cleaning.
In the temperature dependent measurements (Fig. 6 and Supplementary Fig. S3), the residual high-ppm peak disappears after mild heating to 310–330 K, while the 10–13 ppm signal becomes more evident (cf. Supplementary Fig. S3). The broad spectral feature between about 100–200 ppm, which temporarily vanishes at elevated temperature during the heating cycle (cf. Supplementary Fig. S3 at 40 and 60°C), reappears post-heating and only vanishes permanently after two more months of ageing.
| \ceLiC6 | \ceLiC_4.8 | \ceLiC_3.4 | \ceLiC_2.7 | \ceLiC2 | ||
|---|---|---|---|---|---|---|
| (DFT-D3) / eV | -0.10 | -0.01 | 0.14 | 0.27 | 0.46 | 1.08 |
| (300 K) / eV | -0.12 | -0.03 | 0.09 | 0.24 | 0.40 | 1.00 |
| (500 K) / eV | -0.09 | 0.02 | 0.12 | 0.28 | 0.44 | 1.09 |
| (300 K) / eV | — | 0.03 | 0.00 | 0.00 | 0.00 | 0.00 |
| (500 K) / eV | — | 0.08 | 0.01 | 0.00 | 0.00 | 0.00 |
III.3 Ab initio thermodynamics and dynamics of superdense GICs
A basic modelling approach is to initially consider periodic high-symmetry structures as shown in Fig. 2, and calculate the formation free energies of these extended “pure” phases. To this end, we adopted an ab initio thermodynamics (AITD) approach.[57] A detailed derivation of the formalism adapted to our system is provided in SI 2. Within this framework we calculated the free energy of intercalation for the stoichiometries above at 300 and 500 K and ambient pressure. Based on these, we estimate relative populations at equilibrium as Boltzmann ratios with respect to \ceLiC6. The results are reported in Table 1. The effect of configurational entropy was neglected, which would further favour overlithiated compounds (except \ceLiC2; cf. SI 2). As such, the relative populations are to be considered a lower estimate.
With \ceLiC2 at +1.09 eV (105.17 kJ/mol) at 500 K, we exclude its presence in the sample. However, \ceLiC_3.4 and \ceLiC_4.8 have only mildly positive at 500 K, which becomes even negative at room temperature for \ceLiC_4.8. Correspondingly, their relative populations are non-vanishing. Regardless of the precise assignment of the high-ppm signal (vide infra), we stress at this point that the energetics above, albeit simplified, confirm that a certain amount of excess lithium does indeed enter spontaneously. In other words, the common conception that \ceLiC6 corresponds to 100 % SOC is not entirely accurate thermodynamically. The exact upper limit of overlithiation accessible beyond \ceLiC6 and its dependence on external conditions can only be determined by means of computationally expensive statistical sampling, which goes beyond the scope of this work.
The observed high-ppm signal may indeed arise from \ceLi7 “flowers” and/or \ceLi4 “stars” present not only in sizeable domains of exact \ceLiC_3.4 and \ceLiC_4.8 compositions, but also diluted in a \ceLiC6 environment. Considering that, starting from a \ceLiC6 environment, every additional lithium will form at least a \ceLi4 “star”, this can happen at any \ceLiC_ stoichiometry. Additionally, a “flower” may form if three neighbouring Li atoms from the immediate surroundings aggregate around the centre of a “star”. We estimate the cost of such aggregation as ca. 0.11 eV, thus also thermally accessible. Subsequently, “star” and “flower” motifs are in equilibrium with each other, thus both can contribute to the high-ppm signals.
The relative populations at 300 K (cf. Table 1) confirm the metastability of superdense patterns at room temperature. However, the relative concentrations of these patterns in the fresh sample must be closer to those at 500 K than those at 300 K, as the calendaric aging showed a slow equilibration towards degradation. Assuming that the decomposition is diffusion-controlled, we estimate the effective diffusion barrier and thus the relative degradation rate at 300 vs. 500 K. We performed ab initio molecular dynamics (AIMD) simulations, based on Density Functional Tight Binding (DFTB)[47], to evaluate Li mobility in a slightly oversaturated \ceLiC_ supercell with two \ceLi7 motifs in an \ceLiC6-like environment. The resulting diffusion coefficients (Supplementary Fig. S4) show Arrhenius behaviour with an effective barrier of 0.35 eV, which slows down the delithiation about 225 times at room temperature compared to 500 K (cf. SI 3).
We note in passing that the AIMD trajectories exhibited frequent occurrences of directly connected Li dimers and trimers in an isosceles triangular configuration as transient byproducts of the decomposition of the \ceLi7 clusters (Supplementary Fig. S5). This nicely ties in with the appearance of the low-ppm shoulder upon ageing, if this were to be attributed to Li–Li dimers rather than low-SOC patterns.
III.4 Discussion
Without explicitly simulating chemical shifts, we cannot unambiguously assign each resonance. We excluded that the high ppm features are generated by lithium metal. On energetic grounds, we also exclude full \ceLiC2. Thus, we infer the presence of some form of intermediately overlithiated phase containing \ceLi7 (“flowers”) and/or \ceLi4 (“star”) motifs, and associate the high-ppm shift to pseudo-metallic character of the central atoms. While one may argue whether the \ceLi4 stars are “dense” enough to produce high-ppm shifts, their formation is more energetically accessible than that of \ceLi7 flowers, therefore a spectroscopic signature is to be expected. In the light of this, we put forward the following scenario, qualitatively combining experimental observations and simulations. The asymmetric high-ppm signal corresponds to sizeable domains of at least \ceLiC_4.8 stoichiometry, possibly mixed with \ceLiC_3.4, and domains of variable \ceLiC_ stoichiometries with \ceLi7 and/or \ceLi4 motifs diluted in \ceLiC6-like surroundings. The signal is split into a sharp 274 ppm feature and a broad 256 feature due to susceptibility effects analogously to metallic lithium, but of smaller magnitude. As such, the more intense 274 ppm peak would correspond to sample faces with normal vectors perpendicular to , while the 256 ppm corresponds to face normals parallel to . It is reasonable to assume that overlithiation mainly occurs in the proximity of the HOPG surface, while the inner bulk is predominantly \ceLiC6. Then, the relative magnitude of the two peaks reflects the dimensions of the sample (longer surface along ). Moreover, as the core of the sample may be shielded to a fair degree, surface species may be weighted more strongly and therefore show a higher relative amplitude with respect to the \ceLiC6 bulk than relative energetics would suggest.[58] Considering the inherent metastability of \ceLi7 clusters, an additional significant population of imperfect \ceLi_ clusters (with ) can be expected (“broken flowers”). The lithium atoms belonging to these clusters are undercoordinated with respect to the \ceLi7 central atom but still occupying adjacent \ceC6 rings, therefore they can be expected to produce a signal at a higher shift than the “free” lithium atoms in \ceLiC6. \ceLi3 motifs can analogously appear as “broken stars”. Additionally, both the crown atoms of the \ceLi7 and the prongs of the \ceLi4 motifs have lower coordination than the respective central atoms. As such, there are many possible realisations of microstructures with a wide range of coordinations, thus we may attribute the broad spectral feature at 100–200 ppm to a superposition of resonances corresponding to all the above. Both the high-ppm peaks and the broad 100–200 ppm spectral feature are correlated with the increase of the 10–13 ppm feature. This is a strong indication that the degradation of superdense structures directly corresponds to the appearance of a new Li environment. In line with previous assignments of the low-ppm feature in literature, this can correspond to either Li–Li dimers occurring as the smallest possible decomposition product before isolated Li, or to the formation of locally Li-depleted \ceLiC_ regions following the ejection of Li at the surface. Of note, these two patterns can coexist as a result of decomposition (cf. Supplementary Fig. S5).
IV Conclusions
While preparing a reference sample of fully intercalated \ceLiC6 for \ce^7Li NMR spectra, we observed unexpected high-ppm resonances. Confidently ruling out that the observed signatures arise from residual metallic lithium, we attribute these to superdense \ceLiC_ compounds formed under ambient pressure. We investigate the evolution of the signal under calendaric aging and rationalise our observations with ab initio simulations. We infer that the signal arises from sizeable domains containing \ceLi7 (“flowers”) and/or \ceLi4 (“stars”) motifs in sufficient amounts and we estimate the long-term (meta-)stability. Ab initio thermodynamics confirms that a non-negligible excess of lithium enters spontaneously, which, to the best of our knowledge, had never been considered before. These findings challenge the currently accepted hypothesis that, since \ceLiC2 can only be prepared under high pressure[19, 25, 29], any additonal intercalation beyond \ceLiC6 is implausible. In hindsight, the simple consideration that the range of stoichiometries between \ceLiC6 and \ceLiC2 spans 200% states of charge beyond 100% should suggest prudence in such an assumption. Yet, it was never rigorously verified. In our view, multiple previous works on electrochemical cells contain indications compatible with at least a sparkle of doubt.[30, 31, 33] To be fair, the question of assessing the true capacity of ordered graphitic hosts was explicitly addressed for bilayer or multilayer graphene.[59, 60] Inexplicably however, the evidence of overlithiation in the latter did not reopen the question of analogous occurrence in extended graphite – which is the material actually used in working batteries. For decades, superdense graphite intercalation compounds have been considered only accessible as decomposition products of \ceLiC2 under high-pressure synthesis (“from above”).[19, 25, 29] Here we confirm that superdense compositions are also accessible directly as overintercalation products of \ceLiC6 at ambient pressure (“from below”). If this is possible under the synthesis conditions employed here, it is reasonable to expect that overlithiation is further favoured under an applied potential. Particularly in fast charging conditions, lithium plating is also increasingly favoured.[61] Hence, the most intriguing aspect is the interplay of partially reversible plating, overlithiation and reintercalation. On this account, we call for a reconsideration of the role of overlithiation, so far excluded from the picture with graphite as a host. Taking overlithiation into consideration may also shed light onto other hitherto unexplained phenomena, such as the apparent “disappearance” of some amount of available lithium between cycles, the latter commonly attributed solely to the formation of solid electrolyte interfaces (SEI) and “dead” lithium.[62] Finally, With regards to the use of NMR for the detection of plating and dendrite formation, our results also suggest that caution is indicated with assigning high-ppm signals non-specifically to the emergence of metallic lithium deposits.
Acknowledgements
All the authors thank Philipp M. Schleker and Svitlana Taranenko for valuable contribution to experimental aspects of this project and for the valuable discussion on the NMR and Matthias Kick and Simon Anniés for fruitful discussions on the theory and data presentation. This work was funded by the German Federal Ministry of Education and Research (BMBF) as part of the research cluster “AQua” within the project InOPlaBat (grant number 03XP0352) and by the research initiative Jülich Aachen Research Alliance (JARA), section JARA-Energy, within the project MF 001-17 (project ID: G:(DE-82)ZUK2-SF-JARA-ENERGY MF 001-17). The authors gratefully acknowledge the computational and data resources provided by the Leibniz Supercomputing Centre (LRZ).
References
- Uni [2015] https://ec.europa.eu/clima/policies/ international/negotiations/parisen (2015).
- Tarascon and Armand [2001] J.-M. Tarascon and M. Armand, Nature 414, 359 (2001).
- Armand and Tarascon [2008] M. Armand and J.-M. Tarascon, Nature 451, 652 (2008).
- Liu et al. [2019] Y. Liu, Y. Zhu, and Y. Cui, Nature Energy 4, 540 (2019).
- Cai et al. [2020] W. Cai, Y.-X. Yao, G.-L. Zhu, C. Yan, L.-L. Jiang, C. He, J.-Q. Huang, and Q. Zhang, Chemical Society Reviews 49, 3806 (2020).
- Asenbauer et al. [2020] J. Asenbauer, T. Eisenmann, M. Kuenzel, A. Kazzazi, Z. Chen, and D. Bresser, Sustainable Energy & Fuels 4, 5387 (2020).
- Dresselhaus and Dresselhaus [2002] M. S. Dresselhaus and G. Dresselhaus, Advances in Physics 51, 1 (2002).
- Dahn et al. [1995] J. R. Dahn, T. Zheng, Y. Liu, and J. S. Xue, Science 270, 590 (1995).
- Conard et al. [1994] J. Conard, V. A. Nalimova, and D. Guerard, Molecular Crystals and Liquid Crystals Science and Technology. Section A. Molecular Crystals and Liquid Crystals 245, 25 (1994), https://doi.org/10.1080/10587259408051661 .
- Rabii and Guérard [2008] S. Rabii and D. Guérard, Journal of Physics and Chemistry of Solids 69, 1165 (2008).
- Pecher et al. [2016] O. Pecher, J. Carretero-González, K. J. Griffith, and C. P. Grey, Chemistry of Materials 29, 213 (2016).
- Kayser et al. [2018] S. A. Kayser, A. Mester, A. Mertens, P. Jakes, R.-A. Eichel, and J. Granwehr, Physical Chemistry Chemical Physics 20, 13765 (2018).
- Lopez et al. [2018] J. L. L. Lopez, P. J. Grandinetti, and A. C. Co, Journal of Materials Chemistry A 6, 231 (2018).
- Sacci et al. [2015] R. L. Sacci, L. W. Gill, E. W. Hagaman, and N. J. Dudney, Journal of Power Sources 287, 253 (2015).
- Conard and Estrade [1977] J. Conard and H. Estrade, Materials Science and Engineering 31, 173 (1977).
- Guerard and Herold [1975] D. Guerard and A. Herold, Carbon 13, 337 (1975).
- Duan et al. [2020] J. Duan, Y. Zheng, W. Luo, W. Wu, T. Wang, Y. Xie, S. Li, J. Li, and Y. Huang, National Science Review 7, 1208 (2020).
- Schülke et al. [1989] W. Schülke, A. Berthold, and A. Kaprolat, Synthetic Metals 34, 423 (1989).
- Nalimova et al. [1995] V. Nalimova, D. Guérard, M. Lelaurain, and O. Fateev, Carbon 33, 177 (1995).
- Bindra et al. [1998] C. Bindra, V. A. Nalimova, D. E. Sklovsky, W. A. Kamitakahara, and J. E. Fischer, Physical Review B 57, 5182 (1998).
- Bondarenko et al. [1998] G. Bondarenko, V. A. Nalimova, O. Fateev, D. Guérard, and K. N. Semenenko, Carbon 36, 1107 (1998).
- Schirmer et al. [1998] A. Schirmer, P. Heitjans, and V. A. Nalimova, Molecular Crystals and Liquid Crystals Science and Technology. Section A. Molecular Crystals and Liquid Crystals 310, 291 (1998).
- Guérard and Janot [2004] D. Guérard and R. Janot, Journal of Physics and Chemistry of Solids 65, 147 (2004).
- Setton and Conard [1994] R. Setton and J. Conard, Molecular Crystals and Liquid Crystals Science and Technology. Section A. Molecular Crystals and Liquid Crystals 244, 307 (1994).
- Mordkovich [1996] V. Mordkovich, Synthetic Metals 80, 243 (1996).
- Janot and Guerard [2005] R. Janot and D. Guerard, Progress in Materials Science 50, 1 (2005).
- Burmeister et al. [2018] C. Burmeister, L. Titscher, S. Breitung-Faes, and A. Kwade, Advanced Powder Technology 29, 191 (2018).
- Nalimova [1998] V. A. Nalimova, Molecular Crystals and Liquid Crystals Science and Technology. Section A. Molecular Crystals and Liquid Crystals 310, 5 (1998).
- Conard and Lauginie [2000] J. Conard and P. Lauginie, TANSO 2000, 62 (2000).
- Hayes et al. [2003] S. E. Hayes, R. A. Guidotti, W. R. Even, P. J. Hughes, and H. Eckert, The Journal of Physical Chemistry A 107, 3866 (2003).
- Tossici et al. [2003] R. Tossici, R. Janot, F. Nobili, D. Guèrard, and R. Marassi, Electrochimica Acta 48, 1419 (2003).
- Azaïs et al. [2002] P. Azaïs, L. Duclaux, A.-M. Faugère, and F. Béguin, Applied Physics Letters 81, 775 (2002).
- Paronyan et al. [2017] T. M. Paronyan, A. K. Thapa, A. Sherehiy, J. B. Jasinski, and J. S. D. Jangam, Scientific Reports 7, 2045 (2017).
- Avdeev et al. [1990] V. V. Avdeev, V. A. Nalimova, and K. N. Semenenko, High Pressure Research 6, 11 (1990).
- Reynier et al. [2004] Y. F. Reynier, R. Yazami, and B. Fultz, Journal of The Electrochemical Society 151, A422 (2004).
- Reynier et al. [2007] Y. Reynier, R. Yazami, and B. Fultz, Journal of Power Sources 165, 616 (2007).
- Drüe et al. [2013] M. Drüe, M. Seyring, A. Kozlov, X. Song, R. Schmid-Fetzer, and M. Rettenmayr, Journal of Alloys and Compounds 575, 403 (2013).
- Imai and Watanabe [2007] Y. Imai and A. Watanabe, Journal of Alloys and Compounds 439, 258 (2007).
- Wang et al. [2014] Z. Wang, S. M. Selbach, and T. Grande, RSC Adv. 4, 3973 (2014).
- Doh et al. [2011] C.-H. Doh, B.-C. Han, B.-S. Jin, and H.-B. Gu, Bulletin of the Korean Chemical Society, 32, 2045 (2011).
- Kresse and Hafner [1993] G. Kresse and J. Hafner, Physical Review B 47, 558 (1993).
- Perdew et al. [1996] J. P. Perdew, K. Burke, and M. Ernzerhof, Physical Review Letters 77, 3865 (1996).
- Kresse and Joubert [1999] G. Kresse and D. Joubert, Physical Review B 59, 1758 (1999).
- Grimme et al. [2010] S. Grimme, J. Antony, S. Ehrlich, and H. Krieg, The Journal of Chemical Physics 132, 154104 (2010).
- Togo and Tanaka [2015] A. Togo and I. Tanaka, Scr. Mater. 108, 1 (2015).
- Chase [1998] M. Chase, NIST-JANAF Thermochemical Tables, 4th Edition (American Institute of Physics, 1998).
- Elstner et al. [1998] M. Elstner, D. Porezag, G. Jungnickel, J. Elsner, M. Haugk, T. Frauenheim, S. Suhai, and G. Seifert, Phys. Rev. B 58, 7260 (1998).
- Hourahine et al. [2020] B. Hourahine, B. Aradi, V. Blum, F. Bonafé, A. Buccheri, C. Camacho, C. Cevallos, M. Y. Deshaye, T. Dumitrică, A. Dominguez, S. Ehlert, M. Elstner, T. van der Heide, J. Hermann, S. Irle, J. J. Kranz, C. Köhler, T. Kowalczyk, T. Kubař, I. S. Lee, V. Lutsker, R. J. Maurer, S. K. Min, I. Mitchell, C. Negre, T. A. Niehaus, A. M. N. Niklasson, A. J. Page, A. Pecchia, G. Penazzi, M. P. Persson, J. Řezáč, C. G. Sánchez, M. Sternberg, M. Stöhr, F. Stuckenberg, A. Tkatchenko, V. W. z. Yu, and T. Frauenheim, The Journal of Chemical Physics 152, 124101 (2020).
- Panosetti et al. [2021] C. Panosetti, S. B. Anniés, C. Grosu, S. Seidlmayer, and C. Scheurer, The Journal of Physical Chemistry A 125, 691 (2021).
- Evans and Holian [1985] D. J. Evans and B. L. Holian, The Journal of Chemical Physics 83, 4069 (1985).
- Lauginie et al. [1992] P. Lauginie, H. Estrade-Szwarckopf, and J. Conard, Materials Science Forum 91-93, 545 (1992).
- Langer et al. [2013] J. Langer, V. Epp, P. Heitjans, F. A. Mautner, and M. Wilkening, Physical Review B 88, 094304 (2013).
- Winter et al. [1998] M. Winter, J. O. Besenhard, M. E. Spahr, and P. Novák, Advanced Materials 10, 725 (1998).
- Chang et al. [2015] H. J. Chang, A. J. Ilott, N. M. Trease, M. Mohammadi, A. Jerschow, and C. P. Grey, Journal of the American Chemical Society 137, 15209 (2015).
- Trease et al. [2012] N. M. Trease, L. Zhou, H. J. Chang, B. Y. Zhu, and C. P. Grey, Solid State Nuclear Magnetic Resonance 42, 62 (2012).
- Sato et al. [1994] K. Sato, M. Noguchi, A. Demachi, N. Oki, and M. Endo, Science 264, 556 (1994).
- Rogal and Reuter [2006] J. Rogal and K. Reuter, Ab Initio Atomistic Thermodynamics for Surfaces: A Primer, AD-a476 575 (Defense Technical Information Center, 2006).
- Winter [1971] J. Winter, Magnetic resonance in metals (Clarendon Press Oxford, 1971) pp. xiii, 206 p.
- Kühne et al. [2018] M. Kühne, F. Börrnert, S. Fecher, M. Ghorbani-Asl, J. Biskupek, D. Samuelis, A. V. Krasheninnikov, U. Kaiser, and J. H. Smet, Nature 564, 234 (2018).
- Ji et al. [2019] K. Ji, J. Han, A. Hirata, T. Fujita, Y. Shen, S. Ning, P. Liu, H. Kashani, Y. Tian, Y. Ito, J. ichi Fujita, and Y. Oyama, Nature Communications 10, 10.1038/s41467-018-07942-z (2019).
- Wandt et al. [2018] J. Wandt, P. Jakes, J. Granwehr, R. A. Eichel, and H. A. Gasteiger, Materials Today 21, 231 (2018).
- Sole et al. [2014] C. Sole, N. E. Drewett, and L. J. Hardwick, Faraday Discuss. 172, 223 (2014).