The initial charge separation step in oxygenic photosynthesis
Abstract
Photosystem II is crucial for life on Earth as it provides oxygen as a result of photoinduced electron transfer and water splitting reactions. The excited state dynamics of the photosystem II-reaction center (PSII-RC) has been a matter of vivid debate because the absorption spectra of the embedded chromophores significantly overlap and hence it is extremely difficult to distinguish transients. Here, we report the two-dimensional electronic-vibrational spectroscopic study of the PSII-RC. The simultaneous resolution along both the visible excitation and infrared detection axis is crucial in allowing for the character of the excitonic states and interplay between them to be clearly distinguished. In particular, this work demonstrates that the mixed exciton-charge transfer state, previously proposed to be responsible for the far-red light operation of photosynthesis, is characterized by the ChlD1+Phe- radical pair and can be directly prepared upon photoexcitation. Further, we find that the initial electron acceptor in the PSII-RC is Phe, rather than PD1, regardless of excitation wavelength.
1 Introduction
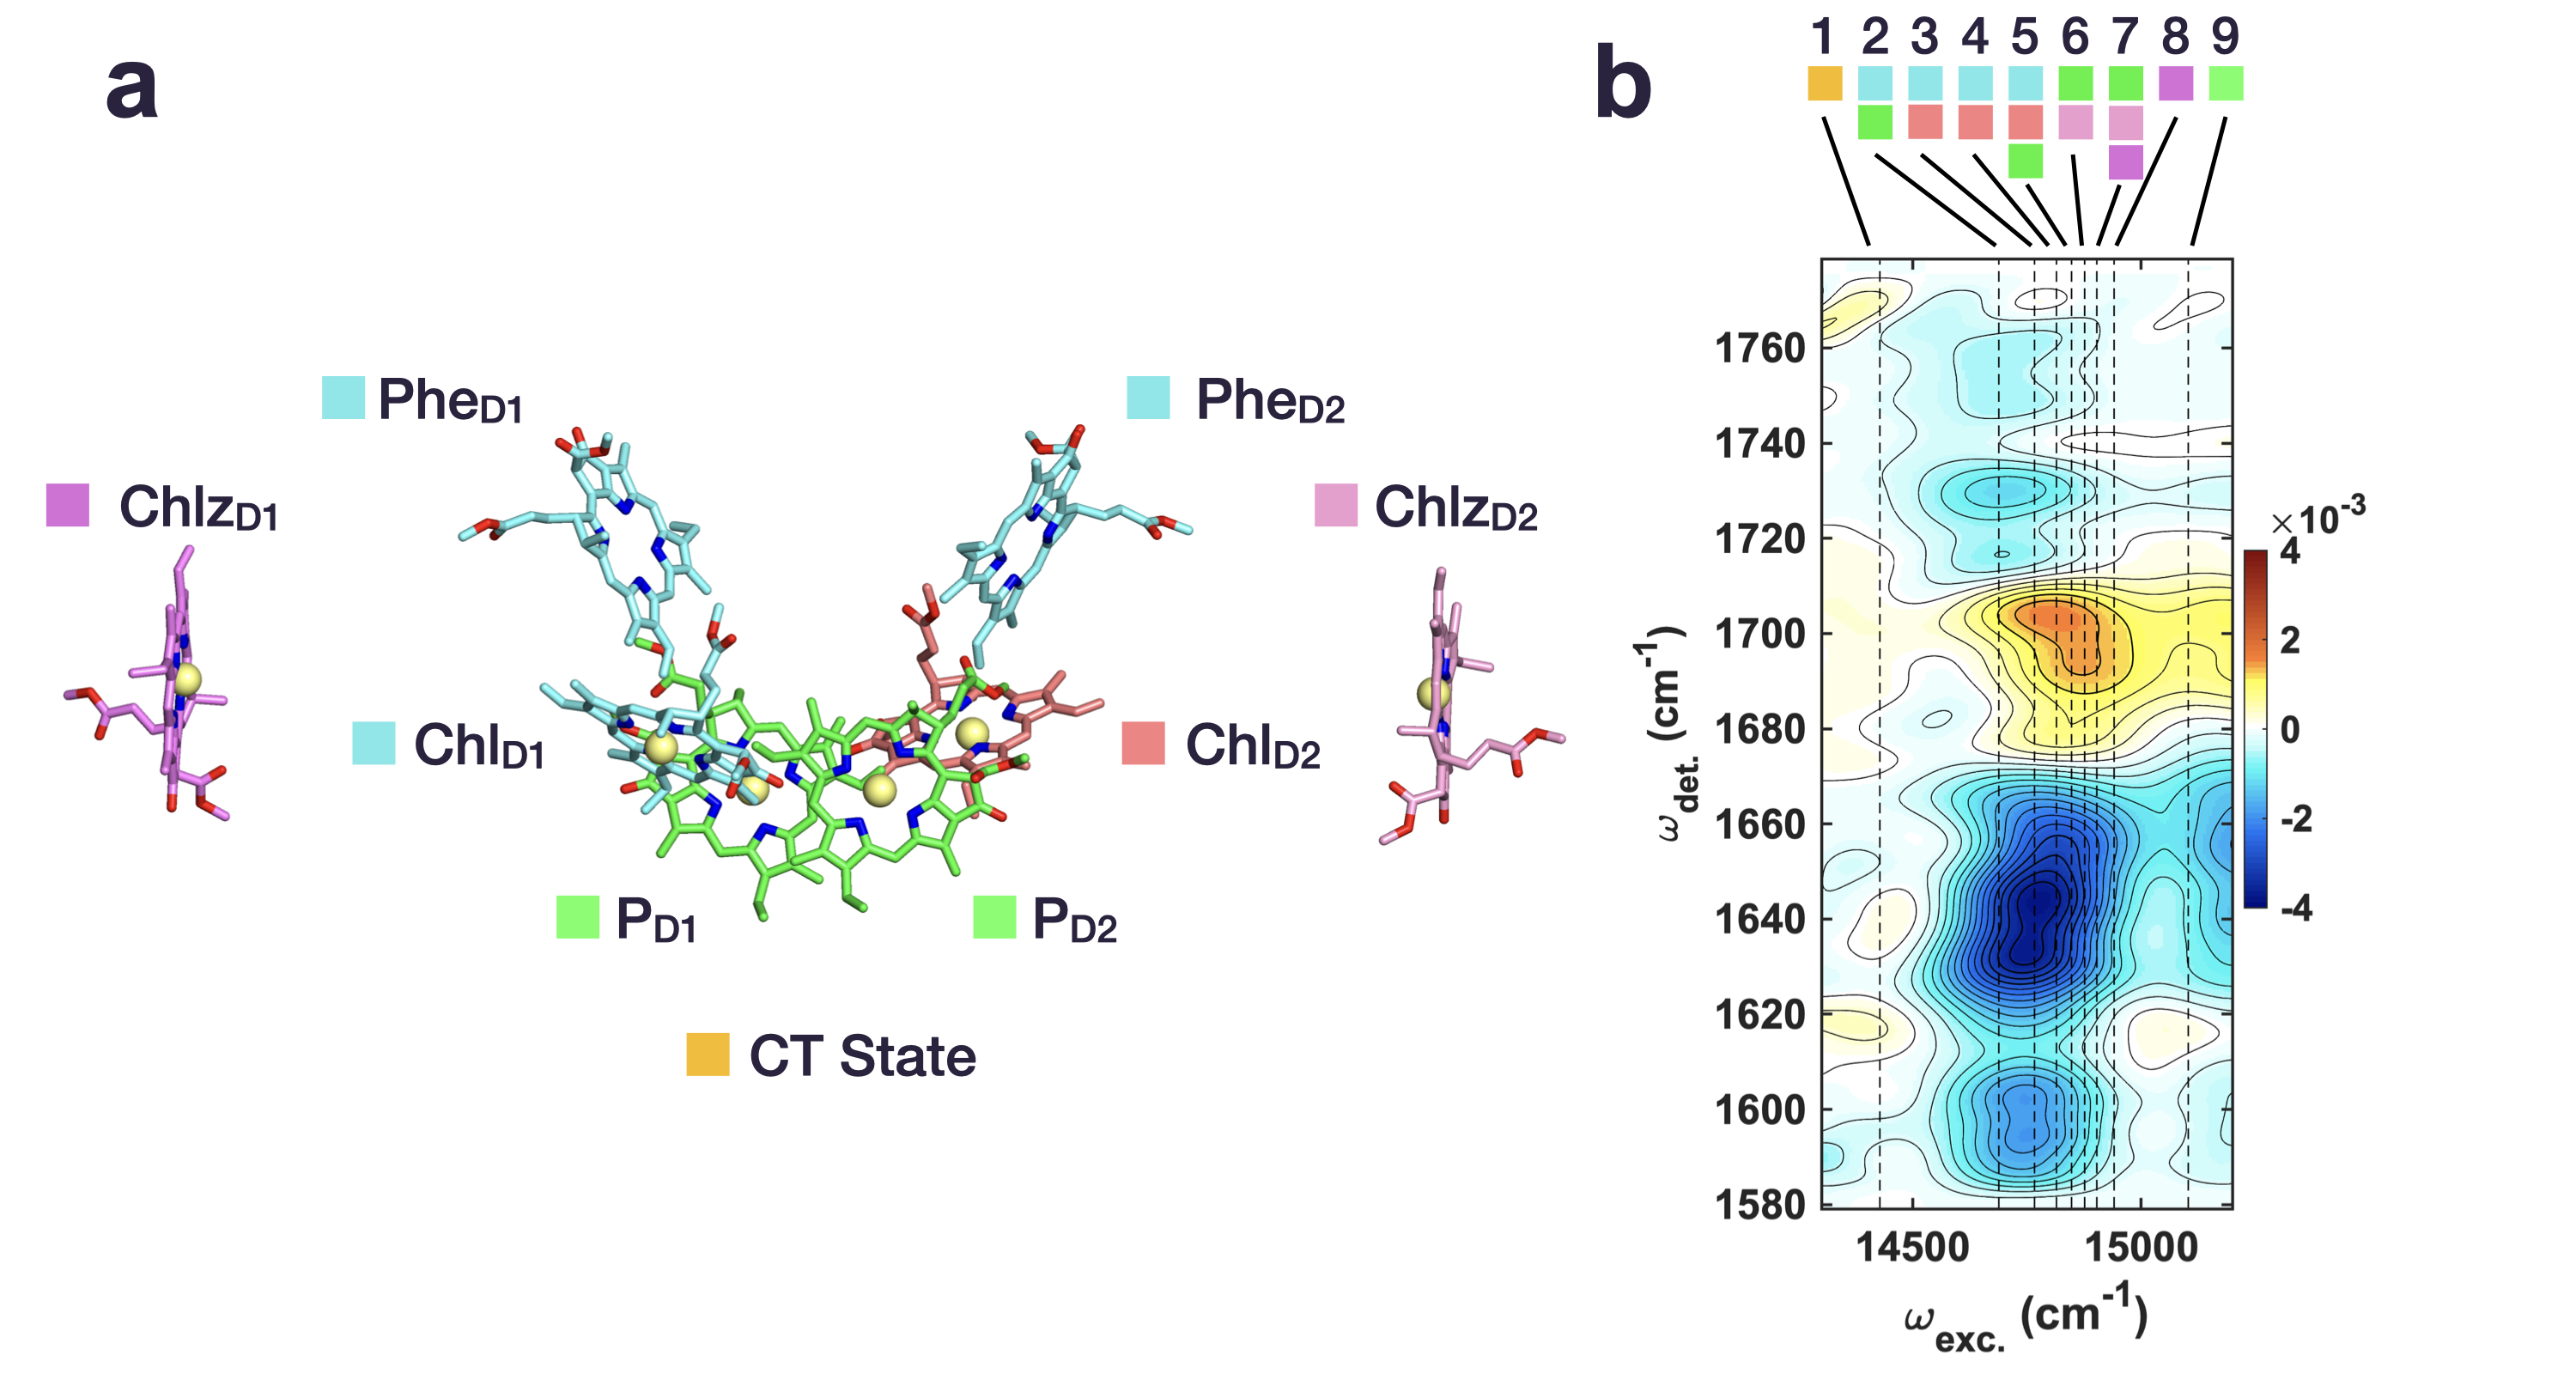
Photosynthesis, the green engine of life on Earth, produces molecular oxygen by using the light-driven water-plastoquinone oxidoreductase enzyme known as photosystem II.1–3 The photosystem II-reaction center (PSII-RC) is one of the smallest photosynthetic components which can undergo charge separation (CS) and thus is an ideal model system to investigate the underlying mechanism of the initial light-energy conversion process of photosynthesis.4–6 The PSII-RC consists of six pigments as central cofactors—two special pair chlorophylls (PD1 and PD2), two accessory chlorophylls (ChlD1 and ChlD2), and two pheophytins (PheD1 and PheD2)—arranged in a quasi-symmetric geometry (Figure 1a).7,8 These six molecules are generally referred to as RC pigments. In addition, there are two peripheral antenna Chls which are denoted as ChlzD1 and ChlzD2. Despite the similarity of the pigment arrangement in the D1 and D2 branches, electron transfer only proceeds along the D1 pigments. The specifics of how CS proceeds in the PSII-RC is, however, a matter of vivid debate. In particular, there remains a long-standing discussion concerned with whether the initial electron acceptor is PD19,10 or PheD1,11–13 i.e. whether the initial radical pair is (PD2+PD1-) or (ChlD1+PheD1-). The uncertainty here is a consequence of the many closely spaced excitonic states arising from pigment-pigment interactions in the PSII-RC such that no observable structure is present even in the electronic linear absorption spectrum at cryogenic temperatures.14–16
To this end, the excited state dynamics of the PSII-RC has been the focus of extensive spectroscopic interest spanning over three decades. These works have included time-resolved fluorescence,17,18 transient absorption,9,10,13,19–21 optical photon-echo,12 visible pump-mid infrared (IR) probe,11 and two-dimensional electronic spectroscopy (2DES)14,22–24 studies. While electronic spectroscopies acutely suffer from a lack of spectral resolution in regards to the PSII-RC, the implementation of mid-IR spectroscopy has proven to be highly advantageous in addressing issues related to spectral congestion.25–28 In particular, the keto and ester CO stretching modes of Chl and Phe show unique signatures in the mid-IR region depending on the local protein environment, electronic structure, and ionic states.11,29–33 Additionally, the amide I modes of the backbone protein can be used as sensitive reporters for the electron transfer.11,31 These were notably demonstrated by Groot et al. in a visible pump-mid IR probe study of the PSII-RC where it was suggested that the initial electron acceptor was Phe based on its distinguishing vibrational structure.11 However, the spectral resolution along the detection axis alone was not enough to disentangle the distinct excitonic contributions and dynamics or definitively assign the initial electron acceptor.
Many theoretical models have been developed in order to aid in experimental interpretation and to elucidate the nature the electronic states at difference absorption wavelengths. Particularly, Stark spectroscopy suggests that the absorption spectrum of PSII is not characterized by purely excitonic states, rather it is composed of mixed exciton-charge transfer (CT) states possibly including contributions from (ChlD1+PheD1-)* and (PD2+PD1-)*.34 In an attempt to model this, one of the most sophisticated exciton models of the PSII-RC takes into account eight pigments—the six RC and two peripheral pigments—and one CS state.35 Even in this model, there was uncertainty as to the character of the initial CS state because both PD2+PD1- and ChlD1+PheD1- gave reasonable fits to the data with the former yielding slightly better agreement to experimental data considered. It is important to note here that the experimental data was, however, entirely from electronic spectroscopies.
While uncertainty surrounds the involvement and extent of exciton-CT mixing in the PSII-RC, studies have suggested that the mixed CT states are responsible for the far-red excitation of PSII.36–38 Although the absorption of the PSII-RC and the required redox potential of water oxidation were believed to be located below 690 nm, it was demonstrated that PSII can be operated by the far red light beyond 690 nm (exhibiting activities including oxygen evolution).36,39 Additionally, recent EPR experimental37 and QM/MM theoretical38 studies suggest that the far-red light excitation of PSII involves a lower lying CT state with a hole localized on ChlD1 rather than PD2. However, just as spectral congestion obscures the assignment of the initial electron acceptor, the character of these mixed CT states remains undetermined.
Compared to the previously mentioned techniques, the emerging method of two-dimensional electronic-vibrational (2DEV) spectroscopy, which correlates electronic excitation and mid-IR detection,40–44 has the potential to overcome the challenges associated with congested electronic spectra. In particular, the simultaneous spectral resolution along both the visible excitation and IR detection axis has been shown to enable the clear assignment of transient species.41–44 In this study, we investigated the excited state dynamics of the PSII-RC via 2DEV spectroscopy. Both highly excitation frequency-dependent spectral structure and dynamics were clearly resolved. This allowed for a broad analysis of the excitonic composition of the PSII-RC and direct insight into the involvement of mixed exciton-CT states found to be directly prepared upon photoexcitation. Further, the spectra facilitated an assignment of the initial electron acceptor and enabled the excitation energy transfer (EET) and electron transfer pathways initiated by peripheral antenna excitation or RC pigments excitation to be disentangled.
2 RESULTS AND DISCUSSION
General insights from the 2DEV spectra and IR band assignments.
Figure 1b shows the 2DEV spectrum of the PSII-RC 170 fs after photoexcitation. Of note is the significant excitation frequency (exc.)-dependence of the vibrationally resolved structure along the detection axis (det.) which, as we will demonstrate, allows for an excitonic state-specific analysis of the spectra with high frequency resolution (i.e. vibrationally resolved excitonic structure). For example, photoinduced absorptions (PIA) spanning det. = 1,710-1,760 cm-1 were seen to clearly favor the lower-lying excitonic states. Other strong indications of this exc.-dependent behavior were observed in the ground state bleach (GSB) region spanning det. = 1,680-1,710 cm-1 and the PIAs at det. = 1,620-1,670 cm-1. These three regions are of particular interest because, here, vibrational modes belonging to both the neutral and ionic forms of Chl and Phe can be clearly distinguished—thus serving as sensitive markers for the EET and CT steps leading to CS as well as the character of the excitonic states.
The vibrational structure of the PSII-RC is not only highly exc.-dependent, but also shows a significant time-dependence. Therefore, our assignments will be based on the vibrational structure at specific exc. corresponding to the energies of exciton 2 (14,690 cm-1) and exciton 8 (14,940 cm-1) in the model by Novoderezhkin et al.,35 which covers the relevant pigments along the D1 branch, and at either early or later waiting times (Figure 2).
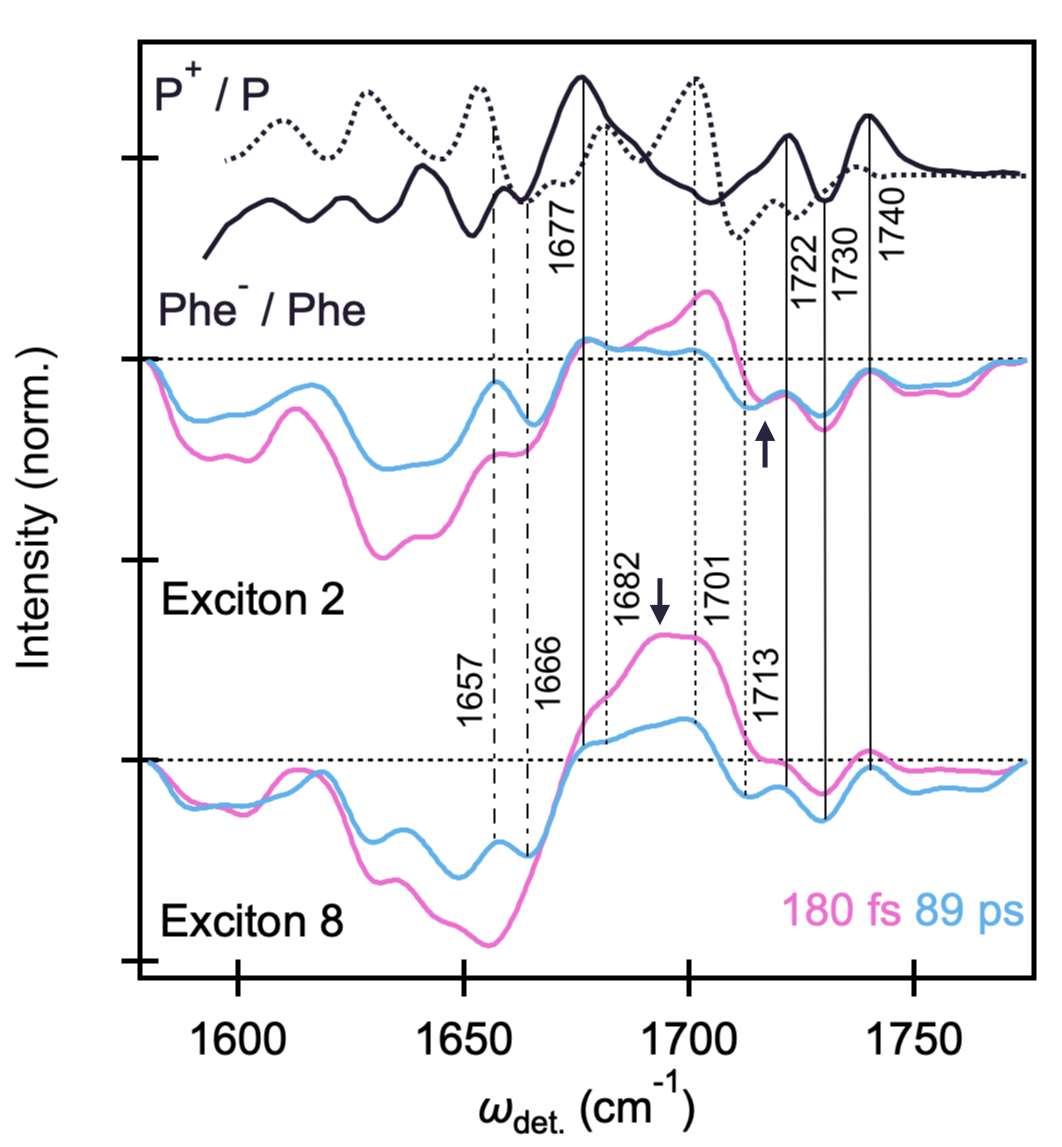
Generally, the GSB observed at det = 1,680-1,710 cm-1 is assigned to the keto CO stretching mode of Chl/Phe.29,31,32 On the electronic ground state, the frequency of this keto mode depends on the polarity of the environment and the presence of hydrogen bonding from surrounding media (the larger the polarity, or the stronger the hydrogen bond, the lower the frequency of the keto mode). Thus, the GSB can be used to broadly distinguish pigment contributions (further discussed in the next section). For example, in Figure 2, it is apparent at early waiting times that the GSB band of exciton 8 shows much more signal amplitude at 1,680-1,700 cm-1 compared to that of the exciton 2. This is in line with a light-induced FTIR difference spectroscopic study which reported that Chlz shows a GSB at 1,684 cm-1,31 whereas P and Phe exhibit higher and lower frequency GSBs at 1,704 cm-1 and 1677 cm-1, respectively.29,31,32
On the electronically excited state, the keto modes of Chl and Phe exhibit redshifted absorption.11,45 For example, in THF, the keto stretching mode in the previously measured Chl*/Chl difference spectrum was seen to shift from 1,695 cm-1 to 1,660 cm-1.11 Correspondingly, the negative signal at det = 1,620-1,670 cm-1 in both exciton 2 and 8 is broadly assigned to the excited state absorption (ESA) of the keto modes of Chl and Phe. At later waiting times, however, there is a notable evolution in the vibrational structure of this region (Figure 2). Focusing on exciton 2, a clear dip at 1,657 cm-1 appeared concomitantly with a new peak emerging at 1,666 cm-1. While both the P+/P and Phe-/Phe difference spectra exhibit features in this region at frequencies of 1,653-1,655 cm-1 and 1,659 cm-1,29,31,32 respectively, the signal for Phe-/Phe agrees more closely with the observed feature at 1,657 cm-1. Resonance Raman spectroscopy of PSII-RC shows no signal at 1640-1660 cm-1, thus Groot et al. and Noguchi et al. suggest that the band at 1657 cm-1 is assigned to the amide CO mode reflecting the CS at the RC, rather than keto stretching mode of Chl or Phe.11,31 The band at 1,666 cm-1 is similar to both Phe-/Phe and P+/P showing signal at 1,662 cm-1 and 1,663 cm-1,29,31,32 respectively, which has been suggested as a counterpart of the previously mentioned band.31 A more definitive assignment is reserved for later discussion.
This leaves the remaining PIA region spanning 1,710-1,760 cm-1. While the ester modes Chl* and Phe* fall in this region,11 they are known to be very weak and would unlikely account for the full intensity of the observed features. Further, assuming that this region is only composed of Chl* and Phe* ester modes would not account for the significant exc.-dependence clearly present in Figure 1b. If this was the case, then this region should have a near uniform intensity across excitons 3 through 7 which have similar pigment contributions and exciton transition dipole strengths,35 but this is clearly not so (Figure 1b). As a result, contributions from Chl* and Phe* ester modes are likely small, which should leave this a relatively clear spectral window, yet, strong features are apparent in the 2DEV spectra. The Phe-/Phe difference spectrum measured in PSII, however, shows characteristic signatures in this region, still related to the ester mode of chromophore itself or surrounding amino acid residue, with strong absorptions at 1,722 cm-1, 1,730 cm-1, and 1,739 cm-1 (Figure 2).29,32 The corresponding peaks in the 2DEV spectrum (at 1,722 cm-1, 1,730 cm-1, and 1,740 cm-1), apparent at early waiting times for exciton 2 and emerging later for exciton 8, are therefore assigned to Phe-. It should be noted that exciton 8 does show a slight negative signal around 1,730 cm-1 immediately after photoexcitation, despite being near fully characterized by ChlzD1. We attribute this signal to either slight contributions from the ester ESA, some degree of overlap between excitonic bands as these slices only represent the zero phonon transitions and the actual absorption has finite bandwidth. The ester mode of the Chl a cation (in THF), on the other hand, is known to blueshift from 1,738 cm-1 (neutral) to 1,750 cm-1.29 Yet, the P+/P difference spectrum (Figure 2) does not exhibit any corresponding characteristic absorptions in this region (the ester mode of P+ appears at 1,743 cm-1).30 Thus, the bands in this region, 1,750 cm-1 and 1,764 cm-1, are related to the intermediate Chl cation (ChlD1+) which are also clearly present in the structure of exciton 2 at early waiting times.
Further characteristic of the Chl a cation is a significantly blueshifted keto stretch, to 1,718 cm-1, (on the order of 25 cm-1) versus neutral Chl a in THF.33 At early waiting times in exciton 2, for example, a peak is oberved at 1,716 cm-1 which we assign to ChlD1+. However, at later waiting times, this peak noticeably redshifts to 1,713 cm-1, towards agreement with the characteristic P+ absorption at 1,711 cm-1. This dynamical behavior will be the focus of later discussion.
To summarize, the significant markers tracking CS in this study are as follows: Phe- (1,722 cm-1, 1,730 cm-1, and 1,740 cm-1), ChlD1+ (at early waiting times: 1,716 cm-1, 1,750 cm-1, and 1,764 cm-1), and P+ (at later waiting times: 1,713 cm-1). The GSB of the amide CO bands at 1,657 cm-1 and its up-shifted counterpart at 1,666 cm-1 reflecting the CS at RC, where the former likely has predominant contributions from Phe-, while the latter could potentially be a mixture of Phe- and P+.
Excitonic composition and charge transfer character. Following the vibrational assignments, we focus on a comparison of the vibrational structure at specific excitonic energies based on the model by Novoderezhkin et al.,35 in order to understand the character of the excitonic states and degree of CT mixing. Figure 3a shows the vibrational structure corresponding to exciton 1, 2, 5, and 8 at an early waiting time. We note again that the exciton energies discussed thus far are zero phonon lines (shown in Figure 1b). However, it has been reported that the actual absorption of the CT state shows a significant blue shift (~5 nm) as a result of coupling to low-frequency phonons in the environment, compared to other excitonic bands (1~2 nm).35 Thus, to investigate the CT state specifically, the 2DEV signal corresponding exciton 1 as shown in Figure 3a was integrated in the range exc = 14,500-14,650 cm-1.
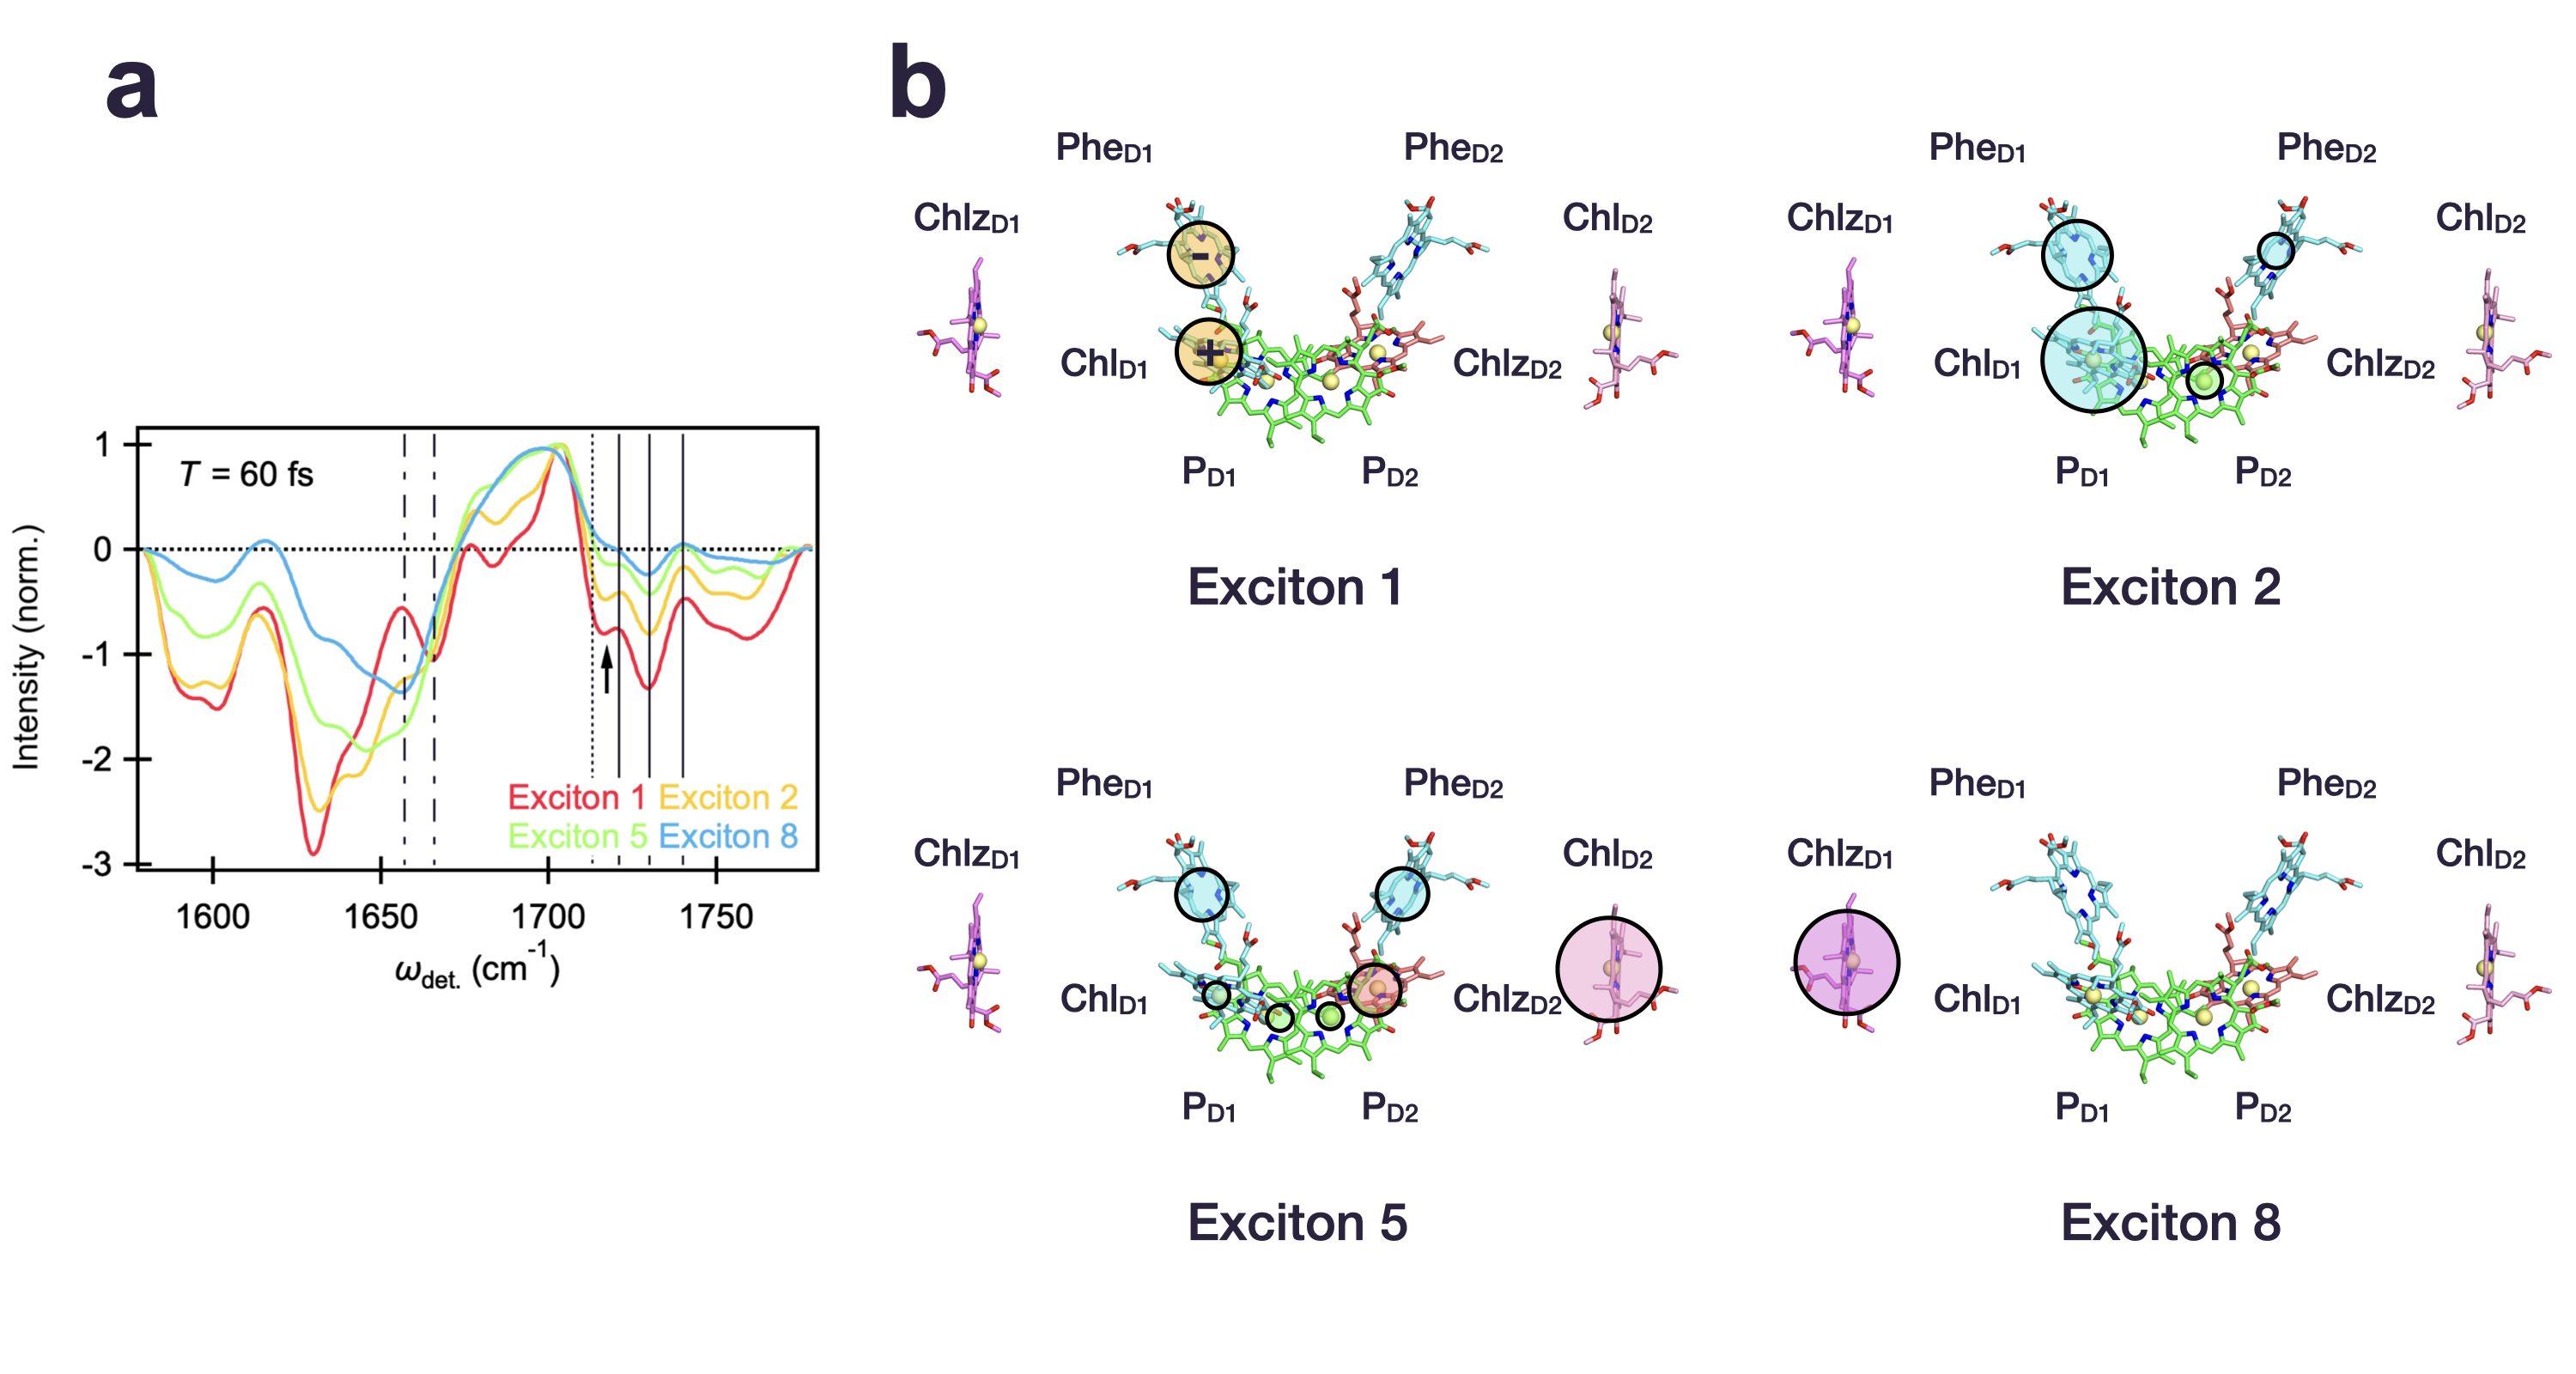
At early time, the exciton 1 signal, formed directly upon photoexcitation, shows clear structure corresponding to Phe- (1,722 cm-1, 1,730 cm-1, and 1,740 cm-1), ChlD1+ (1,716 cm-1, 1,750 cm-1, and 1,764 cm-1). In addition, the amide CO bands reflecting CS at 1,657 cm-1 and 1,666 cm-1 show clear structure compared on the other excitonic states, highlighting the significant CT character of exciton 1 state. The characteristic P+ signal (1,713 cm-1) only appears at later waiting times and is accompanied by evolution at both of the aforementioned band positions as well as a decay in the 1,750 cm-1 region assigned to ChlD1+ (Figure S1)—collectively indicating a conspicuous lack of initial contributions from P+.
The lack of P+ is in contrast to several previous spectroscopic studies that suggested there are two CS pathways in the PSII-RC.21,22,24,34 However, these experiments utilized spectroscopic methods solely in the visible region which are significantly disadvantaged when it comes to untangling the highly overlapping signals of the relevant states. In this case, the vibrational characterization of exciton 1 afforded by the application of 2DEV spectroscopy provides direct evidence that the initial CT state in the PSII-RC is characterized by ChlD1+Phe- rather than PD2+ PD1- (Figure 3b). Such a result is consistent with a recent QM/MM calculation, utilizing range-separated TD-DFT theory and the coupled cluster theory with single and double excitations (CCSD), which proposed that the lowest CT state was ChlD1+Phe-.38 A previous transient IR study also suggested that the initial electron acceptor is Phe,11 however, this study relied on an extrinsic deconvolution of the vibrational spectrum as opposed to the intrinsic ability of 2DEV spectroscopy to separate excitonic and CT contributions along the exc. dimension. This advantage of 2DEV spectroscopy is particularly useful in the characterization of the CT state which is only weakly optically allowed and can therefore be easily obscured in other spectroscopic methods.
Considering the other states, an analysis of the GSB features of exciton 2 and 8 characterize these excitons as predominantly composed of RC pigments in the active (D1) branch and of the peripheral ChlzD1, respectively, which is consistent with the model put forth by Novoderezhkin et al. (Figure 3b).35 These assignments also substantiate that Chl and Phe at different binding position in the PSII-RC are indeed excited by different excitation frequencies—offering support for the importance of the protein environment in tuning the site energies of the embedded pigments.38
Exciton 2 also notably displays characteristic ChlD1+ and Phe- signals at early waiting times (Figure 3a). In comparison to exciton 5, which is mainly composed of RC pigments in addition to ChlzD2 (Figure 3b), these CT signatures in exciton 2 are markedly more pronounced. Here, we have chosen exciton 5 as a representative for the energetically intermediate excitonic states, where there is congestion even in the 2DEV spectra. However, the vibrational structure is still telling in that the additional ChlzD2 contributions of exciton 5 should be similar to those of ChlzD1, which is indeed reflected in the fact that exciton 5 resembles a mixture of exciton 2 (mainly RC pigments) and exciton 8 (mainly composed of a peripheral pigment). This comparison highlights the enhanced CT character in exciton 2 versus exciton 5 at early waiting times which confirms the suggestion put forth in the model by Novoderezhkin et al.35 that exciton 2 is responsible for initiating primary charge separation. Further, in the model, exciton 1 was taken to be characterized by a CT state which borrowed intensity from the neighboring state, exciton 2. This is in agreement with the close resemblance between the GSB and ESA (particuarly below 1650 cm-1 which is outside of the dominant window for the CS markers) structure of exciton 1 compared to that of exciton 2 (Figure 3a) and signifies similar overall pigment contributions. This point is made even clearer on comparison of exciton 1 versus exciton 5 or 8 where there is little similarity in these regions. Correspondingly, this indicates that exciton 2 is characterized by a mixed exciton-CT state, rather than a purely excitonic state that rapidly evolves to the CT state. The mixed character between exciton 1 and 2 also offers a mechanism through which rapid charge separation can be initiated in the RC.
Charge separation dynamics. To elucidate the dynamics, a global analysis of the data with sequential modeling was performed. We note that while the time constants represent a convolution of various processes, this method is able to holistically capture the spectral evolution along both frequency dimensions. Therefore, the analysis captures the exc.-dependent spectra and dynamics, the latter which can be largely disentangled via vibrational signatures as we will show. The two-dimensional-evolution associated difference spectra (2D-EADS) analysis (Figure S1), which can be thought as the two-dimensional analogue of EADS,46 required five components for a reasonable fit (170 fs, 660 fs, 8.2 ps, 17 ps, and a non-decaying offset component beyond 100 ps, the duration of the experiment).
Figure 4 contains exciton-specific slices through the actual 2DEV spectra along det. at the earliest resolvable waiting time and at subsequent waiting times corresponding to each of the above mentioned time constants. Throughout, we focus our attention on excitons 2, 5, and 8 as these states have substantially more oscillator strength than exciton 1 and therefore will have a larger influence on the obtained time constants. The evolution associated with these time constants can be interpreted such that each spectrum (or slice) evolves into the next one with the associated time constant. For example, in exciton 2 (Figure 4b), spectral evolution on the 170 fs timescale can be understood through a comparison of the pink and yellow slices. Noticeably, there is growth at 1,657 cm-1, a characteristic marker for CS. However, in exciton 5 and 8 (Figure 4c and d, respectively) there is no such growth indicative of CS, rather there are only slight changes in the keto GSB and ESA regions. On the 660 fs timescale (comparison of the yellow and green slices in Figure 4b), exciton 2 exhibits further growth at 1,657 cm-1 and 1,666 cm-1 while a slight shoulder begins to emerge in this region for exciton 5. This evolution is also accompanied by marked changes in the keto ESA structure. We assign both the 170 fs and 660 fs timescales to progressive completion of CS, i.e. (ChlD1+Phe-)* ChlD1+Phe- (more pronounced for exciton 2), convoluted with EET within the excitonic manifold (more pronounced for exciton 5) and an environmental response. These timescales also agree with previous works which suggested that there is a fast component to the EET dynamics (100-200 fs time scale)12 and that initial CS occurs within 600-800 fs,11 among others which have reported multiexponential CS dynamics.21,24 The distinction here is that the vibrational structure allows for a targeted assessment of the dynamical components for each of the states.
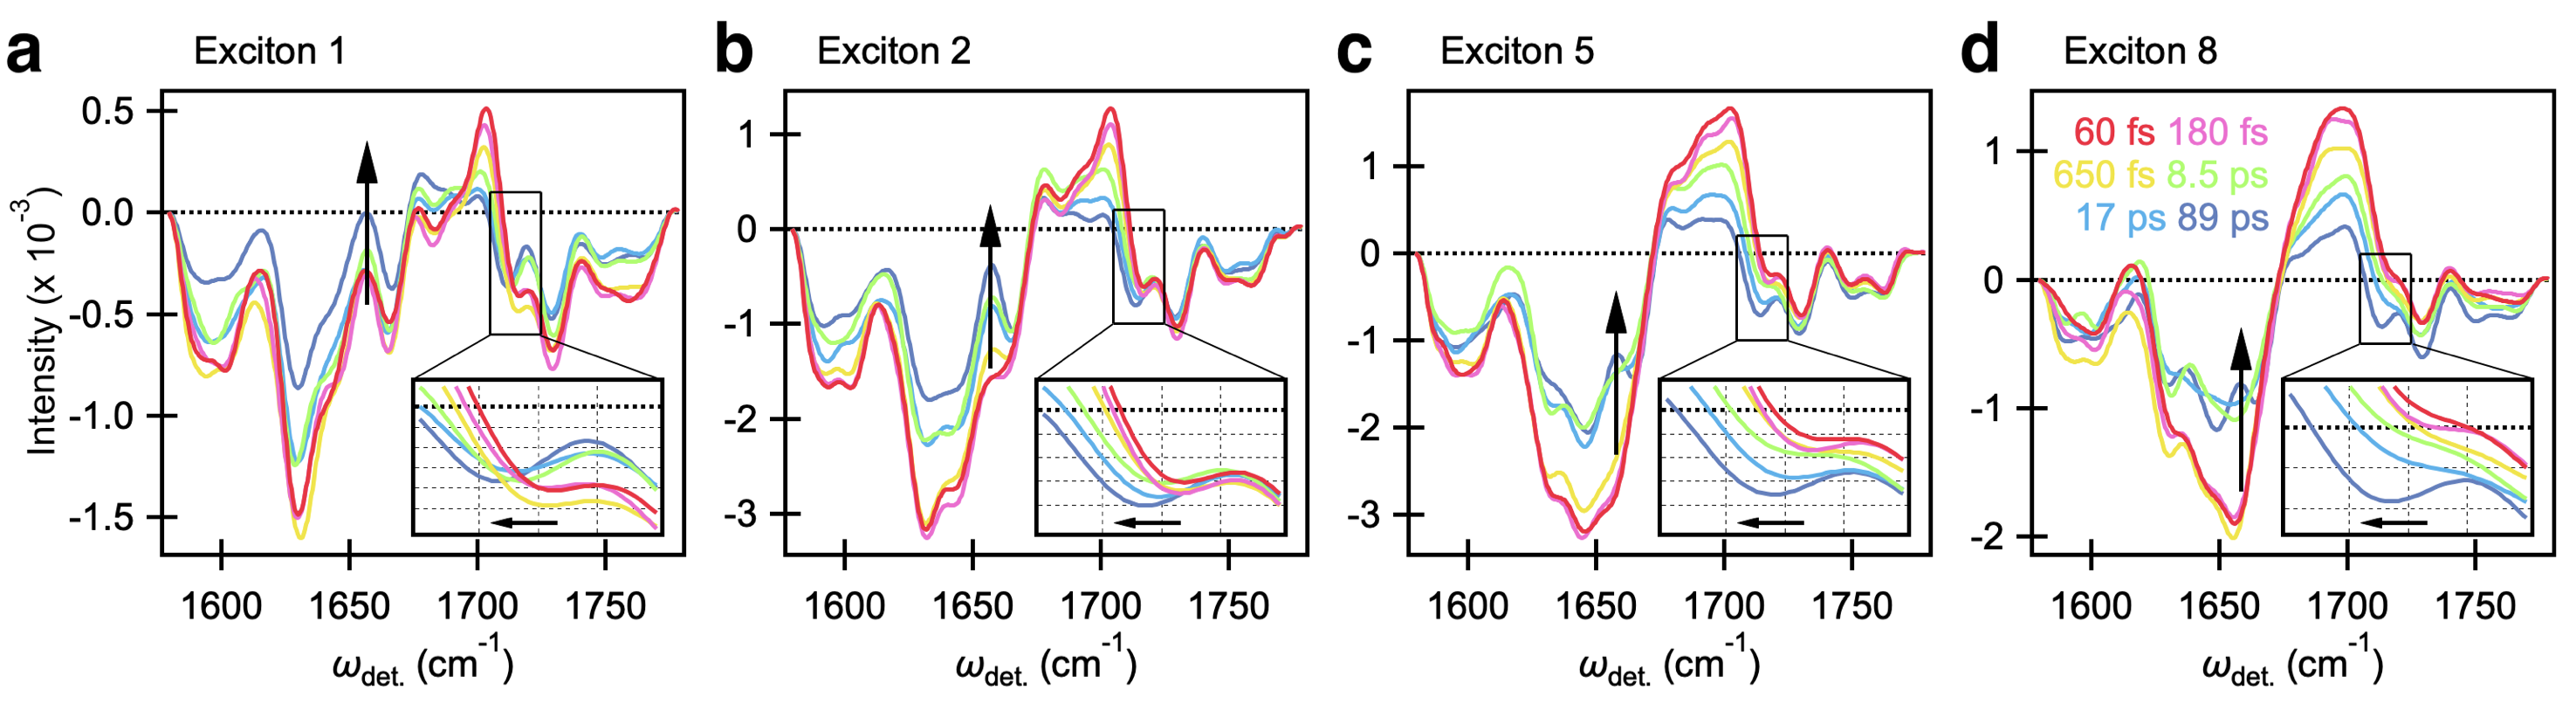
On an 8.2 ps timescale, both the 1,657 cm-1 and 1,666 cm-1 CS markers exhibit further evolution along with a distinct, progressive redshift in the band at 1,716 cm-1 to 1,713 cm-1 for excitons 1, 2, and 5. This component is similar to the previously reported timescale for ChlD1+Phe- P+Phe- of 6 ps.11 Additionally, in a previous light-induced FTIR difference spectroscopic study, it was proposed that the blue shift of the keto stretch of Chl cation is smaller for the charge delocalized dimeric Chl (~10 cm-1 in the case of P680+) compared to that of monomeric Chl (~30 cm-1).47 Both experimental47,48 and theoretical49,50 efforts further support that the P680 cation is partially delocalized over the PD1 and PD2 pigments. Thus, we assign the slight red shift as the hole migration towards a more delocalized cationic state, i.e. ChlD1+Phe- (PD1PD2)+Phe- (likely in addition to further environmental response to CS). Considering that the mode at 1,713 cm-1, the characteristic marker for P+, only appears on an 8.2 ps timescale, it is very unlikely that P+ contributes appreciably to the features at 1,657 cm-1 and 1,666 cm-1 at earlier waiting times. The evolution observed around 1,657 cm-1 and 1,666 cm-1 at later waiting times can therefore be understood as arising from both Phe- and P+.
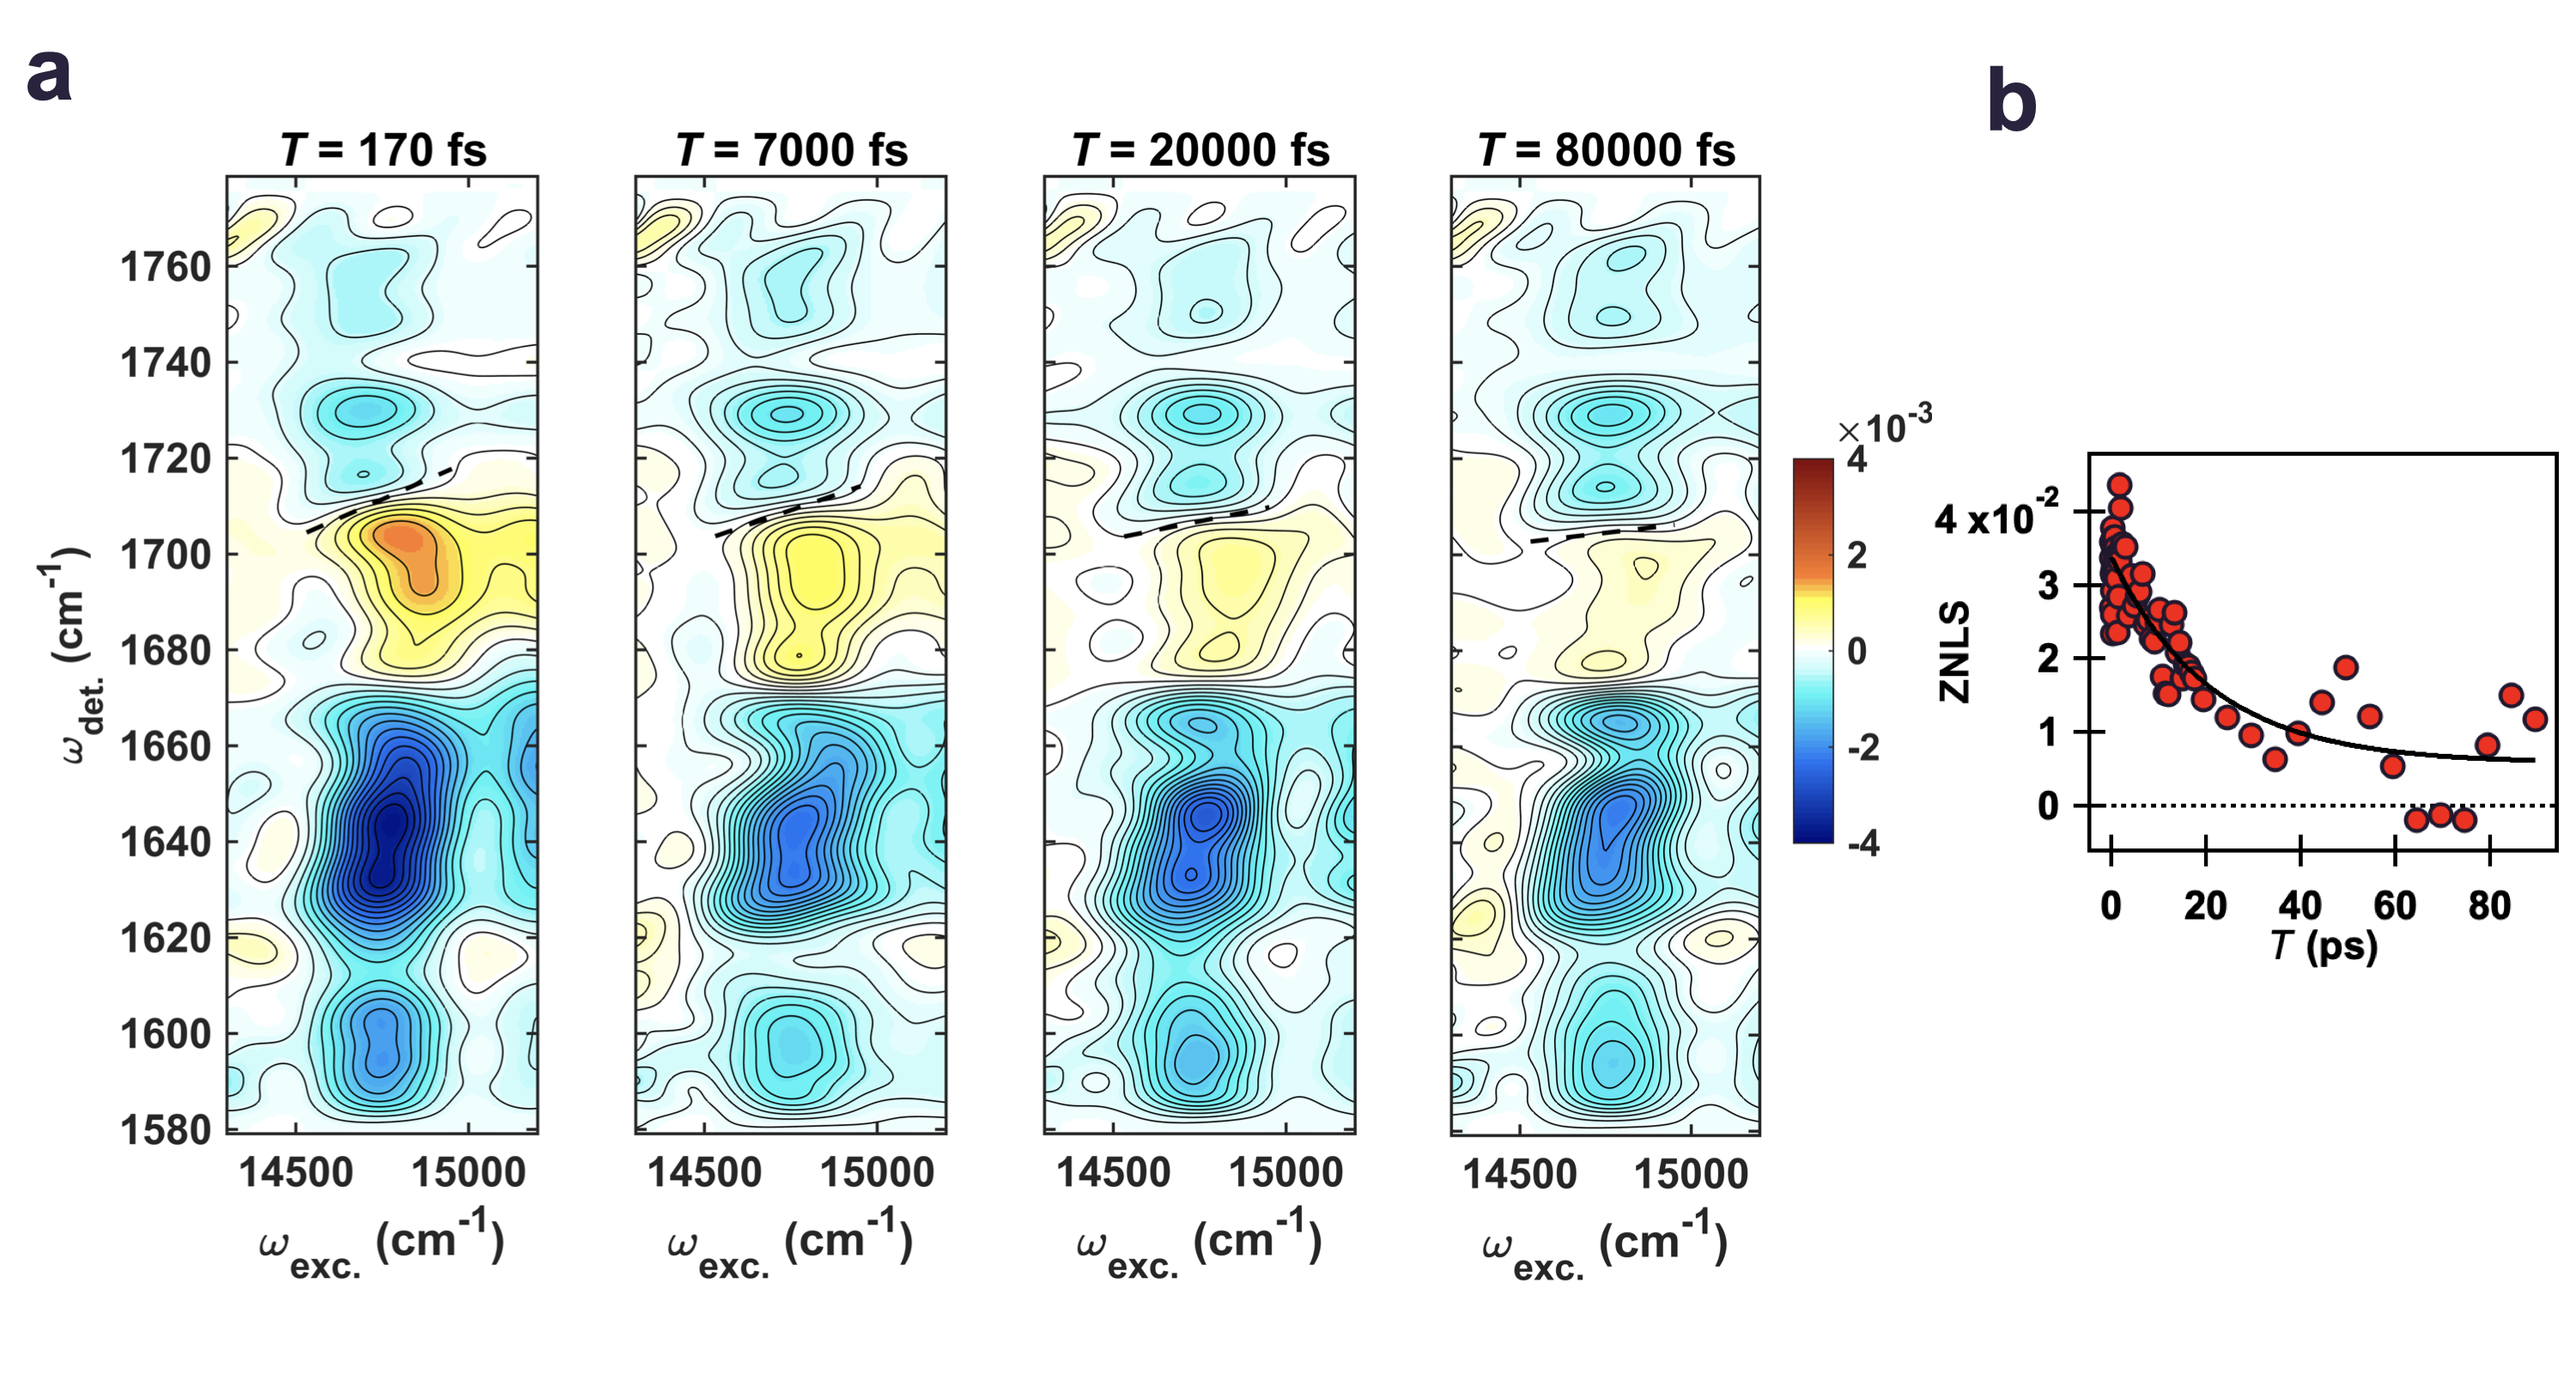
The final 17 ps component can be understood as predominantly reflecting CS limited by EET from peripheral Chlz to RC pigments as only significant evolution at the CS markers is observed on this timescale for exciton 8 (Figure 4d). This timescale is also captured by the zero node line slope (ZNLS) present at det = 1,710 cm-1 (Figure 5a, dotted line) in the spectra which decays with a time constant of 21 ± 4 ps (Figure 5b) and grossly indicates equilibration within the excitonic manifold. We note that while the ZNLS trends toward zero, a non-decaying component beyond the duration of the experiment (>100 ps) suggests the presence of the inhomogeneous CS due to the different conformational distributions of the proteins on the ground state.21 This timescale also falls within the previously established range (14 ps to 37 ps determined at temperatures of 77 K and 277 K, respectively) for EET from peripheral Chlz to RC pigments.13,19
Concluding comments. Our results demonstrate that the CT state can be prepared directly upon photoexcitation, which is characterized by ChlD1’+Phe’- (’ > ), and indicate that CS is facilitated by exciton-CT mixing with a contribution from (ChlD1+Phe-)* throughout the excitonic manifold. The data further establishes that the initial electron acceptor in the PSII-RC is Phe with no appreciable competition from PD1—independent of excitation wavelength. These results are entirely in agreement with the recent theoretical work of Sirohiwal et al. where the ChlD1+Phe- CT state was found to be the lowest energy excitation globally within the PSII-RC.38 Further, no similarly low energy CT states involving PD1PD2 were found,38 thus theoretically excluding the special pair as a candidate for initial CS as our experimental data supports. This is notably distinct from the bacterial RC where CS is largely initiated at the special pair (P) with the A branch bacteriochlorophyll (BChl) acting as the primary acceptor. The distinct excitation asymmetry in the PSII-RC has been rationalized as a direct consequence of the electrostatic effect of the protein environment which likely arose as an evolutionary accommodation of water splitting in oxygenic photosynthetic systems (particularly its operation in the far-red).36–38 However, this remains an open question as the initial CS step itself in the has long evaded clear characterization.
ACKNOWLEDGMENTS
We thank Rafael Picorel for advice regarding isolation of the PSII-RC. This research was supported by the U.S. Department of Energy, Office of Science, Basic Energy Sciences, Chemical Sciences, Geosciences, and Biosciences Division. Y.Y. appreciates the support of the Japan Society for the Promotion of Science (JSPS) Postdoctoral Fellowship for Research Abroad. E.A.A. acknowledges the support of the National Science Foundation Graduate Research Fellowship (Grant No. DGE 1752814).
REFERENCES
1. Wydrzynski, T. J., Satoh, K. & Freeman, J. A. Photosystem II The Light-Driven Water:Plastoquinone Oxidoreductase. vol. 22 (Springer Netherlands, 2005).
2. Blankenship, R. E. Molecular Mechanisms of Photosynthesis, 2nd Edition. (Wiley, 2014).
3. Shen, J.-R. The Structure of Photosystem II and the Mechanism of Water Oxidation in Photosynthesis. Annu. Rev. Plant Biol. 66, 23–48 (2015).
4. Renger, G. & Renger, T. Photosystem II: The machinery of photosynthetic water splitting. Photosynth. Res. 98, 53–80 (2008).
5. Croce, R. & Van Amerongen, H. Light-harvesting and structural organization of Photosystem II: From individual complexes to thylakoid membrane. J. Photochem. Photobiol. B Biol. 104, 142–153 (2011).
6. Romero, E., Novoderezhkin, V. I. & Van Grondelle, R. Quantum design of photosynthesis for bio-inspired solar-energy conversion. Nature 543, 355–365 (2017).
7. Loll, B., Kern, J., Saenger, W., Zouni, A. & Biesiadka, J. Towards complete cofactor arrangement in the 3.0 Å resolution structure of photosystem II. Nature 438, 1040–1044 (2005).
8. Umena, Y., Kawakami, K., Shen, J.-R. R. & Kamiya, N. Crystal structure of oxygen-evolving photosystem II at a resolution of 1.9Å. Nature 473, 55–60 (2011).
9. Shelaev, I. V. et al. Primary light-energy conversion in tetrameric chlorophyll structure of photosystem II and bacterial reaction centers: II. Femto- and picosecond charge separation in PSII D1/D2/Cyt b559 complex. Photosynth. Res. 98, 95–103 (2008).
10. Nadtochenko, V. A., Semenov, A. Y. & Shuvalov, V. A. Formation and decay of P680 (PD1-PD2) +PheoD1- radical ion pair in photosystem II core complexes. Biochim. Biophys. Acta - Bioenerg. 1837, 1384–1388 (2014).
11. Groot, M. L. et al. Initial electron donor and acceptor in isolated Photosystem II reaction centers identified with femtosecond mid-IR spectroscopy. Proc. Natl. Acad. Sci. 102, 13087–13092 (2005).
12. Prokhorenko, V. I. & Holzwarth, A. R. Primary processes and structure of the photosystem II reaction center: A photon echo study. J. Phys. Chem. B 104, 11563–11578 (2000).
13. Holzwarth, A. R. et al. Kinetics and mechanism of electron transfer in intact photosystem II and in the isolated reaction center: Pheophytin is the primary electron acceptor. Proc. Natl. Acad. Sci. 103, 6895–6900 (2006).
14. Myers, J. A. et al. Two-Dimensional Electronic Spectroscopy of the D1-D2-cyt b559 Photosystem II Reaction Center Complex. J. Phys. Chem. Lett. 1, 2774–2780 (2010).
15. Durrant, J. R. et al. A multimer model for P680, the primary electron donor of photosystem II. Proc. Natl. Acad. Sci. U. S. A. 92, 4798–4802 (1995).
16. Raszewski, G., Diner, B. A., Schlodder, E. & Renger, T. Spectroscopic properties of reaction center pigments in photosystem II core complexes: Revision of the multimer model. Biophys. J. 95, 105–119 (2008).
17. Crystall, B. et al. Observation of Multiple Radical Pair States in Photosystem 2 Reaction Centers. Biochemistry 30, 7573–7586 (1991).
18. Konermann, L., Gatzen, G. & Holzwarth, A. R. Primary processes and structure of the photosystem II reaction center. 5. Modeling of the fluorescence kinetics of the D1-D2-cyt-b559 complex at 77 K. J. Phys. Chem. B 101, 2933–2944 (1997).
19. Visser, H. M. et al. Subpicosecond transient absorption difference spectroscopy on the reaction center of photosystem II: Radical pair formation at 77 K. J. Phys. Chem. 99, 15304–15309 (1995).
20. Groot, M. L. et al. Charge separation in the reaction center of photosystem II studied as a function of temperature. Proc. Natl. Acad. Sci. U. S. A. 94, 4389–4394 (1997).
21. Romero, E., Van Stokkum, I. H. M., Novoderezhkin, V. I., Dekker, J. P. & Van Grondelle, R. Two different charge separation pathways in photosystem II. Biochemistry 49, 4300–4307 (2010).
22. Romero, E. et al. Quantum coherence in photosynthesis for efficient solar-energy conversion. Nat. Phys. 10, 676–682 (2014).
23. Fuller, F. D. et al. Vibronic coherence in oxygenic photosynthesis. Nat. Chem. 6, 706–711 (2014).
24. Duan, H.-G. et al. Primary Charge Separation in the Photosystem II Reaction Center Revealed by a Global Analysis of the Two-dimensional Electronic Spectra. Sci. Rep. 7, 12347 (2017).
25. Groot, M. L., Van Wilderen, L. J. G. W. & Di Donato, M. Time-resolved methods in biophysics. 5. Femtosecond time-resolved and dispersed infrared spectroscopy on proteins. Photochem. Photobiol. Sci. 6, 501–507 (2007).
26. Di Donato, M. & Groot, M. L. Ultrafast infrared spectroscopy in photosynthesis. Biochim. Biophys. Acta - Bioenerg. 1847, 2–11 (2015).
27. Breton, J. Fourier transform infrared spectroscopy of primary electron donors in type I photosynthetic reaction centers. Biochim. Biophys. Acta - Bioenerg. 1507, 180–193 (2001).
28. Noguchi, T. & Berthomieu, C. Molecular Analysis by Vibrational Spectroscopy. in Photosystem II: The Light-Driven Water:Plastoquinone Oxidoreductase (eds. Wydrzynski, T. J., Satoh, K. & Freeman, J. A.) 367–387 (Springer Netherlands, 2005). doi:10.1007/1-4020-4254-X_17.
29. Nabedryk, E. et al. Characterization of bonding interactions of the intermediary electron acceptor in the reaction center of Photosystem II by FTIR spectroscopy. Biochim. Biophys. Acta - Bioenerg. 1016, 49–54 (1990).
30. Breton, J., Hienerwadel, R. & Nabedryk, E. FTIR Difference Spectrum of the Photooxidation of the Primary Electron Donor of Photosystem II. in Spectroscopy of Biological Molecules: Modern Trends 101–102 (Springer Netherlands, 1997). doi:10.1007/978-94-011-5622-6_44.
31. Noguchi, T., Tomo, T. & Inoue, Y. Fourier transform infrared study of the cation radical of P680 in the photosystem II reaction center: Evidence for charge delocalization on the chlorophyll dimer. Biochemistry 37, 13614–13625 (1998).
32. Noguchi, T., Tomo, T. & Kato, C. Triplet formation on a monomeric chlorophyll in the photosystem II reaction center as studied by time-resolved infrared spectroscopy. Biochemistry 40, 2176–2185 (2001).
33. Nabedryk, E., Leonhard, M., Mäntele, W. & Breton, J. Fourier Transform Infrared Difference Spectroscopy Shows No Evidence for an Enolization of Chlorophyll a upon Cation Formation either in Vitro or during P700 Photooxidation. Biochemistry 29, 3242–3247 (1990).
34. Romero, E. et al. Mixed exciton-charge-transfer states in photosystem II: Stark spectroscopy on site-directed mutants. Biophys. J. 103, 185–194 (2012).
35. Novoderezhkin, V. I., Dekker, J. P. & van Grondelle, R. Mixing of Exciton and Charge-Transfer States in Photosystem II Reaction Centers: Modeling of Stark Spectra with Modified Redfield Theory. Biophys. J. 93, 1293–1311 (2007).
36. Thapper, A., Mamedov, F., Mokvist, F., Hammarström, L. & Styring, S. Defining the far-red limit of photosystem II in Spinach. Plant Cell 21, 2391–2401 (2009).
37. Pavlou, A., Jacques, J., Ahmadova, N., Mamedov, F. & Styring, S. The wavelength of the incident light determines the primary charge separation pathway in Photosystem II. Sci. Rep. 8, 1–11 (2018).
38. Sirohiwal, A., Neese, F. & Pantazis, D. A. Protein Matrix Control of Reaction Center Excitation in Photosystem II. J. Am. Chem. Soc. 142, 18174–18190 (2020).
39. Pettai, H., Oja, V., Freiberg, A. & Laisk, A. Photosynthetic activity of far-red light in green plants. Biochim. Biophys. Acta - Bioenerg. 1708, 311–321 (2005).
40. Oliver, T. A. A., Lewis, N. H. C. & Fleming, G. R. Correlating the motion of electrons and nuclei with two-dimensional electronic-vibrational spectroscopy. Proc. Natl. Acad. Sci. 111, 10061–10066 (2014).
41. Lewis, N. H. C. et al. Observation of Electronic Excitation Transfer Through Light Harvesting Complex II Using Two-Dimensional Electronic–Vibrational Spectroscopy. J. Phys. Chem. Lett. 7, 4197–4206 (2016).
42. Arsenault, E. A. et al. Vibronic mixing enables ultrafast energy flow in light-harvesting complex II. Nat. Commun. 11, 1460 (2020).
43. Arsenault, E. A., Yoneda, Y., Iwai, M., Niyogi, K. K. & Fleming, G. R. The role of mixed vibronic Qy-Qx states in green light absorption of light-harvesting complex II. Nat. Commun. 11, 6011 (2020).
44. Yoneda, Y. et al. Electron–Nuclear Dynamics Accompanying Proton-Coupled Electron Transfer. J. Am. Chem. Soc. 143, 3104–3112 (2021).
45. Groot, M. L., Breton, J., Van Wilderen, L. J. G. W., Dekker, J. P. & Van Grondelle, R. Femtosecond visible/visible and visible/mid-IR pump-probe study of the photosystem II core antenna complex CP47. J. Phys. Chem. B 108, 8001–8006 (2004).
46. Van Stokkum, I. H. M., Larsen, D. S. & Van Grondelle, R. Global and target analysis of time-resolved spectra. Biochim. Biophys. Acta - Bioenerg. 1657, 82–104 (2004).
47. Okubo, T., Tomo, T., Sugiura, M. & Noguchi, T. Perturbation of the structure of P680 and the charge distribution on its radical cation in isolated reaction center complexes of photosystem II as revealed by fourier transform infrared spectroscopy. Biochemistry 46, 4390–4397 (2007).
48. Diner, B. A. et al. Site-directed mutations at D1-His198 and D2-His197 of photosystem II in Synechocystis PCC 6803: Sites of primary charge separation and cation and triplet stabilization. Biochemistry 40, 9265–9281 (2001).
49. Saito, K. et al. Distribution of the cationic state over the chlorophyll pair of the photosystem II reaction center. J. Am. Chem. Soc. 133, 14379–14388 (2011).
50. Narzi, D., Bovi, D., De Gaetano, P. & Guidoni, L. Dynamics of the Special Pair of Chlorophylls of Photosystem II. J. Am. Chem. Soc. 138, 257–264 (2016).
Author contributions
Y.Y. and G.R.F. conceived the research. Y.Y., E.A.A., and K.O. performed the 2DEV experiments. Y.Y. analyzed the experimental data. M.I. prepared the sample. Y.Y., E.A.A., and G.R.F. wrote the manuscript. All authors discussed the results and contributed to the manuscript.
Competing financial interests
The authors declare no competing financial interests.
See pages - of SI.pdf