Comprehensive Broadband X-ray and Multiwavelength Study of Active Galactic Nuclei in Local 57 Ultra/luminous Infrared Galaxies Observed with NuSTAR and/or Swift/BAT
Abstract
We perform a systematic X-ray spectroscopic analysis of 57 local ultra/luminous infrared galaxy systems (containing 84 individual galaxies) observed with Nuclear Spectroscopic Telescope Array and/or Swift/BAT. Combining soft X-ray data obtained with Chandra, XMM-Newton, Suzaku and/or Swift/XRT, we identify 40 hard (10 keV) X-ray detected active galactic nuclei (AGNs) and constrain their torus parameters with the X-ray clumpy torus model XCLUMPY (Tanimoto2019). Among the AGNs at , for which sample biases are minimized, the fraction of Compton-thick ( cm) AGNs reaches 64% (6/9 sources) in late mergers, while 24% (3/14 sources) in early mergers, consistent with the tendency reported by Ricci2017bMNRAS. We find that the bolometric AGN luminosities derived from the infrared data increase, but the X-ray to bolometric luminosity ratios decrease, with merger stage. The X-ray weak AGNs in late mergers ubiquitously show massive outflows at sub-pc to kpc scales. Among them, the most luminous AGNs ( erg s) have relatively small column densities of 10 cm and almost super-Eddington ratios ( 1.0). Their torus covering factors () are larger than those of Swift/BAT selected AGNs with similarly high Eddington ratios. These results suggest a scenario that, in the final stage of mergers, multiphase strong outflows are produced due to chaotic quasi-spherical inflows and the AGN becomes extremely X-ray weak and deeply buried due to obscuration by inflowing and/or outflowing material.
1 Introduction
For understanding the coevolution of galaxy and supermassive black hole (SMBH), gas-rich galaxy mergers (i.e., major mergers) are considered as a key phenomenon. Many theoretical studies (e.g., Hopkins2006) suggest that major mergers trigger both intense star formation in the galaxies and mass accretion onto the SMBHs, being enshrouded by a huge amount of gas and dust. This makes them appear as luminous and ultraluminous infrared galaxies (U/LIRGs; Sanders1996 for a review)111LIRGs and ULIRGs are defined by using the total 8–1000 m luminosities of = 10–10 and 10, respectively. containing obscured active galactic nuclei (AGNs). ULIRGs may be in a prephase of quasi stellar objects (quasars) where star forming activities become relatively weak. Thus, studies of ULIRGs are indispensable to reveal the whole history of star formation and SMBH growth triggered by major mergers.
Recent numerical simulations of galaxy mergers (e.g., Kawaguchi2020) predict that the mass accretion rates can exceed the Eddington limits as the separation of the two SMBHs decreases. However, the nuclear environments of accreting SMBHs in U/LIRGs have been still veiled in mystery. This is because the central regions in the final phase of mergers become deeply “buried” with large covering factors, where even the direction of the lowest dust column-density can be opaque to the ionizing UV photons (e.g., Imanishi2006; Imanishi2008; Yamada2019). To shed light on the properties of these hidden AGNs, hard X-rays (10 keV) are useful thanks to their high penetrating power against obscuration.222Considering the relation between -band extinction and hydrogen column density of the Galactic interstellar medium, / = cm mag (Draine2003), the penetration depth of 10 keV X-rays corresponds to at least mag. In fact, Ricci2017bMNRAS identity 25 AGNs in 30 interacting U/LIRGs with the Nuclear Spectroscopic Telescope Array (NuSTAR; Harrison2013) and/or Swift/BAT, which cover the 3–79 keV and 14–195 keV bands, respectively. They also report that the fraction of Compton-thick (CT; with hydrogen column densities cm) AGNs is significantly larger (%) in late mergers than in early ones (%). This indicates that the AGNs in late stage mergers are indeed deeply buried by CT material.
To best constrain the properties of obscuring material (“torus”) in AGNs through X-ray observations, construction of spectral models based on the realistic geometries of AGN tori is crucial. Since many studies indicate that the torus structure is clumpy (e.g., Krolik1988; Wada2002; Honig2007; Laha2020), Tanimoto2019 develop the X-ray clumpy torus model called XCLUMPY, which adopts the same geometry as that of the infrared (IR) CLUMPY model (Nenkova2008a; Nenkova2008b). The model is applied to the broadband X-ray spectra of nearby AGNs to constrain their torus covering factors (e.g., Miyaji2019; Tanimoto2020; Tanimoto2021; Toba2020; Ogawa2021; Uematsu2021).
To understand the connection between mass accretion and obscuration in mergers, investigation of differences in the AGN structure between mergers and nonmergers may provide us with a clue. Yamada2020 apply the XCLUMPY model to the spectra of two “nonmerging LIRGs” and find that their AGNs are not buried, unlike those in late mergers. This implies that accreting environments are different between major mergers and secular processes. From a statistical study of Swift/BAT selected AGNs, whose majority are nonmergers, Ricci2017cNature suggest that the torus structure is regulated by radiation pressure from the AGN. Thus, studies of AGNs in U/LIRGs will enable us to answer if the same physics works or not in deeply buried AGNs in major mergers.
Comparison of X-ray luminosities333In this paper, we define “absorption-corrected X-ray luminosities” of an AGN in the 2–10 keV and 10–50 keV bands, and , as those corrected for line-of-sight absorption that is recognized in the X-ray spectra. It remains possible, however, that a part of the X-ray emission from the innermost region is completely blocked by optically thick material and hence the true X-ray luminosity could be underestimated, as discussed in Section LABEL:subsub6-1-6_Unified-view. with bolometric ones inferred from infrared observations also provide us with information on the AGN physics in U/LIRGs. Teng2015 report that the bolometric-to-X-ray luminosity ratio () of the AGN in an ULIRG is much larger (i.e., X-ray weak), –, than that of a normal AGN, for which typically (e.g., Vasudevan2007). The reason for the difference is not clear. To answer this question, comprehensive multiwavelength investigation of a large number of AGNs in U/LIRGs is required.
In this work, we carry out a systematic X-ray spectral study of a sample of 57 local U/LIRG systems (containing 84 individual galaxies) observed with NuSTAR and/or Swift/BAT by combining the available soft X-ray data of Chandra, XMM-Newton, Suzaku, and/or Swift/XRT. The paper is structured as follows. Section 2 describes our sample and merger classification. Details of the X-ray observations and data reduction are presented in Section 3. Section 4 describes our X-ray spectral analysis. In Section LABEL:S5_results we compare our X-ray results with those of previous multiwavelength observations. In Section LABEL:S6_discussion we discuss the origin of the X-ray weakness, torus structure, and the connection between AGN and starburst activities. Section LABEL:S7_conclusion summarizes our main conclusions. In two companion papers (Ricci2021b; C. Ricci et al., in preparation) we will discuss: i) the evolution of obscuration along the merger sequence, and ii) the relation between X-ray emission and multiwavelength proxies of AGN activity. The cosmological parameters adopted are = 70 km s Mpc, = 0.3, and = 0.7. All uncertainties are quoted at the 90% confidence level unless otherwise stated.
2 Sample Description
2.1 Sample Selection
The IRAS Revised Bright Galaxy Sample (RBGS; Sanders2003) is an all-sky survey of IR galaxies having the IRAS 60 m flux densities above 5.24 Jy and Galactic latitude . Our targets are taken from the GOALS sample (Armus2009), which is a complete subset of the RBGS with an 8–1000 m luminosity threshold of consisting of 180 LIRGs and 22 ULIRGs at redshifts .
Most of the U/LIRGs in GOALS are interacting systems (Haan2011a; Stierwalt2013). In total 244 and 246 nuclei are observed with the Spitzer SH and LH IRS modules, respectively, within the 202 U/LIRG systems (Inami2013). In X-rays, the presence of AGNs in the individual nuclei is investigated with Chandra for 106 systems (C-GOALS; Iwasawa2011; Torres-Alba2018). Ricci2017bMNRAS report the nuclear AGN/starburst activities of 30 interacting systems in GOALS, basically using NuSTAR observations. In this work, we select all 57 U/LIRG systems (containing 84 galaxies) in the GOALS sample observed with NuSTAR by 2020 April and/or detected with Swift/BAT in the 105-month data. NGC 232/NGC 235 is the only system that is detected with Swift/BAT but not has been observed with NuSTAR. Our sample consists of 46 merging and 11 nonmerging U/LIRG systems.
2.2 Merger Stages
We adopt the visually derived merger stage classification of Stierwalt2013, which is mainly based on the Hubble Space Telescope (HST) and Spitzer/IRAC 3.6 m images. According to their results and recent works (e.g., Ricci2017bMNRAS), we divide the morphologies into five designations: “stage-A” (galaxy pairs prior to a first encounter); “stage-B” (post-first-encounter with galaxy disks still symmetric and in tact but with signs of tidal tails); “stage-C” (showing amorphous disks, tidal tails, and other signs of merger activity); “stage-D” (two nuclei in a common envelop); and “stage-N” (no signs of merger activity or massive neighbors). Hereafter, stage-A and B galaxies are assigned as “early mergers”, stage-C and D sources are “late mergers”, and stage-N objects are “nonmergers”.
There remain possibilities that some stage-N sources, such as NGC 7130 (Davies2014), are past mergers. In general, however, it is very difficult to distinguish whether a stage-N source is a past merger or not. Also, it is reported that they show different properties of star formation and AGN obscuration from those of stage-D mergers (e.g., Shangguan2019; Yamada2019). Thus, we treat these objects as stage-N in this work. Moreover, we re-categorize the merger stages for the seven systems by the following reasons:
-
1.
NGC 1068: the galaxy is a LIRG in the GOALS sample but is not classified by Stierwalt2013. Although NGC 1068 may show tidally induced structures of a past minor merger (Tanaka2017), the host galaxy is morphologically similar to a normal spiral galaxy. As the case of NGC 7130, we treat it as a stage-N source.
-
2.
ESO 203-1: the system is assigned as a stage-D merger by Stierwalt2013. The HST images show, however, that it is an early merger with two nuclei separated by 8 kpc (Haan2011a; Ricci2021b). We thus regard it as a stage-B merger.
-
3.
NGC 4418 and MCG+00-32-013: the brighter galaxy, NGC 4418, is classified as a stage-N LIRG, but recent works (Varenius2017; Boettcher2020) suggest that the central starburst activity would be enhanced by the nearby dwarf galaxy MCG+00-32-013 with the separation of 29.4 kpc. Since no clear feature of galactic interaction is evident, we classify it as a stage-A merger.
-
4.
MCG–03-34-064: the source is classified as a stage-A merger consisting of MCG–03-34-064 and its nearby galaxy MCG–03-34-063, whose angular separation is 1062. However, they have different redshifts, 0.0165 and 0.0213, respectively. Alonso-Herrero2012 also report this point. Thus, we re-classify the brighter IR source MCG–03-34-064 as a stage-N object.
-
5.
IC 4518A and IC 4518B: the system is a LIRG in the GOALS sample, but is not classified by Stierwalt2013. We treat it as a stage-B merger according to Ricci2017bMNRAS, who report signs of tidal interactions and the separation of 12 kpc in the optical and IR images.
-
6.
IRAS F18293–3413: the galaxy is assigned as a stage-C merger by Stierwalt2013. As noted by Ricci2017bMNRAS, however, the HST imaging shows that the two sources do not share a common envelop, and the object seems to be in a past merger (Haan2011a). Considering the much smaller size of the companion source, we re-categorized it as a stage-N object.
| IRAS Name | Object Name | R.A. | Decl. | M | log() | IRS | |||
|---|---|---|---|---|---|---|---|---|---|
| (J2000) | (J2000) | (arcsec) | (kpc) | () | |||||
| F00085–1223 | NGC 34 | 00:11:06.61 | 12:06:28.33 | 0.0196 | D | S | S | 11.49 | Y |
| F00163–1039 N | MCG–02-01-052 | 00:18:50.15 | 10:21:41.49 | 0.0273 | B | 56.1 | 30.7 | [11.48] | n |
| F00163–1039 S | MCG–02-01-051 | 00:18:50.90 | 10:22:36.49 | 0.0271 | B | 56.1 | 30.7 | 11.48 | Y |
| F00344–3349 | ESO 350-38 | 00:36:52.49 | 33:33:17.23 | 0.0206 | C | 5.2 | 2.2 | 11.28 | Y |
| F00402–2349 W | NGC 232 | 00:42:45.81 | 23:33:40.69 | 0.0226 | B | 120.8 | 54.7 | [11.44]: | Y |
| F00402–2349 E | NGC 235 | 00:42:52.81 | 23:32:27.71 | 0.0222 | B | 120.8 | 54.7 | [11.44]: | Y |
| F00506+7248 E | MCG+12-02-001 | 00:54:03.94 | +73:05:05.23 | 0.0157 | C | 0.9 | 0.3 | 11.50 | Y |
| F01053–1746 W | IC 1623A | 01:07:46.49 | 17:30:22.50 | 0.0201 | C | 15.7 | 6.4 | [11.71] | n |
| F01053–1746 E | IC 1623B | 01:07:47.57 | 17:30:25.04 | 0.0203 | C | 15.7 | 6.4 | 11.71 | Y |
| F02071–1023 W2 | NGC 833 | 02:09:20.85 | 10:07:59.11 | 0.0129 | A | 56.4 | 15.3 | [11.05]: | Y |
| F02071–1023 W | NGC 835 | 02:09:24.61 | 10:08:09.31 | 0.0136 | A | 56.4 | 15.3 | [11.05]: | Y |
| F02071–1023 E | NGC 838 | 02:09:38.56 | 10:08:46.12 | 0.0128 | A | 148.8 | 39.1 | [11.05]: | Y |
| F02071–1023 S | NGC 839 | 02:09:42.73 | 10:11:01.64 | 0.0129 | A | 148.8 | 39.1 | [11.05]: | Y |
| F02401–0013 | NGC 1068 | 02:42:40.77 | 00:00:47.84 | 0.0038 | N | n | n | 11.40 | Y |
| F03117+4151 N | UGC 2608 | 03:15:01.41 | +42:02:08.39 | 0.0233 | N | n | n | 11.41 | Y |
| F03117+4151 S | UGC 2612 | 03:15:14.60 | +41:58:50.51 | 0.0318 | N | n | n | [11.41] | Y |
| F03164+4119 | NGC 1275 | 03:19:48.16 | +41:30:42.11 | 0.0176 | N | n | n | 11.26 | Y |
| F03316–3618 | NGC 1365 | 03:33:36.46 | 36:08:26.37 | 0.0055 | N | n | n | 11.00 | Y |
| F04454–4838 | ESO 203-1 | 04:46:49.54 | 48:33:29.90 | 0.0529 | B | 7.5 | 7.7 | 11.86 | Y |
| F05054+1718 W | CGCG 468-002W | 05:08:19.71 | +17:21:48.09 | 0.0175 | B | 29.5 | 10.3 | [11.22]: | Y |
| F05054+1718 E | CGCG 468-002E | 05:08:21.21 | +17:22:08.34 | 0.0168 | B | 29.5 | 10.3 | [11.22]: | Y |
| F05189–2524 | IRAS F05189–2524 | 05:21:01.40 | 25:21:45.27 | 0.0426 | D | S | S | 12.16 | Y |
| F06076–2139 N | IRAS F06076–2139 | 06:09:45.79 | 21:40:23.52 | 0.0374 | C | 8.3 | 6.2 | 11.65 | Y |
| F06076–2139 S | 2MASS 06094601–2140312 | 06:09:46.01 | 21:40:31.26 | 0.0374 | C | 8.3 | 6.2 | [11.65] | n |
| F08354+2555 | NGC 2623 | 08:38:24.02 | +25:45:16.29 | 0.0185 | D | S | S | 11.60 | Y |
| F08520–6850 W | ESO 060-IG016 West | 08:52:29.36 | 69:02:01.07 | 0.0451 | B | 15.4 | 13.6 | [11.82] | n |
| F08520–6850 E | ESO 060-IG016 East | 08:52:32.05 | 69:01:55.74 | 0.0451 | B | 15.4 | 13.6 | 11.82 | Y |
| F08572+3915 | IRAS F08572+3915 | 09:00:25.36 | +39:03:54.23 | 0.0580 | D | 4.4 | 5.6 | 12.16 | Y |
| F09320+6134 | UGC 5101 | 09:35:51.69 | +61:21:10.52 | 0.0394 | D | S | S | 12.01 | Y |
| F09333+4841 W | MCG+08-18-012 | 09:36:30.86 | +48:28:10.46 | 0.0252 | A | 65.3 | 33.6 | [11.34] | n |
| F09333+4841 E | MCG+08-18-013 | 09:36:37.19 | +48:28:27.86 | 0.0259 | A | 65.3 | 33.6 | 11.34 | Y |
| F10015–0614 S | MCG–01-26-013 | 10:03:57.03 | 06:29:47.12 | 0.0161 | A | 108.8 | 36.5 | [11.37] | n |
| F10015–0614 N | NGC 3110 | 10:04:02.12 | 06:28:29.12 | 0.0169 | A | 108.8 | 36.5 | 11.37 | Y |
| F10038–3338 | ESO 374-IG032 | 10:06:04.58 | 33:53:05.55 | 0.0340 | D | S | S | 11.78 | Y |
| F10257–4339 | NGC 3256 | 10:27:51.28 | 43:54:13.55 | 0.0094 | D | 5.1 | 1.0 | 11.64 | Y |
| F10565+2448 | IRAS F10565+2448 | 10:59:18.13 | +24:32:34.74 | 0.0431 | D | 7.4 | 6.7 | 12.08 | Y |
| F11257+5850 W | NGC 3690 West | 11:28:31.00 | +58:33:41.20 | 0.0102 | C | 22.0 | 4.6 | [11.93]: | Y |
| F11257+5850 E | NGC 3690 East | 11:28:33.70 | +58:33:47.20 | 0.0104 | C | 22.0 | 4.6 | [11.93]: | Y |
| F12043–3140 N | ESO 440-58 | 12:06:51.80 | 31:56:47.00 | 0.0232 | B | 11.8 | 5.5 | [11.43]: | Y |
| F12043–3140 S | MCG–05-29-017 | 12:06:51.87 | 31:56:58.75 | 0.0228 | B | 11.8 | 5.5 | [11.43]: | Y |
| F12112+0305 | IRAS F12112+0305 | 12:13:46.11 | +02:48:41.50 | 0.0733 | D | 3.0 | 4.1 | 12.36 | Y |
| F12243–0036 NW | NGC 4418 | 12:26:54.63 | 00:52:39.51 | 0.0073 | A | 179.9 | 29.4 | 11.19 | Y |
| F12243–0036 SE | MCG+00-32-013 | 12:27:04.53 | 00:54:21.14 | 0.0074 | A | 179.9 | 29.4 | [11.19] | n |
| F12540+5708 | Mrk 231 | 12:56:14.23 | +56:52:25.24 | 0.0422 | D | S | S | 12.57 | Y |
| F12590+2934 S | NGC 4922S | 13:01:24.51 | +29:18:30.15 | 0.0239 | C | 22.1 | 10.6 | [11.38] | n |
| F12590+2934 N | NGC 4922N | 13:01:25.27 | +29:18:49.88 | 0.0236 | C | 22.1 | 10.6 | 11.38 | Y |
| F13126+2453 | IC 860 | 13:15:03.51 | +24:37:07.80 | 0.0112 | N | n | n | 11.14 | Y |
| 13120–5453 | IRAS 13120–5453 | 13:15:06.38 | 55:09:22.60 | 0.0308 | D | S | S | 12.32 | Y |
| F13188+0036 | NGC 5104 | 13:21:23.12 | +00:20:33.38 | 0.0186 | N | n | n | 11.27 | Y |
| F13197–1627 | MCG–03-34-064 | 13:22:24.48 | 16:43:42.09 | 0.0165 | N | n | n | 11.28 | Y |
| F13229–2934 | NGC 5135 | 13:25:44.06 | 29:50:01.24 | 0.0137 | N | n | n | 11.30 | Y |
| F13362+4831 S | Mrk 266B | 13:38:17.35 | +48:16:31.90 | 0.0276 | B | 10.1 | 5.6 | [11.56]: | Y |
| F13362+4831 N | Mrk 266A | 13:38:17.78 | +48:16:41.02 | 0.0279 | B | 10.1 | 5.6 | [11.56]: | Y |
| F13428+5608 | Mrk 273 | 13:44:42.07 | +55:53:13.17 | 0.0378 | D | 0.9 | 0.7 | 12.21 | Y |
| F14348–1447 | IRAS F14348–1447 | 14:37:38.32 | 15:00:23.97 | 0.0827 | D | 3.4 | 5.2 | 12.39 | Y |
| F14378–3651 | IRAS F14378–3651 | 14:40:59.01 | 37:04:31.94 | 0.0681 | D | S | S | 12.23 | Y |
| F14544–4255 W | IC 4518A | 14:57:41.18 | 43:07:55.49 | 0.0163 | B | 35.5 | 11.5 | 11.23 | Y |
| F14544–4255 E | IC 4518B | 14:57:44.41 | 43:07:52.69 | 0.0155 | B | 35.5 | 11.5 | [11.23] | n |
| F15250+3608 | IRAS F15250+3608 | 15:26:59.43 | +35:58:37.23 | 0.0552 | D | 0.7 | 0.8 | 12.08 | Y |
| F15327+2340 W | Arp 220W | 15:34:57.22 | +23:30:11.49 | 0.0181 | D | 1.0 | 0.4 | [12.28]: | Y(u) |
| F15327+2340 E | Arp 220E | 15:34:57.29 | +23:30:11.34 | 0.0181 | D | 1.0 | 0.4 | [12.28]: | Y(u) |
| F16504+0228 S | NGC 6240S | 16:52:58.90 | +02:24:03.36 | 0.0245 | D | 1.7 | 0.8 | [11.93]: | Y(u) |
| F16504+0228 N | NGC 6240N | 16:52:58.92 | +02:24:05.03 | 0.0245 | D | 1.7 | 0.8 | [11.93]: | Y(u) |
| F16577+5900 N | NGC 6285 | 16:58:24.02 | +58:57:21.23 | 0.0190 | B | 91.0 | 34.5 | [11.37] | Y |
| F16577+5900 S | NGC 6286 | 16:58:31.38 | +58:56:10.21 | 0.0183 | B | 91.0 | 34.5 | 11.37 | Y |
| F17138–1017 | IRAS F17138–1017 | 17:16:35.70 | 10:20:38.00 | 0.0173 | D | S | S | 11.49 | Y |
| F18293–3413 | IRAS F18293–3413 | 18:32:41.18 | 34:11:27.46 | 0.0182 | N | S | S | 11.88 | Y |
| F19297–0406 | IRAS F19297–0406 | 19:32:22.30 | 04:00:01.79 | 0.0857 | D | S | S | 12.45 | Y |
| F20221–2458 SW | NGC 6907 | 20:25:06.94 | 24:48:38.16 | 0.0106 | B | 43.9 | 9.4 | 11.11 | Y |
| F20221–2458 NE | NGC 6908 | 20:25:08.97 | 24:48:04.11 | 0.0102 | B | 43.9 | 9.4 | [11.11] | n |
| 20264+2533 W | NGC 6921 | 20:28:28.84 | +25:43:24.19 | 0.0145 | A | 91.4 | 26.5 | [11.11] | n |
| 20264+2533 E | MCG+04-48-002 | 20:28:35.06 | +25:44:00.18 | 0.0139 | A | 91.4 | 26.5 | 11.11 | Y |
| F20550+1655 NW | II Zw 096 | 20:57:23.63 | +17:07:44.60 | 0.0355 | C | 11.6 | 8.1 | [11.94]: | Y |
| F20550+1655 SE | IRAS F20550+1655 SE | 20:57:24.08 | +17:07:34.96 | 0.0350 | C | 11.6 | 8.1 | [11.94]: | Y |
| F20551–4250 | ESO 286-19 | 20:58:26.82 | 42:38:59.42 | 0.0430 | D | S | S | 12.06 | Y |
| F21453–3511 | NGC 7130 | 21:48:19.49 | 34:57:04.73 | 0.0162 | N | n | n | 11.42 | Y |
| F23007+0836 S | NGC 7469 | 23:03:15.67 | +08:52:25.28 | 0.0163 | A | 79.7 | 26.2 | 11.65 | Y |
| F23007+0836 N | IC 5283 | 23:03:18.00 | +08:53:37.13 | 0.0160 | A | 79.7 | 26.2 | [11.65] | n |
| F23128–5919 | ESO 148-2 | 23:15:46.77 | 59:03:15.94 | 0.0446 | C | 4.5 | 3.9 | 12.06 | Y |
| F23157+0618 | NGC 7591 | 23:18:16.27 | +06:35:09.11 | 0.0165 | N | n | n | 11.12 | Y |
| F23254+0830 W | NGC 7674 | 23:27:56.70 | +08:46:44.24 | 0.0289 | A | 33.3 | 19.5 | 11.56 | Y |
| F23254+0830 E | MCG+01-59-081 | 23:27:58.75 | +08:46:57.88 | 0.0295 | A | 33.3 | 19.5 | [11.56] | n |
| 23262+0314 W | NGC 7679 | 23:28:46.67 | +03:30:40.99 | 0.0171 | A | 269.8 | 93.8 | 11.11 | Y |
| 23262+0314 E | NGC 7682 | 23:29:03.90 | +03:32:00.00 | 0.0171 | A | 269.8 | 93.8 | [11.11] | n |
Note. — Columns: (1) IRAS name; (2) object name; (3–4) the best available source right ascension and declination (J2000) in CDS Portal (based on SIMBAD; http://cdsportal.u-strasbg.fr/); (5) redshift in NASA/IPAC Extragalactic Database (NED); (6) merger stage as classified from the Hubble Space Telescope (HST) and IRAC 3.6 m imaging (Stierwalt2013); (7–8) the separation between the two nuclei in arcsec and kpc. S and n mean that a single nucleus is observed in merging and nonmerging U/LIRGs, respectively; (9) logarithmic total IR luminosity in units of (Armus2009). Values in brackets should be upper limits due to contamination from nearby much brighter (or equally bright with the suffix “:”) IR sources. (10) Y and n mark detection and nondetection with Spitzer/IRS in the 10–20 m (SH) or 19–38 m (LH) band, respectively (Alonso-Herrero2012; Mazzarella2012; Inami2013). The (u) means that the two nuclei are not clearly divided.
References: The source positions in Column (3–4) and the separations in Column (7–8) are adopted from the references: (a) Haan2011a; (b) Zezas2003; (c) Alonso-Herrero2020; (d) Scoville2017; (e) Puccetti2016; (f) NED; (g) Kunth2003; (h) Ricci2017bMNRAS; (i) Imanishi2020; (j) Imanishi2014; (k) Scoville2000; (l) Zenner1993.
-
7
NGC 6907 and NGC 6908: NGC 6907 is classified as stage-N but Madore2007 suggest that NGC 6907 and the dwarf galaxy NGC 6908 are interacting and show tidal signatures. The separation is 9.4 kpc. Thus, we treated them as a stage-B merger.
2.3 Basic Information on Individual Objects
To obtain the accurate galaxy separations in mergers, we refer to the central positions not only from the SIMBAD but also from the literature. We finally confirm them via visual inspection in the optical images (observed with HST, PanSTARRS, SDSS, and/or DSS2), the mid-IR images (with Spitzer/IRAC 1–4), and/or the soft X-ray images (with Chandra and/or XMM-Newton). The basic properties of our targets and their references are summarized in Table 1.
In this work, we utilize the hard X-ray observations with NuSTAR to identify the AGNs in local U/LIRGs. To determine which galaxy in the system contains an AGN, we firstly check the peak position in the NuSTAR 8–24 keV image against the galaxy positions (see Section 4.1). In many cases, however, NuSTAR cannot resolve the merging systems because their angular separations are smaller than the angular resolution (a full-width at half-maximum (FWHM) of 18″ and a half power diameter of 58″). In such cases, it is also possible that a system actually contain more than one AGNs. Thus, we also refer to the soft X-ray (i.e., Chandra and/or XMM-Newton) and other multiwavelength data to confirm the presence of AGN(s) in each system as reported in Appendix LABEL:Appendix-B.
2.4 Characteristics of Our Sample
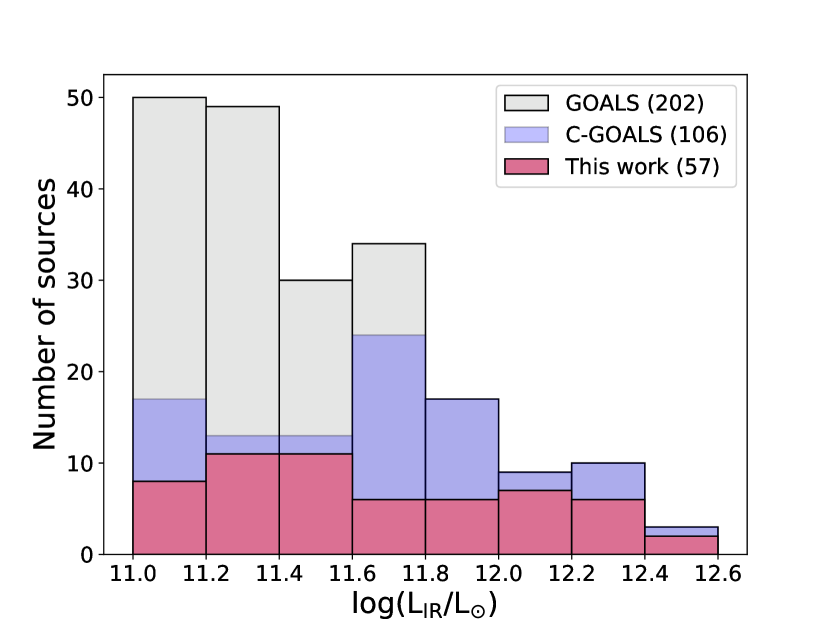
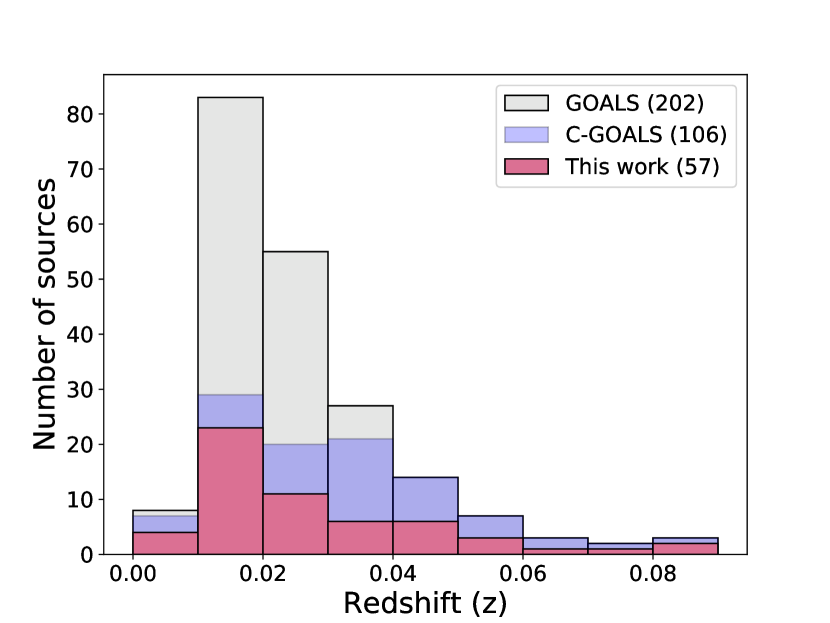
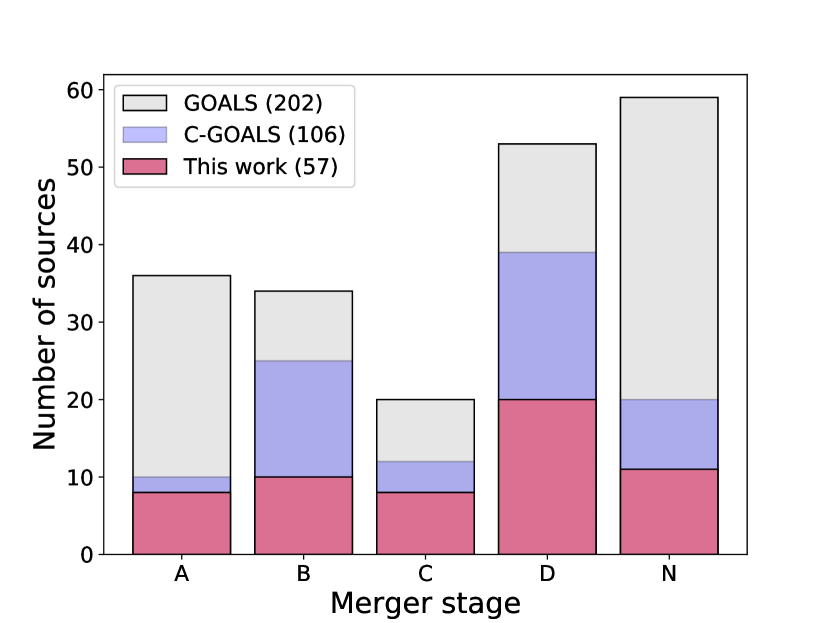
Figure 1 shows the histograms of the 8–1000 m IR luminosity, redshift, and merger stage for the U/LIRGs in the GOALS, C-GOALS, and our samples. As seen from the upper and middle panels, our sample covers the full ranges of the parent GOALS sample over – and = 0.001–0.088. A Kolmogorov-Smirnov (KS) test indicates that the difference in the IR luminosity distribution between our targets and the rest of the GOALS sample is significant at a 99% confidence level, while the difference in the redshift is not (-value = 0.214). Thus, we may regard our sample as a good representative subsample of the local U/LIRGs, although it is weakly biased toward higher IR luminosities compared with the parent GOALS sample.
As shown in the bottom panel, the numbers of the five merger stages in our sample are 8, 10, 8, 20, and 11 for stage-A, B, C, D, and N, whereas those in GOALS are 36, 34, 20, 53, and 59, respectively.444We treat ESO 550-25 as a stage-B merger based on the optical image, which is not classified by Stierwalt2013. A chi-square test of independence suggests that the difference of the distribution between our targets and the rest of the GOALS sample is not significant (-value = 0.132). We note a possible bias that objects that show AGN features in the soft X-ray and/or IR band may have been preferentially selected to be observed with NuSTAR. The smaller fraction of stage-N (nonmergers) in our sample than in the GOALS sample may be affected by this bias. We have to keep it mind when we discuss any statistical properties (e.g., AGN fraction) of U/LIRGs using our sample (see e.g., Section LABEL:sub5-2_CTfraction).
2.5 Targets with Complex Spectral Features
For the eight well-studied U/LIRG systems (hosting 10 AGNs), NGC 1068, NGC 1275, NGC 1365, Mrk 266, NGC 6240, UGC 2608, NGC 5135, and NGC 7469, we refer to the X-ray spectral results of previous works based on the NuSTAR data. The broadband spectra of NGC 1068, NGC 1275, and NGC 1365 are reproduced with a multi-component reflector model (Bauer2015), a jet-dominant AGN model (Rani2018)555NGC 1275 is a radio galaxy in the Perseus cluster hosting a low-luminosity AGN (Hitomi-Collaboration2018). The contamination of the jet emission makes it difficult to constrain the nuclear structure. Thus, we only discuss its X-ray flux and band ratio in this paper., and a multi-layer variable absorber model (Rivers2015), respectively. The dual AGN systems of Mrk 266B/Mrk 266A (Iwasawa2020) and NGC 6240S/NGC 6240N (Puccetti2016) are observed with Chandra by separating the individual AGN components, and their hard X-ray emissions are detected with NuSTAR. The absorption hydrogen column densities of these five U/LIRG systems taken from the literature are summarized in Table 2.666The hydrogen column densities of NGC 1068, NGC 1365, Mrk 266B/Mrk 266A and NGC 6240S/NGC 6240N are derived with other torus models than XCLUMPY. We note that the column densities obtained with XCLUMPY are consistent with the values obtained with smooth-torus models for the other AGNs in our sample (see also Appendix LABEL:Appendix-B). We also refer to the NuSTAR results of UGC 2608, NGC 5135 (heavily CT AGNs in stage-N LIRGs; Yamada2020), and NGC 7469 (unobscured AGN whose spectrum is subject to ionized warm absorbers; Ogawa2021), for which the XCLUMPY torus model is applied; the best-fitting results are shown in Table 5. In Appendix LABEL:Appendix-B, we present detailed information obtained from previous X-ray and multiwavelength studies for all 84 galaxies including these 8 U/LIRG systems.
| Object | Model | Ref. | |
|---|---|---|---|
| NGC 1068 | 1000 | Multi-component reflector model | Bauer2015 |
| NGC 1275 | Jet-dominant AGN model in the Perseus Cluster | Rani2018 | |
| NGC 1365 | 10 | Multi-layer variable absorber model | Rivers2015 |
| Mrk 266B/Mrk 266A | 700/6.8 | Dual-AGN model | Iwasawa2020 |
| NGC 6240S/NGC 6240N | 147/155 | Dual-AGN model | Puccetti2016 |
Note. — Columns: (1) object name; (2) line-of-sight hydrogen column density in units of 10 cm; (3–4) X-ray spectral model and their references.
3 Observations and Data Reduction
For the 49 U/LIRG systems other than the 8 systems mentioned in Section 2.5, we analyzed all the available data of NuSTAR (Section 3.1), Chandra (Section 3.2), XMM-Newton (Section 3.3), and Suzaku (Section 3.4), observed by 2020 April. We also analyzed their Swift/XRT data when no other soft X-ray data were available, and utilized the Swift/BAT spectra in the 105 month catalog if detected (Section 3.5). For the other 8 systems, we reduced the same data as used in their references (see Section 2.5) and obtained the count rates, in order to treat the results in a uniform manner for all the 57 systems. A log of the X-ray observations of our sample is provided in Table 3. In the following, we describe the data reduction for each satellite.
3.1 NuSTAR
NuSTAR (Harrison2013), the first satellite capable of focusing hard X-rays of 3–79 keV, observed 56 U/LIRG systems in the GOALS sample by Cycle-4. Ten systems were observed in Cycle-1 (PI: F.E. Bauer) and other 14 systems are in Cycle-3 (PIs: C. Ricci; G. C. Privon) as campaigns of observing local U/LIRGs in different merger stages. We analyzed all these data including those of the other 32 systems in the archive.
We reduced the data using the NuSTAR Data Analysis Software (nustardas) v1.8.0 within HEASOFT v6.25, adopting the calibration files released on 2019 May 13. Calibrated and cleaned event files were produced using the nupipeline script with the saamode=optimized and tentacle=yes options. The nuproducts task was used to extract the source spectra, background spectra, and response files. We adopted circular source regions of 45″ radii or those of 30″ or smaller radii777We adopted circular regions of 25″ radii for MCG–02-01-052, NGC 833, and IRAS F14348–1447. when there are contaminating nearby sources close to the target. We also chose 30″ radii when the signal-to-noise (S/N) ratios of the 8–24 keV count rates obtained from the 45″ radius regions were lower than 3. The background spectra were taken from the annuluses centered on the X-ray sources with inner and outer radii of 90″ and 150″, respectively, by avoiding regions of contamination from nearby sources and CCD gaps. Net exposure times for these targets range from 10 ks to 200 ks. After confirming that the spectra of the two focal plane modules (FPMA and FPMB; FPM) agreed with each other within the statistical uncertainties, we coadded them with the addascaspec task.
3.2 Chandra
We analyzed the Chandra/ACIS (Garmire2003) imaging data of 46 U/LIRG systems, most of which were obtained by the project to follow up GOALS objects (PI: D. Sanders, see Iwasawa2011 and Torres-Alba2018). The data reduction was performed with the Chandra data analysis package ciao v4.11 and the Calibration database (CALDB) v4.8.4.1. The event files were reprocessed with the chandra_repro tool. The source spectrum was extracted from the circular region of a typically 10″ radius centered on the optical position or the X-ray peak position for a bright source. We adopt a radius large enough to include the extended emission of the whole galaxy, between 3″ (for a galaxy in a close merging system, ESO 440-58) and 50″ (for the nearest source, NGC 1068). The background spectrum was taken from a nearby source-free circular region with the same, or 10″ radius when the source radius is 10″.
3.3 XMM-Newton
The XMM-Newton (Jansen2001) data of 35 U/LIRG systems were utilized in this work. We reduced the EPIC/MOS (MOS1, MOS2) and EPIC/pn data with the standard Science Analysis System (sas) v17.0.0 (Gabriel2004), and then processed their raw data files by the emproc and epproc scripts, respectively. We filtered out periods of high background activity. The threshold is set to be 1.5 times the averaged count rates obtained from periods with 0.5 counts s in the energy range above 10 keV. The source spectrum was extracted from a circular region with a radius of typically 25″, whereas the background was from a source-free circular region with a radius of 40″ in the same CCD chips. We generated the ARF with arfgen and RMF with rmfgen. The spectra and response files of EPIC/MOS1 and MOS2 were combined.
3.4 Suzaku
For 18 U/LIRG systems, we utilized the data of the Suzaku (Mitsuda2007) observations. Suzaku carried the X-ray CCD cameras called the X-ray Imaging Spectrometers (XIS), covering the 0.2–12 keV band. XIS-0, XIS-2, and XIS-3 are frontside-illuminated cameras (XIS-FI) and XIS-1 is a backside-illuminated one (XIS-BI). XIS-2 data were not available after 2006 November due to the malfunction. We generated the cleaned event files with the Suzaku calibration database released on 2018 October 23. The source spectrum was selected from a circular region of 17 radius, while the background was from a partial annulus with inner and outer radii of 30 and 57 within the field of view by excluding regions of nearby sources. The ARFs and RMFs were generated using xisarfgen and xisrmfgen tasks (Ishisaki2007), respectively. The spectra and responses of the XIS-FI detectors were merged.
Suzaku also carried the Hard X-ray Detector (HXD), a non-imaging instrument consisting of the silicon PIN diodes (covering 10–70 keV) and GSO scintillators (40–600 keV). We did not use the GSO data, because our targets were too faint to be detected with GSO. The HXD-PIN data were reduced with aepipeline task. We utilized the “tuned” background event files (Fukazawa2009) to produce the non X-ray background spectra of HXD-PIN, to which the simulated cosmic X-ray background spectrum was added.
3.5 Swift
We analyzed Swift/XRT data covering the 0.3–10 keV band for three U/LIRG systems that were neither observed with Chandra, XMM-Newton, nor Suzaku: CGCG 468-002W/CGCG 468-002E, NGC 5104, and NGC 6907/NGC 6908.888The Swift/XRT data of ObsID 33513001 and 33513002 performed on 2014 November 3 as ToO observations were not used since they may be largely affected by the emission from the supernova in NGC 6908 (Margutti2014). We also analyzed those of ESO 148-2 and NGC 7679, which showed large time variability between the epoch of NuSTAR and Chandra/XMM-Newton observations (see Appendix LABEL:Appendix-B).
The data reduction was carried out with the xrtpipeline v0.13.4 script. The source spectrum was taken from a circular region with a radius of 45″, and the background was from a partial annulus with inner and outer radii of 90″ and 150″, respectively. All spectra of each object were combined to improve the photon statistics.
To better constrain the broadband spectra, we also utilized the time-averaged Swift/BAT spectra in the 105-month catalog (Oh2018)999https://swift.gsfc.nasa.gov/results/bs105mon/, which cover the 14–195 keV band. To identify the counterparts, we matched our targets with the Swift/BAT catalog within error radii defined as:
| (1) |
where S/N represents the significance level of of the BAT detection
(see Oh2018).
Thus, we adopted the BAT spectra for 11 galaxies (NGC 235, CGCG
468–002W, IRAS F05189–2524, UGC 5101, MCG–03-34-064, Mrk 273, IC
4518A, MCG+04-48-002, NGC 7130, NGC 7674, and NGC 7679) except for
the dual AGN system NGC 833/NGC 835 and 5 systems for which
we refer to the previous NuSTAR results (NGC 1068, NGC 1275, NGC 1365,
NGC 6240S/NGC 6240N, and NGC 7469; see Section 2.5).
4 X-Ray Spectral Analysis
4.1 X-ray Counts and NuSTAR Counterparts
Since many of the U/LIRGs in our sample are interacting systems, we have to identify which of the two galaxies or both contributes to the hard X-ray emission observed with NuSTAR. First, we check the source peak position in the NuSTAR 8–24 keV band image, where the AGN component is expected to dominate. If the NuSTAR position is consistent with one galaxy but not with the other, then we regard the former as the counterpart of the hard X-ray source. Here we take into account both the statistical (17″; i.e., the value of the radius with 1 enclosed fraction of 51″ divided by the S/N ratio) and systematic (8″; 90% confidence) errors in the astrometry of NuSTAR (Harrison2013). If the NuSTAR error circle contains both galaxies, then we refer to the previous work based on Chandra and/or other wavelength data to identify AGNs in either or both galaxies (Appendix LABEL:Appendix-B). We regard the galaxy that contains an AGN as the counterpart of the NuSTAR source. Among our sample, only two systems, Mrk 266B/Mrk 266A and NGC 6240S/NGC 6240N, are identified as “dual-AGNs” where both nuclei significantly contribute to the hard X-ray emission observed with NuSTAR.
| Object | Satellite | ObsID | Observation Date | Net Exp. |
|---|---|---|---|---|
| NGC 34 | NuSTAR | 60101068002 | 2015-07-31 | 21.0/21.0 |
| Chandra | 15061 | 2015-07-31 | 14.8 | |
| XMM-Newton | 0150480501 | 2002-12-22 | 21.8/21.8/14.5 | |
| MCG–02-01-052/MCG–02-01-051 | NuSTAR | 60101069002 | 2015-10-29 | 20.3/20.5 |
| Chandra | 13823 | 2011-10-30 | 29.6 | |
| ESO 350-38 | NuSTAR | 60374008002 | 2018-01-15 | 22.4/22.4 |
| Chandra | 8175 | 2006-10-28 | (u; time-v) | |
| Chandra | 16695 | 2015-11-29 | 24.7 | |
| Chandra | 16696 | 2016-09-12 | 24.7 | |
| Chandra | 16697 | 2017-11-24 | 23.8 | |
| NGC 232/NGC 235 | Chandra | 12872 | 2011-01-17 | 6.9 |
| Chandra | 15066 | 2013-01-04 | 14.8 | |
| Suzaku | 708026010 | 2013-12-10 | 19.8/17.2 | |
| MCG+12-02-001 | NuSTAR | 60101070002 | 2015-08-03 | 25.8/25.5 |
| Chandra | 15062 | 2012-11-22 | 14.3 | |
| IC 1623A/IC 1623B | NuSTAR | 50401001002 | 2019-01-19 | 197.9/198.8 |
| NuSTAR | 60374003002 | 2018-01-29 | 20.9/21.0 | |
| Chandra | 7063 | 2005-10-20 | 59.4 | |
| XMM-Newton | 0025540101 | 2001-06-26 | 11.4/11.4/2.7 | |
| XMM-Newton | 0830440101 | 2019-01-10 | 31.2/31.2/25.8 | |
| NGC 833/NGC 835/NGC 838/NGC 839 | NuSTAR | 60061346002 | 2015-09-13 | 18.1/18.1 |
| Chandra | 15181 | 2013-07-16 | 49.5 | |
| Chandra | 15666 | 2013-07-18 | 29.7 | |
| Chandra | 15667 | 2013-07-21 | 58.3 | |
| Chandra | 923 | 2000-11-16 | (u; time-v) | |
| Chandra | 10394 | 2008-11-23 | (u; time-v) | |
| XMM-Newton | 0115810301 | 2000-01-23 | 52.3/47.8/44.7 | |
| Suzaku | 709009010 | 2014-08-04 | (u; cont) | |
| NGC 1068 | NuSTAR | 60002030002 | 2012-12-18 | 57.9/57.8 |
| NuSTAR | 60002030004 | 2012-12-20 | 48.6/48.5 | |
| NuSTAR | 60002030006 | 2012-12-21 | 19.5/19.4 | |
| XMM-Newton | 0111200101 | 2000-07-29 | 39.1/–/35.1 | |
| XMM-Newton | 0111200201 | 2000-07-30 | 39.0/–/35.3 | |
| UGC 2608 | NuSTAR | 60001161002 | 2014-10-08 | 22.1/22.2 |
| XMM-Newton | 0002942401 | 2002-01-28 | 4.8/4.8/2.1 | |
| UGC 2612 | NuSTAR | 60001161002 | 2014-10-08 | 22.1/22.2 |
| Chandra | 17280 | 2015-12-11 | 4.7 | |
| XMM-Newton | 0002942401 | 2002-01-28 | (u; faint) | |
| XMM-Newton | 0002942501 | 2002-01-28 | (u; faint) | |
| Suzaku | 701007010 | 2006-08-02 | (u; faint) | |
| Suzaku | 701007020 | 2007-02-04 | (u; cont) | |
| NGC 1275 | NuSTAR | 90202046002 | 2017-02-01 | 20.3/19.5 |
| NuSTAR | 90202046004 | 2017-02-04 | 28.2/28.1 | |
| XMM-Newton | 0085110101 | 2001-01-30 | 53.1/53.1/24.6 | |
| XMM-Newton | 0305780101 | 2006-01-29 | 123.3/123.3/76.1 | |
| NGC 1365 | NuSTAR | 60002046002 | 2012-07-25 | 36.2/36.0 |
| NuSTAR | 60002046003 | 2012-07-26 | 40.6/40.5 | |
| NuSTAR | 60002046005 | 2012-12-24 | 66.2/66.3 | |
| NuSTAR | 60002046007 | 2013-01-23 | 73.0/73.6 | |
| NuSTAR | 60002046009 | 2013-02-12 | 69.7/69.5 | |
| XMM-Newton | 0692840201 | 2012-07-25 | 133.9/133.9/118.2 | |
| XMM-Newton | 0692840301 | 2012-12-24 | 121.6/121.6/107.8 | |
| XMM-Newton | 0692840401 | 2013-01-23 | 125.0/125.0/92.8 | |
| XMM-Newton | 0692840501 | 2013-02-12 | 122.4/122.5/115.8 | |
| ESO 203-1 | NuSTAR | 60374001002 | 2018-05-25 | 21.2/21.1 |
| Chandra | 7802 | 2008-01-17 | 14.8 | |
| CGCG 468-002W/CGCG 468-002E | NuSTAR | 60006011002 | 2012-07-23 | 15.5/15.5 |
| Swift/XRT | 49706(001–) | 2013-04-17 | 81.5 | |
| (–011) | 2014-11-11 | |||
| IRAS F05189–2524 | NuSTAR | 60002027002 | 2013-02-20 | 22.9/23.2 |
| NuSTAR | 60002027004 | 2013-10-02 | 21.2/21.2 | |
| NuSTAR | 60002027005 | 2013-10-02 | 7.9/8.0 | |
| NuSTAR | 60201022002 | 2016-09-05 | 144.0/143.8 | |
| Chandra | 2034 | 2001-10-30 | 19.7 | |
| Chandra | 3432 | 2002-01-30 | 14.9 | |
| XMM-Newton | 0085640101 | 2001-03-17 | 11.6/11.6/8.1 | |
| XMM-Newton | 0722610101 | 2013-10-02 | 36.1/36.1/30.8 | |
| XMM-Newton | 0790580101 | 2016-09-06 | 96.4/96.4/83.9 | |
| Suzaku | 701097010 | 2006-04-10 | 78.2/48.7 | |
| IRAS F06076–2139/2MASS 06094601–2140312 | NuSTAR | 60370004002 | 2018-01-29 | 22.7/23.1 |
| Chandra | 15052 | 2012-12-12 | 14.8 | |
| NGC 2623 | NuSTAR | 60374010002 | 2018-05-24 | 38.7/38.6 |
| Chandra | 4059 | 2003-01-03 | 19.8 | |
| XMM-Newton | 0025540301 | 2001-04-27 | 11.9/11.9/5.7 | |
| ESO 060-IG016 West/ESO 060-IG016 East | NuSTAR | 60101053002 | 2015-12-01 | 41.1/41.4 |
| Chandra | 7888 | 2007-05-31 | 14.7 | |
| IRAS F08572+3915 | NuSTAR | 50401004002 | 2019-04-04 | 211.2/209.3 |
| NuSTAR | 60001088002 | 2013-05-23 | 23.7/23.8 | |
| Chandra | 6862 | 2006-01-26 | 14.9 (u; faint) | |
| XMM-Newton | 0200630101 | 2004-04-13 | 28.2/28.3/23.5 | |
| XMM-Newton | 0830420101 | 2019-04-05 | 57.6/57.5/51.0 | |
| XMM-Newton | 0830420201 | 2019-04-07 | 61.2/61.2/51.9 | |
| Suzaku | 701053010 | 2006-04-14 | 77.2/58.6 | |
| UGC 5101 | NuSTAR | 60001068002 | 2014-03-21 | 17.6/17.4 |
| Chandra | 2033 | 2001-05-28 | 49.3 | |
| XMM-Newton | 0085640201 | 2001-11-12 | 33.9/34.0/26.5 | |
| Suzaku | 701002010 | 2006-03-31 | 49.0/41.4 | |
| Suzaku | 701002020 | 2006-10-31 | 42.2/31.6 | |
| MCG+08-18-012/MCG+08-18-013 | NuSTAR | 60101071002 | 2015-09-25 | 20.2/20.0 |
| Chandra | 15067 | 2013-06-03 | 13.8 | |
| MCG–01-26-013/NGC 3110 | NuSTAR | 60101072002 | 2015-11-12 | 18.9/18.9 |
| Chandra | 15069 | 2013-02-02 | 14.9 | |
| XMM-Newton | 0550460201 | 2008-06-04 | 35.2/33.0/24.7 | |
| XMM-Newton | 0550461001 | 2008-06-04 | 4.2/4.2/2.3 | |
| ESO 374-IG032 | NuSTAR | 60101055002 | 2016-01-14 | 51.1/51.7 |
| Chandra | 7807 | 2007-03-07 | 14.4 | |
| NGC 3256 | NuSTAR | 50002042002 | 2014-08-24 | 170.7/171.2 |
| Chandra | 835 | 2000-01-05 | 27.8 | |
| Chandra | 3569 | 2003-05-23 | 27.2 | |
| Chandra | 16026 | 2014-08-27 | 15.4 | |
| XMM-Newton | 0112810201 | 2001-12-15 | 16.1/16.1/11.6 | |
| XMM-Newton | 0300430101 | 2005-12-06 | 131.0/131.1/115.6 | |
| IRAS F10565+2448 | NuSTAR | 60001090002 | 2013-05-22 | 25.2/24.6 |
| Chandra | 3952 | 2003-10-23 | 28.9 | |
| XMM-Newton | 0150320201 | 2003-06-17 | 30.7/30.7/26.4 | |
| Suzaku | 702115010 | 2007-11-06 | 39.4/33.1 | |
| NGC 3690 West/NGC 3690 East | NuSTAR | 50002041002 | 2013-03-12 | 8.9/9.4 |
| NuSTAR | 50002041003 | 2013-03-13 | 59.8/59.7 | |
| Chandra | 1641 | 2001-07-13 | 24.3 | |
| Chandra | 6227 | 2005-02-14 | 10.2 | |
| Chandra | 15077 | 2013-03-13 | 51.9 | |
| Chandra | 15619 | 2013-03-12 | 38.5 | |
| XMM-Newton | 0112810101 | 2001-05-06 | 21.3/21.3/15.4 | |
| XMM-Newton | 0679381101 | 2011-12-15 | 11.2/11.2/8.5 | |
| ESO 440-58/MCG–05-29-017 | NuSTAR | 60101073002 | 2015-08-23 | 27.6/27.6 |
| Chandra | 15064 | 2013-03-20 | 14.8 | |
| IRAS F12112+0305 | NuSTAR | 60374005002 | 2018-01-17 | 18.9/18.8 |
| Chandra | 4110 | 2003-04-15 | (u; faint) | |
| Chandra | 4934 | 2004-07-17 | (u; faint) | |
| XMM-Newton | 0081340801 | 2001-12-30 | 22.3/22.3/17.9 | |
| NGC 4418/MCG+00-32-013 | NuSTAR | 60101052002 | 2015-07-03 | 47.2/47.0 |
| Chandra | 4060 | 2003-03-10 | 19.8 | |
| Chandra | 10391 | 2009-02-20 | 5.7 | |
| Suzaku | 701001010 | 2006-07-13 | 68.4/53.4 | |
| Mrk 231 | NuSTAR | 60002025002 | 2012-08-26 | 40.2/39.4 |
| NuSTAR | 60002025004 | 2013-05-09 | 27.5/28.2 | |
| NuSTAR | 80302608002 | 2017-10-19 | 78.7/78.9 | |
| NuSTAR | 90102001002 | 2015-04-02 | 31.1/31.2 | |
| NuSTAR | 90102001004 | 2015-04-19 | 27.7/27.8 | |
| NuSTAR | 90102001006 | 2015-05-28 | 30.4/30.3 | |
| Chandra | 1031 | 2000-10-19 | 39.2 | |
| Chandra | 4028 | 2003-02-03 | 39.7 | |
| Chandra | 4029 | 2003-02-11 | 38.6 | |
| Chandra | 4030 | 2003-02-20 | 36.0 | |
| Chandra | 11851 | 2010-07-11 | 4.8 | |
| Chandra | 13947 | 2012-08-24 | 177.7 | |
| Chandra | 13948 | 2012-08-27 | 173.8 | |
| Chandra | 13949 | 2012-08-23 | 40.0 | |
| XMM-Newton | 0081340201 | 2001-06-07 | 21.4/21.4/17.2 | |
| XMM-Newton | 0770580401 | 2015-04-25 | 22.6/22.6/19.0 | |
| XMM-Newton | 0770580501 | 2015-05-28 | 24.9/24.9/20.9 | |
| Suzaku | 706037010 | 2011-04-27 | 197.5/75.2 | |
| NGC 4922S/NGC 4922N | NuSTAR | 60101074002 | 2015-11-17 | 19.9/19.7 |
| Chandra | 4775 | 2004-11-02 | 3.8 | |
| Chandra | 15065 | 2013-11-02 | 14.9 | |
| Chandra | 18201 | 2016-03-06 | 5.8 | |
| IC 860 | NuSTAR | 60301024002 | 2018-02-01 | 71.0/72.1 |
| Chandra | 10400 | 2009-03-24 | 19.2 | |
| IRAS 13120–5453 | NuSTAR | 60001091002 | 2013-02-25 | 26.2/26.2 |
| Chandra | 7809 | 2006-12-01 | 14.7 | |
| XMM-Newton | 0693520201 | 2013-02-20 | 125.5/125.9/111.3 | |
| NGC 5104 | NuSTAR | 60370003002 | 2018-01-12 | 20.4/20.4 |
| Swift/XRT | 36966(001–) | 2007-07-24 | 8.2 | |
| (–004) | 2008-01-05 | |||
| MCG–03-34-064 | NuSTAR | 60101020002 | 2016-01-17 | 76.6/78.1 |
| Chandra | 7373 | 2006-07-31 | 7.1 | |
| XMM-Newton | 0206580101 | 2005-01-24 | 44.1/44.1/38.3 | |
| XMM-Newton | 0506340101 | 2008-01-24 | 88.4/88.4/77.0 | |
| XMM-Newton | 0763220201 | 2016-01-17 | 137.0/139.6/123.3 | |
| Suzaku | 704022010 | 2009-07-01 | (u; cont) | |
| Suzaku | 707027010 | 2013-01-04 | (u; cont) | |
| NGC 5135 | NuSTAR | 60001153002 | 2015-01-14 | 33.4/32.5 |
| Chandra | 2187 | 2001-09-04 | 29.3 | |
| Mrk 266B/Mrk 266A | NuSTAR | 60465005002 | 2019-02-08 | 29.7/30.1 |
| Chandra | 2044 | 2001-11-02 | 19.7 | |
| Mrk 273 | NuSTAR | 60002028002 | 2013-11-04 | 69.2/69.6 |
| Chandra | 18177 | 2016-09-06 | 59.9 | |
| Chandra | 18178 | 2017-02-16 | 30.4 | |
| Chandra | 19783 | 2017-02-18 | 31.8 | |
| Chandra | 19784 | 2017-02-26 | 33.6 | |
| Chandra | 20009 | 2017-02-14 | 34.3 | |
| Chandra | 809 | 2000-04-19 | (u; time-v) | |
| XMM-Newton | 0722610201 | 2013-11-04 | 21.2/21.2/17.5 | |
| XMM-Newton | 0101640401 | 2002-05-07 | (u; time-v) | |
| XMM-Newton | 0651360301 | 2010-05-13 | (u; time-v) | |
| XMM-Newton | 0651360501 | 2010-05-15 | (u; time-v) | |
| XMM-Newton | 0651360601 | 2010-05-17 | (u; time-v) | |
| XMM-Newton | 0651360701 | 2010-06-26 | (u; time-v) | |
| Suzaku | 701050010 | 2006-07-07 | 79.9/77.4 | |
| IRAS F14348–1447 | NuSTAR | 60374004002 | 2018-01-27 | 21.1/21.0 |
| Chandra | 6861 | 2006-03-12 | 14.7 | |
| XMM-Newton | 0081341401 | 2002-07-29 | 21.4/21.4/17.9 | |
| IRAS F14378–3651 | NuSTAR | 60001092002 | 2013-02-28 | 24.5/24.4 |
| Chandra | 7889 | 2007-06-25 | 13.9 | |
| IC 4518A/IC 4518B | NuSTAR | 60061260002 | 2013-08-02 | 7.8/7.8 |
| XMM-Newton | 0401790901 | 2006-08-07 | 11.5/11.5/8.8 | |
| XMM-Newton | 0406410101 | 2006-08-15 | 24.4/–/21.2 | |
| Suzaku | 706012010 | 2012-02-02 | 64.4/53.7 | |
| IRAS F15250+3608 | NuSTAR | 60374009002 | 2018-01-17 | 18.0/18.3 |
| Chandra | 4112 | 2003-08-27 | 9.8 | |
| XMM-Newton | 0081341101 | 2002-02-22 | 19.2/19.2/15.3 | |
| Arp 220W/Arp 220E | NuSTAR | 60002026002 | 2013-08-13 | 66.1/66.0 |
| Chandra | 16092 | 2014-04-30 | 169.2 | |
| Chandra | 16093 | 2014-05-07 | 66.7 | |
| Chandra | 869 | 2000-06-24 | (u; time-v) | |
| XMM-Newton | 0101640801 | 2002-08-11 | 13.5/13.5/10.8 | |
| XMM-Newton | 0101640901 | 2003-01-15 | 14.4/14.4/8.3 | |
| XMM-Newton | 0722610301 | 2013-08-13 | 34.3/34.3/29.5 | |
| XMM-Newton | 0205510201 | 2005-01-14 | (u; highbg) | |
| XMM-Newton | 0205510401 | 2005-02-19 | (u; highbg) | |
| XMM-Newton | 0205510501 | 2005-02-27 | (u; highbg) | |
| Suzaku | 700006010 | 2006-01-07 | 90.8/87.4 | |
| NGC 6240S/NGC 6240N | NuSTAR | 60002040002 | 2015-03-18 | 30.9/30.8 |
| Chandra | 12713 | 2011-05-31 | 145.4 | |
| Chandra | 1590 | 2001-07-29 | 36.7 | |
| NGC 6285/NGC 6286 | NuSTAR | 60101075002 | 2015-05-29 | 17.2/17.2 |
| Chandra | 10566 | 2009-09-18 | 14.0 | |
| XMM-Newton | 0203390701 | 2004-02-12 | 7.7/7.7/5.7 | |
| XMM-Newton | 0203391201 | 2004-03-25 | (u; highbg) | |
| IRAS F17138–1017 | NuSTAR | 60101076002 | 2015-06-26 | 24.8/25.2 |
| Chandra | 15063 | 2013-07-12 | 14.8 | |
| IRAS F18293–3413 | NuSTAR | 60101077002 | 2016-02-20 | 21.2/21.0 |
| Chandra | 7815 | 2007-02-25 | 14.0 | |
| Chandra | 21379 | 2019-08-08 | 79.0 | |
| XMM-Newton | 0670300701 | 2012-03-16 | 21.3/21.3/17.7 | |
| IRAS F19297–0406 | NuSTAR | 60374007002 | 2018-03-03 | 20.0/20.0 |
| Chandra | 7890 | 2007-06-18 | 16.4 | |
| NGC 6907/NGC 6908 | NuSTAR | 60370001002 | 2018-05-13 | 22.0/21.6 |
| Swift/XRT | 33513(003–) | 2014-11-10 | 10.4 | |
| (–006) | 2014-11-19 | |||
| NGC 6921/MCG+04-48-002 | NuSTAR | 60061300002 | 2013-05-18 | 19.2/19.2 |
| XMM-Newton | 0312192301 | 2006-04-23 | 13.7/13.7/10.8 | |
| Suzaku | 702081010 | 2007-04-18 | (u; cont) | |
| II Zw 096/IRAS F20550+1655 SE | NuSTAR | 60374002002 | 2018-03-28 | 29.0/29.1 |
| Chandra | 7818 | 2007-09-10 | 14.6 | |
| XMM-Newton | 0670140101 | 2011-10-28 | 75.7/75.7/66.1 | |
| ESO 286-19 | NuSTAR | 60101054002 | 2015-07-30 | 44.5/44.0 |
| Chandra | 2036 | 2001-10-31 | 44.9 | |
| XMM-Newton | 0081340401 | 2001-04-21 | 20.9/20.9/16.4 | |
| NGC 7130 | NuSTAR | 60061347002 | 2014-08-17 | 21.2/21.1 |
| NuSTAR | 60261006002 | 2016-12-15 | 40.2/39.9 | |
| Chandra | 2188 | 2001-10-23 | 38.6 | |
| Suzaku | 703012010 | 2008-05-11 | 44.5/34.2 | |
| NGC 7469 | NuSTAR | 60101001002 | 2015-06-12 | 21.6/21.5 |
| XMM-Newton | 0760350201 | 2015-06-12 | –/–/62.6 | |
| IC 5283 | NuSTAR | 60101001002 | 2015-06-12 | (u; cont) |
| NuSTAR | 60101001004 | 2015-11-24 | (u; cont) | |
| NuSTAR | 60101001006 | 2015-12-15 | (u; cont) | |
| NuSTAR | 60101001008 | 2015-12-22 | (u; cont) | |
| NuSTAR | 60101001010 | 2015-12-25 | (u; cont) | |
| NuSTAR | 60101001012 | 2015-12-27 | (u; cont) | |
| NuSTAR | 60101001014 | 2015-12-28 | (u; cont) | |
| XMM-Newton | 0112170101 | 2000-12-26 | 17.8/17.8/12.3 | |
| XMM-Newton | 0112170301 | 2000-12-26 | 23.2/23.2/16.2 | |
| XMM-Newton | 0760350201 | 2015-06-12 | –/–/62.6 | |
| Suzaku | 703028010 | 2008-06-24 | (u; cont) | |
| ESO 148-2 | NuSTAR | 60374006002 | 2018-03-06 | 27.1/26.8 |
| NuSTAR | 60374006004 | 2018-03-29 | 19.1/19.0 | |
| Chandra | 2037 | 2001-09-30 | 49.3 | |
| XMM-Newton | 0081340301 | 2002-11-19 | 23.0/23.0/17.8 | |
| XMM-Newton | 0109463601 | 2001-10-17 | 5.1/5.3/– | |
| XMM-Newton | 0079940101 | 2005-10-22 | 18.4/18.4/– | |
| Swift/XRT | 35164(001–) | 2005-12-08 | 23.6 | |
| (–008) | 2006-06-27 | |||
| NGC 7591 | NuSTAR | 60370002002 | 2018-01-09 | 19.3/19.2 |
| Chandra | 10264 | 2009-07-05 | 4.9 | |
| NGC 7674/MCG+01-59-081 | NuSTAR | 60001151002 | 2014-09-30 | 52.0/51.9 |
| XMM-Newton | 0200660101 | 2004-06-02 | 10.1/10.1/8.1 | |
| Suzaku | 708023010 | 2013-12-08 | 52.2/45.7 | |
| NGC 7679/NGC 7682 | NuSTAR | 60368002002 | 2017-10-06 | 22.4/21.7 |
| XMM-Newton | 0301150501 | 2005-05-27 | 19.7/19.8/16.2 | |
| Swift/XRT | 88108002 | 2017-10-06 | 1.9 |
Note. — Columns: (1) object name; (2) satellite name; (3) observation ID; (4) observation date in YYYY/MM/DD; (5) net exposure (FPMA and FPMB for NuSTAR; ACIS-S or ACIS-I for Chandra; MOS1, MOS2, and pn for XMM-Newton; each of available XIS 0, 1, 2, 3 and HXD-PIN for Suzaku; and XRT for Swift). The (u) means that the data are unused due to large time variability among the soft X-ray observations (time-v), too faint source or short exposure time (faint), contamination from brighter nearby sources (cont), or data with high background flaring throughout the observation (highbg).
We find that NuSTAR detects hard X-ray emission from 37 galaxies and the two inseparable dual-AGN systems in the 8–24 keV band (or in the 10–40 keV band for MCG+12-02-001 and IRAS F14348–1447) at 3 significance. These are considered to be good candidates of AGNs. Table 4 summarizes the NuSTAR net count rates (NCR) in the full (3–24 keV), soft (3–8 keV), and hard (8–24 keV) bands, and the band ratio (the count-rate ratio between the 8–24 keV and 3–8 keV bands) for all objects. The band ratio, BR (= NCR/NCR), is useful to identify obscured AGNs with a threshold of BR, corresponding to an effective photon index of (Lansbury2017). Table 4 also lists the observed 2–7 keV fluxes. These fluxes are calculated from the broadband spectral analysis described in Section 4.2. For the sources mentioned in Section 2.5, we calculate the fluxes converted from the count rates of Chandra, XMM-Newton, and/or Swift/XRT by assuming a power-law photon index of 1.8. For the undetected sources, we constrain the 3 upper limits by adopting the same conversion.
4.2 X-ray Spectral Model
We utilize xspec v12.10.1 (Arnaud1996) for spectral fitting. Galactic absorption is considered with the phabs model whose hydrogen column density is fixed at the value of Willingale2013. The solar abundances of Anders1989 are assumed. The flux cross-calibration uncertainties among different instruments are taken into account by multiplying constant factors. We set the constant values for NuSTAR/FPM and XMM-Newton/MOS to unity as references, whose relative flux calibration is known to be accurate within a few percent (Madsen2015; Madsen2017), whereas those of the other instruments are allowed to vary between 0.8 and 1.2. If a source is not detected with NuSTAR in any bands, we adopt Chandra, XMM-Newton (MOS, pn), or Swift/XRT as the calibration reference in this priority order. We link that of Suzaku/HXD-PIN to 1.16 (1.18) times that of XIS-FI for the data observed at the XIS (HXD) nominal pointing position, on the basis of the calibration with the Crab Nebula. The XIS energy range of 1.6–1.9 keV is ignored for NGC 7674 due to the large calibration error.
To obtain the highest quality spectrum from each instrument, we combine the spectra of all observations unless they show large time variability above 1 keV (listed in Table 3 with the mark “time-v”).101010When time variability is found only at lower energies, we use the combined spectra above 1–2 keV. The time variability among the spectra of different instruments are taken into account by multiplying a constant factor to the AGN transmitted component (Section 4.2.1). For the sources whose NuSTAR total (source and background) counts are 200 counts or the S/N ratios in the 8–24 keV band are 3, we employ the Cash statistics (Cash1979)111111The Cash statistic is also adopted for IRAS F08572+3915 where the detection significance in the NuSTAR 3–8 keV band is 3 level., whereas we use statistics for the other objects.
Excluding the 8 U/LIRG systems mentioned in Section 2.5, we analyze the broadband spectra of the 31 systems that are significantly (3) detected with NuSTAR in the 8–24 keV or 10–40 keV band, and those of NGC 235, which is detected with Swift/BAT. Among the 32 hard X-ray detected sources, we apply an AGN model (Section 4.2.1) to 30 sources that show hard X-ray power law components. Whereas, we apply a starburst-dominant model (Section 4.2.2) to the other two sources, IC 1623A and NGC 3256, since their spectra show high energy cutoff features around 10 keV and hence are likely dominated by X-ray binary (XRB) populations. The latter model is also adopted for the soft X-ray spectra of the 27 sources that are undetected with NuSTAR in the 8–24 keV band. For 9 sources out of these 59 sources, we introduce additional emission lines (Section 4.2.3) on the AGN or starburst-dominant model to improve the spectral fit.
4.2.1 AGN Model
For the 30 AGNs detected in the hard X-ray band (see above), we apply the XCLUMPY model (Tanimoto2019), which is a Monte Carlo-based spectral model from clumpy tori in AGNs. The torus geometry and geometrical parameters are the same as those in the CLUMPY (Nenkova2008a; Nenkova2008b) model used for IR studies. As mentioned in Section 1, many IR observations suggest that AGN tori are not smooth but have dusty clumpy structure (e.g., Krolik1988; Wada2002; Honig2007). Recent X-ray spectral works also support the clumpy nature of AGN tori, as such models can explain a large amount of unabsorbed reflection components often observed in obscured AGNs (e.g., LiuYang2014; Furui2016; Tanimoto2018; Tanimoto2019). Studies of the variability of the line-of-sight column density using X-ray monitoring data also support the clumpy structure (e.g., Lamer2003; Puccetti2007; Risaliti2009; Risaliti2011; Maiolino2010; Markowitz2014; Laha2020). Thus, we regard this model as one of the most realistic models.
| Object | Facility | NCR | NCR | NCR | BR | 3 Det. | ||
|---|---|---|---|---|---|---|---|---|
| NGC 34 | 1.7e-13 | C | 6.96 0.49 | 3.04 0.32 | 3.91 0.37 | 1.29 0.18 | F S H | 2.32 |
| MCG–02-01-052 | 8.3e-15 | C | 0.14 0.20 | 0.20 0.15 | 0.34 | 1.70 | 3.51 | |
| MCG–02-01-051 | 5.7e-14 | C | 0.20 0.19 | 0.17 0.14 | 0.03 0.12 | 0.18 0.72 | 3.51 | |
| ESO 350-38 | 9.7e-14 | C | 0.62 0.20 | 0.58 0.16 | 0.04 0.13 | 0.07 0.22 | F S | 2.52 |
| NGC 232 | 3.8e-14 | C | 1.49 | |||||
| NGC 235 | 2.1e-12 | C | 1.48 | |||||
| MCG+12-02-001 | 1.0e-13 | C | 1.37 0.23 | 0.92 0.17 | 0.46 0.15 | 0.50 0.19 | F S (H) | 36.1 |
| IC 1623A | 1.9e-13 | C | 2.88 0.12 | 2.22 0.09 | 0.66 0.07 | 0.30 0.03 | F S H | 1.45 |
| IC 1623B | (cont) | C | (cont) | (cont) | (cont) | 1.45 | ||
| NGC 833 | 1.5e-13 | C | 11.87 0.60 | 5.37 0.41 | 6.42 0.44 | 1.20 0.12 | F S H | 2.73 |
| NGC 835 | 6.0e-13 | C | 19.24 0.76 | 6.63 0.45 | 12.50 0.61 | 1.89 0.16 | F S H | 2.74 |
| NGC 838 | 5.9e-14 | C | 1.16 0.26 | 0.66 0.18 | 0.45 0.18 | 0.68 0.33 | F S | 2.78 |
| NGC 839 | 7.3e-14 | C | 0.37 0.21 | 0.27 0.14 | 0.08 0.15 | 0.30 0.58 | 2.80 | |
| NGC 1068 | 2.5e-12 | XPN | 132.40 0.74 | 79.21 0.57 | 52.86 0.47 | 0.67 0.01 | F S H | 3.22 |
| UGC 2608 | 1.5e-13 | X | 9.55 0.58 | 3.15 0.38 | 6.41 0.44 | 2.03 0.28 | F S H | 20.3 |
| UGC 2612 | 1.5e-14 | C | 0.31 | 0.42 | 0.14 | 20.0 | ||
| NGC 1275 | 3.4e-11 | X | 905.70 3.58 | 637.10 3.06 | 265.80 1.84 | 0.42 0.01 | F S H | 20.7 |
| NGC 1365 | 7.0e-12 | X | 445.93 1.80 | 246.43 1.34 | 198.18 1.20 | 0.80 0.01 | F S H | 1.39 |
| ESO 203-1 | 1.1e-14 | C | 0.05 | 0.11 | 0.16 | 1.42 | ||
| CGCG 468-002W | 5.5e-12 | XRT | 214.10 2.68 | 123.60 2.03 | 89.91 1.74 | 0.73 0.02 | F S H | 31.1 |
| CGCG 468-002E | (cont) | XRT | (cont) | (cont) | (cont) | 31.1 | ||
| IRAS F05189–2524 | 1.7e-12 | C | 72.86 0.45 | 46.06 0.35 | 26.54 0.27 | 0.58 0.01 | F S H | 1.80 |
| IRAS F06076–2139 | 6.3e-14 | C | 3.46 0.39 | 1.46 0.25 | 1.99 0.29 | 1.36 0.31 | F S H | 9.56 |
| 2MASS 06094601–2140312 | 1.1e-14 | C | (cont) | (cont) | (cont) | 9.56 | ||
| NGC 2623 | 5.9e-14 | C | 1.98 0.26 | 1.13 0.18 | 0.84 0.19 | 0.74 0.21 | F S H | 3.54 |
| ESO 060-IG016 West | 8.5e-15 | C | (cont) | (cont) | (cont) | 7.26 | ||
| ESO 060-IG016 East | 1.1e-13 | C | 3.04 0.26 | 1.68 0.19 | 1.34 0.18 | 0.80 0.14 | F S H | 7.24 |
| IRAS F08572+3915 | 1.2e-14 | X | 0.28 0.06 | 0.11 0.04 | 0.17 0.04 | 1.55 0.67 | F H | 2.17 |
| UGC 5101 | 8.4e-14 | C | 15.02 0.73 | 3.08 0.37 | 11.85 0.63 | 3.85 0.51 | F S H | 3.33 |
| MCG+08-18-012 | 1.2e-14 | C | 0.06 0.18 | 0.09 0.13 | 0.36 | 4.00 | 1.74 | |
| MCG+08-18-013 | 3.7e-14 | C | 0.27 0.18 | 0.33 0.14 | 0.27 | 0.82 | 1.75 | |
| MCG–01-26-013 | 5.9e-15 | C | 0.28 | 0.20 | 0.24 | 3.90 | ||
| NGC 3110 | 9.4e-14 | C | 0.43 0.21 | 0.22 0.14 | 0.22 0.15 | 1.00 0.93 | 3.89 | |
| ESO 374-IG032 | 1.2e-14 | C | 0.24 0.12 | 0.21 0.09 | 0.04 0.08 | 0.19 0.39 | 11.9 | |
| NGC 3256 | 4.5e-13 | C | 6.36 0.17 | 4.92 0.14 | 1.42 0.09 | 0.29 0.02 | F S H | 13.2 |
| IRAS F10565+2448 | 3.8e-14 | C | 0.23 0.19 | 0.41 0.15 | 0.15 | 0.37 | 1.12 | |
| NGC 3690 West | 8.7e-13 | C | 26.03 0.46 | 11.90 0.31 | 14.08 0.34 | 1.18 0.04 | F S H | 0.936 |
| NGC 3690 East | (cont) | C | (cont) | (cont) | (cont) | 0.935 | ||
| ESO 440-58 | 1.7e-14 | C | 0.07 0.15 | 0.07 0.11 | 0.01 0.10 | 0.14 1.45 | 7.10 | |
| MCG–05-29-017 | 1.3e-14 | C | (cont) | (cont) | (cont) | 7.11 | ||
| IRAS F12112+0305 | 1.3e-14 | X | 0.08 0.19 | 0.22 0.15 | 0.22 | 1.00 | 1.93 | |
| NGC 4418 | 1.4e-14 | C | 0.31 0.12 | 0.19 0.09 | 0.12 0.09 | 0.63 0.56 | 2.09 | |
| MCG+00-32-013 | (cont) | C | (cont) | (cont) | (cont) | 2.09 | ||
| Mrk 231 | 5.3e-13 | C | 22.50 0.23 | 11.43 0.17 | 11.01 0.16 | 0.96 0.02 | F S H | 0.992 |
| NGC 4922S | 4.1e-15 | C | (cont) | (cont) | (cont) | 0.966 | ||
| NGC 4922N | 8.0e-14 | C | 3.49 0.42 | 1.59 0.28 | 1.84 0.30 | 1.16 0.28 | F S H | 0.966 |
| IC 860 | 2.2e-14 | C | 0.27 | 0.12 | 0.03 0.07 | 0.25 | 1.05 | |
| IRAS 13120–5453 | 1.7e-13 | C | 5.55 0.41 | 2.92 0.29 | 2.64 0.29 | 0.90 0.13 | F S H | 35.1 |
| NGC 5104 | 2.6e-14 | XRT | 0.50 0.21 | 0.15 0.13 | 0.33 0.16 | 2.20 2.18 | 1.95 | |
| MCG–03-34-064 | 1.6e-12 | C | 86.39 0.77 | 29.47 0.45 | 56.78 0.62 | 1.93 0.04 | F S H | 6.44 |
| NGC 5135 | 2.6e-13 | C | 13.48 0.51 | 5.27 0.33 | 8.19 0.39 | 1.55 0.12 | F S H | 6.02 |
| Mrk 266B/Mrk 266A | 1.7e-13 | C | 8.25 0.44 | 4.29 0.31 | 3.93 0.31 | 0.92 0.10 | F S H | 1.75 |
| Mrk 273 | 2.0e-13 | C | 26.62 0.47 | 9.48 0.29 | 17.01 0.37 | 1.79 0.07 | F S H | 0.909 |
| IRAS F14348–1447 | 2.5e-14 | C | 1.25 0.32 | 0.79 0.23 | 0.46 0.22 | 0.58 0.33 | F S (H) | 10.8 |
| IRAS F14378–3651 | 1.5e-14 | C | 0.28 0.18 | 0.26 0.13 | 0.02 0.12 | 0.08 0.46 | 8.22 | |
| IC 4518A | 1.0e-12 | X | 143.00 3.10 | 66.47 2.11 | 76.07 2.26 | 1.14 0.05 | F S H | 13.1 |
| IC 4518B | 8.4e-15 | XPN | (cont) | (cont) | (cont) | 13.0 | ||
| IRAS F15250+3608 | 8.7e-15 | X | 0.03 0.19 | 0.09 0.13 | 0.33 | 3.67 | 1.57 | |
| Arp 220W | 7.1e-14 | C | 2.03 0.19 | 1.54 0.15 | 0.49 0.12 | 0.32 0.08 | F S H | 4.58 |
| Arp 220E | (cont) | C | (cont) | (cont) | (cont) | 4.58 | ||
| NGC 6240S/NGC 6240N | 1.0e-12 | C | 108.00 1.36 | 26.96 0.69 | 80.72 1.17 | 2.99 0.09 | F S H | 6.26 |
| NGC 6285 | 1.4e-14 | C | 0.28 0.20 | 0.42 0.16 | 0.22 | 0.52 | 1.87 | |
| NGC 6286 | 5.0e-14 | C | 3.31 0.43 | 0.93 0.27 | 2.38 0.33 | 2.56 0.82 | F S H | 1.87 |
| IRAS F17138–1017 | 8.8e-14 | C | 2.72 0.34 | 1.65 0.25 | 1.02 0.23 | 0.62 0.17 | F S H | 31.0 |
| IRAS F18293–3413 | 1.2e-13 | C | 1.76 0.27 | 1.33 0.22 | 0.44 0.16 | 0.33 0.13 | F S | 14.3 |
| IRAS F19297–0406 | 1.2e-14 | C | 0.38 0.21 | 0.19 0.14 | 0.20 0.15 | 1.05 1.11 | 28.2 | |
| NGC 6907 | 5.5e-14 | XRT | 1.06 0.24 | 0.62 0.17 | 0.42 0.16 | 0.68 0.32 | F S | 6.59 |
| NGC 6908 | (cont) | XRT | (cont) | (cont) | (cont) | 6.59 | ||
| NGC 6921 | 1.8e-13 | X | 22.27 0.91 | 4.47 0.44 | 17.75 0.80 | 3.97 0.43 | F S H | 34.4 |
| MCG+04-48-002 | 1.1e-12 | X | 34.81 1.00 | 10.00 0.55 | 24.72 0.84 | 2.47 0.16 | F S H | 34.5 |
| II Zw 096 | 8.7e-15 | C | (cont) | (cont) | (cont) | 9.16 | ||
| IRAS F20550+1655 SE | 5.8e-14 | C | 1.22 0.21 | 0.83 0.16 | 0.39 0.14 | 0.47 0.19 | F S | 9.16 |
| ESO 286-19 | 4.3e-14 | C | 0.64 0.14 | 0.42 0.11 | 0.20 0.10 | 0.48 0.27 | F S | 3.76 |
| NGC 7130 | 1.5e-13 | C | 10.75 0.34 | 2.89 0.19 | 7.86 0.28 | 2.72 0.20 | F S H | 2.11 |
| NGC 7469 | 1.9e-11 | XPN | 588.90 3.75 | 365.60 2.95 | 221.60 2.30 | 0.61 0.01 | F S H | 5.39 |
| IC 5283 | 1.1e-14 | X | (cont) | (cont) | (cont) | 5.39 | ||
| ESO 148-2 | 1.3e-13 | C | 0.86 0.15 | 0.55 0.11 | 0.31 0.10 | 0.56 0.21 | F S H | 1.68 |
| NGC 7591 | 4.4e-14 | C | 0.53 | 0.33 | 0.03 0.14 | 0.09 | 7.52 | |
| NGC 7674 | 3.5e-13 | X | 24.22 0.52 | 10.96 0.35 | 13.15 0.38 | 1.20 0.05 | F S H | 5.20 |
| MCG+01-59-081 | 1.6e-14 | X | (cont) | (cont) | (cont) | 5.19 | ||
| NGC 7679 | 4.2e-13 | X | 48.01 1.08 | 28.53 0.83 | 19.34 0.70 | 0.68 0.03 | F S H | 6.25 |
| NGC 7682 | 1.5e-13 | X | 12.07 0.60 | 5.09 0.39 | 6.88 0.45 | 1.35 0.14 | F S H | 6.40 |
Note. — Columns: (1) object name; (2–3) observed 2–7 keV flux corrected for Galactic absorption in units of erg s cm, and the facility of the soft X-ray data. Fluxes are calculated from the best-fitting spectral model described in Section 4.2. For the sources mentioned in Section 2.5 and the undetected sources (given as upper limits), they are converted from the X-ray count rates with the HEASARC tool WebPIMMS (v4.11a; https://heasarc.gsfc.nasa.gov/cgi-bin/Tools/w3pimms/w3pimms.pl) assuming a power-law of = 1.8 with Galactic absorption. The adopted soft X-ray observations of Chandra (C), XMM-Newton/MOS (X), pn (XPN), and Swift/XRT (XRT) are listed in Column (3). (4–6) background-subtracted net count rates of combined NuSTAR observations in the full (3–24 keV), soft (3–8 keV) and hard (8–24 keV) bands in units of 10 cts s; (7) NuSTAR Band ratio (i.e., the ratio of 8–24 keV and 3–8 keV count rates); (8) NuSTAR 3 detection in the full (F), soft (S), and hard (H) bands; (9) hydrogen column density of Galactic absorption in units of 10 cm (Willingale2013). The (cont) means that the value is smaller than that of the interacting galaxy, and is difficult to estimate due to its contamination. The error is 1, and the upper and lower limits are 3 levels.
The spectral model in the xspec terminology is represented as:
| (2) |
In the fist term, const1 and phabs represent the instrumental cross-normalization factor and Galactic absorption, respectively. The zphabs accounts for an absorption of the host galaxy when required (only for NGC 3690W, UGC 5101, and IRAS 13120–5453). The first term represents the direct component modeled by an absorbed power-law with an exponential cutoff, which is fixed at 300 keV (e.g., Dadina2008). The photon index () is set to be a free parameter between 1.5 and 2.5. When it cannot be well constrained, we fix it at 1.8 as a typical value in AGNs (e.g., Ueda2014; Ricci2017dApJS). We consider Compton scattering effect out of the line of sight (cabs), whose hydrogen column density () is tied to that of photometric absorption (zphabs). The const2 factor () is a constant to take account of time variability among different instruments. This is allowed to vary within 0.1–10 (i.e., a factor of 10 in variability) in order to avoid unrealistic solutions.
The second term, an unabsorbed cutoff power-law, represents the scattering component from the AGN and/or the emission from XRBs in the host galaxy. The normalization is linked to that of the direct component, while the photon index () is allowed to vary between 1.5 and 3.0.121212This is because in reality the “scattered” component may contain many soft X-ray emission lines from a photoionized plasma that are hard to be resolved with CCD spectra, making the apparent slope (i.e., that obtained with a simple power law model) steeper than that of the direct component. The const3 is multiplied, which gives a fraction of the unabsorbed emission () relative to the transmitted AGN component at 1 keV, containing both the XRB and scattered AGN components. Its range is restricted within 0%–20%.131313The typical scattering fraction is 5% for the obscured AGNs with cm from the 70-month Swift/BAT catalog (Gupta2021), while the for AGNs in stage-D mergers are 10%, indicating that the component of XRBs may significantly affect the values (see Section LABEL:sub6-3_X-SFR). For the three stage-D mergers whose const3 values cannot be constrained (IRAS F08572+3915, Arp 220W, and IRAS F17138–1017), we adopt 10% as a typical value obtained from the other stage-D mergers.
The third and fourth terms are the table models of XCLUMPY, providing the reflection continuum (xclumpy_R.fits) and fluorescence emission lines (xclumpy_L.fits), respectively. The free parameters are the hydrogen column density along the equatorial plane (: 10–10 cm), torus angular width (: 10°–70°), and inclination of the observer (: 20°–87°).141414The inner ( = 0.05 pc) and outer radii ( = 1.00 pc), the radius of each clump ( = 0.002 pc), the number of the clumps along the equatorial plane ( = 10), and the index of radial clumpy distribution ( = 0.5) are fixed. When these values are not well constrained, we first fix the inclination to either 30°, 60°, or 80° that gives the smallest or C value. Furthermore, if is not well determined, we fix it to be 20°, a typical value obtained from a local AGN sample (Ogawa2021).151515The averaged value of that we can constrain, 22°, is consistent with the adopted typical value (20°). We note that, even if different values of , 10° and 30°, are adopted, the main results are almost unchanged except for the torus covering factors. Thus, the torus covering factors are not calculated when is fixed (Section LABEL:subsub5-3-4_Edd). We link the line-of-sight column density () in the first term to the value converted from these torus parameters by following Equation (3) in Tanimoto2019. When is found to be variable among the observation epochs of different satellites, it is set to be a free parameter. The normalizations and photon indices are fixed to those of the direct component. The fifth term is optically-thin thermal emission in the host galaxy modeled by the apec code (Smith2001). Whenever necessary, we consider two or three components with different temperatures.
The best-fit spectra of the 30 AGNs are shown in Figures LABEL:C1-F–LABEL:C5-F. The best-fit parameters, observed X-ray fluxes, observed X-ray luminosities, and the equivalent width (EW) of the Fe K line are summarized in Table 5, including the the results of UGC 2608, NGC 5135 (Yamada2020), and NGC 7469 (Ogawa2021) analyzed with the XCLUMPY model. Thus, we finally obtain X-ray spectral results of 40 AGNs, consisting of 33 AGNs analyzed with XCLUMPY and 7 AGNs for which we refer to the literature (NGC 1068, NGC 1275, NGC 1365, Mrk 266B/Mrk 266A, and NGC 6240S/NGC 6240N). Comparison of our results with previous works for individual sources is summarized in Appendix LABEL:Appendix-B.
4.2.2 Starburst-dominant Model
We apply a starburst-dominant model to the two sources detected with NuSTAR in the 8–24 keV band (IC 1623A and NGC 3256), and to the 27 sources not detected with NuSTAR in this band. Hereafter, we call these two and 27 sources as “starburst-dominant sources” and “hard X-ray undetected sources”, respectively. The two starburst-dominant sources show the smallest values of the band ratio, BR 0.3, among the hard X-ray detected sources. This means that their spectra are steeper than those of AGNs in the 3–24 keV range (see also Section LABEL:sub5-1_Xcolor). Actually, their broadband spectra cannot be well reproduced with the AGN model because of the high energy cutoff features around 10 keV.161616Although Arp 220W also shows BR 0.3, it does not show such a cutoff feature at 10 keV. If we fit the spectrum with zcutoffpl, we obtain keV (see Appendix LABEL:Appendix-B). Moreover, there are little signatures of AGNs in these starburst-dominant and hard X-ray undetected sources based on multiwavelength observations as discussed in Appendix LABEL:Appendix-B.171717Although IC 1623B might have an AGN, its X-ray emission is much weaker than that of IC 1623A (e.g., Grimes2006).
The starburst-dominant model is described as
| (3) |
The cross-normalization (const1) and Galactic absorption (phabs) are the same as those in the AGN model. The absorption by the host galaxy (zphabs) is adopted only for NGC 3256. The first term represents emission from XRBs in the host galaxy. We note that this component would include a scattered component from the AGN if present. The photon index () is allowed to vary between 1.5 and 3.0. The second term is optically-thin thermal emission modeled by apec.
The best-fit spectra are shown in Figures LABEL:C6-F–LABEL:C10-F. The best-fit parameters, observed fluxes, and observed luminosities are listed in Table 6. Appendix LABEL:Appendix-B compares the results of our spectral analysis with those of previous studies for the individual sources.
4.2.3 Additional lines
The XCLUMPY model contains fluorescence lines from elements with atomic numbers up to , among which the Fe K line at 6.4 keV is the strongest. Besides them, we also include Gaussian components (zgauss in xspec) to model other prominent emission lines when required. In particular, emission lines from highly ionized iron ions (Fe XXV and Fe XXVI) at 6.7–7.0 keV are often detected from C-GOALS objects, which are most probably produced by highly ionized interstellar medium energized by starburst activities (see e.g., Iwasawa2009; Iwasawa2011; Lindner2012; Gilli2014). Also, Si XIII line at 1.86 keV is often observed, which originates from AGN photoionized gas and/or thermal emission from the starburst region. Accordingly, we add these highly-ionized Fe and Si K lines if they are found to significantly improve the fit. When necessary, we also consider other emission lines (O VIII K at 0.654 keV, Mg XI K at 1.342 keV, and Ni K at 7.48 keV). The best-fit values of these additional lines, adopted for nine sources, are listed in Table LABEL:T7_bestpara-lines.
| Object | ||||||||||
|---|---|---|---|---|---|---|---|---|---|---|
| (1) | (2) | (3) | (4) | (5) | (6) | (7) | (8) | (9) | (10) | (11) |
| (12) | (13) | (14) | (15) | (16) | (17) | (18) | (19) | (20) | (21) | |
| log | log | log | log | log | log | log | log | EW | / (C/C) | |
| (22) | (23) | (24) | (25) | (26) | (27) | (28) | (29) | (30) | (31) | |
| Stage-A | ||||||||||
| NGC 833 | 26.1 | 32.0 | 13.7 | 60 | 1.98 | 10.2 | 2.49 | 0.6 | ||
| 0.64 | 0.80 | 1.20 | 0.44/0.58 | |||||||
| 13.65 | 12.16 | 11.62 | 39.53 | 39.67 | 39.92 | 41.41 | 41.95 | 49 | 185.9/1.18 [] | |
| NGC 835 | 29.8 | 100.0 | 12.4 | 60 | 1.50 | 5.1 | 2.27 | 2.3 | ||
| 0.89 | 0.41 | 0.81 | 0.95 | 1.95/0.11 | ||||||
| 13.10 | 12.10 | 11.28 | 40.34 | 40.02 | 40.52 | 41.51 | 42.33 | 60 | 338.3/1.05 [] | |
| NGC 6921 | 173.1 | 2.2 | 20.0 | 80 | 1.67 | 33 | 3.00 | 0.6 | ||
| 0.36 | 1.20 | 0.45 | ||||||||
| 13.07 | 12.46 | 11.09 | 40.22 | 40.37 | 40.60 | 41.19 | 42.58 | 1039 | 42.2/0.84 [] | |
| MCG+04-48-002 | 72.7 | 4.4 | 22.4 | 60 | 1.66 | 15.4 | 3.00 | 1.5 | 60.1 | |
| 0.49 | 1.14 | 1 | 3.55/5.46 | |||||||
| 13.02 | 12.16 | 11.07 | 40.24 | 40.37 | 40.62 | 41.46 | 42.57 | 385 | 142.9/1.13 [] | |
| NGC 7469 | 0.0015 | 2.1 | 12.4 | 45 | 1.86 | 101 | ||||
| 1.13 | ||||||||||
| 10.54 | 10.54 | 10.41 | 43.24 | 43.24 | 43.37 | 80 | 1696.2/1.09 [] | |||
| NGC 7674 | 29.6 | 3.6 | 37.9 | 30 | 1.66 | 5.1 | 2.79 | 10.4 | 13.6/10.3 | |
| 0.77 | 0.11 | 0.93 | 1.20 | 1.20 | 1.20 | 0.44 | ||||
| 12.67 | 12.14 | 11.36 | 41.29 | 41.35 | 41.62 | 42.12 | 42.92 | 248 | 202.2/1.10 [] | |
| NGC 7679 | 3e-7 | 0.1 | 10.0 | 30 | 1.77 | 9.5 | (=) | |||
| 0.38 | 1.04 | 1.05 | 1.20 | 0.16 | ||||||
| 11.68 | 11.47 | 11.34 | 40.52 | 42.14 | 42.34 | 42.48 | 11 | 423.8/1.10 [] | ||
| NGC 7682 | 38.2 | 0.5 | 60.2 | 60 | 1.8 | 4.0 | 1.56 | 2.3 | ||
| 0.26 | 1.09 | 0.51 | ||||||||
| 13.52 | 12.42 | 11.79 | 39.82 | 40.12 | 40.30 | 41.38 | 42.02 | 231 | 58.8/1.20 [] | |
| Stage-B | ||||||||||
| NGC 235 | 51.4 | 6.2 | 19.0 | 60 | 1.68 | 43 | 3.00 | 0.5 | 29.3 | |
| 0.92 | 0.94 | 1.17 | (=) | 0.52 | ||||||
| 13.10 | 11.56 | 10.61 | 40.49 | 40.73 | 40.95 | 42.47 | 43.43 | 216 | 119.8/1.17 [] | |
| CGCG 468-002W | 1.5 | 1.0 | 14.7 | 60 | 1.63 | 23.2 | (=) | 3.7 | ||
| 0.80 | 0.80 | |||||||||
| 12.04 | 11.01 | 10.71 | 41.11 | 41.78 | 42.82 | 43.12 | 71 | 442.4/1.08 [] | ||
| ESO 060-IG016 East | 8.4 | 0.8 | 20 | 60 | 1.8 | 0.6 | 1.8 | 9.6 | ||
| 1.20 | ||||||||||
| 13.93 | 12.88 | 12.56 | 40.74 | 40.75 | 41.78 | 42.11 | 83 | 18.4/1.15 [] | ||
| IC 4518A | 17.1 | 3.2 | 17.5 | 60 | 1.81 | 35.0 | 1.66 | 0.6 | 21.6 | |
| 0.90 | 0.26 | 1.07 | 1.20 | 1.20 | 1.14 | 0.34/0.82 | ||||
| 12.87 | 11.32 | 10.80 | 40.71 | 40.42 | 40.90 | 42.45 | 42.98 | 105 | 772.6/1.12 [] | |
| NGC 6286 | 140.2 | 1.8 | 20 | 80 | 1.50 | 2.5 | 1.90 | 5.6 | ||
| 0.79 | 0.80 | 0.99 | ||||||||
| 12.95 | 13.03 | 11.88 | 40.79 | 40.36 | 40.93 | 40.84 | 42.00 | 559 | 893.4/1.01 [C] | |
| Stage-C | ||||||||||
| MCG+12-02-001 | 707.5 | 67.1 | 20 | 60 | 1.8 | 3.1 | 2.20 | 20.0 | ||
| 1 | ||||||||||
| 12.88 | 12.91 | 12.54 | 40.86 | 40.86 | 40.83 | 41.20 | 222 | 262.8/0.90 [C] | ||
| IRAS F06076–2139 | 42.2 | 4.0 | 20 | 60 | 1.8 | 1.5 | 1.8 | 3.3 | ||
| 1 | ||||||||||
| 13.99 | 12.96 | 12.22 | 40.51 | 40.52 | 41.53 | 42.28 | 177 | 249.8/0.92 [C] | ||
| NGC 3690 West | 302.6 | 0.45 | 18.0 | 44.9 | 30 | 2.23 | 111 | 1.84 | 2.3 | |
| 0.95 | 0.26 | 0.04 | 1.13 | 0.92 | ||||||
| 12.07 | 12.00 | 11.23 | 42.02 | 41.10 | 41.29 | 41.36 | 42.14 | 391 | 612.1/1.18 [] | |
| NGC 4922N | 75.9 | 7.2 | 20 | 60 | 1.8 | 2.4 | 1.79 | 4.7 | ||
| 1.00 | 1 | |||||||||
| 13.41 | 12.96 | 12.07 | 40.29 | 40.48 | 40.69 | 41.12 | 42.03 | 261 | 323.3/0.83 [C] | |
| ESO 148-2 | 158.5 | 2.0 | 20 | 80 | 1.8 | 1.6 | 1.70 | 7.2 | 2.7/24.6 | |
| 0.79 | 0.95 | 1.01 | 1 | |||||||
| 13.31 | 13.22 | 12.47 | 41.05 | 41.06 | 41.35 | 41.43 | 42.19 | 277 | 2323.2/0.97 [C] | |
| Stage-D | ||||||||||
| NGC 34 | 50.3 | 4.8 | 20 | 60 | 1.8 | 2.8 | 1.65 | 7.9 | ||
| 0.77 | 1.16 | 1.11 | ||||||||
| 13.18 | 12.62 | 11.91 | 40.20 | 40.61 | 40.75 | 41.31 | 42.02 | 163 | 103.4/1.04 [] | |
| IRAS F05189–2524 | 7.5 | 49.0 | 11.8 | 60 | 2.19 | 35.3 | 2.92 | 1.1 | 299.3 | |
| 0.96 | 0.11 | 0.80 | 1.04 | 0.88 | 0.93 | 1.20 | 0.87/0.90 | |||
| 12.89 | 11.46 | 11.35 | 41.03 | 41.54 | 41.73 | 43.15 | 43.28 | 25 | 3522.7/1.17 [] | |
| NGC 2623 | 6.0 | 0.6 | 20 | 60 | 1.8 | 0.3 | 1.50 | 15.4 | ||
| 1.27 | 0.88 | 1 | ||||||||
| 13.79 | 13.01 | 12.71 | 39.60 | 39.91 | 40.10 | 40.87 | 41.17 | 61 | 597.9/0.90 [C] | |
| IRAS F08572+3915 | 84.6 | 8.0 | 20 | 60 | 1.8 | 0.24 | 1.50 | 10 | ||
| 1 | ||||||||||
| 14.31 | 13.75 | 13.01 | 40.58 | 40.59 | 41.13 | 41.88 | 170 | 1042.0/0.91 [C] | ||
| UGC 5101 | 96.3 | 0.11 | 100.0 | 11.2 | 65.9 | 1.50 | 7.6 | 1.66 | 1.6 | 147.9 |
| 0.89 | 0.87 | 1.02 | 1.12 | 1.19 | 1 | |||||
| 13.58 | 12.56 | 11.33 | 40.44 | 40.95 | 40.96 | 41.96 | 43.21 | 249 | 172.6/1.02 [] | |
| Mrk 231 | 8.5 | 0.5 | 22.6 | 60 | 1.50 | 2.1 | 1.50 | 16.6 | ||
| 0.81 | 1.18 | 1.00 | 1.06 | 1.09 | 0.70/0.63 | |||||
| 12.97 | 12.04 | 11.56 | 41.11 | 41.49 | 41.64 | 42.56 | 43.05 | 81 | 1301.7/1.19 [] | |
| IRAS 13120–5453 | 164.8 | 0.43 | 2.1 | 20 | 80 | 1.8 | 2.1 | 1.50 | 16.3 | |
| 1.26 | 0.18 | 1.11 | 1.01 | |||||||
| 13.00 | 12.68 | 12.15 | 42.09 | 41.20 | 41.33 | 41.65 | 42.18 | 107 | 327.6/1.15 [] | |
| Mrk 273 | 49.6 | 10.0 | 17.3 | 60 | 1.71 | 9.7 | 1.51 | 2.3 | 92.5/172.8 | |
| 1.00 | 0.31 | 0.92 | 1.00 | 1.02 | 1.10 | 0.80 | ||||
| 13.04 | 12.15 | 11.29 | 41.16 | 41.20 | 41.48 | 42.34 | 43.22 | 148 | 349.5/1.12 [] | |
| IRAS F14348–1447 | 128.3 | 1.6 | 20 | 80 | 1.8 | 1.0 | 1.74 | 9.7 | ||
| 0.77 | 0.80 | 1.20 | ||||||||
| 13.59 | 13.34 | 12.64 | 41.08 | 41.50 | 41.64 | 41.85 | 42.57 | 232 | 776.9/0.91 [C] | |
| Arp 220W | 1000.0 | 100.0 | 20 | 60 | 1.8 | 1.6 | 1.50 | 10 | ||
| 0.91 | 0.90 | 0.97 | 1.20 | 1.20 | ||||||
| 13.22 | 12.97 | 12.57 | 40.24 | 40.41 | 40.64 | 40.89 | 41.29 | 120 | 350.6/1.20 [] | |
| IRAS F17138–1017 | 1000.0 | 100.0 | 20 | 60 | 1.8 | 2.1 | 1.50 | 10 | ||
| 1 | ||||||||||
| 13.33 | 12.92 | 12.45 | 40.49 | 40.50 | 40.91 | 41.38 | 120 | 283.9/0.81 [C] | ||
| Stage-N | ||||||||||
| UGC 2608 | 540 | 15 | 10.0 | 80 | 1.8 | 96 | 2.87 | 0.6 | ||
| 0.82 | 0.97 | 1.20 | 1.20 | |||||||
| 12.60 | 12.67 | 11.48 | 41.20 | 41.18 | 41.49 | 41.41 | 42.60 | 1430 | 75.1/1.04 [] | |
| MCG–03-34-064 | 98.4 | 9.2 | 20.1 | 60 | 2.01 | 127 | 3.00 | 0.6 | 56.1 | |
| 1.93 | 0.82 | 0.12 | 0.80 | 0.98 | 1.01 | 1.46 | ||||
| 12.22 | 11.77 | 10.73 | 41.40 | 41.02 | 41.57 | 42.00 | 43.06 | 425 | 2410.3/1.20 [] | |
| NGC 5135 | 670 | 9.5 | 10.0 | 84.1 | 1.71 | 126 | 2.64 | 0.9 | ||
| 0.88 | 0.94 | 1.03 | 1.08 | |||||||
| 12.37 | 12.43 | 11.35 | 40.84 | 41.03 | 41.25 | 41.19 | 42.26 | 2520 | 164.1/1.04 [] | |
| NGC 7130 | 413.3 | 4.9 | 24.7 | 80 | 1.65 | 30 | 2.39 | 2.0 | ||
| 1.09 | 0.68 | 0.96 | 1.20 | 1.20 | 1.20 | |||||
| 12.62 | 12.67 | 11.33 | 40.79 | 40.89 | 41.16 | 41.10 | 42.43 | 1426 | 186.7/1.13 [] | |
Note. — Columns: (1) object name; (2) line-of-sight hydrogen column density measured with NuSTAR in [10 cm]. The error is estimated by linking the torus parameters and using a Markov Chain Monte Carlo (MCMC) chain with a length of 40,000; (3) hydrogen column density of the host galaxy of the target in [10 cm]; (4) equatorial hydrogen column density in [10 cm]; (5–6) torus angular width and inclination in [degree]. When these values are not well constrained, we fix the parameters as described in Section 4.2.1; (7–8) power-law photon index of the AGN-transmitted component, and its normalization at 1 keV in [10 keV cm s]; (9–10) power-law photon index of the XRB and scattered components, and the fraction relative to the transmitted component at 1 keV in [%]; (11) time variable line-of-sight hydrogen column densities in the epochs of the Chandra (C), XMM-Newton (X), Suzaku (S), Swift/XRT (XRT) and BAT (B) observations in [10 cm]; (12–14) temperatures of the apec components in [keV]; (15–20) instrumental cross normalizations of Chandra/ACIS, XMM-Newton/pn, Suzaku/XIS-FI, XIS-BI, Swift/XRT, and BAT, respectively; (21) time variability constant of the Chandra, XMM-Newton, Suzaku, and Swift/BAT observations; (22–24) logarithmic observed fluxes in the 0.5–2 keV, 2–10 keV, and 10–50 keV bands in [erg s cm]; (25–26) logarithmic luminosities of the components of apec and the unabsorbed X-ray emission in the 0.5–2 keV band in [erg s]; (27–29) logarithmic observed luminosities in the 0.5–2 keV, 2–10 keV, and 10–50 keV bands in [erg s]. The fluxes and luminosities are corrected for Galactic absorption; (30) EW of the Fe-K line in [eV]; (31) value of Cash [C] or statistics, and the reduced one divided by degrees of freedom. The mark (f) means a fixed value. The results of UGC 2608, NGC 5135 (Yamada2020), and NGC 7469 (Ogawa2021) are obtained by analyzing the spectra with XCLUMPY in the same manner.
| Object | |||||||||
|---|---|---|---|---|---|---|---|---|---|
| (1) | (2) | (3) | (4) | (5) | (6) | (7) | (8) | (9) | (10) |
| log | log | log | log | log | log | / (C/C) | |||
| (11) | (12) | (13) | (14) | (15) | (16) | (17) | (18) | (19) | |
| Stage-A | |||||||||
| NGC 838 | 1.50 | 41.6 | 4.7 | 0.79 | 0.83 | 1 | 0.96 | ||
| 12.81 | 13.09 | 40.48 | 40.42 | 40.75 | 40.48 | 2206.1/1.07 [C] | |||
| NGC 839 | 1.50 | 19.0 | 0.84 | 1 | 1.18 | 1.12 | |||
| 13.27 | 12.99 | 39.64 | 40.19 | 40.30 | 40.58 | 1820.6/0.92 [C] | |||
| MCG+08-18-013 | 1.50 | 9.8 | 1 | ||||||
| 13.67 | 13.29 | 40.51 | 40.51 | 40.89 | 63.1/0.73 [C] | ||||
| MCG–01-26-013 | 1.8 | 2.3 | 0.38 | 1 | 1 | 1 | |||
| 13.98 | 14.11 | 39.51 | 39.47 | 39.79 | 39.66 | 397.4/0.94 [C] | |||
| NGC 3110 | 1.77 | 35.0 | 0.74 | 1 | 0.98 | 0.80 | |||
| 12.90 | 12.90 | 40.51 | 40.69 | 40.91 | 40.90 | 1102.3/0.96 [C] | |||
| NGC 4418 | 1.50 | 3.7 | 0.68 | 1 | 1.20 | ||||
| (=) | 13.98 | 13.70 | 38.47 | 39.06 | 39.16 | 39.44 | 852.6/1.02 [C] | ||
| Stage-B | |||||||||
| MCG–02-01-052 | 1.52 | 2.3 | 0.56 | 1 | |||||
| 14.10 | 13.93 | 39.72 | 39.92 | 40.13 | 40.29 | 68.9/0.78 [C] | |||
| MCG–02-01-051 | 1.66 | 18.7 | 0.83 | 1 | |||||
| 13.25 | 13.11 | 40.44 | 40.82 | 40.97 | 41.11 | 135.2/0.78 [C] | |||
| NGC 232 | 1.63 | 11.6 | 0.97 | 1 | |||||
| 13.34 | 13.29 | 40.37 | 40.46 | 40.72 | 40.77 | 131.1/0.80 [C] | |||
| ESO 440-58 | 1.70 | 6.0 | 1 | ||||||
| 13.89 | 13.63 | 40.20 | 40.20 | 40.45 | 36.9/0.84 [C] | ||||
| MCG–05-29-017 | 1.8 | 4.4 | 0.97 | 1 | |||||
| 13.45 | 13.79 | 40.48 | 40.04 | 40.62 | 40.29 | 56.6/0.81 [C] | |||
| IC 4518B | 1.50 | 2.2 | 0.28 | 1 | |||||
| 14.06 | 13.92 | 39.33 | 39.42 | 39.68 | 39.81 | 226.9/0.85 [C] | |||
| NGC 6285 | 2.14 | 8.9 | 1 | 1 | 1 | ||||
| 13.72 | 13.76 | 40.19 | 40.19 | 40.16 | 534.1/1.02 [C] | ||||
| NGC 6907 | 1.8 | 21.2 | 0.55 | ||||||
| 1 | 12.84 | 13.14 | 40.39 | 40.06 | 40.56 | 40.26 | 104.4/1.03 [C] | ||
| Stage-C | |||||||||
| ESO 350-38 | 1.50 | 39.2 | 6.6 | 0.94 | 1.20 | ||||
| 13.03 | 13.01 | 40.30 | 40.84 | 40.95 | 40.98 | 446.9/1.12 [C] | |||
| IC 1623A | 1.50 | 70.5 | 8.1 | 0.79 | 1.16 | 1 | 0.93 | ||
| 12.65 | 12.69 | 40.91 | 41.09 | 41.31 | 41.28 | 526.6/1.13 [] | |||
| NGC 4922S | 1.8 | 1.5 | 0.82 | 1 | |||||
| 13.91 | 14.28 | 40.08 | 39.61 | 40.21 | 39.84 | 63.0/0.90 [C] | |||
| II Zw 096 | 1.50 | 2.4 | 0.27 | 1 | |||||
| 13.97 | 13.91 | 40.24 | 40.16 | 40.50 | 40.55 | 23.0/0.77 [C] | |||
| IRAS F20550+1655 SE | 1.50 | 26.9 | 12.2 | 0.80 | 0.80 | 1 | 1.03 | ||
| 13.09 | 13.03 | 40.93 | 41.17 | 41.36 | 41.42 | 1674.3/0.90 [C] | |||
| Stage-D | |||||||||
| ESO 374-IG032 | 1.8 | 5.1 | 0.33 | 1 | |||||
| 13.70 | 13.78 | 40.41 | 40.45 | 40.73 | 40.64 | 52.6/0.75 [C] | |||
| NGC 3256 | 0.18 | 2.06 | 235.8 | 16.1 | 0.37/0.98 | 1.19 | 1 | 0.98 | |
| 12.07 | 12.35 | 41.27 | 40.98 | 41.22 | 40.95 | 763.5/1.20 [] | |||
| IRAS F10565+2448 | 1.50 | 10.1 | 0.94 | 1 | 0.95 | 1.03 | 1.20 | ||
| 1.20 | 13.47 | 13.28 | 40.74 | 40.96 | 41.17 | 41.36 | 1627.5/0.93 [C] | ||
| IRAS F12112+0305 | 1.75 | 4.9 | 0.94 | 1 | 1.03 | 0.82 | |||
| 13.85 | 13.79 | 40.76 | 41.10 | 41.26 | 41.33 | 418.8/0.89 [C] | |||
| IRAS F14378–3651 | 1.50 | 4.2 | 1 | ||||||
| 14.06 | 13.68 | 40.97 | 40.97 | 41.36 | 41.3/0.78 [C] | ||||
| IRAS F15250+3608 | 2.07 | 4.4 | 0.58 | 1 | 1.20 | 1.00 | |||
| 13.73 | 14.04 | 40.85 | 40.81 | 41.13 | 40.83 | 399.3/0.90 [C] | |||
| IRAS F19297–0406 | 1.8 | 4.6 | 1.01 | 1 | |||||
| 13.52 | 13.82 | 41.58 | 41.20 | 41.74 | 41.45 | 47.5/0.70 [C] | |||
| ESO 286-19 | 1.64 | 13.6 | 0.94 | 0.92 | 1 | 0.95 | |||
| 13.20 | 13.21 | 41.14 | 41.08 | 41.44 | 41.43 | 1183.5/0.88 [C] | |||
| Stage-N | |||||||||
| NGC 5104 | 2.67 | 32.5 | |||||||
| 1 | 13.15 | 13.52 | 40.75 | 40.75 | 40.38 | 39.4/0.90 [C] | |||
| IRAS F18293–3413 | 1.50 | 53.2 | 7.6 | 1.03 | 1.04 | 1 | 1.02 | ||
| 12.92 | 12.83 | 40.15 | 40.87 | 40.95 | 41.04 | 1626.9/1.02 [C] | |||
Note. — Columns: (1) object name; (2) hydrogen column density of the host galaxy of the target in [10 cm]; (3–4) power-law photon index of the XRB and scattered components, and its normalization at 1 keV in [10 keV cm s]; (5) cutoff energy in [keV]; (6) temperatures of the apec components in [keV]; (7–12) instrumental cross normalizations of Chandra/ACIS, XMM-Newton/MOS, pn, Suzaku/XIS-FI, XIS-BI, Swift/XRT, and BAT, respectively. The mark 1 means that it is set to unity as the calibration reference when the NuSTAR spectra have too poor statistics; (13–14) logarithmic observed fluxes in the 0.5–2 keV and 2–10 keV bands in [erg s cm]; (15–16) logarithmic luminosities of the components of apec and unabsorbed X-ray emission in the 0.5–2 keV band in [erg s]; (17–18) logarithmic observed luminosities in the 0.5–2 keV and 2–10 keV bands in [erg s]. The fluxes and luminosities are corrected for Galactic absorption; (19) value of Cash [C] or statistics, and the reduced one divided by degrees of freedom. The mark (f) means a fixed value.