Project Achoo: A Practical Model and Application for COVID-19 Detection from Recordings of Breath, Voice, and Cough
Abstract
The COVID-19 pandemic created significant interest and demand for infection detection and monitoring solutions. In this paper, we propose a machine learning method to quickly detect COVID-19 using audio recordings made on consumer devices. The approach combines signal processing and noise removal methods with an ensemble of fine-tuned deep learning networks and enables COVID detection on coughs. We have also developed and deployed a mobile application that uses a symptoms checker together with voice, breath, and cough signals to detect COVID-19 infection. The application showed robust performance on both openly sourced datasets and the noisy data collected during beta testing by the end users.
Index Terms:
Acoustic Signal Processing, Signal Detection, Biomedical informatics, Public Heathcare, Machine Learning, Big data applicationsI Introduction and Related Work
The continuing proliferation of smart devices and growth of their computational power have sparked research interest related to applications of machine learning for audio-based medical screening of respiratory infections and airborne diseases long before the COVID-19 pandemic. The primary motive was to enable affordable data-driven non-invasive health screening methods, which can be rapidly scaled up in response to public health emergencies and quickly adapted to particular public health concerns in infection hotspots. This is especially relevant whenever a high-risk population predominantly lives in remote areas or cases when access to skilled clinicians or care-takers is limited.
At the early stages of the COVID-19 pandemic, it was important not only to detect patients affected by the scourge, but also to estimate the severity of the disease by calculating the share of affected lung tissue, and to distinguish COVID-positive patients from those with other acute respiratory diseases, e.g. viral or bacterial pneumonia, in order to help doctors prioritize patients and provide treatment before a PCR result was confirmed. These reasons led machine learning practitioners to propose diagnostic methods that exploit visual information, such as chest X-ray images, computer tomography, or ultrasound studies (see references in [1]). Great progress has been made due to the availability of large datasets, and many clinics around the world have adopted automated image-based methods to help patients with COVID, [2]. However, further spread of the pandemic, coupled with discoveries about COVID’s contagiousness and course, emphasized the necessity of detecting asymptomatic carriers and infected persons without noticeably affected lung tissue at the early stages of the disease, since, in general, such patients are not compelled to reduce their social activity and thus could contribute to the sustained spread of the virus.
The simulation study [3] has shown that affordable COVID screening, even if less sensitive than clinical tests, allows to control the spread of the virus more effectively, by being able to be quickly scaled up and massively deployed. Furthermore, massive screening could reduce the exposure of first responders and critical frontline medical workers to virulent respiratory infections, [4]. However, medical imaging studies are impractical for rapid screening purposes and asymptomatic or unaware carriers are unlikely to undergo such studies or seek out a PCR test. An alternative could be to use the “everyday data” from smart devices, such as samples of voice, breath, and cough, as an input to an AI non-diagnostic pre-screening tool. The effectiveness of this approach rests on the hypothesis that at its early stages COVID-19 produces measurable physiological changes, such as sore throat, lung obstruction, or reduced blood oxygen saturation, [4].
In general, machine learning and deep learning methods for medical applications require large datasets with accurate and expertly verified ground truth. The onset of COVID-19 pandemic, however, has made it challenging to obtain sufficient volumes of high-quality clinically reliable data, collected under strictly controlled conditions, especially considering time constraints and logistical limitations. In such circumstances, some studies went with the crowdsourcing approach to collecting large open datasets of coughs for COVID, [5, 6], and [7], (see sec. II-A). Crowdsourcing, however, has severe limitations: lack of adherence to blinding protocols, i.e. the COVID status is known to the subject prior to participation, poorly controlled selection bias, ambient sound conditions, or other confounding variables, and, most importantly, unreliable ground-truth labels, i.e. self-reported COVID status versus a verified PCR test, [8, 9].
Despite these shortcomings, the available crowdsourced respiratory sound datasets could be valuable for pre-training deep neural networks for cough detection and COVID identification tasks, [8, 10]. Thus initialized models can be fine-tuned on a much smaller dataset of better quality, collected in a controlled setting and having the infection status verified through repeated properly conducted PCR test, [11]. This transfer learning approach is adopted in the current study: our solution is pre-trained on the crowdsourced data with weak labels (sec. II-A), then fine-tuned and tested on a privately commissioned higher grade dataset with strong labels (sec. II-B), and additionally validated on the real data, collected “in the wild” through a custom mobile application (sec. II-C).
Our key contributions are:
-
•
We propose an ensemble of deep convolutional neural networks and gradient boosted classifiers that together predict COVID status based on cough recordings (sec. III);
- •
-
•
We describe the implementation of the preprocessing and COVID diagnosing pipeline in a mobile application developed for rapid COVID screening (sec. V).
In the following section I-A we briefly survey the existing approaches to cough-based disease detection. Sections II and III describe the used datasets and the proposed approach, respectively, while in section IV we provide results of our experiments on the private data along with performance on the public datasets. Results of our models on crowdsourced data are presented in section V. We share the limitations of our work, concluding remarks, and outline further research directions in sections VI – VIII.
I-A Related Work
Respiratory diseases, such as measles, pertussis, flu, and, since 2020, SARS-CoV-2, are some of the key of public health concerns specifically due to their high viral potential. This has made breaths and coughs, which are the most common symptoms among these airborne diseases, the primary data in medical monitoring applications.
In the review, we focus mainly on summaries of the models and methods employed to achieve the desired goal of automated cough analysis, detection, or disease classification. The rationale is that, although most studies report remarkable sensitivity, specificity and performance under different cross-validation approaches, their use of private datasets, collected under differing acquisition protocols, or insufficient reporting of performance on community-accepted benchmark datasets severely complicate comparisons.
The data in these datasets typically features spontaneous or induced coughs, obtained from consenting participants that meet the requirements of a study and recorded on a dedicated smart device. In detection studies, the audio is evaluated by the presence of ambient sounds or speech, against which cough identification is to be performed. Disease classification studies consider demographic factors, avoid collection site imbalances and curate the data by the type and severity of the illnesses and recency of clinical tests for each particular disease.
Prior to feature extraction and analysis, the audio signal is commonly preprocessed with a low-pass filter with cut-off frequency at about kHz, the threshold determined in [12] to contain most of the spectral content of a cough. The respiratory data is then typically processed with the Short-time Fourier Transform, i.e. the time-frequency representation computed by the discrete Fourier transform of the signal in a sliding window with overlap. Subsequently, these spectrograms are transformed using filter banks which prioritise higher resolution in lower frequencies, e.g. Mel-scale (Mel-spectrogram) or Gammatone (cochleagram). Although based on perceptually equal contribution to speech articulation, these filter banks are frequently used for cough analysis since speech and cough generation share physiological similarities, [13]. In [14], it was observed that wet and dry coughs can be distinguished by their spectral power distribution at initial burst, noisy airflow and glottal closure phases, specifically in the kHz and Hz bands. This concentration of informative spectral content in lower frequencies justifies the use of Mel-spectrograms and cochleagrams, [13].
Research prior to 2017 tends to focus on acoustic or engineered features – the features based on multi-scale wavelet, spectral or time-domain analysis commonly employed in signal processing. Examples include the rate of sign change in the time-domain, indices, and values of the local extrema of the signal power in specific frequency bands, full or partial auto-correlation coefficients, etc. However, the most often used features are the Mel-Frequency Cepstral Coefficients (MFCC), computed as the discrete cosine transform of the log-spectrogram aggregated into Mel-scale frequency bins. Analysis of the pairwise Mutual Information in [15] concluded that the commonly used acoustic features complement each other in cough detection tasks. Other engineered features used in the studies include spectral spread and centroid, Sample Entropy, which measures the complexity and self-similarity of the time-series, non-Gaussianity statistics, and Linear Predictive Coding features, [16, 17, 18], and [19].
These acoustic features are used in a large variety of cough detection methods: a keyword spotting Hidden Markov model repurposed for continuous cough monitoring [16], a cough-speech classification tree [17], a 4-layer detector network with additional bispectral features [20], three Hidden Markov models stacked atop a neural network to distinguish cough from speech and ambient noise [12], and a -nearest neighbors classifier to detect the “initial burst” phase of a cough, built on the PCA of acoustic features, [21]. In [22] respiratory cycle segmentation was done using a recurrent network with an input noise masking mechanism driven by an auxiliary network, trained on the MFCC features. Going against the trend of increasing model complexity, the authors of [23] insist on a minimalist approach to cough detection and show that a logistic regression trained on just four acoustic features can deliver competitive sensitivity and specificity metrics, comparable with the state of the art.
Methods for automated cough-based diagnosis of respiratory diseases borrow many ideas and share technical similarities with detection. For instance, pneumonia can be discerned from other respiratory infections with a logistic regression on the acoustic features of a cough supplemented with wavelet transforms, [24, 25], or pertussis can be identified by a dedicated whoop detector and a cough classifier built with logistic regressions with greedily selected features, [19]. Chronic Obstructive Pulmonary Disease can be identified with a random forest, [26], or gradient boosted classifier ensembles on the MFCC features, [27]. Finally, the problem of croup diagnosis can be tackled with an SVM on 1st and 3rd moments of time-frequency sub-blocks of cough cochleagrams, [28]. Certain studies attempt to diagnose a condition without using coughs: a naïve Bayes classifier trained on acoustic features can detect if a patient has chronic cough purely from the recordings of their speech, [18].
Since 2015 the cough detection and classification research has been gradually moving towards deep features, i.e. hierarchical features with different local receptive fields produced by deep networks operating purely on spectrograms of the input signal or chunks thereof. Two key motives prompted this shift. The first was the recognition that the commonly used acoustic features were crafted for speech recognition applications, and, hence, inductively biased towards the human auditory system and perception. The second was the wider adoption of software frameworks for deep learning, coupled with greater availability of cutting-edge deep networks pretrained on large datasets.
Many studies repurpose or fine-tune the state-of-the-art deep architectures to the tasks of sound detection and respiratory disease classification. Indeed, it has been demonstrated that hierarchical spectral features learnt by a convolutional neural network (CNN) and long-term dependencies extracted by a recurrent network discriminate cough from speech and non-cough sounds better than handcrafted acoustic features, [29]. In [30] a CNN operating on Mel-spectrograms is shown to successfully diagnose bronchitis and bronchiolitis from the detected coughs. The study [13] identifies pertussis based on Mel-spectrograms and cochleagrams of coughs fed into an ensemble of convolutional networks pooled by an SVM. The author of [31] adopts the paradigm of learning using privileged information, and proposes an adversarial training method to suppress the effect of undesirable confounding variables on the outcomes of a convolutional cough-based tuberculosis classifier. The study [32] addresses the issue of varying quality of recordings by developing a device-agnostic bagging ensemble of architectures inspired by VGG-19, [33].
With the onset of the SARS-CoV-2 pandemic the volume of research on the feasibility and public health capabilities of fast and inexpensive audio-based diagnostics of respiratory illnesses have grown considerably, [1]. In particular, lung X-Ray and CT scan studies suggest that COVID-related coughs should have idiosyncratic signatures stemming from distinct underlying pathomorhpology, [4]. Surveys [34] and [35] provide references to non audio-based deep learning solution related to COVID, including disease identification from medical images and ultrasound, contact and spread tracking and tracing using facial recognition, screening of respiratory patterns, and protein analysis for drug discovery and virulence prediction.
Studies using respiratory audio related to COVID-19 collect curated datasets of sounds and symptoms from local hospitals or wards, paying special attention to patient eligibility criteria, prior knowledge of COVID status, and imbalance due to acquisition time, location, demographics, the equipment, and the hardware used to capture and record audio, [36, 8, 37, 38]. Other studies crowdsource the data through web or mobile apps, which is a more affordable and less time-consuming option, that yields much larger datasets, albeit of lesser quality both in the ground truth infection status labels and the audio recordings themselves, [39, 5, 10].
The machine learning methods and pipelines considered for cough-based COVID screening have for the most part continued prior audio-based disease identification research. For example, [39] identify COVID with non-deep classifiers trained on a subset of their crowdsourced dataset using acoustic features and VGGish embeddings [40] of breath cycles and coughs. A preliminary study [37] uses an extended acoustic feature set in a class-balanced linear support vector classifier to predict sleep quality, fatigue, anxiety levels and a proxy for COVID severity on patients from a COVID ward without a non-COVID control group. In [38] the authors collect a dataset of cough samples from patients with clinically verified qRT-PCR test outcome on which they develop a deep detection and COVID infection severity classification system, that operates on the Mel-spectrogram, the MFCC, and sliding partial autocorrelations. Another study [4] develops a screening tool that vets the input audio for coughs and combines the outputs of a committee of intermediate heterogeneous classifiers into a final COVID diagnosis by unanimous voting, abstaining in case of discord. SVM classifiers in the ensemble are built on the aggregated MFCC features and their principal projections, while the CNN classifiers are trained on Mel-spectrograms.
The diagnostic model from [10] aggregates salient information from biomarkers computed from MFCC of the input audio with three ResNet-50 models, [41], independently fine-tuned to detect sentiment, to measure vocal cord fatigue, and to capture acoustic idiosyncrasies due to respiratory tract structure. In another recent study [8], the authors build a two-layer classifier atop the deep feature extractor of a pre-trained ResNet-18, [41]. Their model is then fine-tuned on Mel-spectrograms for a cough detection task on a pooled non-COVID dataset of speech and respiratory sounds, [42, 43, 6], with each sample contaminated by a random background environmental noise, [44]. Finally, the model is further fine-tuned to identify COVID-positive coughs from a carefully curated dataset of three thousand samples collected from testing sites and COVID wards in India. The ablation study with stratified grouped cross-validation in [8] demonstrates that cough-non-cough pretraining and ensembling contribute positively to the performance of a stacked composite COVID-classifier, consisting of the deep ResNet-18 classifier and shallow models on acoustic features from [39]. The approach in [36] departs from cough event analysis and instead repurposes the voice embeddings, produced by a pre-trained transformer speech model, in an SVM-stacked ensemble of deep recurrent classifiers trained on voice samples of patients with COVID status verified by the RT-PCR test.
II Datasets
Datasets that were used in this work can be split into three types: prior crowdsourced, curated clinical, and newly collected data. Namely:
-
1.
Openly accessible moderately large crowdsourced cough datasets with unverified labels collected by other projects and researchers, e.g. [45],
-
2.
Smaller size curated private datasets with verified labels from hospitals and COVID wards in Russia acquired under proper participation and recording protocols,
-
3.
New cough and symptom data, being continuously collected in uncontrolled conditions from users of our mobile application since its initial release
This section describes all these types of data in more detail.
II-A Open Datasets
As of the time of writing, only three large cough datasets featuring COVID-19 positive samples were publicly available – the EPFL COUGHVID dataset [5], Coswara [6], and Covid19-Cough [7].
The EPFL dataset comprises records with self-reported COVID-positive. Each record contains cough recording and additional metadata like age, gender, symptoms, geographical location. Part of the dataset is annotated by three doctors. The Coswara dataset consists of about records including about from positive patients. Similarly to COUGHVID it contains additional metadata and the COVID status is self-reported. The Covid19-Cough dataset consists of samples with COVID-positive cases, of them confirmed by a PCR test. Samples were collected through a call-center and via Telegram messenger bot (see Table I).
| COVID status | ||
|---|---|---|
| Positive | Negative | |
| Telegram source | 186 | 438 |
| Call-center source | 496 | 204 |
| Total | 682 | 642 |
| COVID asymptomatic | 379 | — |
| Verified diagnosis | 382 | 0 |
II-B Proprietary Data
As mentioned earlier, the affordability of the crowdsourcing option comes at the cost of control over selection bias, confounding variables, and reliability of the ground-truth labels. The open datasets in the previous section suffer from these shortcomings, especially since the COVID status labels are self-reported and mostly unverified by a PCR test, i.e. weak. In order to make a mobile application using a deep learning model, which is capable of detecting COVID on cough, breath, and speech input, we have collected a private dataset with the infection status, verified by a PCR test. We expect that fine-tuning on a strongly labeled cough dataset would reduce the potential classification bias of the model trained on abundant, but weaker data, and, therefore, improve the final performance.
Each sample in the collected dataset consists of three audio recordings, symptom data, and COVID status. Every person who agreed to participate in the study has been recorded only once. We make sure each participant gives informed explicit consent prior to uploading their respiratory and voice samples and medical data to a cloud data storage for later processing. The type of collected data is similar to [39], but rather than asking for a specific number of isolated respiratory events, we limit the duration of of the recorded continuous coughing and breathing. We obtain two five-second audio samples of induced cough and breathing cycles, and a recording of the vocalized recitation of the Russian phrase “I hope, this recording will help battle the pandemic”.
Audio samples for COVID-positive cases were collected in hospitals and verified by both a PCR test and lung CT scan. COVID-negative participants were recorded in an office environment which required a recent and verified negative PCR test for entry. Ultimately, we obtained samples from healthy users and records from COVID-19 wards from two hospitals in Moscow, Russia. Although these samples could bias the dataset towards severe COVID-positive cases and provide little help in detecting asymptomatic carriers, when used to fine-tune the model they appear to improve its performance (see sec. IV). Since the number of samples in our private dataset was limited we have decided not to allocate a test set for testing the model’s performance, but keep a comparatively small subset of the collected data mainly for inevitable unit tests. This subsample comprises of randomly chosen recordings from COVID wards and eight random recordings of healthy people. We have one exclusion from this approach, namely, we used this small held out dataset to combine distinct ensembles into a single meta-ensemble (section IV-E. The rest of the collected private data was pooled with the Covid19-Cough dataset to fine-tune our models (section IV-D).
Along with the audio data, we have collected self-reported subjective symptom data by asking the participants to pick the symptoms from a list in Table II, which correlates with prior medical or clinical studies, [46] and [4, sec. I.C, II.A, and II.B] and was approved by practicing medical experts. The case numbers in the table reflect the incidence rate in the collected dataset.
II-C App data
The trained and validated models were deployed as a backend of our custom iOS / Android application, which we have used to collect similar respiratory audio, speech, and symptom data. No personal data or metadata was collected, other than the device model information, useful for adjusting for possible bias associated with the hardware. It is worth noting that this dataset is prone to label noise since COVID status is self-reported by the users, in contrast to the strongly labeled dataset, mentioned in the previous section ( the “Hospital” dataset).
We collected the validation dataset for section V and Figure 2 (“app data”) on the first day after the release of the application. During this time we collected records from unique devices: data points from unique iOS devices and – from unique Android devices.
| Symptom | Cases |
|---|---|
| Diarrhoea | 9 |
| Dyspnoea | 39 |
| Sore throat | 7 |
| Cough | 62 |
| Rash | 4 |
| Fatigue | 83 |
| Fever | 19 |
| Anosmia | 41 |
| Dry tongue | 27 |
| COVID positive | 102 |
| Total cases | 154 |
III the Method
Ensemble methods combine weak predictors into composite models with reduced bias or variance with the goal of improving prediction performance, [47]. Stacking uses a trained meta-model to combine raw predictive outputs of independent intermediate models, and bagging averages predictions of separate unbiased predictors decorrelated by data- and feature-level bootstrapping, random projections, and other methods. Boosting builds a superior predictive model by blending intermediate weaker ones through what amounts to stochastic gradient descent, with each model estimating a finite-sample approximation of the functional derivative of the loss.
The method we use in this study employs a hybrid ensemble approach (Figure 1) – we bag heterogeneous classifiers trained and fine-tuned on multiple datasets and stack a second level meta-model. It is possible to assign different weights to the intermediate models in order to achieve the desired trade-off in the classification performance metrics (Table VI). The overall ensemble analyzes the input respiratory audio using a diverse set of learnt and tuned patterns and supplements the detected “signal” with simple-to-observe, yet informative symptom data. By carefully combining fine-tuned predictors in the ensemble we improve the overall prediction quality of our method and achieve favorable bias-variance trade-off. The pipeline, depicted in Figure 1, represents the workflow of the app (see Section V). During training, each model in the ensemble outputs a probability of a binary label, without considering the possibility of “abstention” or “indecision”.
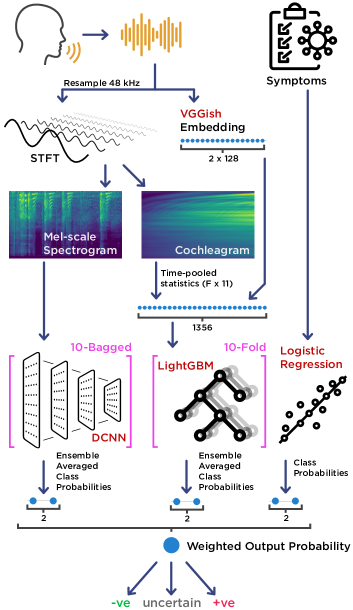
The pipeline starts with the quality control step, which uses a deep detector to filter out audio recordings that do not contain cough events (sec. V-A). At the preprocessing stage, we extract the VGGish features from the audio sample, [40], and compute its Mel-scale spectrogram representation (sec. III-A) as well as the time-aggregated statistics of its cochleagram (sec. III-A). The spectrogram is fed as-is into a bagged ensemble of deep convolutional networks trained and fine-tuned on sub-sampled datasets. At the same time, VGGish features are combined with the cochleagram statistics and passed into the gradient boosting ensemble. In parallel to the ensemble models, there is a binary COVID classifier trained on user-reported flu-like symptoms. The final step is computing the weighted average of the intermediate classifiers’ output probabilities.
In the remainder of this section, we detail our approach to selecting the preprocessing parameters, architectures and hyperparameters of the classifiers and ensembles.
III-A Mel-spectrogram
For the deep convolutional models, all audio recordings were resampled to kHz and the leading and trailing silence was trimmed. We did not apply any frequency filtering in order to preserve as much spectral data as possible. Afterwards, the cough waveforms were converted into time-frequency representation by the Short-Time Fourier Transform over sliding ms frames with ms strides and Hann windowing function using librosa package. The Mel-spectrograms were obtained by projecting the representations into -bin Mel filter-bank spanning Hz - kHz frequency range. During training, the Mel-spectrograms were augmented by randomly cropping or replicating them along the time axis to get same-duration chunks of roughly eight seconds. We also introduce auxiliary frequency-bin positional encoding as the second feature channel of the spectrogram.
We used the cochleagram statistics aggregated across the temporal dimension as the inputs for the gradient boosting ensemble model in our pipeline (Figure 1). These features were extracted for cough samples, and, if available, from breath and voice recordings. The input signal was transformed into cochleagrams using Brian2Hears package111 Auditory modelling toolbox. https://github.com/brian-team/brian2hears , with the number of frequency bins set to and other parameters kept at their default values. Next, we obtained a time-frequency representation of the input signal as a matrix with rows, one for each bin in the cochleagram, and columns, the number of which is determined by the duration of the input.
For each frequency bin, i.e. the vector of dimension , we computed values: the mean, median, standard deviation, skew, kurtosis, minimum, maximum, the first and the third quartiles, the interquartile range () and -norm. The resulting feature matrix was flattened and joined with the input’s VGGish -dimensional embeddings, [40]. Ultimately, we obtained a feature vector of length , that served as input into the subsequent ensemble (Figure 1)
IV Experiments and discussion
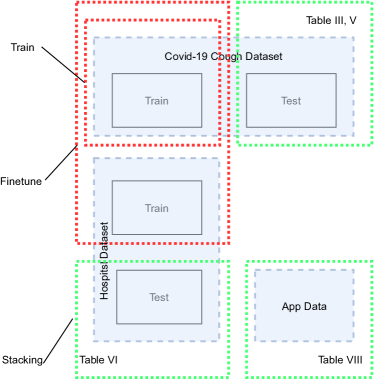
In this section we give a brief description of our training and fine-tuning procedure and introduce datasets we used (Figure 2); in the following section, we dive into details.
IV-A Training Procedure Overview
At the first stage we chose the best performing publicly available dataset, Covid19-Cough (see sec. II-A and Table III) and further used it to train our models: deep CNN and gradient boosting. We then collected two datasets: a dataset with “strong” labels, i.e. samples with comparatively good record quality and verified labels (we also refer to this dataset as “Hospital” dataset, see sec. II-B); and a crowdsourced dataset (App Data), that was collected via our app (see II-C). The former was split into a training set and a held out test set. The training set was used to fine-tune models fit on the open Covid19-Cough dataset, while the test subset was used i) for software unit testing and ii) to select parameters for stacking models into the ensemble (see sec. IV-D). We evaluate i) the classification quality of fine-tuned models on the Covid19-Cough dataset and ii) ensembles, obtained after stacking models on the test dataset and on the crowdsourced data collected via the app (see Table VIII).
IV-B Architecture and Fine-tuning
We used a modified light-weight CNN architecture based on [45], that supplemented the Mel-spectrogram image-like input by an additional channel corresponding to log-frequency positional encoding. The extra channel propagates through skip connections into deeper layers, which enables better localization and utilization of frequency information. On input the convolutional model receives the recorded sound of coughs preprocessed as described in sec. III-A.
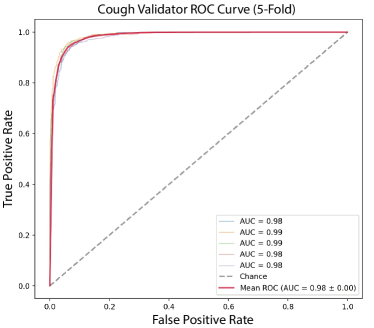
In order to train an ensemble of DCNN and a bagged ensemble of Gradient Boosted Trees we utilized -fold cross-validation on openly available datasets. Each fold was further split into train and validation subsets, which altogether correspond to a random train-validation-test split of the dataset.
We trained the gradient boosted classifier ensemble with LightGBM [48] using identical hyper-parameters on each fold, that were fine-tuned on validation datasets. The maximum number of leaves in a tree was , while the minimum number of data samples in one leaf was . We set the learning rate to and optimized the weighted cross entropy loss with regularization coefficient . The models were further fine-tuned using our private “Hospital” dataset (sec. II-B).
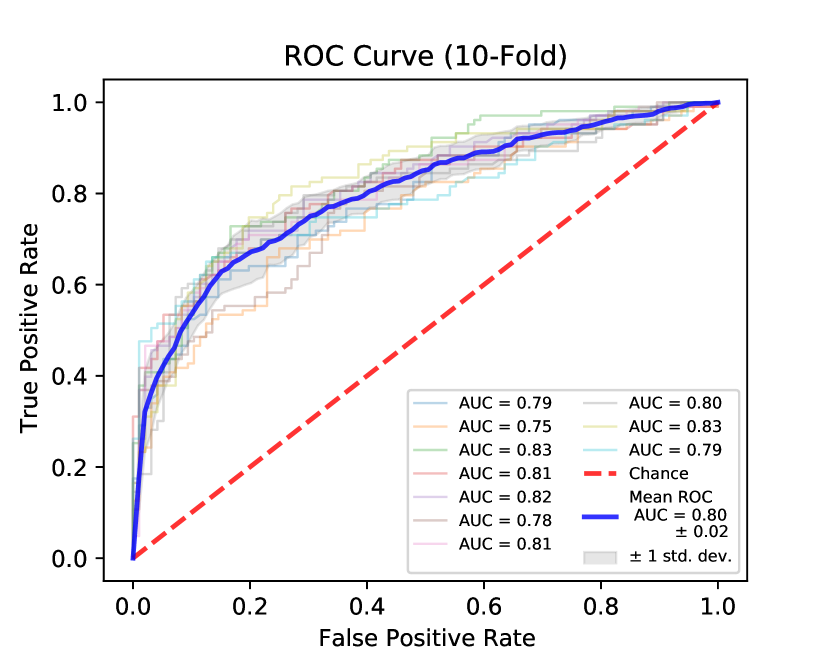
Figure 3 depicts ten ROC curves for each test split in the -fold cross-validation, with the average ROC AUC value of . We also tried to adopt the same training strategy for records of breath and speech, however, these ensembles did not substantially improve overall performance.
IV-C Performance on open datasets
In order to rank the open-access datasets in terms of the label quality we employed the following ad-hoc approach. We scored each openly accessible crowdsourced dataset by its -fold averaged ROC AUC and Matthews Correlation Score (MCC), [49], independently computed using each branch of our model (sec. III, Figure 1). Each replication in the -fold CV was split into 70%-15%-15% for train, model-selection, and test subsets, respectively.
| Dataset | ROC AUC | MCC | ||
|---|---|---|---|---|
| CNN | GB | CNN | GB | |
| EPFL | 0.630 | 0.592 | 0.112 | 0.154 |
| Coswara | 0.705 | 0.743 | 0.219 | 0.073 |
| Covid19-Cough | 0.801 | 0.747 | 0.456 | 0.408 |
The computed cross-validated classification scores are presented in Table III. When measured with the CNN branch, Coswara and the EPFL datasets exhibit more or less the same quality close to random guessing, while the Covid19-Cough dataset scores tangibly higher. Since the convolutional model used to get the scores is not over-parametrized to memorize the dataset, [50], and its architecture was shown to be effective in applications ([45], and Kaggle Freesound competition222 https://www.kaggle.com/c/freesound-audio-tagging-2019 ), we speculated that the variability of ROC AUC and the MCC scores between the datasets could be due to the potentially mislabelled COVID status in Coswara and the EPFL datasets, which, unlike Covid19-Cough, are also highly imbalanced. To evaluate this conjecture, we investigated the subset of recordings in the EPFL dataset that were additionally assessed by practicing medical doctors, [5]. Despite adequate recording quality indicated by the experts, these labels appeared to be uncorrelated with each other and with self-reported COVID status, which further lent evidence to the presence of COVID status noise and could explain the apparent disparity in ROC AUC and the MCC scores (Table IV).
| Self-reported | Expert 1 | Expert 2 | Expert 3 | |
|---|---|---|---|---|
| Self-reported | 1. | -0.051 | -0.036 | -0.024 |
| Expert 1 | -0.051 | 1. | 0.033 | 0. |
| Expert 2 | -0.036 | 0.033 | 1. | 0. |
| Expert 3 | -0.024 | 0. | 0. | 1. |
IV-D Fine-tuning
Models trained on the Covid19-Cough dataset were further fine-tuned using our “Hospital” data (see II-B). We fine-tuned the ensemble of CNN using records of cough. The gradient boosting ensemble was fine-tuned using records of cough, breath and vocalization, which we call GB, GBb and GBv respectively, resulting in three ensembles from Table V. The private data that we collected in hospitals was split into ten folds and combined fold-wise with the Covid19-Cough dataset. The goal of this stage was to train our models on data that are close to those that will be recorded by the users of our final application.
We report the mean classification metrics before and after fine-tuning, respectively, in columns “Covid19-Cough” and “Joined training set” of Table V. For both ensembles, CNN and GB, we provide mean ROC AUC and the MCC metrics averaged over the ten held out test subsets of the Covid19-Cough dataset. This explains why the MCC decreases while ROC AUC slightly increases for the gradient boosting.
| Model | Covid19-Cough | Joined training set | ||
|---|---|---|---|---|
| ROC AUC | MCC | ROC AUC | MCC | |
| CNN | 0.801 | — | 0.805 | — |
| GB | 0.747 | 0.408 | 0.749 | 0.385 |
| 0.749 | 0.364 | |||
| 0.686 | 0.383 | |||
| Name | ROC AUC | MCC | ||||
|---|---|---|---|---|---|---|
| Ensemble (Variant I) | 0.02 | 0.412 | 0.284 | 0.284 | 0.956 | 0.618 |
| Ensemble (Variant II) | 0.20 | 0.656 | 0. | 0.144 | 0.897 | 0.736 |
IV-E Stacking and Results on data from the app
We stacked the four previously trained ensembles (three gradient boosting ensembles from the previous section and the ensemble of CNN) using grid search over weights assigned to each ensemble’s prediction to maximize the classification metrics on the test data of our private dataset (see sec. II-B).
The goal of this stage was to find optimal weights that would maximize our target metrics while using the crowdsourced data from the app. We realize that the mentioned test dataset is relatively small, but we aimed to determine whether a recording of breath and vocalization would be able to improve the ensemble’s performance on crowdsourced data. In Table VI we report two variants of combining fine-tuned ensembles that maximize certain classification metrics. Every sub-ensemble output probability averaged over distinct predictors, thus the final probability of an ensemble is given by the formula:
where GB, GBb, and GBv stand for the gradient boosted ensemble fine-tuned, respectively, on cough, breath, and vocalization data.
Next, we provide the performance of our models on App data (see sec. II-C) in Table VIII. Results of CNN, GB, and Ensembles (Variants I and II) were measured using recordings of coughs, while GB-breath and GB-vocalization were measured on breath and vocalization data respectively. Ensembles fine-tuned on breath and vocalization have no predictive power per se, while ensembles trained and fine-tuned on coughs are more successful. This raises the question of the possibility of using such recordings for achieving good results in limited computational time. Another indication that cough recordings have higher signal compared to breath and vocalization is that among the two variants of our stacked ensemble, the best performance is achieved by a configuration with higher weights assigned to cough sub-ensembles, namely CNN and GB. Note that the results of CNN, GB are on par with those of Ensemble (Variant II).
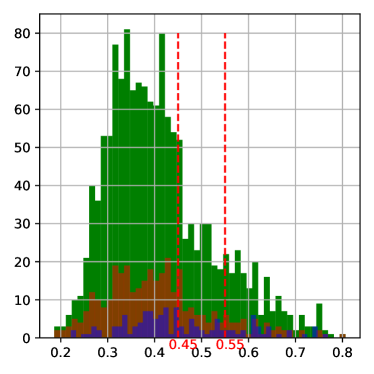
Not all users reported their health status – whether they are afflicted by any acute respiratory disease at the moment of recording. In Figure 4 we summarised how probabilities of one of our ensembles (Variant II) are distributed.
Green bars correspond to the overall distribution, red bars correspond to those cases where people verified that they do not have any acute respiratory diseases at the moment of recording, and blue bars correspond to those people who confirmed that they have respiratory disease(s) at the moment of recording. The red dotted lines correspond to uncertainty thresholds mentioned in section III, i.e. if the model predicts presence of the COVID with probability , the app informs the user about the model’s uncertainty, and allows the user to repeat the process from the beginning.
We see that the histogram of probabilities (Figure 4) is biased towards lower probabilities, namely, 80% of outcomes have probability lower than . For those cases where people indicated absence of acute respiratory diseases, is the -th quantile; for the cases where people indicated presence of respiratory diseases is the -th quantile. On the broader population, this bias should be even more salient, but we must take into account that the collected data might have more COVID-positive cases or other acute respiratory diseases than average due to the interest in the application in the first days of the release. From this observation, we may expect that our model’s probability distribution is not so far from the true distribution of having COVID. Whereas it is unclear how to estimate better than the Bernoulli distribution of either having COVID or not, it is clear that , i.e., the probability that a random person in the population is not affected by COVID is much greater than the opposite. Since our models trained on balanced input sources, frequencies, labels, etc., we suggest that the aforementioned bias towards lower probabilities validates that our model captures real distribution. On the other hand results of our models on the crowdsourced data are on par with those on the EPFL dataset. In section IV-C we concluded that for the mentioned dataset such a performance is a consequence of weak labels. We would like to suggest that the same issue might be the reason for the poor performance observed on our crowdsourced data.
It is important to mention that we were not able to restrict the health status self-reporting specifically to “COVID” due to the application store rules.
V Application
V-A Cough detection and Segmentation
Collected cough datasets and audio data coming from users of a diagnostic application have a number of issues that could prevent a correct diagnosis. Unlike cough sounds collected in controlled environments, crowdsourced audio samples and live data collected from users of the application may be severely contaminated with background sounds, e.g. music, speech, environmental noise, or feature audio of entirely irrelevant audio events, such as laughter, clapping or snoring. Besides contamination, data from different sources and datasets may have a varying audio quality due to subsampling, frequency filtering, and / or lossy compression, all of which adversely affect its spectral properties. At the same time, there is high variability in cough sounds even among the relevant “clean” samples themselves. Apart from isolated wheezes, throat clears, or strong exhalations, recordings might feature light coughs, and in many cases heavily clipped samples due to close proximity to the microphone, or partially cut-off cough events at the start or end of the recording, e.g. the burst without a subsequent noisy airflow.
It is, therefore, necessary to require a certain quality of the recorded respiratory event prior to feeding it into the COVID-19 diagnosis model, [4]. In order to make a correct diagnosis possible, while not overly inconveniencing the user, the system for determining the quality of a recording and detecting the presence of a cough event should strike a balance between false positive and false negative rates. A particular implementation may prompt the user for another attempt in the instance of a rejected recording, alongside a display of general instructions outlining the recommended distance to the device or the level of background noise (sec. V-C).
Since the recordings of coughs are the most important input to our model, we train and fine-tune a MobileNetV2 network, [51], for a cough detection task on manually labeled cough and non-cough data (see appendix A for training details). The architecture was chosen for its inference speed, size, and arithmetic complexity suitable for deployment on mobile devices. The dataset was compiled from public and proprietary sources (Table VII). Open datasets included Coswara [6], Covid19-Cough [7], COUGHVID [5], Virufy [52], and FSD50K [53], while proprietary data was collected from call-centers, patient recordings made by hospital staff, and our mobile application.
| Sources | Accept | Reject | Light Cough | Clipping | Throat Clear | Inaudible | Total |
|---|---|---|---|---|---|---|---|
| Coswara | 225 | 57 | 5 | 2 | 1 | 2 | 292 |
| Covid19-Cough | 991 | 173 | 31 | 68 | 13 | 7 | 1 283 |
| CoughVid | 1 633 | 1 487 | 56 | 52 | 39 | 15 | 3 282 |
| Virufy | 47 | 0 | 0 | 0 | 0 | 0 | 47 |
| FSD labeled “cough” | 539 | 171 | 1 | 1 | 101 | 0 | 813 |
| FSD miscellaneous | 0 | 269 | 0 | 0 | 0 | 0 | 269 |
| Call-center | 294 | 2 298 | 2 | 1 | 5 | 0 | 2 600 |
| Hospital collection | 601 | 38 | 10 | 2 | 11 | 0 | 662 |
| App data | 744 | 209 | 10 | 34 | 14 | 4 | 1 015 |
| Total | 5 074 | 4 702 | 115 | 160 | 184 | 28 | 10 263 |
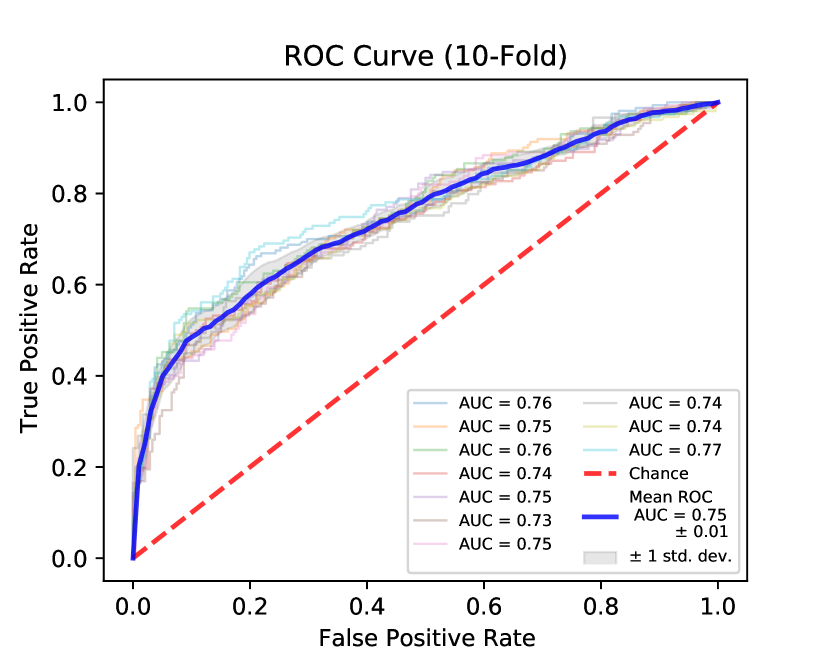
Preprocessing was done in python with the librosa package to trim and extract continuous non-silent audio intervals, that were then manually segmented. Ground truth event labeling was done by a single party to ensure consistency – subjective thresholds were set for the lightness of coughs and the amount of audio clipping distortion before a sample was marked as rejected. Call-center recordings included the full conversation and therefore yielded many rejected segments. A total of recordings were labeled, of which were cough sounds; the remaining non-cough samples consisted of non-cough events as well as the undesirable cough variations described above. Figure 5 depicts the ROC curves resulting from -fold cross-validation of the cough detection model trained in the pooled dataset (Table VII). Segmented recordings were labeled only with a cough or non-cough flag; disjoint user sets across folds were not enforced.
V-B Performance on real data
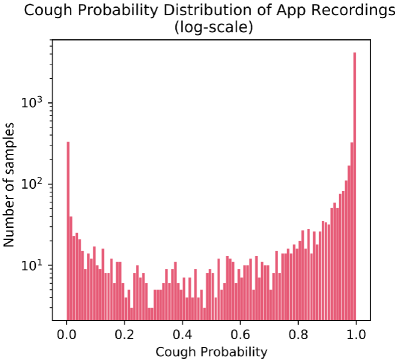
We evaluated the behavior of the cough detection model on the data collected by the mobile application. The threshold for the model was set at reject accept to give some leeway to users who might record unusual coughs, while still filtering out clearly undesirable samples and prompting for a cleaner recording. The distribution of model outputs representing the probability of a cough in a given recording is shown in Figure 6, with of recordings being rejected, i.e. classified as not containing a cough.
We also considered the user response to receiving a prompt to re-record a sample. A re-recording of rejection was defined as an initially rejected sample followed up by another recording by the same user within 20 minutes of the first. Out of the rejected recordings, were re-recorded.
To examine whether the recording instructions shown by the mobile application (alongside a request to re-record) were helpful in improving the quality of the samples, we evaluated the number of successful attempts by users to produce an accepted sample, in terms of re-recording sequences. A rerecording sequence begins with a rejected recording and consists of two or more recordings that follow within 20 minutes of each other. The sequence ends when an accepted recording is achieved, or when the user does not make another recording within 20 minutes of the last. A successful sequence ends with an accepted recording, while an unsuccessful sequence ends with a rejected recording. Out of all re-recording sequences, were successful, showing that in the majority of instances where users attempted to correct an unsatisfactory recording, they were able to do so.
We believe that implementing similar filtering mechanisms with an opportunity to re-submit a sample would be beneficial for all audio collection efforts of this sort, especially crowdsourcing campaigns, as it would promote standardization of samples and produce larger and cleaner datasets. Users or volunteers would generally be inclined to receive an accepted status on their submitted data, as long as the re-recording process is quick and simple. By retaining the rejected samples, such data collection can only produce more samples than without filtering, while still requiring the same level of commitment from each user at the outset.
| Model | ROC AUC | MCC |
|---|---|---|
| CNN | 0.6167 | 0.132 |
| GB | 0.6162 | 0.148 |
| GB-breath | 0.502 | 0.021 |
| GB-vocalization | 0.482 | 0.017 |
| Ensemble (Variant I) | 0.5547 | 0.111 |
| Ensemble (Variant II) | 0.6227 | 0.147 |
V-C Application Implementation
The application is implemented in client-server manner with iOS / Android UI frontend and server-side storage and computational backend, implemented in Flask.333 Web application framework, https://flask.palletsprojects.com/ The trained deep convolutional networks are converted into ONNX format444 Open Neural Network Exchange, https://onnx.ai/ and operate in inference mode using the ONNX Runtime555 High-performance inference engine for ML, https://www.onnxruntime.ai/ library for optimal throughput. During each user session, the client app collects the data (symptoms, samples of cough, breath and voice) and sends it to the server, which processes it, applies the models and yields the response. The backend instances are replicated between several servers with a load balancer distributing requests and workload among them for fault tolerance.
The user flow through the application requires them to record breath and cough samples but allows them to opt out of the voice recording step. The client also prompts the user for another cough recording if the detector is unable to spot any cough-events in the submitted audio sample.
VI Broader impact and mass testing considerations
A data-driven mass testing tool can be an invaluable and low-cost solution to identifying disease carriers in the population and encouraging these individuals to self-isolate [3]. It can provide real-time data on infection hotspots and inform the allocation of healthcare resources. At the same time, the question of trust in machine learning models and algorithms that have policy implications or critically affect personal decision making is very pertinent in medical applications, especially since most AI tools are based on statistical analysis, rather than causation. Due care must be taken to clearly communicate and ensure the users’ awareness that the outcome of an uncertified ML-based solution does not constitute medical advice.
Low sensitivity or specificity in such tools can exacerbate the spread of disease, [54]. For example, a high false positive rate erodes trust in pre-screening compelling the users to brush off the alerts, which in the case of a true positive alert fails to stimulate urgency to self-isolate or seek medical advice. Excess trust in a tool with a high false negative rate carries the danger of conveying a false sense of security to those who are shown a negative result, [55]. In this case, COVID carriers, who receive such a diagnosis, might choose to forego clinical screening methods and continue their social interactions, even when experiencing mild symptoms. Others might neglect precautionary protective measures if they are confident in the negative test results of their social circle, [56]. Conversely, an unduly trusted model with a high false positive rate can overwhelm the healthcare system, or cause overreaction in the form of severe epidemic control measures that drastically impact individuals and businesses, [57].
To mitigate the adverse societal effects of misplaced trust, we take care to communicate to the user of the application that the application is not a certified medical tool, and encourage them to exercise caution and seek proper medical advice or clinical testing, such as an RT-PCR test.
VII Limitations
The development of a model that predicts whether a recorded cough has signs of a respiratory disease imposes strict restrictions on how data should be collected, especially if one is working with crowdsourced data. For instance, the results of Table VIII are of a limited interpretation due to the absence of the ground truth labels for crowdsourced records. For a fair comparison between models, one should collect massive crowdsourced data verified by PCR test. This would crucially enable the identification of asymptomatic individuals who would otherwise not go through clinical testing.
We addressed some possible biases caused by different data sources by dividing the dataset into groups with the same properties, such as sample rate and device type. During training, objects were sampled from each group in such a way that the weights of the positive and negative classes within each group were equal. It is important to note, however, that the models were fine-tuned with cough samples that could introduce other kinds of biases. Positive COVID recordings were collected from patients in hospitals, which constitute a relatively noisy and echo-prone environment. COVID-free recordings were sampled from an office location, which can be expected to be generally quieter. Moreover, the participants in the office setting might have been compelled to cough more lightly than hospital patients and were likely on average to be younger than those admitted to medical care. These distinct conditions and confounders create the potential for bias in the models that exploit acoustic characteristics of the samples unrelated to features of COVID coughs.
Our model is also limited only to the detection of coughs characteristic of COVID; we must extend our data in order to detect other pathologies.
VIII Conclusion
Our application is an attempt to make the identification of people affected by COVID easier and faster. We received a lot of help from the medical society at large to develop our app. This help came from doctors who helped us collect data, as well as from heads of clinics and other management who suggested we use their data and collaborate in order to collect high-quality samples. This shows the widespread necessity of such a service.
We encountered several projects similar to ours. Some of them were concentrated on collecting data and sharing it with the scientific community. Often these datasets were very noisy and models trained on them had poor generalisation capabilities. Some works focused on a method that could maximize the performance of a model on private data. Our application serves both these tasks: it is able to collect data and make a prediction.
In this work, we contribute to the scientific community by providing baselines on open datasets, and describing our method that combines feature engineering, classical and deep machine learning methods. Another result of our work is the mobile app.
The further work is twofold. First, we will continue to collect data from healthy people and people affected by COVID. We hope that models trained on new massive and diverse data will be more robust. Obviously, COVID is not the only respiratory disease that might be detected. The detection of new diseases is possible in the presence of corresponding datasets. This is the second direction of further work: collecting data corresponding to different respiratory diseases and training or fine-tuning models on this new data. Based on our model we released a mobile application for public use [58], which is available on the App Store and Google Play.
Appendix A Cough detection model
The cough detection model was trained using the PyTorch library and a Tesla K80 GPU. The MobileNetV2 model was modified to accept a single-channel input for greyscale Mel-spectrograms. The segmented cough recordings were first normalized by peak absolute value, then downsampled to kHz, and padded to seconds if necessary. Mel-scaled spectrograms were produced using the librosa package with FFT window length of samples, hop length of , and the number of Mel-frequency bins of . Bootstrapping was used during training, with random crops to generate spectrograms. The model weights were randomly initialized and the data was randomly split into training and validation sets. The training was done with Adam optimizer, an initial learning rate of , and a cosine annealing scheduler ( max iterations, min learning rate). The batch size was set at samples, and the model was trained with early stopping on the validation split and dropout. The output layer of the model used sigmoid activation and the loss criterion used was Binary Cross Entropy.
Appendix B Failed Approaches
We were not able to obtain any improvement using Poisson masking from [10]. Similar to Poisson masking we tried to utilize gradient masking reducing the importance of high frequencies, but the attempts were unsuccessful. We were unable to find an effective augmentation scheme for the training of the ensemble of deep neural networks.
We did not seek certification for our application.
References
- [1] Huazhu Fu, Deng-Ping Fan, Geng Chen, and Tao Zhou, “COVID-19 imaging-based AI paper collection,” May 2021, original-date: 2020-04-07T04:52:44Z. [Online]. Available: https://github.com/HzFu/COVID19_imaging_AI_paper_list
- [2] M. Avetisian, I. Burenko, K. Egorov, V. Kokh, A. Nesterov, A. Nikolaev, A. Ponomarchuk, E. Sokolova, A. Tuzhilin, and D. Umerenkov, “CoRSAI: A System for Robust Interpretation of CT Scans of COVID-19 Patients Using Deep Learning,” arXiv:2105.11863 [cs, eess], May 2021, arXiv: 2105.11863. [Online]. Available: http://arxiv.org/abs/2105.11863
- [3] D. B. Larremore, B. Wilder, E. Lester, S. Shehata, J. M. Burke, J. A. Hay, M. Tambe, M. J. Mina, and R. Parker, “Test sensitivity is secondary to frequency and turnaround time for COVID-19 screening,” Science Advances, vol. 7, no. 1, p. eabd5393, Jan. 2021, publisher: American Association for the Advancement of Science Section: Research Article. [Online]. Available: https://advances.sciencemag.org/content/7/1/eabd5393
- [4] A. Imran, I. Posokhova, H. N. Qureshi, U. Masood, M. S. Riaz, K. Ali, C. N. John, M. I. Hussain, and M. Nabeel, “AI4COVID-19: AI Enabled Preliminary Diagnosis for COVID-19 from Cough Samples via an App,” Informatics in Medicine Unlocked, vol. 20, p. 100378, 2020, arXiv: 2004.01275. [Online]. Available: http://arxiv.org/abs/2004.01275
- [5] L. Orlandic, T. Teijeiro, and D. Atienza, “The COUGHVID crowdsourcing dataset: A corpus for the study of large-scale cough analysis algorithms,” arXiv:2009.11644 [cs, eess], Sep. 2020, arXiv: 2009.11644. [Online]. Available: http://arxiv.org/abs/2009.11644
- [6] N. Sharma, P. Krishnan, R. Kumar, S. Ramoji, S. R. Chetupalli, N. R., P. K. Ghosh, and S. Ganapathy, “Coswara — A Database of Breathing, Cough, and Voice Sounds for COVID-19 Diagnosis,” in Interspeech 2020. ISCA, Oct. 2020, pp. 4811–4815. [Online]. Available: http://www.isca-speech.org/archive/Interspeech_2020/abstracts/2768.html
- [7] Project "fkthecovid", “Dataset of recordings of induced cough,” Medical Investment Solutions, St. Petersburg, Russia, Jan. 2021, license CC0 1.0 Universal. [Online]. Available: https://github.com/covid19-cough/dataset
- [8] P. Bagad, A. Dalmia, J. Doshi, A. Nagrani, P. Bhamare, A. Mahale, S. Rane, N. Agarwal, and R. Panicker, “Cough Against COVID: Evidence of COVID-19 Signature in Cough Sounds,” arXiv:2009.08790 [cs, eess], Sep. 2020, arXiv: 2009.08790. [Online]. Available: http://arxiv.org/abs/2009.08790
- [9] H. Coppock, L. Jones, I. Kiskin, and B. Schuller, “COVID-19 detection from audio: seven grains of salt,” The Lancet Digital Health, vol. 3, no. 9, pp. e537–e538, Sep. 2021, publisher: Elsevier. [Online]. Available: https://www.thelancet.com/journals/landig/article/PIIS2589-7500(21)00141-2/fulltext
- [10] J. Laguarta, F. Hueto, and B. Subirana, “COVID-19 Artificial Intelligence Diagnosis using only Cough Recordings,” IEEE Open Journal of Engineering in Medicine and Biology, pp. 275–281, 2020, conference Name: IEEE Open Journal of Engineering in Medicine and Biology.
- [11] J. Watson, P. F. Whiting, and J. E. Brush, “Interpreting a covid-19 test result,” BMJ, vol. 369, May 2020, publisher: British Medical Journal Publishing Group Section: Practice. [Online]. Available: https://www.bmj.com/content/369/bmj.m1808
- [12] S. Shin, T. Hashimoto, and S. Hatano, “Automatic Detection System for Cough Sounds as a Symptom of Abnormal Health Condition,” IEEE Transactions on Information Technology in Biomedicine, vol. 13, no. 4, pp. 486–493, Jul. 2009, conference Name: IEEE Transactions on Information Technology in Biomedicine.
- [13] R. V. Sharan, S. Berkovsky, D. F. Navarro, H. Xiong, and A. Jaffe, “Detecting pertussis in the pediatric population using respiratory sound events and CNN,” Biomedical Signal Processing and Control, vol. 68, p. 102722, Jul. 2021. [Online]. Available: https://www.sciencedirect.com/science/article/pii/S1746809421003190
- [14] H. Chatrzarrin, A. Arcelus, R. Goubran, and F. Knoefel, “Feature extraction for the differentiation of dry and wet cough sounds,” in 2011 IEEE International Symposium on Medical Measurements and Applications, May 2011, pp. 162–166.
- [15] T. Drugman, J. Urbain, and T. Dutoit, “Assessment of audio features for automatic cough detection,” in 2011 19th European Signal Processing Conference, Aug. 2011, pp. 1289–1293, iSSN: 2076-1465.
- [16] S. Matos, S. S. Birring, I. D. Pavord, and H. Evans, “Detection of cough signals in continuous audio recordings using hidden Markov models,” IEEE Transactions on Biomedical Engineering, vol. 53, no. 6, pp. 1078–1083, Jun. 2006, number: 6 Conference Name: IEEE Transactions on Biomedical Engineering.
- [17] J. Martinek, M. Tatar, and M. Javorka, “Distinction between voluntary cough sound and speech in volunteers by spectral and complexity analysis,” Journal of Physiology and Pharmacology Society, vol. 59 Suppl 6, pp. 433–440, Dec. 2008.
- [18] B. Ferdousi, S. M. F. Ahsanullah, K. Abdullah-Al-Mamun, and M. N. Huda, “Cough detection using speech analysis,” in 2015 18th International Conference on Computer and Information Technology (ICCIT), Dec. 2015, pp. 60–64.
- [19] R. X. A. Pramono, S. A. Imtiaz, and E. Rodriguez-Villegas, “A Cough-Based Algorithm for Automatic Diagnosis of Pertussis,” PLOS ONE, vol. 11, no. 9, p. e0162128, Sep. 2016, number: 9 Publisher: Public Library of Science. [Online]. Available: https://journals.plos.org/plosone/article?id=10.1371/journal.pone.0162128
- [20] V. Swarnkar, U. R. Abeyratne, Y. Amrulloh, C. Hukins, R. Triasih, and A. Setyati, “Neural network based algorithm for automatic identification of cough sounds,” in 2013 35th Annual International Conference of the IEEE Engineering in Medicine and Biology Society (EMBC), Jul. 2013, pp. 1764–1767, iSSN: 1558-4615.
- [21] C. Lücio, C. Teixeira, J. Henriques, P. d. Carvalho, and R. P. Paiva, “Voluntary cough detection by internal sound analysis,” in 2014 7th International Conference on Biomedical Engineering and Informatics, Oct. 2014, pp. 405–409, iSSN: 1948-2922.
- [22] K. Kochetov, E. Putin, M. Balashov, A. Filchenkov, and A. Shalyto, “Noise Masking Recurrent Neural Network for Respiratory Sound Classification,” in Artificial Neural Networks and Machine Learning, ser. Lecture Notes in Computer Science, V. Kůrková, Y. Manolopoulos, B. Hammer, L. Iliadis, and I. Maglogiannis, Eds. Cham: Springer International Publishing, 2018, pp. 208–217.
- [23] R. X. A. Pramono, S. A. Imtiaz, and E. Rodriguez-Villegas, “Automatic Identification of Cough Events from Acoustic Signals,” in 2019 41st Annual International Conference of the IEEE Engineering in Medicine and Biology Society (EMBC), Jul. 2019, pp. 217–220, iSSN: 1558-4615.
- [24] Y. Amrulloh, U. Abeyratne, V. Swarnkar, and R. Triasih, “Cough Sound Analysis for Pneumonia and Asthma Classification in Pediatric Population,” in Modelling and Simulation 2015 6th International Conference on Intelligent Systems, Feb. 2015, pp. 127–131, iSSN: 2166-0670.
- [25] K. Kosasih, U. R. Abeyratne, V. Swarnkar, and R. Triasih, “Wavelet Augmented Cough Analysis for Rapid Childhood Pneumonia Diagnosis,” IEEE Transactions on Biomedical Engineering, vol. 62, no. 4, pp. 1185–1194, Apr. 2015, number: 4 Conference Name: IEEE Transactions on Biomedical Engineering.
- [26] A. Windmon, M. Minakshi, S. Chellappan, P. R. Athilingam, M. Johansson, and B. A. Jenkins, “On Detecting Chronic Obstructive Pulmonary Disease (COPD) Cough using Audio Signals Recorded from Smart-Phones,” in Proceedings of the 11th International Joint Conference on Biomedical Engineering Systems and Technologies - Volume 5: HEALTHINF,. SciTePress, 2018, pp. 329–338, backup Publisher: INSTICC.
- [27] L. D. Perna, G. Spina, S. Thackray-Nocera, M. G. Crooks, A. H. Morice, P. Soda, and A. C. d. Brinker, “An automated and unobtrusive system for cough detection,” in 2017 IEEE Life Sciences Conference (LSC), Dec. 2017, pp. 190–193.
- [28] R. V. Sharan, U. R. Abeyratne, V. R. Swarnkar, and P. Porter, “Automatic Croup Diagnosis Using Cough Sound Recognition,” IEEE Transactions on Biomedical Engineering, vol. 66, no. 2, pp. 485–495, Feb. 2019, conference Name: IEEE Transactions on Biomedical Engineering.
- [29] J. Amoh and K. Odame, “Deep Neural Networks for Identifying Cough Sounds,” IEEE Transactions on Biomedical Circuits and Systems, vol. 10, no. 5, pp. 1003–1011, Oct. 2016, conference Name: IEEE Transactions on Biomedical Circuits and Systems.
- [30] C. Bales, M. Nabeel, C. N. John, U. Masood, H. N. Qureshi, H. Farooq, I. Posokhova, and A. Imran, “Can Machine Learning Be Used to Recognize and Diagnose Coughs?” in 2020 International Conference on e-Health and Bioengineering (EHB), Oct. 2020, pp. 1–4, iSSN: 2575-5145. [Online]. Available: http://arxiv.org/abs/2004.01495
- [31] E. Saba, “Techniques for Cough Sound Analysis,” Thesis, University of Washington, 2018, accepted: 2018-11-28T03:17:44Z. [Online]. Available: https://digital.lib.washington.edu:443/researchworks/handle/1773/43034
- [32] F. Barata, K. Kipfer, M. Weber, P. Tinschert, E. Fleisch, and T. Kowatsch, “Towards Device-Agnostic Mobile Cough Detection with Convolutional Neural Networks,” in 2019 IEEE International Conference on Healthcare Informatics (ICHI), Jun. 2019, pp. 1–11, iSSN: 2575-2634.
- [33] K. Simonyan and A. Zisserman, “Very Deep Convolutional Networks for Large-Scale Image Recognition,” in 3rd International Conference on Learning Representations, ICLR 2015, San Diego, CA, USA, May 7-9, 2015, Conference Track Proceedings, Y. Bengio and Y. LeCun, Eds., 2015. [Online]. Available: http://arxiv.org/abs/1409.1556
- [34] A. Asraf, M. Z. Islam, M. R. Haque, and M. M. Islam, “Deep Learning Applications to Combat Novel Coronavirus (COVID-19) Pandemic,” SN Computer Science, vol. 1, no. 6, p. 363, Nov. 2020, number: 6. [Online]. Available: https://doi.org/10.1007/s42979-020-00383-w
- [35] A. Ulhaq, J. Born, A. Khan, D. P. S. Gomes, S. Chakraborty, and M. Paul, “COVID-19 Control by Computer Vision Approaches: A Survey,” IEEE Access, vol. 8, pp. 179 437–179 456, 2020, conference Name: IEEE Access.
- [36] G. Pinkas, Y. Karny, A. Malachi, G. Barkai, G. Bachar, and V. Aharonson, “SARS-CoV-2 Detection From Voice,” IEEE Open Journal of Engineering in Medicine and Biology, vol. 1, pp. 268–274, 2020, conference Name: IEEE Open Journal of Engineering in Medicine and Biology.
- [37] J. Han, K. Qian, M. Song, Z. Yang, Z. Ren, S. Liu, J. Liu, H. Zheng, W. Ji, T. Koike, X. Li, Z. Zhang, Y. Yamamoto, and B. W. Schuller, “An Early Study on Intelligent Analysis of Speech under COVID-19: Severity, Sleep Quality, Fatigue, and Anxiety,” arXiv:2005.00096 [cs, eess], May 2020, arXiv: 2005.00096. [Online]. Available: http://arxiv.org/abs/2005.00096
- [38] J. Andreu-Perez, H. Espinosa, E. Timonet, M. Kiani, M. Giron-Perez, A. Benitez-Trinidad, D. Jarchi, A. Rosales, N. Gkatzoulis, O. Reyes-Galaviz, A. Torres, C. Reyes-Garcia, Z. Ali, F. Rivas, and F. Rivas-Ruiz, “A Generic Deep Learning Based Cough Analysis System from Clinically Validated Samples for Point-of-Need Covid-19 Test and Severity Levels,” IEEE Transactions on Services Computing, vol. PP, pp. 1–1, Feb. 2021.
- [39] C. Brown, J. Chauhan, A. Grammenos, J. Han, A. Hasthanasombat, D. Spathis, T. Xia, P. Cicuta, and C. Mascolo, “Exploring Automatic Diagnosis of COVID-19 from Crowdsourced Respiratory Sound Data,” arXiv:2006.05919 [cs, eess], Jul. 2020, arXiv: 2006.05919. [Online]. Available: http://arxiv.org/abs/2006.05919
- [40] S. Hershey, S. Chaudhuri, D. P. W. Ellis, J. F. Gemmeke, A. Jansen, R. C. Moore, M. Plakal, D. Platt, R. A. Saurous, B. Seybold, M. Slaney, R. J. Weiss, and K. Wilson, “CNN architectures for large-scale audio classification,” in 2017 IEEE International Conference on Acoustics, Speech and Signal Processing (ICASSP), Mar. 2017, pp. 131–135, iSSN: 2379-190X.
- [41] K. He, X. Zhang, S. Ren, and J. Sun, “Deep Residual Learning for Image Recognition,” in 2016 IEEE Conference on Computer Vision and Pattern Recognition (CVPR), Jun. 2016, pp. 770–778, iSSN: 1063-6919.
- [42] E. Fonseca, M. Plakal, F. Font, D. P. Ellis, X. Favory, J. Pons, and X. Serra, “General-purpose tagging of Freesound audio with AudioSet labels: task description, dataset, and baseline,” in Proceedings of the Detection and Classification of Acoustic Scenes and Events 2018 Workshop (DCASE2018), Nov. 2018, pp. 69–73.
- [43] F. Al Hossain, A. A. Lover, G. A. Corey, N. G. Reich, and T. Rahman, “FluSense: A Contactless Syndromic Surveillance Platform for Influenza-Like Illness in Hospital Waiting Areas,” Proceedings of the ACM on Interactive, Mobile, Wearable and Ubiquitous Technologies, vol. 4, no. 1, pp. 1:1–1:28, Mar. 2020. [Online]. Available: https://doi.org/10.1145/3381014
- [44] K. J. Piczak, “Environmental sound classification with convolutional neural networks,” in 2015 IEEE 25th International Workshop on Machine Learning for Signal Processing (MLSP), Sep. 2015, pp. 1–6, iSSN: 2378-928X.
- [45] E. Fonseca, M. Plakal, D. P. W. Ellis, F. Font, X. Favory, and X. Serra, “Learning Sound Event Classifiers from Web Audio with Noisy Labels,” in ICASSP 2019 - 2019 IEEE International Conference on Acoustics, Speech and Signal Processing (ICASSP), May 2019, pp. 21–25, iSSN: 2379-190X.
- [46] M. C. Grant, L. Geoghegan, M. Arbyn, Z. Mohammed, L. McGuinness, E. L. Clarke, and R. G. Wade, “The prevalence of symptoms in 24,410 adults infected by the novel coronavirus (SARS-CoV-2; COVID-19): A systematic review and meta-analysis of 148 studies from 9 countries,” PLOS ONE, vol. 15, no. 6, p. e0234765, Jun. 2020, publisher: Public Library of Science. [Online]. Available: https://journals.plos.org/plosone/article?id=10.1371/journal.pone.0234765
- [47] T. Hastie, R. Tibshirani, and J. Friedman, The Elements of Statistical Learning, ser. Springer Series in Statistics. New York, NY, USA: Springer New York Inc., 2001.
- [48] G. Ke, Q. Meng, T. Finley, T. Wang, W. Chen, W. Ma, Q. Ye, and T.-Y. Liu, “LightGBM: A Highly Efficient Gradient Boosting Decision Tree,” Advances in Neural Information Processing Systems, vol. 30, 2017. [Online]. Available: https://papers.nips.cc/paper/2017/hash/6449f44a102fde848669bdd9eb6b76fa-Abstract.html
- [49] D. Chicco and G. Jurman, “The advantages of the Matthews correlation coefficient (MCC) over F1 score and accuracy in binary classification evaluation,” BMC Genomics, vol. 21, no. 1, p. 6, Jan. 2020. [Online]. Available: https://doi.org/10.1186/s12864-019-6413-7
- [50] Y. Ovadia, E. Fertig, J. Ren, Z. Nado, D. Sculley, S. Nowozin, J. Dillon, B. Lakshminarayanan, and J. Snoek, “Can you trust your model's uncertainty? evaluating predictive uncertainty under dataset shift,” in Advances in Neural Information Processing Systems, H. Wallach, H. Larochelle, A. Beygelzimer, F. d'Alché-Buc, E. Fox, and R. Garnett, Eds., vol. 32. Curran Associates, Inc., 2019. [Online]. Available: https://proceedings.neurips.cc/paper/2019/file/8558cb408c1d76621371888657d2eb1d-Paper.pdf
- [51] M. Sandler, A. Howard, M. Zhu, A. Zhmoginov, and L.-C. Chen, “MobileNetV2: Inverted Residuals and Linear Bottlenecks,” in 2018 IEEE/CVF Conference on Computer Vision and Pattern Recognition, Jun. 2018, pp. 4510–4520, iSSN: 2575-7075.
- [52] “Virufy COVID-19 Open Cough Dataset.” [Online]. Available: https://github.com/virufy/virufy_data
- [53] E. Fonseca, X. Favory, J. Pons, F. Font, and X. Serra, “FSD50K: an Open Dataset of Human-Labeled Sound Events,” arXiv:2010.00475 [cs, eess, stat], Oct. 2020, arXiv: 2010.00475. [Online]. Available: http://arxiv.org/abs/2010.00475
- [54] N. Gray, D. Calleja, A. Wimbush, E. Miralles-Dolz, A. Gray, M. De Angelis, E. Derrer-Merk, B. U. Oparaji, V. Stepanov, L. Clearkin et al., “Is “no test is better than a bad test”? impact of diagnostic uncertainty in mass testing on the spread of covid-19,” PloS one, vol. 15, no. 10, p. e0240775, 2020.
- [55] J. Wise, “Covid-19: Concerns persist about purpose, ethics, and effect of rapid testing in liverpool,” BMJ, vol. 371, 2020. [Online]. Available: https://www.bmj.com/content/371/bmj.m4690
- [56] H. Coppock, A. Gaskell, P. Tzirakis, A. Baird, L. Jones, and B. Schuller, “End-to-end convolutional neural network enables COVID-19 detection from breath and cough audio: a pilot study,” BMJ Innovations, vol. 7, no. 2, Apr. 2021, publisher: BMJ Specialist Journals Section: Artificial intelligence. [Online]. Available: https://innovations.bmj.com/content/7/2/356
- [57] E. Surkova, V. Nikolayevskyy, and F. Drobniewski, “False-positive covid-19 results: hidden problems and costs,” The Lancet Respiratory Medicine, vol. 8, no. 12, pp. 1167–1168, 2020.
- [58] “AI RESP.” [Online]. Available: https://resp.sbermed.ai/