22institutetext: Heuristic and Evolutionary Algorithms Laboratory
University of Applied Sciences Upper Austria, Softwarepark 11, 4232 Hagenberg
33institutetext: Institute for Formal Models and Verification
Johannes Kepler University, Altenbergerstr. 69, 4040 Linz
33email: bogdan.burlacu@fh-hagenberg.at
Hash-based Tree Similarity and Simplification in Genetic Programming for Symbolic Regression
Abstract
We introduce in this paper a runtime-efficient tree hashing algorithm for the identification of isomorphic subtrees, with two important applications in genetic programming for symbolic regression: fast, online calculation of population diversity and algebraic simplification of symbolic expression trees. Based on this hashing approach, we propose a simple diversity-preservation mechanism with promising results on a collection of symbolic regression benchmark problems.
1 Introduction
Tree isomorphism algorithms play a fundamental role in pattern matching for tree-structured data. We introduce a fast inexact111Inexact due to the possibility of hash collisions causing the algorithm to return the wrong answer. With a reasonable hahs function, collision probability is negligible. tree matching algorithm that processes rooted, unordered, labeled trees into sequences of integer hash values, such that the same hash value indicates isomorphism. We define a distance measure between two trees based on the intersection of their corresponding hash value sequences. We are then able to efficiently compute a distance matrix for all trees by hashing each tree exactly once, then cheaply computing pairwise hash sequence intersections in linear time.
Genetic Programming (GP) for Symbolic Regression (SR) discovers mathematical formulae that best fit a given target function by means of evolving a population of tree-encoded solution candidates. The algorithm performs a guided search of the space of mathematical expressions by iteratively manipulating and evaluating a large number of tree genotypes under the principles of natural selection.
Dynamic properties such as exploratory or exploitative behaviour and convergence speed have a big influence on GP performance [2]. Exploration refers to the ability to probe different areas of the search space, and exploitation refers to the ability to produce improvements in the local neighbourhood of existing solutions. The algorithm’s success depends on achieving a good balance between exploration and exploitation over the course of the evolutionary run [11].
Population diversity (measured either at the structural-genotypic or semantic-phenotypic level) is typically used as an indirect measure of the algorithm’s state-of-convergence, following the reasoning that the exploratory phase of the search is characterized by high diversity and the exploitative phase is characterized by low diversity. Premature convergence can occur at both genotype or phenotype levels, leading to a large amount of shared genetic material in the final population and a very concentrated set of behaviours [3].
Based on tree node hash values, we propose a new diversity measure defined as an individual’s average distance to the rest of the population. We show how the resulting diversity score associated with each individual can be used to shift the focus of selection towards fit-and-diverse individuals.
2 Methodology
In this section we describe the tree hashing algorithm in detail and introduce a tree distance measure based on the number of common hash values between two tree individuals. The method lends itself well to the efficient computation of distance matrices (for the entire population) since each individual needs only be hashed once and pairwise distances can be subsequently computed using only the corresponding hash value sequences.
An important aspect of our methodology is the ability of the proposed diversity measure to implicitly capture an individual’s semantics by hashing the numerical coefficients associated to the tree’s leaf nodes. This allows us to differentiate (in terms of tree distance) between individuals with similar structure but different semantics.
2.0.1 Tree hashing
The hashing procedure shares some common aspects with the earlier algorithm by Merkle [7] where data blocks represented as leaves in the tree are hashed together in a bottom-up manner.
In our approach an associated data block for each tree node is aggregated together with child node data as input to the hash function to a general-purpose non-cryptographic hash function . This concept is illustrated in Figure 1, where leaf nodes represent terminal symbols and internal nodes represent mathematical operations. Hash values are computed by the operator taking as arguments the node’s own data hash and its child hash values.
The procedure given as pseudocode in Algorithm 1 relies on the linearization of input tree , such that the resulting array of nodes corresponds to a postorder traversal of . The benefit of linearization is that subtrees are represented by continuous array regions, thus facilitating indexing and sorting operations. For example, tree node with postorder index will find its first child at index , its second child at index and so on, where returns the size of the subtree whose root node has index .
Sorting the child nodes of commutative symbols is a key part of this procedure. In the general case, this requires a reordering of the corresponding subarrays using an auxiliary buffer. Sorting without an auxiliary buffer is possible when all child nodes are leafs, that is when for a parent node . Child order is established according to the calculated hash values.
We illustrate the sorting procedure in Figure 2, where a postfix expression with root symbol at index 9 contains three child symbols with indices 2, 5, 8 and hash values , respectively. In order to calculate the child order is first established according to symbol hash values. Leaf nodes are assigned initial hash values that do not change during the procedure. Assuming that sorting produces the order , the child symbols and their respective subarrays need to be reordered in the expression using a temporary buffer. After sorting, the original expression becomes:
The sorted child hash values are then aggregated with the parent label in order to produce the parent hash value . The hashing algorithm alternates hashing and sorting steps as it moves from the bottom level of the tree towards the root node. Finally, each tree node is assigned a hash value and the hash value of the root node is returned as the expression’s hash value.
2.0.2 Hash-based tree simplification
Our hash-based approach to simplification enables structural transformations based on tree isomorphism and symbolic equivalence relations. Figure 3 illustrates the simplification of an addition function node with two identical child nodes.
In the expression represented in postfix notation, the terms and are isomorphic and hash to the same value. The simplification algorithm identifies the possibility of folding the constants and so that the two terms are simplified to a single term where . The simplified expression then becomes .
| 29375 | 27012 | 29320 | 29375 | 65245 | 52308 | 29320 | 29375 | 27012 | 29320 | 29319 |
Sort and hash
29375
27012
75236
29320
29375
75236
29320
65245
52308
47983
31738
Simplify
29375
27012
75236
29320
65245
52308
47983
31040
2.0.3 Hash-based population diversity
Using the algorihm described in Section 2.0.1, we convert each tree individual into a sequence of hash values corresponding to a post-order traversal of its structure. After this conversion, the distance between two trees can be defined using the intersection between the two sequences222The Sørensen-Dice coefficient (Equation 1) returns a value in the interval :
| (1) |
where represent the hash value sequences of and , respectively.
Computing the distance matrix for the entire population can be further optimized by hashing all trees in an initial pass, then using the resulting hash value sequences for the calculation of pairwise distances. This leads to the following algorithmic steps:
-
1.
Convert every tree in the population to hash value sequence
-
2.
Sort each hash value sequence in ascending order
-
3.
For every pair compute distance using Equation 1.
Sorting in step 2 allows us to efficiently compute in linear time. As shown in 1, in this particular scenario, these optimizations lead to a two order of magnitude improvement in runtime performance over similar methods [10].
| Tree distance method | Elapsed time (s) | Speed-up |
|---|---|---|
| Bottom-up | ||
| Hash-based |
2.0.4 Diversity as an explicit search objective
Diversity maintenance strategies have been shown to improve GP performance [11, 3]. A plethora of diversity measures have already been studied: history-based, distance-based, difference-based, entropy-based, etc. [11]. However, due to high computational requirements, tree distances like the tree edit distance have seldomly been used. Our hash-based approach overcomes this limitation making it feasible to compute the population distance matrix every generation.
We define an individual’s diversity score as its average distance to the rest of the population. The score is easily computed by averaging the corresponding distance matrix row for a given individual. In effect, this causes selection to favor individuals “farther away” from the crowd, reducing the effects of local optima as attractors in the search space.
We integrate this new objective into a single-objective approach using standard GP and a multi-objective approach using the NSGA-2 algorithm [4].
In the single-objective case, we extent the standard fitness function with an additional diversity term , such that the new fitness used during selection becomes: . Since fitness is normalized between both terms have the same scale and no additional weighting is used.
In the multi-objective case the diversity score is used as a secondary objective along with fitness. The NSGA-2 algorithm performs selection using crowding distance within Pareto fronts of solutions.
3 Empirical Results
We test the proposed approach on a collection of synthetic symbolic regression benchmarks: Vladislavleva [12], Poly-10 [9], Spatial Coevolution [8], Friedman [5] and Breiman [1]. We configure all algorithms to evolve a population of 1000 individuals over 500 generations with a function set consisting of . Different types of mutation (remove branch, replace branch, change node type, one-point mutation) are applied with a probability of 25%. Tree individuals are initialized using the Probabilistic Tree Creator (PTC2) [6].
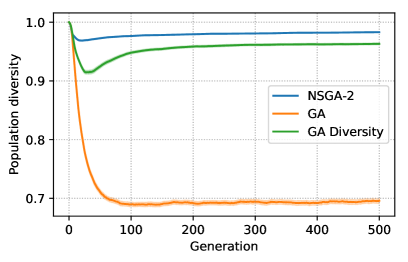
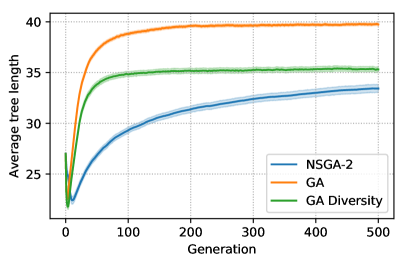
The results summarized in Table 2 show the benefits of diversity maintenance. Selecting for diversity enables both the GA and NSGA-2 algorithms to better exploit population diversity and achieve better results in comparison with the standard GA approach. The NSGA-2 algorithm in particular is able to avoid overfitting and produce more generalizable models on the Vladislavleva-6 and Vladislavleva-8 problems. In all tested problem instances, both GA Diversity and NSGA-2 outperform standard GA on both training and test data. Figure 4 shows that GA Diversity and NSGA-2 are able to maintain higher diversity and promote smaller, less bloated individuals.
The overhead incurred by tree distance calculation depends on the size of the training data. For large data, this overhead becomes negligible as the algorithm will spend most of its runtime evaluating fitness. In our tests GA Diversity is approximately 20-25% slower than Standard GA. A direct runtime comparison with NSGA-2 is not possible due to different algorithmic dynamics.
| Problem data | Algorithm | (training) | (test) | Time (s) |
|---|---|---|---|---|
| Breiman - I | GA | 0.870 0.040 | 0.865 0.037 | 1084.5 |
| Breiman - I | GA Diversity | 0.875 0.034 | 0.870 0.029 | 1207.5 |
| Breiman - I | NSGA-2 | 1584.0 | ||
| Friedman - I | GA | 0.859 0.007 | 0.860 0.006 | 1090.5 |
| Friedman - I | GA Diversity | 0.860 0.007 | 0.860 0.005 | 1207.0 |
| Friedman - I | NSGA-2 | 1554.0 | ||
| Friedman - II | GA | 0.944 0.038 | 0.942 0.041 | 1092.0 |
| Friedman - II | GA Diversity | 0.957 0.023 | 0.957 0.025 | 1248.0 |
| Friedman - II | NSGA-2 | 1474.0 | ||
| Pagie-1 | GA | 0.990 0.012 | 0.889 0.107 | 442.5 |
| Pagie-1 | GA Diversity | 0.994 0.005 | 0.912 0.070 | 540.5 |
| Pagie-1 | NSGA-2 | 880.0 | ||
| Poly-10 | GA | 0.820 0.293 | 0.764 0.478 | 405.0 |
| Poly-10 | GA Diversity | 0.840 0.089 | 0.838 0.120 | 518.0 |
| Poly-10 | NSGA-2 | 902.5 | ||
| Vladislavleva-1 | GA | 0.999 0.001 | 0.946 0.120 | 371.5 |
| Vladislavleva-1 | GA Diversity | 0.999 0.001 | 0.980 0.106 | 450.0 |
| Vladislavleva-1 | NSGA-2 | 784.5 | ||
| Vladislavleva-2 | GA | 0.995 0.012 | 0.987 0.028 | 355.0 |
| Vladislavleva-2 | GA Diversity | 0.995 0.012 | 0.992 0.016 | 462.0 |
| Vladislavleva-2 | NSGA-2 | 802.0 | ||
| Vladislavleva-3 | GA | 0.968 0.062 | 0.932 0.508 | 445.0 |
| Vladislavleva-3 | GA Diversity | 0.979 0.048 | 0.975 0.053 | 570.0 |
| Vladislavleva-3 | NSGA-2 | 920.5 | ||
| Vladislavleva-4 | GA | 0.951 0.036 | 0.918 0.053 | 527.0 |
| Vladislavleva-4 | GA Diversity | 0.968 0.023 | 0.936 0.049 | 651.0 |
| Vladislavleva-4 | NSGA-2 | 973.5 | ||
| Vladislavleva-5 | GA | 0.997 0.012 | 0.933 0.144 | 407.0 |
| Vladislavleva-5 | GA Diversity | 0.999 0.002 | 0.995 0.015 | 502.5 |
| Vladislavleva-5 | NSGA-2 | 871.0 | ||
| Vladislavleva-6 | GA | 0.869 0.155 | 0.072 0.329 | 369.0 |
| Vladislavleva-6 | GA Diversity | 0.939 0.143 | 0.255 0.978 | 491.0 |
| Vladislavleva-6 | NSGA-2 | 930.0 | ||
| Vladislavleva-7 | GA | 0.895 0.048 | 0.878 0.100 | 395.0 |
| Vladislavleva-7 | GA Diversity | 0.904 0.029 | 0.892 0.058 | 501.5 |
| Vladislavleva-7 | NSGA-2 | 843.5 | ||
| Vladislavleva-8 | GA | 0.962 0.080 | 0.541 0.569 | 362.5 |
| Vladislavleva-8 | GA Diversity | 0.986 0.033 | 0.787 0.436 | 489.5 |
| Vladislavleva-8 | NSGA-2 | 799.0 |
4 Summary
We described a hashing algorithm for GP trees with applications to distance calculation and expression simplification. The approach is highly efficient, making it feasible to measure diversity on a generational basis, as after an initial preprocessing step tree distance is reduced to a simple co-ocurrence count between sorted hash value sequences. With this information new diversity preservation strategies become possible at low computational cost.
A simple strategy illustrated in this work is to bias selection towards individuals that are more distant from the rest of the population. Experimental results using the standard GA and NSGA-2 algorithms showed increased model accuracy on all tested problem instances, correlated with increased diversity and lower average tree size. Although easily integrated with all GA flavours, we conclude empirically that the strategy is more effective in the multi-objective case when diversity is separately considered.
Future work in this area will focus on mining common subtrees in the population based on hash value frequencies and designing more complex diversity preservation strategies.
Acknowledgement
The authors gratefully acknowledge support by the Christian Doppler Research Association and the Federal Ministry of Digital and Economic Affairs within the Josef Ressel Centre for Symbolic Regression.
References
- [1] Breiman, L., Friedman, J., Stone, C., Olshen, R.: Classification and Regression Trees. The Wadsworth and Brooks-Cole statistics-probability series, Taylor & Francis (1984)
- [2] Burke, E.K., Gustafson, S., Kendall, G.: Diversity in genetic programming: An analysis of measures and correlation with fitness. IEEE Transactions on Evolutionary Computation 8(1), 47–62 (Feb 2004)
- [3] Burks, A.R., Punch, W.F.: An analysis of the genetic marker diversity algorithm for genetic programming. Genetic Programming and Evolvable Machines 18(2), 213–245 (Jun 2017)
- [4] Deb, K., Pratap, A., Agarwal, S., Meyarivan, T.: A fast and elitist multiobjective genetic algorithm: Nsga-ii. IEEE Transactions on Evolutionary Computation 6(2), 182–197 (April 2002)
- [5] Friedman, J.H.: Multivariate adaptive regression splines. Ann. Statist. 19(1), 1–67 (03 1991)
- [6] Luke, S.: Two fast tree-creation algorithms for genetic programming. Evolutionary Computation, IEEE Transactions on 4(3), 274–283 (2000)
- [7] Merkle, R.C.: A digital signature based on a conventional encryption function. In: Pomerance, C. (ed.) Advances in Cryptology — CRYPTO ’87. pp. 369–378. Springer Berlin Heidelberg, Berlin, Heidelberg (1988)
- [8] Pagie, L., Hogeweg, P.: Evolutionary consequences of coevolving targets. Evolutionary Computation 5(4), 401–418 (1997)
- [9] Poli, R.: A simple but theoretically-motivated method to control bloat in genetic programming. In: Genetic Programming. pp. 204–217. Springer Berlin Heidelberg, Berlin, Heidelberg (2003)
- [10] Valiente, G.: An efficient bottom-up distance between trees. In: Proc. 8th Int. Symposium on String Processing and Information Retrieval. pp. 212–219. IEEE Computer Science Press (2001)
- [11] Črepinšek, M., Liu, S.H., Mernik, M.: Exploration and exploitation in evolutionary algorithms: A survey. ACM Comput. Surv. 45(3), 35:1–35:33 (Jul 2013)
- [12] Vladislavleva, E.J., Smits, G.F., den Hertog, D.: Order of nonlinearity as a complexity measure for models generated by symbolic regression via pareto genetic programming. IEEE Transactions on Evolutionary Computation 13(2), 333–349 (Apr 2009)