Effect of density control in partially observable asymmetric-exit evacuation under guidance: Strategic suggestion under time delay
Abstract
To enhance the evacuation efficiency in partially observable asymmetric-exit evacuation under guidance, a general framework of the dynamic guiding assistant system is presented to investigate the effect of density control. In this framework, several evacuation assistants are established to observe the partial information of pedestrians’ location and adjust the guiding signals of the dynamic guiding assistant systems. A simple on-off-based density control algorithm is proposed for the evacuation assistants according to the delayed data of the observed information (i.e., pedestrian densities in the observed regions near the corresponding exits). This paper provides strategic suggestions on how to set the observed region and the target density by involving a force-driven cellular automaton model. It is observed that the proposed density control algorithm can control (positively affect) the global distribution of the pedestrians’ locations and suppress arching phenomena in the evacuation process even using the observed partial information under time delays. By imposing a moderate target density, the dynamic guiding assistant system also suppresses the triggers of collisions around the exits and avoids inefficiently separating the pedestrians. To enhance evacuation efficiency, we reveal an interesting fact without loss of generality that we only need to observe the pedestrians’ location from a small region near the exit instead of a large region when the time delay of the observed information is slight enough. Our numerical findings are expected to provide new insights into designing computer-aided guiding strategies in real evacuations.
keywords:
Pedestrian flow; guided crowd; computer-aided technology; evacuation efficiency; evacuation simulation.1 Introduction
In the last decades, the efficiency estimation problem has been a key aspect of evaluating safety performance for pedestrian evacuations. During the occurred emergency events (such as fire, earthquake, and terrorist attacks), since the pedestrians in the evacuation space are usually myopic and many irrational behaviors may inherently and negatively affect the pedestrians’ decision making (which may eventually lead to an efficiency loss causing massive casualties) in the evacuation process [1, 2, 3, 4], some evacuation strategies are often beforehand designed to enhance the evacuation efficiency. In the literature, those evacuation strategies may include the choices on room layout [5], number of exits [6], location of obstacles [7], to name but a few. To effectively evaluate evacuation efficiency, establishing mathematical models to describe the pedestrians’ decision-making behavior and the resulting phenomena in the evacuation process should be of prime importance [8, 9, 10, 11, 12, 13, 14, 15, 16, 17, 18, 19]. For example, a cellular automaton (CA) model describing the change of cooperative behavior in heterogeneous pedestrians was investigated in [20] to examine how the pedestrians’ dependency relationship influences evacuation efficiency. A floor field model investigating agitated behaviors with elastic characteristics was presented in [21], whereas a fine discrete field CA model integrating anisotropy, heterogeneity, and time-dependent characteristics, was discussed in [22]. A multi-grid CA model capturing the turning behaviors was proposed in [23]. Furthermore, an extended floor-field CA model describing the group behaviors in crowd evacuation was found in [24], whereas a modified social force model and a force-driven CA model were proposed in [25] and [26] to reflect the evacuation process under guidance.
With the development of modern technology, especially in the aspect of the imaging process, communication networks, and IoT technologies, some evacuation assistants (or equipment) can be adopted in the (computer-aided) evacuation process to provide accurate route or exit information to the evacuees and hence help (guide) them to escape as efficiently as possible. In the related works with guiding behaviors [27, 28, 29, 30, 31, 32, 33, 34], Yang et al. [27] are the first researchers to claim the necessity of using guides (dynamic leaders) in the evacuation process, whereas the effects of leadership in single-exit rooms were investigated in [28] with limited visible range. The authors in [28] further stated that guiding behavior may yield a negative effect when too many pedestrians are neighbor to the leader. Considering the situation where the dynamic leader attracts the crowds and moves together with them towards one of the exits, the optimal number and positions for those leaders were derived in [34] and [35]. Even though the literature [28] and [34] have claimed that the density of pedestrians plays an important role in the evacuation process, to our best knowledge, our previous study in [26] is the first work indicating the possibility and goodness of controlling the pedestrians’ density. It was found that for a symmetric-exit evacuation space, unbalanced pedestrian distributions may be yielded because of the mutual attractions among the pedestrians, but those unbalanced distributions can be suppressed by imposing some control mechanisms based on the data of pedestrian density from an observed region. Given the constant observed region, by adjusting the guiding signals according to the pedestrian densities around the exits, [26] showed preliminary evidence that imposing control mechanisms may be able to pursue a more balanced pedestrian distribution and an efficient evacuation process. However, the effects of the size of the observed regions are not yet revealed. Furthermore, it is essential to note that the results in [26] did not consider the influence of data time delay in the control mechanisms, which is unnatural for a realistic computer-aided evacuation process.
Contributions: Different from [26] and the other existing results, the main contribution of this paper is focused on finding the optimal size of the observed regions under different data time delays for a dynamic guiding assistant system in partially observable asymmetric-exit evacuation. To this end, inspired by control theory, we propose a general framework of dynamic guiding assistant systems with a density control algorithm by assuming that the evacuation assistants can observe only a few parts of the evacuation spaces. We consider a simple on-off-based density control algorithm for evacuation assistants with delayed data of the observed information, i.e., pedestrian densities in the regions near the corresponding exits. By involving a force-driven cellular automaton model, we discuss strategic suggestions on setting the observed region in this paper by presenting the numerical simulation results under homogeneous and heterogeneous pedestrians with respect to the size of the visual field. Our numerical findings contribute to providing some new insights on designing computer-aided (control-based) guiding strategies in actual evacuations.
This paper is organized as follows: A framework of dynamic guiding assistant system with density control algorithm is proposed in Section missing 2. In Section missing 3, we first introduce the necessity of using dynamic guiding assistance in the asymmetric-exit evacuation process and then investigate the optimal size of the observed regions for various scenarios with a slight data delay and a large data delay. Finally, the conclusion is given in Section missing 4.
Notation: We use for the set of positive real numbers, for the positive integers, and for the empty set.
2 System Description and Problem Formulation
2.1 System Description
Consider an evacuation system consisting of several pedestrians in a multi-exits evacuation space. Each pedestrian dynamically changes its location over time to escape from the evacuation space through one of the number of exits according to its personal information, e.g., visible exit, communication with the other evacuees. We denote the set of exits by . As myopic decision-makers with limited information, the pedestrians may move in the same direction even when congestions exist around the target exit. In such a case, the exits may not be used efficiently. To help pedestrians better efficiently escape from space, in this paper, we consider a guiding assistant system for the aforementioned evacuation system with evacuation assistants (EAs), where the set of EAs is given by . In this system, each evacuation assistant is assigned to a corresponding exit , and sends a guiding signal to the pedestrians to attract them towards its own assigned exit. We assume that the guiding signal is dynamically adjustable by the evacuation assistant according to the real-time situation of the evacuation process. Henceforth, we denote the guiding assistant system by .
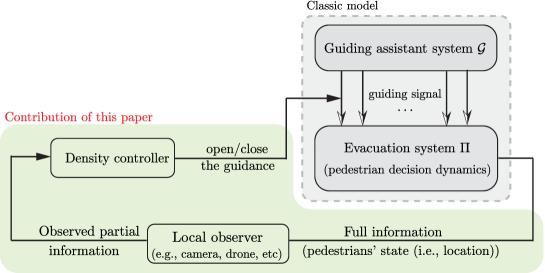
According to the control theory, it is essential to notice that the guiding signal of the guiding assistant system can be understood as the input to the evacuation system so that the states (location) of the pedestrians are controlled (affected) by the EAs. This fact is characterized independently of the underlying mathematical models that describe the decision-making process of pedestrians under guidance (guiding signals). However, as a common issue in control systems, the states (location) of the pedestrians may not be fully observed. Inspired by the classic control theory, we note that an unobservable system may still be controllable under some well-designed control algorithms [36, 37]. Consequently, in this paper, we assume that EAs may observe partial information on the locations of the pedestrians (e.g., the pedestrian density near exit ) using some computer-aided technologies. For example, those EAs can observe the regions near exits and adjust the intensity of guiding signals according to the observed information. A fundamental question is how to set the size of the observed regions and control the guiding signals to enhance the evacuation efficiency as much as possible. To address this problem, we introduce a force-driven CA model under density control algorithm in the next section to implement the structure of the guiding assistant-based evacuation system illustrated in Fig. missing 1.
2.2 Brief Introduction of Force-driven CA Model Under Density Control
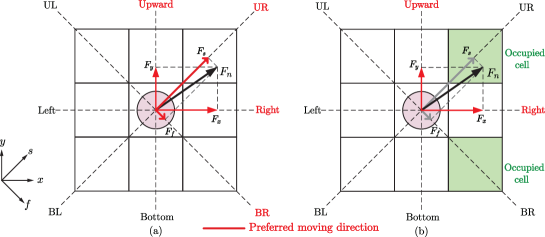
In this section, we characterize the force-driven CA model to describe the guided evacuation process with the two-dimensional Moore cells, where each cell may be occupied by only one of the pedestrians with eight neighbor cells as the possible moving directions for the next time instant (see Fig. missing 2(a)). Specifically, to be consistent with the literature in guided evacuation [27, 28, 29, 34, 35], we consider a square evacuation space and divide the space to number of cells. Letting denote the set of the pedestrians remaining in the evacuation system at time instant , we suppose that the remaining pedestrians simultaneously update their locations according to a social force-based evolution rule given in the following sections.
2.2.1 Force Definitions
Before we present the detailed expression of the evolution rule, we define the social force consisting of a guiding force from an evacuation assistant, the mutual forces among visible pedestrians, and the attractive forces to visible exits for each pedestrian , i.e.,
| (1) |
where , and denote the positive weighting factors depending on the evacuation scenario, and (resp., ) represents the set of visible pedestrians (resp., visible exits) for the pedestrian .
Note that in Eq. (missing) 1, represents the guiding force pointing to the exit whose EA’s guiding signal possesses a maximal signal to interference ratio, i.e.,
| (2) |
where refers to the intensity coefficient controlled by the evacuation assistant , refers to the maximal intensity of the guiding signal, refers to the distance (steps) to the exit , and refers to the unit vector pointing from the pedestrian to the exit (see Ref. [26]); represents a mutual force from the visible pedestrian [38, 26], i.e.,
| (3) |
where refers to the repulsion coefficient, refers to the attraction coefficient, refers to the length of the visual field, refers to the distance (steps) between the pedestrians and , and refers to the unit vector pointing to the pedestrian ; represents an attractive force to a visible exit [38, 26], i.e.,
| (4) |
where refers to the constant intensity, and respectively refer to the distance and the unit vector to the exit .
Remark 1.
It is necessary to notice that the repulsions between the pedestrian and obstacle may need to be further added in the expression of the social force (1) when the obstacle appears in the visual field. The expression of repulsions between the pedestrian and obstacle can be found in [38]. To be consistent with the literature in guided evacuation (see [27, 28, 29, 34, 35]), we do not consider an evacuation space with any obstacle and hence those forces are excluded in this paper. On the other hand, when the heterogeneity on quality of the pedestrians [38] is considered, the expressions of the repulsions and attractions should be changed to , where is the quality of the pedestrian and is the quality of the pedestrian .
After defining the notion of social forces, the preferences of moving direction candidates are consequently derived by sorting the magnitude of the decomposed forces of Fn at x, y, s, and f-axis (see Fig. missing 2). Henceforth, we denote the sequence of ordered preference target cells by , where refers to the -th preferred target.
2.2.2 Social Force-Based Evolution Rule
Given an initial distribution of the pedestrians and the intensity coefficients , of the guiding signals from the guiding assistant system , the social force-based evolution rule of the force-driven CA model is summarized as follows:
-
(i)
Calculate the social force according to Eq. (missing) 1 and determine the sequence of ordered preferred target cells for all the remaining pedestrians . If some of the desired targets have already been occupied, then some elements of are understood as empty. For example, the cells in the upper right and bottom right directions in Fig. missing 2(b) are not considered as the preferred target cells and hence because those cells have already been occupied.
-
(ii)
Collisions and target competition. We suppose that each pedestrian possesses at most chances to compete for the target cells with the other pedestrians according to its own sequence . If a cell is targeted as the preferred moving direction by several pedestrians in one of the competition rounds, it turns out that collisions may happen [39] so that none of the conflicting pedestrians wins in the competition. Here, we suppose that the probability that collision happens is , whereas the probability that one of the conflicting pedestrians wins (and hence the target cell is assigned to him) is . In the case where a collision does not happen, the winner is randomly selected. If the pedestrian loses in one of the competitions, then he continues to compete for the next un-assigned preferred target cell until all the chances are used. If the pedestrians lose in all the rounds of competitions, they do not change their locations next time instant 111According to our observation and personal experience in the real world, when two pedestrians are targeting the same location, one is likely to change his direction when the collision is about to happen. This change of direction may happen almost at the same time when another pedestrian successfully comes to the targeted location. Therefore, in the rest of the paper, we suppose that each pedestrian has one chance to alter his target, i.e., ..
-
(iii)
Update the locations for all the pedestrians . Since the pedestrians who reached one of the exits are understood as the ones who have successfully escaped from the evacuation system , release the escaped pedestrians from the simulation data set, let , and update the set .
-
(iv)
Calculate and output the pedestrian density observed at the exit .
-
(v)
Require the new information of , , and go to (i) to continue until all of the pedestrians left the evacuation system (i.e., ).
Remark 2.
It is important to note that the proposed evacuation model requires the inputs (i.e., the intensity coefficient , ) from the guiding assistant system and offers the real-time data (partial information) to the density controller for redesigning the inputs. Consequently, when a density controller is established, the guiding signals are understood as the feedback to the evacuation system for enhancing the efficiency of the evacuation process (see Fig. missing 1).
2.3 Density Control Algorithm
In this section, we consider an on-off-based density control algorithm as the feedback control law for the guiding assistant system to adjust the guiding signals and hence affect the evacuation efficiency. Specifically, we suppose that all of the EAs only observe the values of pedestrian density around their own assigned exit based on some computer-aided technologies (e.g., image processing) and use the observed information to update , for the guiding signals. The density control algorithm considered in this paper is given by
| (7) |
where denotes the constant time step delay of the data (observed information), refers to the exit index assigned to the evacuation assistant , and refers to the target pedestrian density set by the evacuation assistant . In this case, the evacuation assistant turns on (resp., turns off) the guiding signal when the current density around its exit is less (resp., larger) than the target density 222If holds for some , then it is understood that those EAs never stop sending the guiding signals for attracting the pedestrian towards their own assigned exits. Alternatively, if holds for some , then it is understood that those EAs only begin to send the guiding signals when all the pedestrians around their assigned exits have already escaped from the evacuation system .. It is important to note that when , , the guiding signal is always opened and hence the guidance from the guiding assistant system is understood as the classical (static) guiding assistance. Alternatively, when , , it is understood that the classical (static) guidance from the guiding assistant system changes to dynamic guidance.
Remark 3.
Note that a continuous-function control can be considered as the density control algorithm to enhance the evacuation efficiency if the guiding signals , are quantifiable. However, establishing quantifiable guiding signals relies on the structure (equipment) of the guidance system. For example, a PI control algorithm can be used in the evacuation process when the strength of the guiding signals is shown in the IoT devices to the pedestrians. Since the opening and closing of the guiding effect do not rely on the structure of the guidance system, we use the on-off-based density control in this paper.
Problem: Consider the guiding assistant system with the density control algorithm shown in Eq. (missing) 7. The main question investigated in this paper is how to set the observed regions and the target density in the guiding assistant system to enhance the evacuation efficiency as much as possible. Since the data collection (e.g., imaging processing) and data transmission take time, the time step delay may not be very small, and this parameter may affect the evacuation efficiency under the guiding assistant system . In the following sections, we first consider the case where the time step delay is very small, and then we discuss the situation when considering a larger time step delay .
We evaluate the evacuation efficiency by using the nation of travel time , which is defined as the time instant when all the pedestrians successfully escaped from the evacuation system, i.e., at . The dynamical guiding assistant system (or, the density control algorithm) is said to be effective if the travel time is shorter than the one under static guidance (i.e., , ).
3 Simulation and Analysis
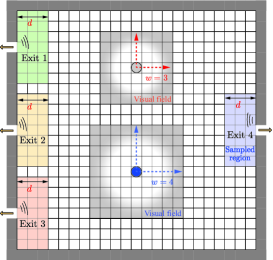
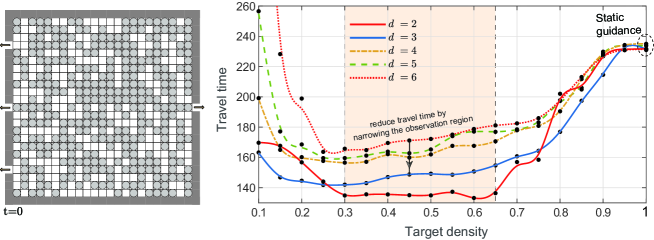
Limited by the difficulty of obtaining real data under the COVID pandemic, the validity of the force-driven CA model is verified by the context of the fundamental results in [38, 40, 26]. The main objective of this paper is to obtain the optimal control strategies (e.g., target density, observed region) for the guiding assistant system through analyzing simulation results. In this section, we present and analyze our simulation results for an evacuation system with exits and evacuation assistants where every evacuation assistant is located at the exit and is observing the pedestrian density near its exit to turn on or shut down the guiding signal according to Eq. (missing) 7. Specifically, letting , we divide the indoor evacuation space to cells so that the evacuation system may contain at most 529 pedestrians. We set in Eq. (missing) 1, in Eq. (missing) 2, in Eq. (missing) 4, , and in Eq. (missing) 3. We consider the evacuation space with asymmetric exits layout as shown in Fig. missing 3.
Remark 4.
In general, the effect of exit distribution (e.g., the number of exits and asymmetric degree of exits) may influence the evacuation efficiency (see the results in [41]). For example, different from the main contribution of this paper, the effect of density control with a symmetric exit distribution is revealed in [26] without considering data time delay. In terms of the asymmetric exit distribution, it turns out that the tendency of simulation results shown in the following sections still can be similarly found when we alter the distributions of those exits. Therefore, the evacuation space shown in Fig. missing 3 is considered without loss of generality in the rest of this paper.
For simplicity, we let for all and define the observed region as a rectangular area expanded from the exit with steps (see the typical example of the four observed regions with in Fig. missing 3, where each of the EAs is able to observe at most 21 pedestrians near its exits). Recalling the fact that the time step delay of the observed data depends on the data collection structure, we first assume that the time step delay is very small in Section missing 3.1 and then relax this assumption in Section missing 3.2 to discuss how the result changes when we have a more significant time step delay . It is important to note that as one of the pedestrians’ inherent properties, the size of the visual field may be diverse from each other and hence the pedestrians existing in the evacuation system may be homogeneous or heterogeneous. As the simulation result might be strongly connected to the mentioned inherent property (i.e., size of the visual field), to derive a strategic conclusion on how to set the target density and observed region without loss of generality, we may consider the evacuation processes with heterogeneous pedestrians in the following sections.
3.1 Small Time Step Delay in Density Control Algorithm
3.1.1 Necessity of Using Dynamic Guiding Assistances
In the beginning, to indicate the necessity of using dynamic guiding assistance in the asymmetric-exits evacuation process, we use the initial distribution shown in Fig. missing 4(a) in the simulation where 317 pedestrians are distributed randomly in the evacuation space. The field of view is given by for all the pedestrians so that each one of them is able to observe at most 48 pedestrians around its location (see the grey circle in Fig. missing 3 representing a pedestrian with ). Letting the collision probability be , the distributions of the pedestrians under static guiding assistance (i.e., ) are shown in Fig. missing 4. It can be seen from the figure that since the EAs never stop attracting the pedestrians, whatever how large the density is in its observed region, the pedestrians are suddenly separated in the horizontal direction, and hence a blank zone appears in the middle of the evacuation space from the time instant . The blank zone expands along with time and the utilization of the three exits in the left-hand side of the evacuation space is almost vacant in the later stage of the evacuation, i.e., the remaining pedestrians only locate around exit 4 after time instant . As a result, it is observed that a lot of evacuation efficiency is wasted in the evacuation process under the static guiding assistance.
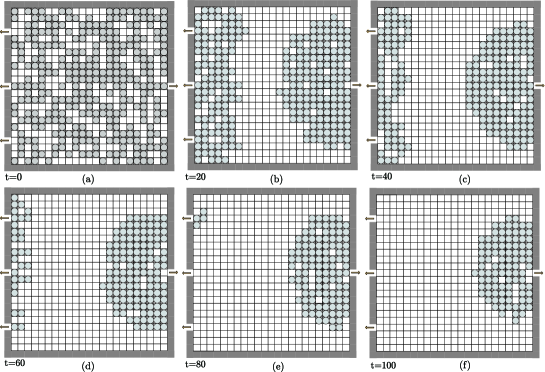
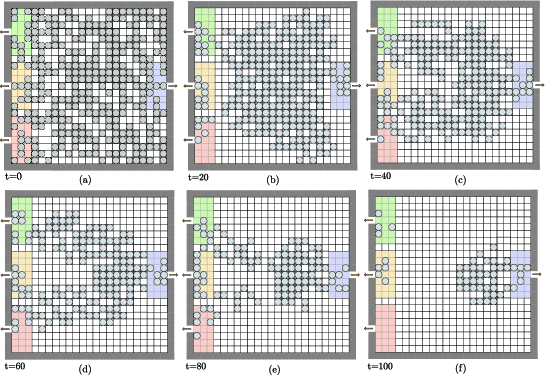
Next, we show a typical example of pedestrian distributions, which reveals the effectiveness and significance of using dynamic guiding assistance. Specifically, in the simulation, we let , , (see the colored areas representing the observed regions in Fig. missing 3). The distributions of the pedestrians are illustrated in Fig. missing 5. Compared to the case with static guiding assistance, the amounts of the remaining pedestrians at the time instants , , , , and under dynamic guiding assistance in Fig. missing 5 are certainly less than the ones in Fig. missing 4. It can be easily found in Fig. missing 5 that the pedestrian densities in the four observed regions under control are much less than the ones in Fig. missing 4 so that the possibility of collisions and congestions happening around the exits is suppressed, which make the evacuation run more efficiently. Another direct and interesting observation found in the comparison is that the pedestrians are no longer separated into two crowds in the horizontal direction but stay in the central region under dynamic guiding assistance (see Fig. missing 5(b)–(e)). Those simulation results capture the fact that the dynamic guiding assistant system with only partially observable data may still positively control (affect) the location of all pedestrians in the multi-exit evacuation process by involving the density control algorithm.
3.1.2 Influence of Target Density and Size of Observed Regions
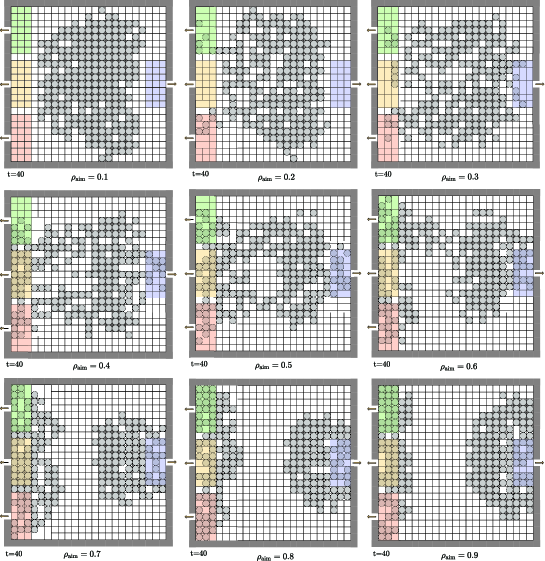
In this section, we investigate the influence of the target density of the dynamic guiding assistant system on the travel time of the evacuation process and hence derive the optimal size of the observed regions. Letting , the response curves of travel time of the evacuation process on target density are shown in Fig. missing 6 with several different sizes of the observed regions where the collision probability is still set to . Note that the presented curves are yielded from the average value of the data from more than 30 times simulations and show similar tendencies with respect to . On the one hand, it can be seen from the figure that compared to the case with static guidance (i.e., when target density equals 1.0), the evacuation efficiency is significantly improved when the target density is moderate in the density control algorithm Eq. (missing) 7. Without loss of generality, letting the size of observed regions be , Fig. missing 7 shows the pedestrian distributions at the time instant when different target densities are used in the simulations. This figure provides evidence to support that the target density for the dynamic evacuation assistant system should be a moderate value. In particular, it is observed from Fig. missing 7 that pedestrians are slowly attracted towards the exits when the target density is small, and an arching phenomenon occurs when the target density is large333Arching phenomenon refers to the scene in which a large group of pedestrians huddle around the exit in the evacuation process. This phenomenon leads to serious conflicts and congestions among the pedestrians, and eventually reduce the traffic efficiency of the exits. During designing the dynamic guiding assistant system, the arching phenomenon should be suppressed as much as possible to avoid conflicts and congestions.. On the other hand, it can be further seen from Fig. missing 6 that except for the case with , the efficiency improvement made by the density control algorithm drops off when the size of the observed regions increases. The optimal size for the observed regions and the optimal target density are found as and , respectively. Note that this observation reveals an interesting fact that to enhance the evacuation efficiency, we only need to observe the pedestrians’ location from a small region near the exit instead of a large region when the time step delay in the density control algorithm (7) is very small.
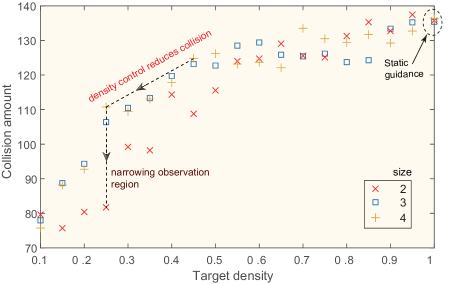
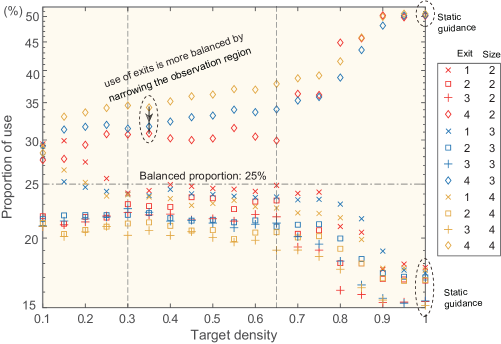
To further understand the intrinsic reason why the target density and the size of the observed region matter in the evacuation process, we illustrate the response curves of collision amounts (that trigged around the exits) on the target density in Fig. missing 8. It can be observed from the figure that the collision amount is reduced when we narrow the observation region for the dynamic guiding assistant system. Moreover, it can be seen that decreasing the target density of the on-off-based density control (7) can significantly reduce the collisions around the exits in the evacuation process. On the other hand, the proportion of use of each exit versus target density with different sizes of the observation region is demonstrated in Fig. missing 9. It can be seen from this figure that the use of exits is extremely imbalanced under static guidance and the density control can significantly balance the use of the four asymmetric exits, especially when the target density is set to . Also, it can be observed that the use of exits is more balanced by narrowing the observation region for the dynamic guiding assistant system.
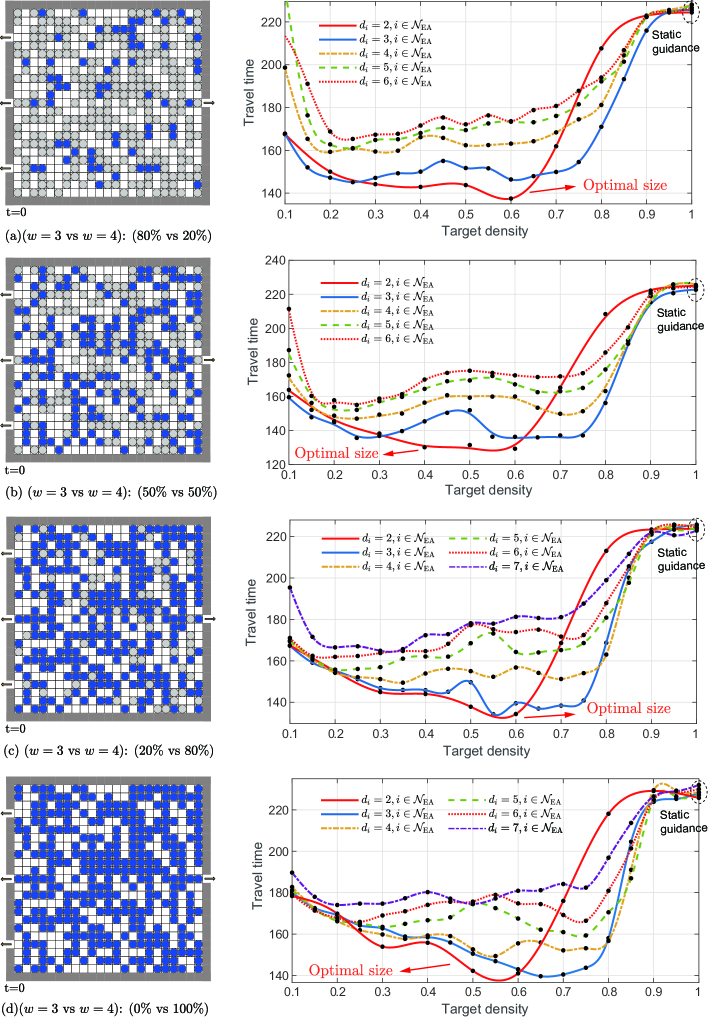
Now, it is important to note that the above observations of the optimal size are without loss of generality when we consider different initial distributions or sizes of the visual field. For example, considering the situation where the pedestrians in the initial time instant may be mixed by some taller pedestrians possessing a larger field of view, we present the simulation results with heterogeneous pedestrians holding the visual field with and under different mixing ratios in Fig. missing 10. Even though the tendencies of the curves are slightly different from Fig. missing 6, we note that the size remains the optimal size for the observed regions in all of the simulations under different mixing ratios. Moreover, when , it is still observed that the efficiency improvement made by the density control algorithm drops off when the size of the observed regions increases for each of the sub-figures. Even though the mixing ratios change the tendency of the response curves, the travel time under the target density with is always the minimum value. As a result, we conclude that no matter how much the mixing ratio is in the simulation, the observed region is suggested to be small for the case where the time step delay is small.
3.2 Influence of Data Time Delay
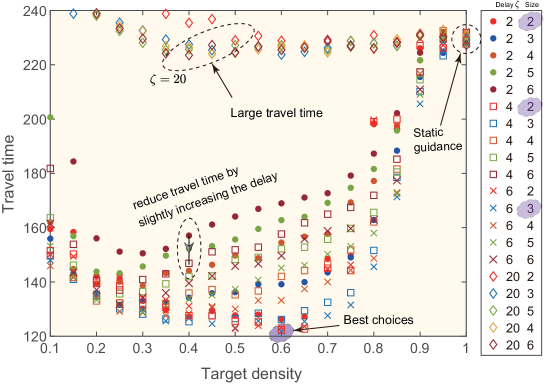
Recalling the fact that the time step delay of the density control algorithm is a given positive parameter depending on the data collection structure of the guiding assistant system, it is important to discuss how the optimal size changes when the given time step delay changes. The travel time versus the target density in density control with different sizes of the observed region and time delays is shown in Fig. missing 11, where we used Fig. missing 6 as the initial distribution in all the simulations. It can be seen from Fig. missing 11 that the travel time can be reduced by slightly increasing the delay. When the given time step delay is larger, setting up a larger region to observe the pedestrians’ location is better. Those observations are natural in the sense of physical meaning, since the data with a large delay are not able to represent the characteristics of the pedestrians’ current situation for a small observed region, but for a large observed region, those data may be able to represent the partial characteristics of the pedestrians’ real situation because of the intrinsic inertia. However, when the time delay is too large, the density control algorithm may no longer obviously enhance the evacuation efficiency (see Fig. missing 11). As a result, the time step delay allowed in our proposed density control algorithm is bounded. The above numerical findings give important insights on designing computer-aided (control-based) guiding strategies in real evacuations.
4 Conclusion
To enhance the evacuation efficiency in partially observable asymmetric-exit evacuation under guidance, a general framework of the dynamic guiding assistant system was proposed to investigate the effect of density control. In the characterized system, multiple evacuation assistants are established to observe the partial information of pedestrians’ location and adjust the guiding signals of the dynamic guiding assistant systems according to the observed information (i.e., pedestrian densities in the observed regions near the corresponding exits). Specifically, a simple on-off-based density control algorithm associated with a target density is considered for evacuation assistants based on the delayed data of (observed) pedestrian densities to meet the physical challenges on data collection, transmission, and implementation which often exist in the realistic computer-aided evacuation process. By involving a force-driven CA model, we presented the simulation results in accordance with data delays to eventually give a strategic suggestion on how to set the observed region and the target density.
According to our numerical simulations, we first revealed the necessity of using dynamic guiding assistance in the asymmetric-exit evacuation process. It was found that the proposed density control algorithm can control (positively affect) the global distribution of the pedestrians’ locations and suppress arching phenomena in the evacuation process even using partially observed information under time delays. To derive the optimal size of the observed regions, we investigated the influence of the target density of the dynamic guiding assistant system on the travel time of the evacuation process. It was found that the dynamic guiding assistant system with only partially observable data can suppress the triggers of collisions around the exits and avoid inefficiently separating the pedestrians in the evacuation process. After showing various simulation results, we revealed an interesting fact without loss of generality that to enhance the evacuation efficiency, we only need to observe the pedestrians’ location from a small region near the exit instead of a large region when the time step delay in the density control algorithm is very small. Furthermore, we found that the time step delay allowed in our proposed density control algorithm is bounded since it may be impossible to significantly enhance the evacuation efficiency by using the density control algorithm when the time step delay is too large. For both the small delay case and large delay case, we suggested the target density of the density control algorithm to be a moderate value. Our numerical results are expected to provide insights into designing the computer-aided guiding strategies in real evacuations.
However, due to the difficulty of inviting human volunteers under the COVID pandemic, conducting an actual experiment is expected in future. Moreover, there may be many different heterogeneities in the evacuation process, such as the psychological considerations (risk-averse/risk-seeking), quality of the pedestrians, will on sharing visual field, to name but a few. The analysis on those factors may be promised necessary future research directions. As a preliminary study connecting the control theory and pedestrian evacuation theory, we only used a simple and intuitive control algorithm for the evacuation assistant system. However, there may exist possible future research directions when we apply some novel control algorithms to the evacuation process, such as model predictive control [42], system identification [43], Q-learning for optimal control [44], noise elimination, etc.
CRediT Authorship Contribution Statement
Fengqiang Gao: Investigation; formal analysis; writing- original draft preparation, reviewing (equal). Zhihao Chen: Software; validation; reviewing (equal). Yuyue Yan: Conceptualization; methodology; investigation; writing- review editing (lead). Linxiao Zheng: Visualization; reviewing (equal). Huan Ren: Group management; reviewing (equal).
Acknowledgments
This work was supported jointly by Program for Young Excellent Talents in University of Fujian Province (201847) and China Scholarship Council (201908050058). We thank Xie Chen for participating in a discussion in the early state of this work.
References
- [1] Q. Meng, M. Zhou, J. Liu, H. Dong, Pedestrian evacuation with herding behavior in the view-limited condition, IEEE Trans. Comput. Soc. Syst. 6 (3) (2019) 567–575. doi:https://doi.org/10.1109/TCSS.2019.2915772.
- [2] Y. Cheng, X. Zheng, Emergence of cooperation during an emergency evacuation, Appl. Math. Comput. 320 (2018) 485–494. doi:https://doi.org/10.1016/j.amc.2017.10.011.
- [3] M. Haghani, E. Cristiani, N. W. Bode, M. Boltes, A. Corbetta, Panic, irrationality, and herding: three ambiguous terms in crowd dynamics research, J. Adv. Transp. 2019. doi:https://doi.org/10.1155/2019/9267643.
- [4] J. Guan, K. Wang, Towards pedestrian room evacuation with a spatial game, Appl. Math. Comput. 347 (2019) 492–501. doi:https://doi.org/10.1016/j.amc.2018.11.003.
- [5] W. Liao, X. Zheng, L. Cheng, Y. Zhao, Y. Cheng, Y. Wang, Layout effects of multi-exit ticket-inspectors on pedestrian evacuation, Saf. Sci. 70 (2014) 1–8. doi:https://doi.org/10.1016/j.ssci.2014.04.015.
- [6] T. Liu, X. Yang, Q. Wang, M. Zhou, S. Xia, A fuzzy-theory-based cellular automata model for pedestrian evacuation from a multiple-exit room, IEEE Access 8 (2020) 106334–106345. doi:https://doi.org/10.1109/ACCESS.2020.3000606.
- [7] A. Varas, M. Cornejo, D. Mainemer, B. Toledo, J. Rogan, V. Munoz, J. Valdivia, Cellular automaton model for evacuation process with obstacles, Physica A 382 (2) (2007) 631–642. doi:https://doi.org/10.1016/j.physa.2007.04.006.
- [8] G. G. Løvås, Modeling and simulation of pedestrian traffic flow, Transp. Res. Part B 28 (6) (1994) 429–443. doi:https://doi.org/10.1016/0191-2615(94)90013-2.
- [9] D. Helbing, I. Farkas, T. Vicsek, Simulating dynamical features of escape panic, Nature 407 (6803) (2000) 487–490. doi:https://doi.org/10.1038/35035023.
- [10] F. Müller, O. Wohak, A. Schadschneider, Study of influence of groups on evacuation dynamics using a cellular automaton model, Transp. Res. Rec. 2 (2014) 168–176. doi:https://doi.org/10.1016/j.trpro.2014.09.022.
- [11] D. Yanagisawa, K. Nishinari, Mean-field theory for pedestrian outflow through an exit, Phys. Rev. E 76 (2007) 061117. doi:https://doi.org/10.1103/PhysRevE.76.061117.
- [12] K. Huang, X. Zheng, Y. Cheng, Y. Yang, Behavior-based cellular automaton model for pedestrian dynamics, Appl. Math. Comput. 292 (2017) 417–424. doi:https://doi.org/10.1016/j.amc.2016.07.002.
- [13] R. Alizadeh, A dynamic cellular automaton model for evacuation process with obstacles, Saf. Sci. 49 (2) (2011) 315–323. doi:https://doi.org/10.1016/j.ssci.2010.09.006.
- [14] Z. Fu, X. Zhou, Y. Chen, J. Gong, F. Peng, Z. Yan, T. Zhang, L. Yang, The influence of random slowdown process and lock-step effect on the fundamental diagram of the nonlinear pedestrian dynamics: An estimating-correction cellular automaton, Commun. Nonlinear. Sci. Numer. Simul. 20 (3) (2015) 832–845. doi:https://doi.org/10.1016/j.cnsns.2014.06.034.
- [15] Z. Shahhoseini, M. Sarvi, Pedestrian crowd flows in shared spaces: investigating the impact of geometry based on micro and macro scale measures, Transp. Res. Part B 122 (2019) 57–87. doi:https://doi.org/10.1016/j.trb.2019.01.019.
- [16] X. Yang, X. Yang, F. Pan, Y. Kang, J. Zhang, The effect of passenger attributes on alighting and boarding efficiency based on social force model, Physica A 565 (2021) 125566. doi:https://doi.org/10.1016/j.physa.2020.125566.
- [17] M. Chraibi, A. Seyfried, A. Schadschneider, Generalized centrifugal-force model for pedestrian dynamics, Phys. Rev. E 82 (4) (2010) 046111. doi:https://doi.org/10.1103/PhysRevE.82.046111.
- [18] Y. Hao, Z. Bin-Ya, S. Chun-Fu, X. Yan, Exit selection strategy in pedestrian evacuation simulation with multi-exits, Chin. Phys. B 23 (5) (2014) 050512. doi:https://doi.org/10.1088/1674-1056/23/5/050512.
- [19] P. Hrabak, M. Bukacek, Influence of agents heterogeneity in cellular model of evacuation, J. Comput. Sci. 21 (2017) 486 – 493. doi:https://doi.org/10.1016/j.jocs.2016.08.002.
- [20] K. Huang, X. Zheng, A weighted evolving network model for pedestrian evacuation, Appl. Math. Comput. 298 (2017) 57–64. doi:https://doi.org/10.1016/j.amc.2016.10.040.
- [21] D.-F. Xie, Z.-Y. Gao, X.-M. Zhao, D. Z.-W. Wang, Agitated behavior and elastic characteristics of pedestrians in an alternative floor field model for pedestrian dynamics, Physica A 391 (7) (2012) 2390–2400. doi:https://doi.org/10.1016/j.physa.2011.11.053.
- [22] Z. Fu, Q. Jia, J. Chen, J. Ma, K. Han, L. Luo, A fine discrete field cellular automaton for pedestrian dynamics integrating pedestrian heterogeneity, anisotropy, and time-dependent characteristics, Transp. Res. Part C 91 (2018) 37–61. doi:https://doi.org/10.1016/j.trc.2018.03.022.
- [23] D. Miyagawa, G. Ichinose, Cellular automaton model with turning behavior in crowd evacuation, Physica A: Statistical Mechanics and its Applications (2020) 124376doi:https://doi.org/10.1016/j.physa.2020.124376.
- [24] L. Lu, C.-Y. Chan, J. Wang, W. Wang, A study of pedestrian group behaviors in crowd evacuation based on an extended floor field cellular automaton model, Transp. Res. Part C 81 (2017) 317–329. doi:https://doi.org/10.1016/j.trc.2016.08.018.
- [25] X. Yang, H. Dong, Q. Wang, Y. Chen, X. Hu, Guided crowd dynamics via modified social force model, Physica A 411 (2014) 63–73. doi:https://doi.org/10.1016/j.physa.2014.05.068.
- [26] H. Ren, Y. Yan, F. Gao, Variable guiding strategies in multi-exits evacuation: Pursuing balanced pedestrian densities, Applied Mathematics and Computation 397 (2021) 125965. doi:https://doi.org/10.1016/j.amc.2021.125965.
- [27] X. Yang, H. Dong, X. Yao, X. Sun, Q. Wang, M. Zhou, Necessity of guides in pedestrian emergency evacuation, Physica A 442 (2016) 397–408. doi:https://doi.org/10.1016/j.physa.2015.08.020.
- [28] Y. Ma, R. K. K. Yuen, E. W. M. Lee, Effective leadership for crowd evacuation, Physica A 450 (2016) 333–341. doi:https://doi.org/10.1016/j.physa.2015.12.103.
- [29] Y. Ma, E. W. M. Lee, M. Shi, Dual effects of guide-based guidance on pedestrian evacuation, Mod. Phys. Lett. 381 (22) (2017) 1837–1844. doi:https://doi.org/10.1016/j.physleta.2017.03.050.
- [30] M. Zhou, H. Dong, P. A. Ioannou, Y. Zhao, F.-Y. Wang, Guided crowd evacuation: approaches and challenges, IEEE/CAA Journal of Automatica Sinica 6 (5) (2019) 1081–1094. doi:https://doi.org/10.1109/JAS.2019.1911672.
- [31] J. C. Chu, A. Y. Chen, Y.-F. Lin, Variable guidance for pedestrian evacuation considering congestion, hazard, and compliance behavior, Transp. Res. Part C 85 (2017) 664–683. doi:https://doi.org/10.1016/j.trc.2017.10.009.
- [32] M. Zhou, H. Dong, Y. Zhao, P. A. Ioannou, F.-Y. Wang, Optimization of crowd evacuation with leaders in urban rail transit stations, IEEE Trans. Intell. Transp. Syst. 20 (12) (2019) 4476–4487. doi:10.1109/TITS.2018.2886415.
- [33] S. Long, D. Zhang, S. Li, S. Yang, B. Zhang, Simulation-based model of emergency evacuation guidance in the metro stations of China, IEEE Access 8 (2020) 62670–62688. doi:https://doi.org/10.1109/ACCESS.2020.2983441.
- [34] X. Yang, X. Yang, Q. Wang, Y. Kang, F. Pan, Guide optimization in pedestrian emergency evacuation, Appl. Math. Comput. 365 (2020) 124711. doi:https://doi.org/10.1016/j.amc.2019.124711.
- [35] X. Yang, X. Yang, Q. Wang, Pedestrian evacuation under guides in a multiple-exit room via the fuzzy logic method, Commun. Nonlinear. Sci. Numer. Simul. 83 (2020) 105138. doi:https://doi.org/10.1016/j.cnsns.2019.105138.
- [36] T. Liu, Z.-P. Jiang, Event-based control of nonlinear systems with partial state and output feedback, Automatica 53 (2015) 10 – 22. doi:https://doi.org/10.1016/j.automatica.2014.12.027.
- [37] L. Wang, C. P. Chen, H. Li, Event-triggered adaptive control of saturated nonlinear systems with time-varying partial state constraints, IEEE Trans. Cybern. 50 (4) (2018) 1485–1497. doi:https://doi.org/10.1109/TCYB.2018.2865499.
- [38] C. K. Chen, J. Li, D. Zhang, Study on evacuation behaviors at a T-shaped intersection by a force-driving cellular automata model, Physica A 391 (7) (2012) 2408–2420. doi:https://doi.org/10.1016/j.physa.2011.12.001.
- [39] J. Tanimoto, A. Hagishima, Y. Tanaka, Study of bottleneck effect at an emergency evacuation exit using cellular automata model, mean field approximation analysis, and game theory, Physica A 389 (24) (2010) 5611–5618. doi:https://doi.org/10.1016/j.physa.2010.08.032.
- [40] F. Gao, Y. Yan, C. Xu, L. Lin, H. Ren, J. Pei, A new cellular automata model for pedestrian evacuation considering guiding effects, Journal of Transportation Systems Engineering and Information Technology 16 (6) (2016) 60–66. doi:http://manu01.magtech.com.cn/Jwk_jtys/CN/Y2016/V16/I6/60.
- [41] H. Yue, H. Guan, C. Shao, X. Zhang, Simulation of pedestrian evacuation with asymmetrical exits layout, Physica A 390 (2) (2011) 198–207. doi:https://doi.org/10.1016/j.physa.2010.10.003.
- [42] J. Köhler, R. Soloperto, M. A. Muller, F. Allgower, A computationally efficient robust model predictive control framework for uncertain nonlinear systems, IEEE Trans. Automat. Contr. 66 (2) (2020) 794–801. doi:https://doi.org/10.1109/TAC.2020.2982585.
- [43] A. Mauroy, J. Goncalves, Koopman-based lifting techniques for nonlinear systems identification, IEEE Trans. Automat. Contr. 65 (6) (2019) 2550–2565. doi:https://doi.org/10.1109/TAC.2019.2941433.
- [44] D. Lee, J. Hu, Primal-dual q-learning framework for LQR design, IEEE Trans. Automat. Contr. 64 (9) (2018) 3756–3763. doi:https://doi.org/10.1109/TAC.2018.2884649.