Transverse spin asymmetries for inclusive production in SIDIS at COMPASS
A. Kerbizi
for the COMPASS Collaboration
Trieste Section of INFN, University of Trieste,
Dept. of Physics, 34127 Trieste, Italy
* albi.kerbizi@ts.infn.it
![]() Proceedings for the XXVIII International Workshop
Proceedings for the XXVIII International Workshop
on Deep-Inelastic Scattering and
Related Subjects,
Stony Brook University, New York, USA, 12-16 April 2021
10.21468/SciPostPhysProc.?
Abstract
The production of vector mesons in SIDIS is a particularly interesting channel to study the polarized fragmentation and related phenomena. Preliminary COMPASS results for the first measurement of inclusive Collins and Sivers transverse-spin asymmetries are presented here for the first time. The analysis is based on the data-set collected by COMPASS in 2010 using a beam and a transversely polarized target. The asymmetries are extracted as function of Bjorken-, of the total transverse momentum of the oppositely charged hadron pair and of the fraction of available energy carried by the pair. Indications for positive Collins and Sivers asymmetries are obtained as expected from models.
1 Introduction
Transverse spin asymmetries (TSAs) in Semi-Inclusive Deep Inelastic Scattering (SIDIS) like the Collins, dihadron and Sivers asymmetries are being measured since 2005. TSAs have been measured in SIDIS off proton, deuteron or neutron targets for unidentified charged hadrons or for identified pions, kaons and protons by the HERMES [1], COMPASS [2, 3] and JLab [4] collaborations. Valuable information on the nucleon structure encoded in parton distribution functions (PDFs) and on the fragmentation process encoded in fragmentation functions (FFs) have been extracted from such asymmetries. The most remarkable results concern the extraction of the transversity and the Sivers PDFs that turned out to be different from zero. Similar results for the transversity function have been obtained from the measurement of the dihadron asymmetries [3, 5].
An other interesting and unexplored class of TSAs are those related to the inclusive production of vector mesons which probe a new and unknown class of FFs [6]. For instance, models suggest that the Collins effect for the production of mesons is opposite and smaller by a factor of three with respect to that of positive pions [7, 8]. The measurement of TSAs for vector mesons is challenging due to the lower statistics than pseudoscalar mesons and the high combinatorial background. Although their knowledge is crucial to shed light on the spin-dependence of the fragmentation process, they had never been measured. In this article we present preliminary results of the first ever measurement of the Collins and Sivers asymmetries for inclusive production of in SIDIS off transversely polarized protons performed recently by the COMPASS Collaboration.
2 The data sample
We have analyzed the full SIDIS data sample collected in 2010 by scattering a beam with momentum off a transversely polarized target, already used for many published results [2, 3]. We require the virtuality of the exchanged photon to be and the invariant mass of the final hadronic system . Also the Bjorken variable is taken and the fraction of the photon energy carried by the scattered muon . On the hadron side, for each hadron the fractional energy is required to be larger than and the transverse momentum with respect to the exchanged photon direction larger than .
Then, all the pairs in the same event have been selected as follows. The cut on missing energy has been applied to reject the exclusive pairs. The missing energy is defined to be , where with , and the four-momenta respectively of the exchanged photon, of the target proton and of the hadron pair, and is the proton mass. The fractional energy of the pair is required to be larger than , in order to enhance the fraction of mesons. The additional cuts , with being the transverse momentum of the pair, and have been applied.
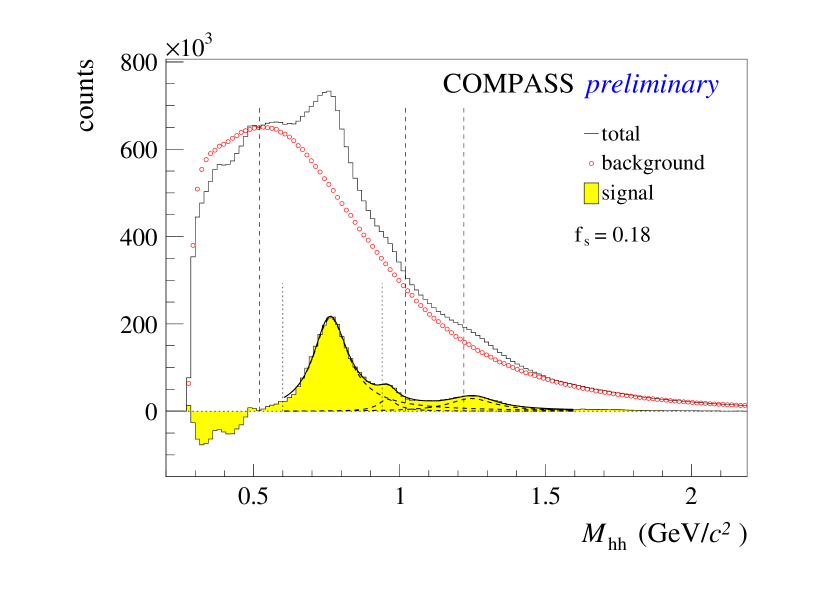
The final invariant mass distribution of pairs is shown by the continuous empty histogram in Fig. 1. The peak is clearly visible as well as the structures corresponding to the and mesons. As it can be seen the combinatorial background under the peak is large. The points show the normalized invariant mass distribution of and pairs, that we take as background distribution. This recipe gives a good estimation of the background in the signal region, although the agreement is not good at low invariant mass. Also, the systematic uncertainty in the background estimation has been included in the systematic uncertainty of the final asymmetries. The filled histogram shows the background subtracted yield of pairs.
3 Procedure for the extraction of TSAs
We divided the invariant mass range in four regions, defined as region for , region for , region for and region for , as shown by the vertical lines in Fig. 1. The region is the " region" which contains the peak, whereas regions and are the "side band" regions given by the combinatorial background.
The strategy applied for the extraction of the TSAs consists in the following steps:
-
a.
Evaluate the fraction in the region.
-
b.
Measure the transverse spin asymmetry of the pairs in the region.
-
c.
Measure the background transverse spin asymmetry from the side band regions.
-
d.
Subtract the background transverse spin asymmetry to obtain the final asymmetry by using
(1)
The azimuthal angle indicates either the Collins angle or the Sivers angle . The angle is the azimuthal angle of the transverse momentum of the pair whereas is the azimuthal angle of the target transverse polarization. Both angles are defined in the so called GNS frame where the exchanged photon and the target nucleon are collinear with respect to each other and the plane is the lepton scattering plane. The axis is taken along the exchanged photon momentum and the axis along the transverse momentum of the scattered muon.
The transverse spin asymmetries have been extracted in six bins of , and by using standard COMPASS methods [9].
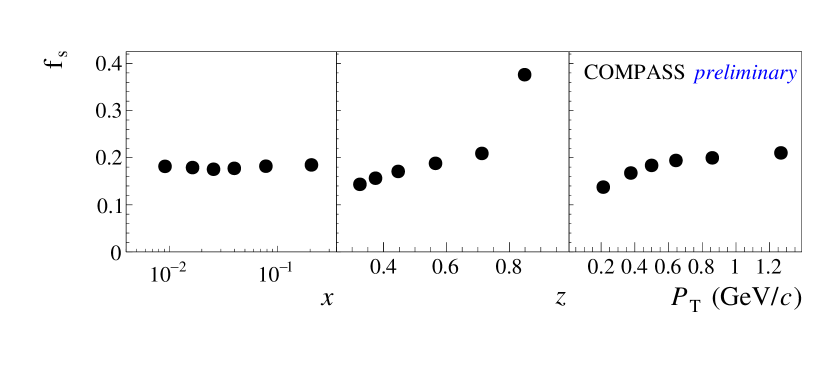
To measure the fraction of mesons in the invariant mass region , the background distribution, shown by the points in Fig. 1, is subtracted from the total distribution. The resulting signal distribution is shown by the filled histogram in Fig. 1 where the peaks corresponding to , and mesons are clearly visible. A fit of the signal distribution with the sum of three Breit-Wigner functions shown in the figure demonstrates that the subtraction procedure is clean. Finally, the fraction of mesons in region is calculated dividing the counts by the total pairs in the same region.
This procedure has been applied to all , and bins and the values of are shown in Fig. 2. We find to be almost constant and about as function of and it increases with and . In particular the high value (about ) in the last bin can be understood in terms of the string fragmentation model [10].
4 TSAs for mesons
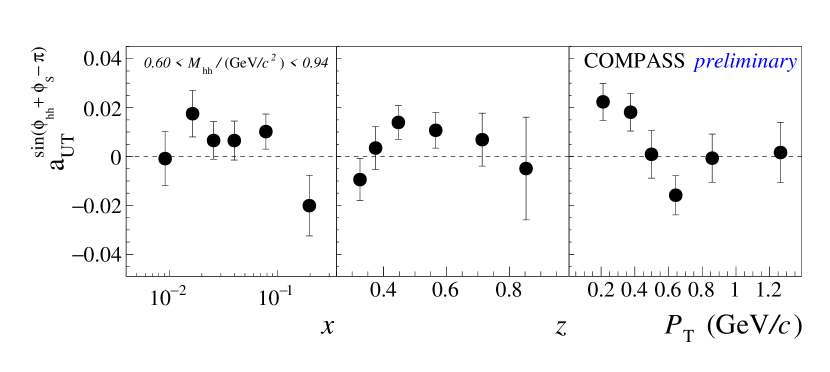
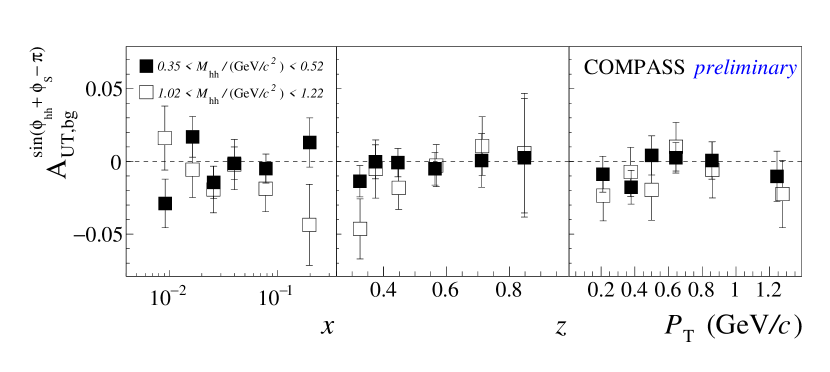
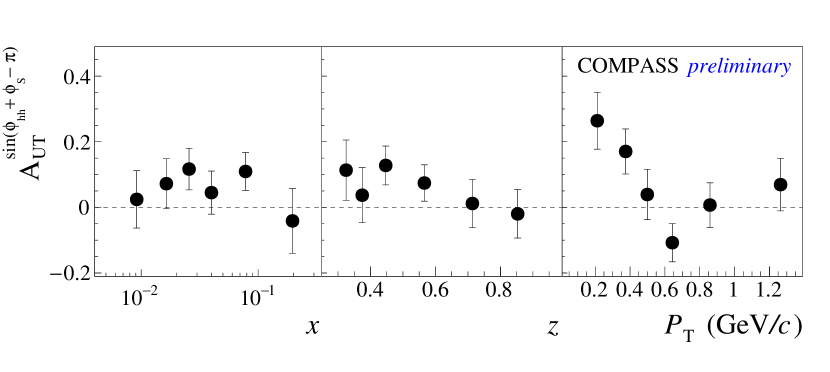
The Collins asymmetry in the region is shown in the upper panel of Fig. 3 as function of , and . In spite of the large statistical uncertainties, the asymmetry is positive and in particular at low and for intermediate values. The corresponding asymmetries in the side band regions and are shown in the middle panel of the same figure. They are similar and compatible with zero.
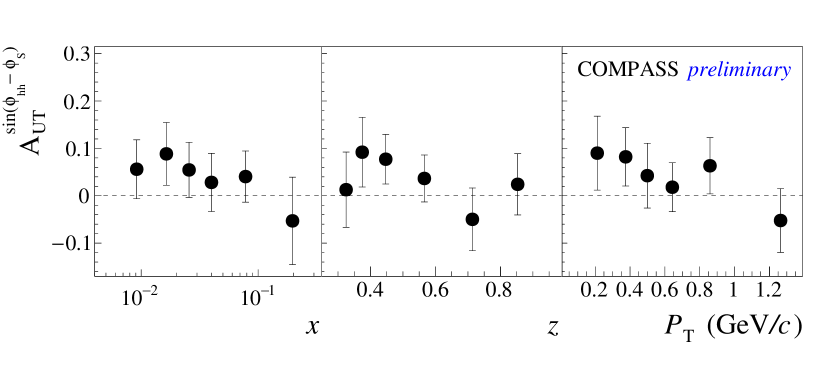
The final Collins asymmetry for mesons is shown in the lower panel of Fig. 3. The uncertainties are statistical only. It has been obtained using in each bin the background asymmetry according to Eq. (1). The background asymmetry is calculated as the arithmetic average of the asymmetries in regions and . In spite of the large uncertainties, the Collins asymmetry is positive in all kinematic bins and a clear effect can be seen for . This is consistent with the expectations from polarized quark fragmentation models [7, 8].
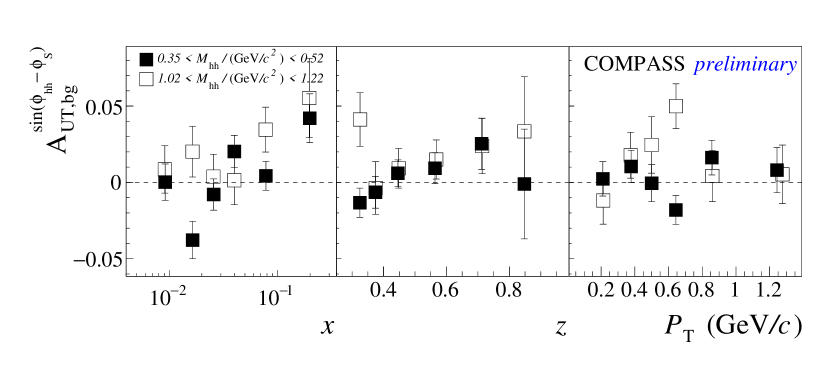
The Sivers asymmetries are shown in Fig. 4. The uncertainties are again statistical only. The asymmetry in the region is large and positive but also the background asymmetry in the side band regions is large, as can be seen from Fig. 4.
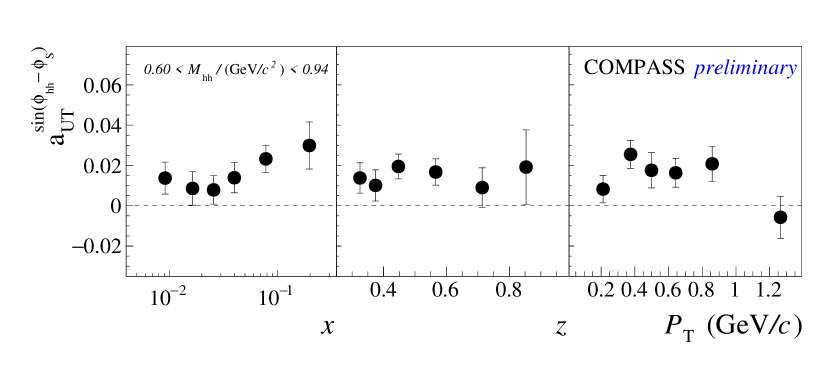
The final Sivers asymmetry for mesons is shown in the bottom panel in Fig. 4. Also in this case we find a hint for a positive asymmetry, as can be expected from considerations based on the parton model and the measurements of the Sivers asymmetries for unpolarized hadrons [2, 1], compatible with the side bands asymmetries.
5 Conclusion
The COMPASS Collaboration has performed the first measurement of the Collins and Sivers transverse spin asymmetries for mesons inclusively produced in SIDIS off transversely polarized protons. In spite of the low statistics, an indication for a positive Collins asymmetry is found, as expected from models of the polarized fragmentation process. The result provides relevant information for the tuning of the free parameters of models. Also an indication for a positive Sivers asymmetry is found, in agreement with the parton model. Most important, this work shows the feasibility of the measurement of TSAs for inclusive vector meson production which could be done with much higher precision at future facilities.
References
- [1] A. Airapetian et al. [HERMES Collaboration], Single-spin asymmetries in semi-inclusive deep-inelastic scattering on a transversely polarized hydrogen target, Phys. Rev. Lett. 94, 012002 (2005), 10.1103/PhysRevLett.94.012002, https://arxiv.org/abs/hep-ex/0408013.
- [2] C. Adolph et al. [COMPASS Collaboration], Collins and Sivers asymmetries in muonproduction of pions and kaons off transversely polarised protons, Phys. Lett. B744, 250 (2015), 10.1016/j.physletb.2015.03.056, https://arxiv.org/abs/hep-ex/1408.4405.
- [3] C. Adolph et al. [COMPASS Collaboration], A high-statistics measurement of transverse spin effects in dihadron production from muon–proton semi-inclusive deep-inelastic scattering, Phys. Lett. B736, 124 (2014), 10.1016/j.physletb.2014.06.080, https://arxiv.org/abs/hep-ex/1401.7873.
- [4] X. Qian et al. [Hall A Collaboration], Single Spin Asymmetries in Charged Pion Production from Semi-Inclusive Deep Inelastic Scattering on a Transversely Polarized 3He Target, Phys. Rev. Lett. 107, 072003 (2011), 10.1103/PhysRevLett.107.072003, https://arxiv.org/abs/hep-ex/1106.0363.
- [5] A. Airapetian et al. [HERMES Collaboration], Evidence for a Transverse Single-Spin Asymmetry in Leptoproduction of Pairs, JHEP 06, 017 (2008), 10.1088/1126-6708/2008/06/017, https://arxiv.org/abs/hep-ex/0803.2367.
- [6] A. Bacchetta and P. J. Mulders, Deep inelastic leptoproduction of spin-one hadrons, Phys. Rev. D 62, 114004 (2000), 10.1103/PhysRevD.62.114004, https://arxiv.org/abs/hep-ph/0007120.
- [7] J. Czyzewski, Single spin asymmetry of vector meson production in the string model, Acta Phys. Polon. 27, 1759 (1996), https://arxiv.org/abs/hep-ph/9606390.
- [8] A. Kerbizi, Recursive fragmentation of a polarized quark, Ph.D. thesis, Trieste U. (2020), https://arxiv.org/abs/hep-ph/2004.00524.
- [9] E. S. Ageev et al. [COMPASS Collaboration], A New measurement of the Collins and Sivers asymmetries on a transversely polarised deuteron target, Nucl. Phys. B765, 31 (2007), 10.1016/j.nuclphysb.2006.10.027, https://arxiv.org/abs/hep-ex/0610068.
- [10] B. Andersson, G. Gustafson, G. Ingelman and T. Sjostrand, Parton Fragmentation and String Dynamics, Phys. Rept. 97, 31 (1983), 10.1016/0370-1573(83)90080-7.