ABSTRACT
Leptoquarks (LQ) are predicted by many new physics theories to describe the similarities between the lepton and quark sectors of the Standard Model and offer an attractive potential explanation for the lepton flavour anomalies observed at LHCb and flavour factories. The ATLAS experiment has a broad program of direct searches for Leptoquarks, coupling to the first-, second- or third-generation particles. The most recent 13 TeV results on the searches for Leptoquarks and contact interactions with the ATLAS detector are reviewed, covering flavour-diagonal and cross-generational final states.
Contribution to the
Phenomenology 2021 Symposium,
Pittsburgh, online, 24-26 May 2021
Searches for Leptoquarks with the ATLAS Detector
1 Introduction
Leptoquarks are receiving increasing interest with the observation of flavour anomalies [1]. The Leptoquarks are colour triplet bosons with fractional charge, and they decay flavour-diagonal and also possibly cross-generations. Their Yukawa interaction can be described with a coupling . There are three main production modes, pair-production, single-production and off-shell production, as illustrated in Figure 1. The pair-production has a large cross-section, while the single-production is sensitive for large masses and has a cross-section proportional to , and the off-shell production is sensitive to even larger masses with a cross-section proportional to .
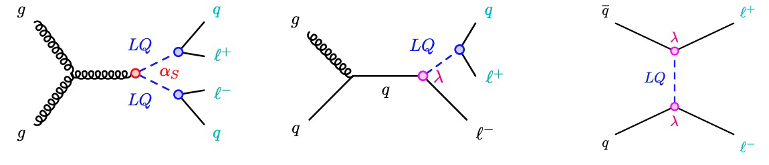
Table 1 lists the definition of the branching fraction for the LQ decays.
| LQ decay | ||
|---|---|---|
Motivated by observed B-anomalies, a dedicated search for bs in data recorded by the ATLAS detector [2] is given in Section 2. Third Generation LQs are of highest interest and they are addressed in Section 3 for a signature of b-jets (), missing transverse energy (MET) and a -lepton. Searches for pair-production of third-generation down-type Leptoquarks in +MET events are discussed in Section 4. Searches for +MET with all-hadronic final states are addressed in Section 5. A summary of ATLAS results is given in Section 6 for up-type third-generation (), down-type third-generation (), up-type mixed-generation (), and down-type mixed-generation () models, together with a review of previous ATLAS Leptoquark results.
2 Search of bs
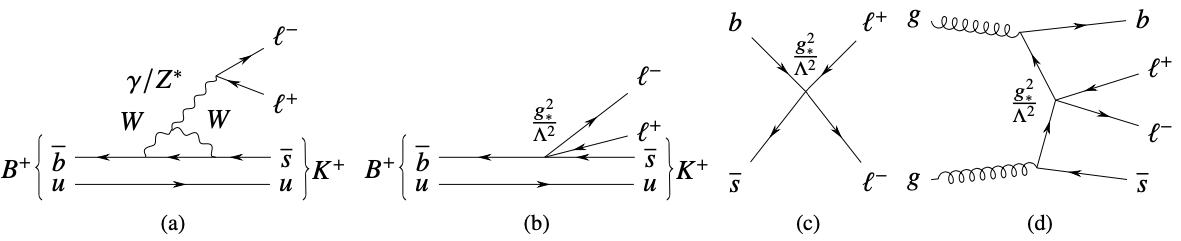
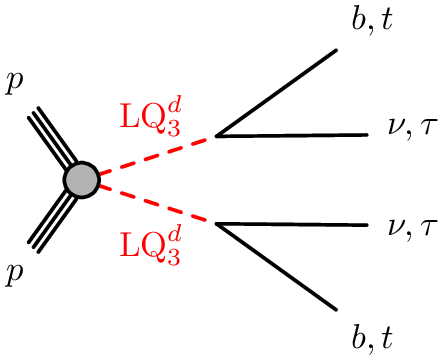
The ATLAS collaboration performed a dedicated search for the bs process [3], motivated by the LHCb measurement [1], as illustrated in Figure 2 [3]. The model is characterized by the energy scale and coupling, and .
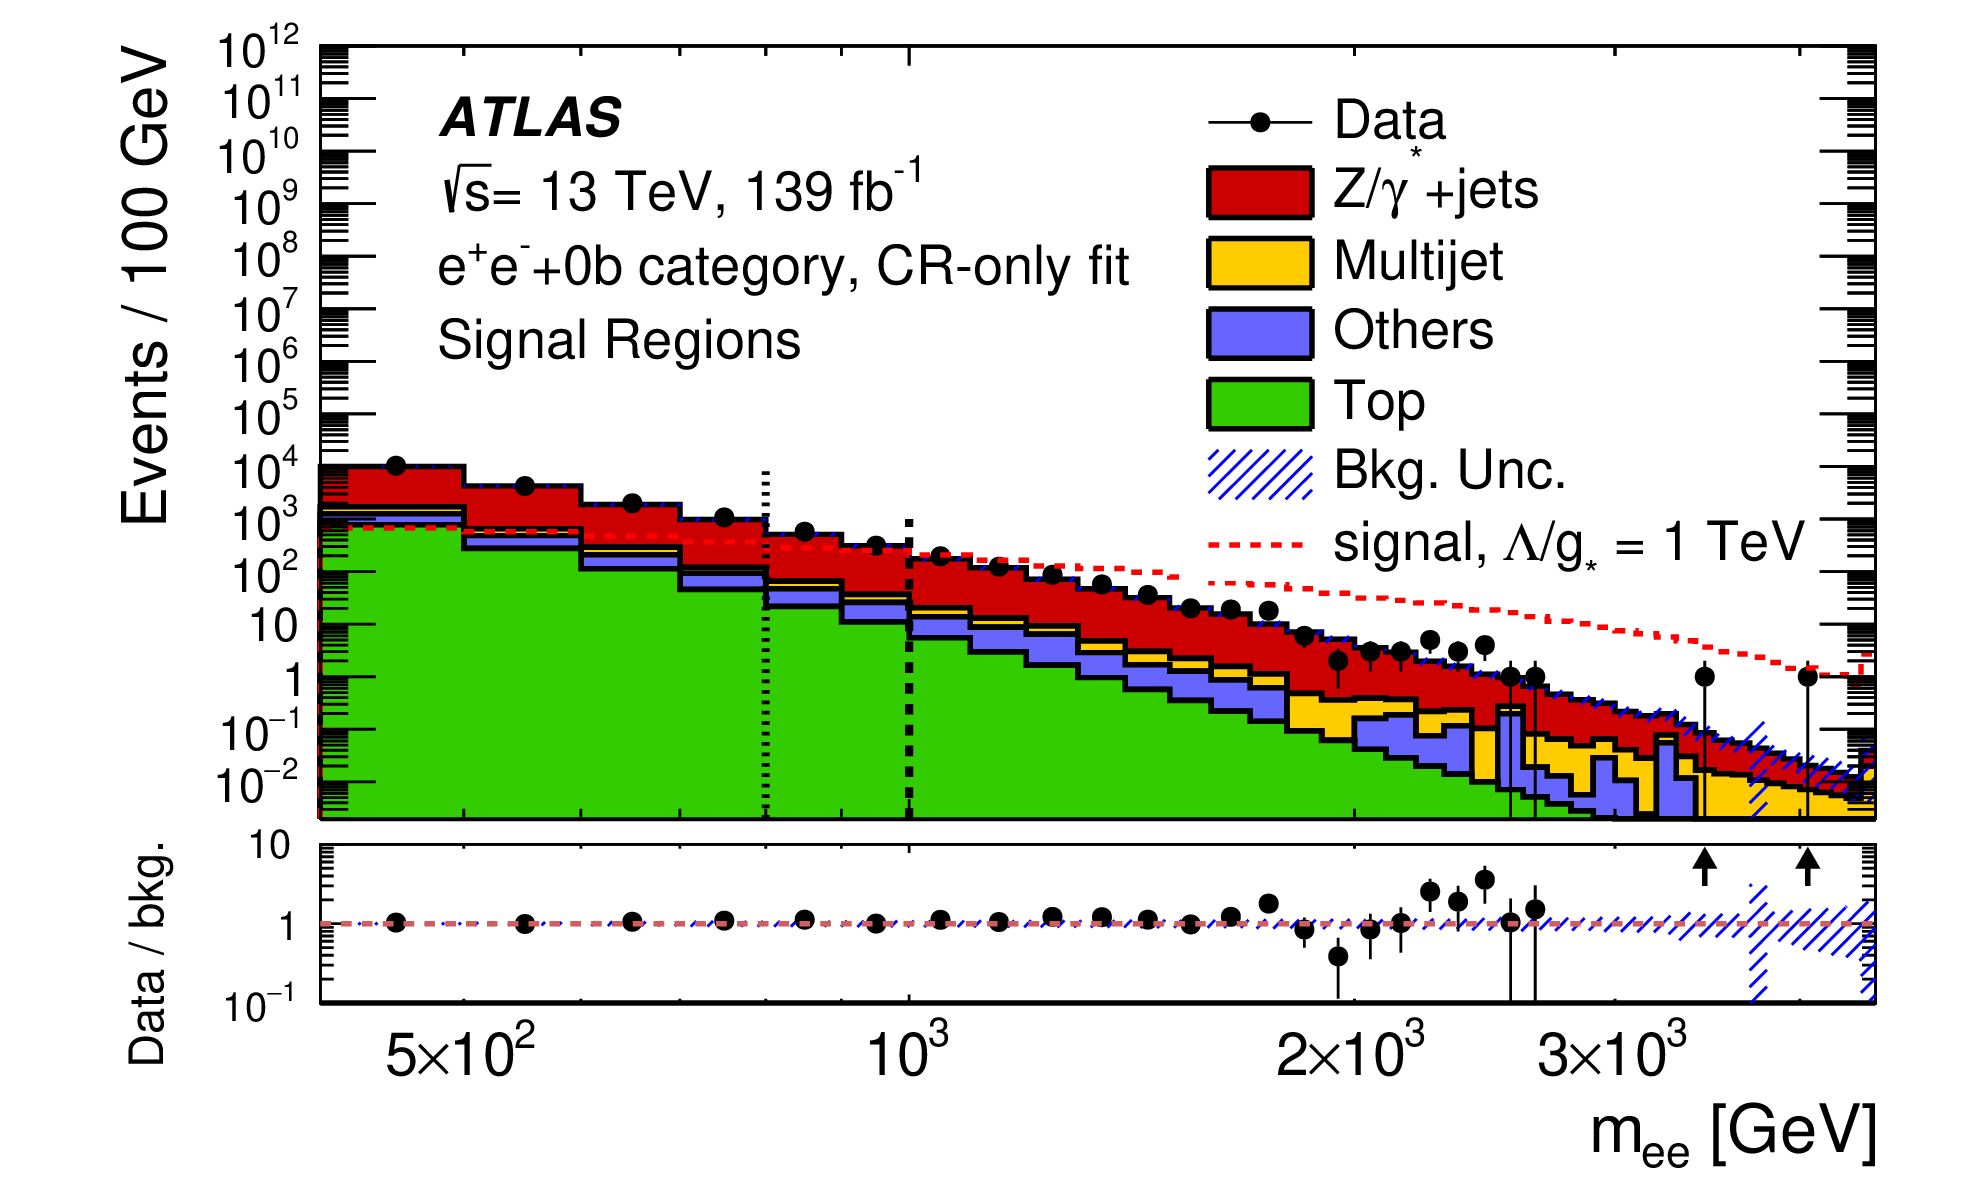
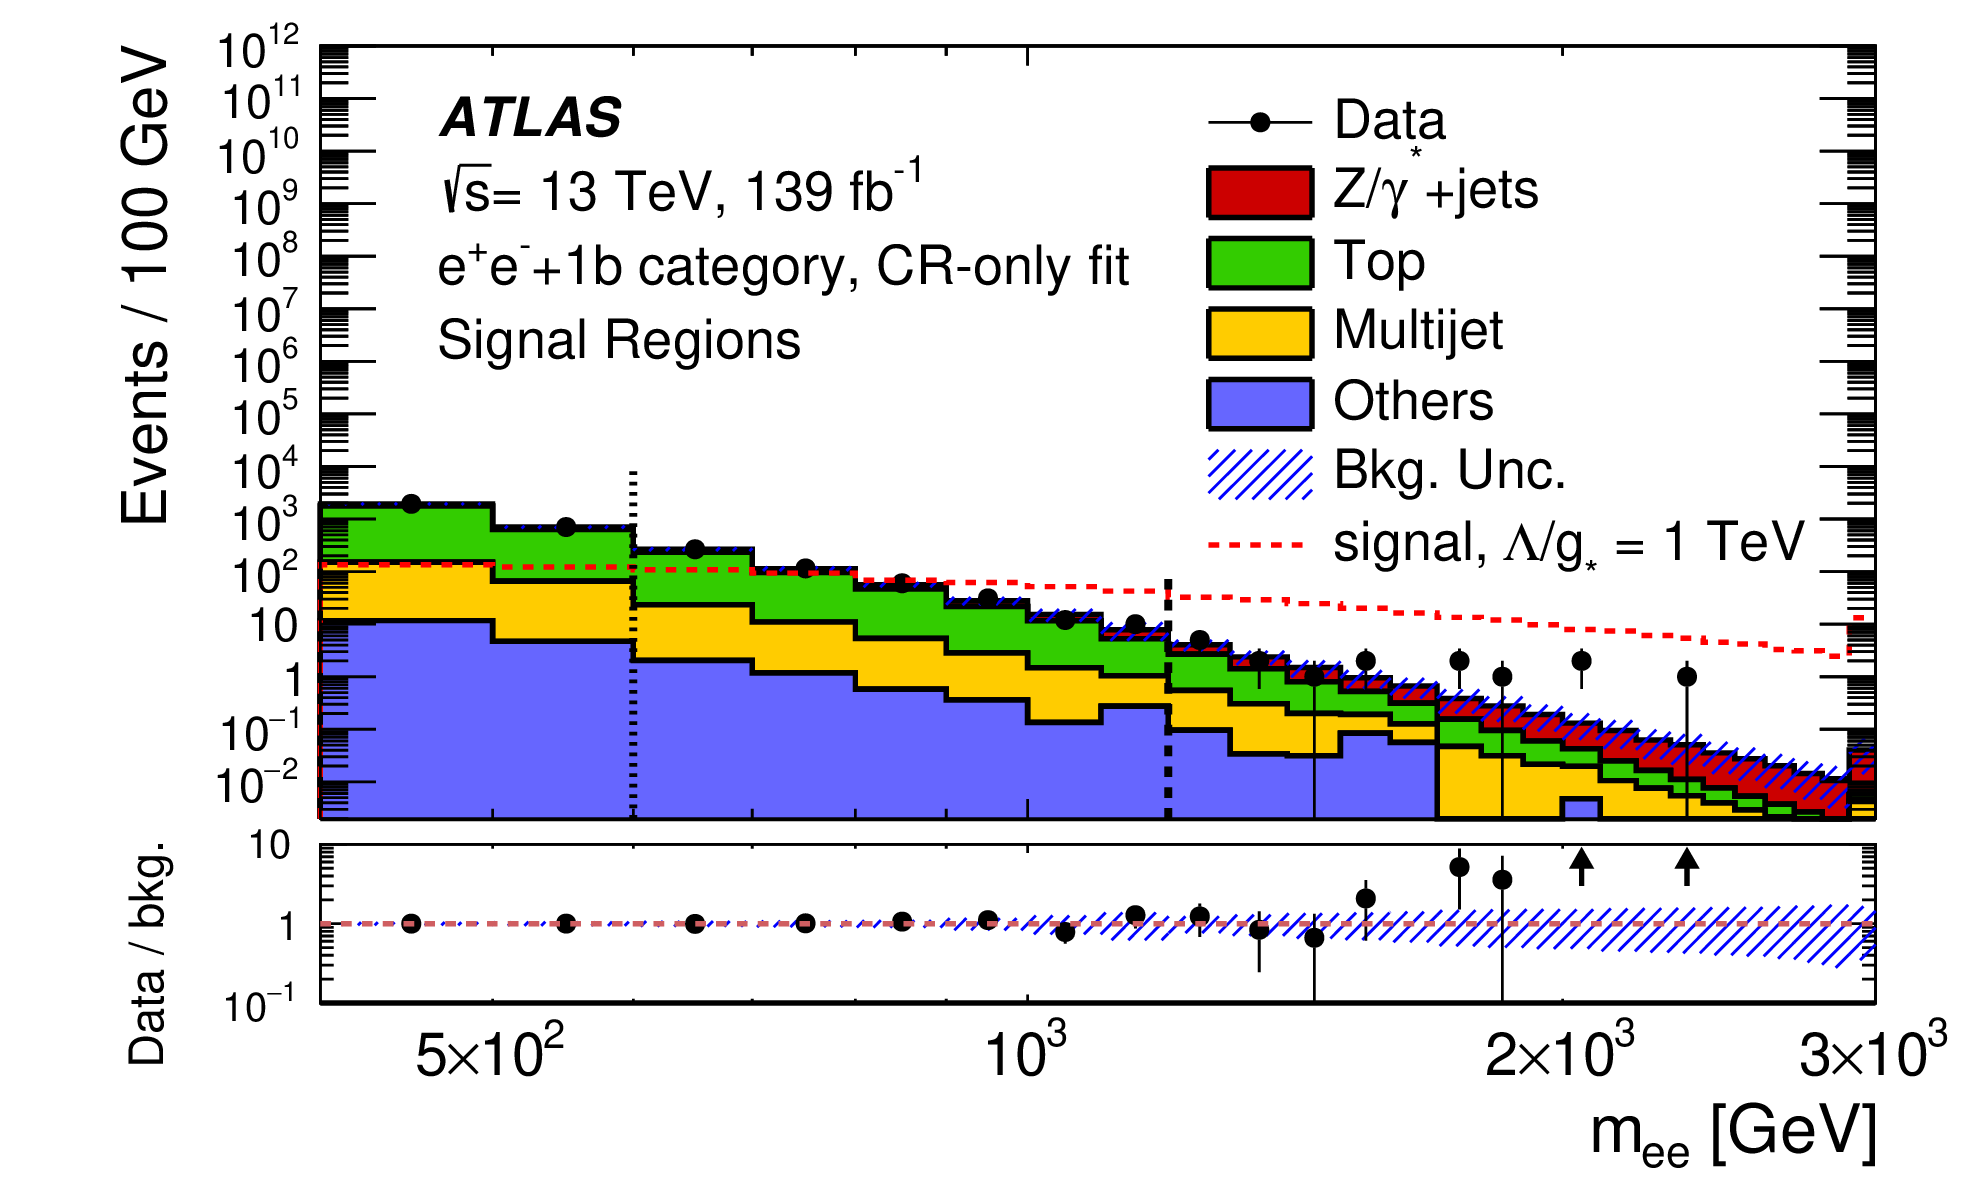
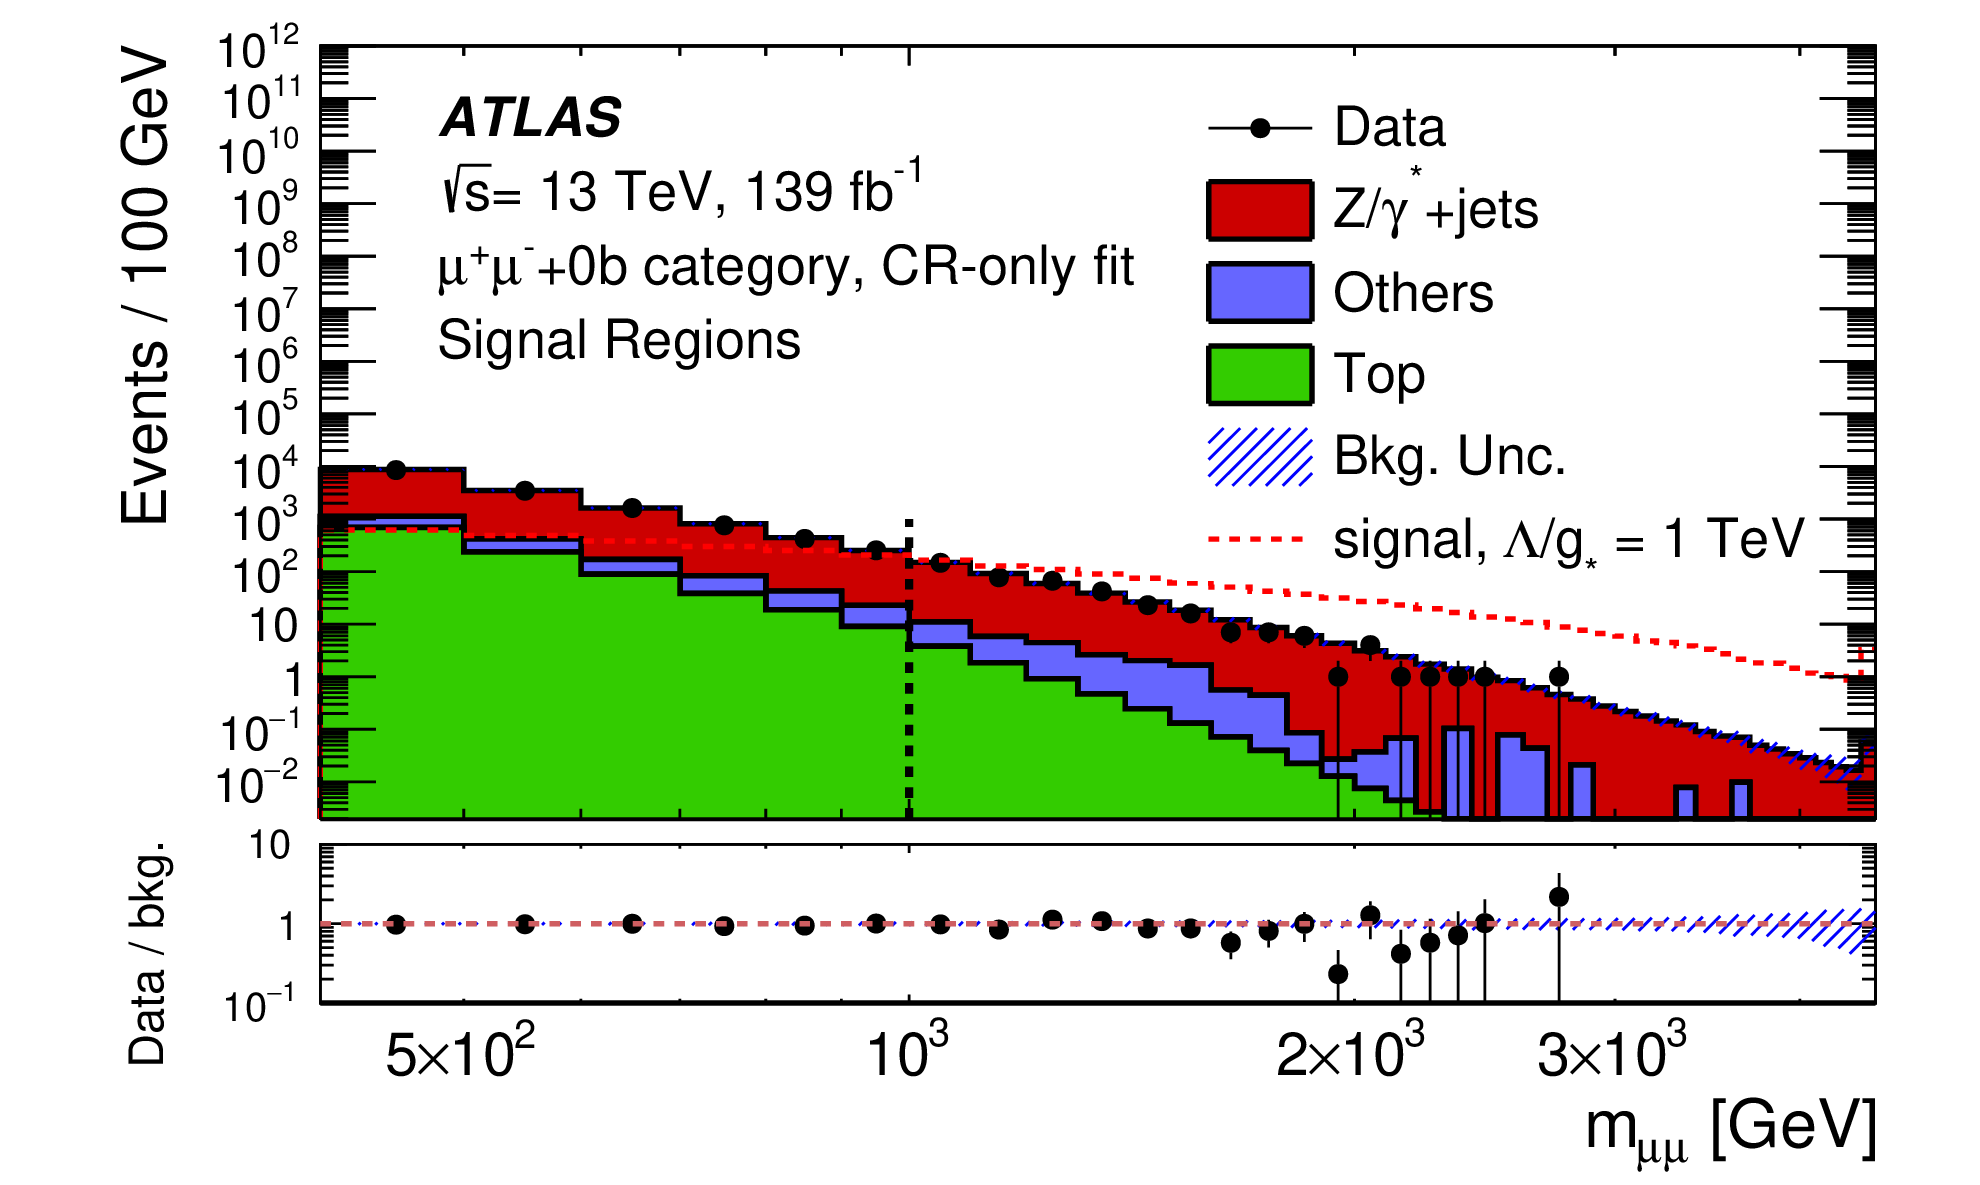
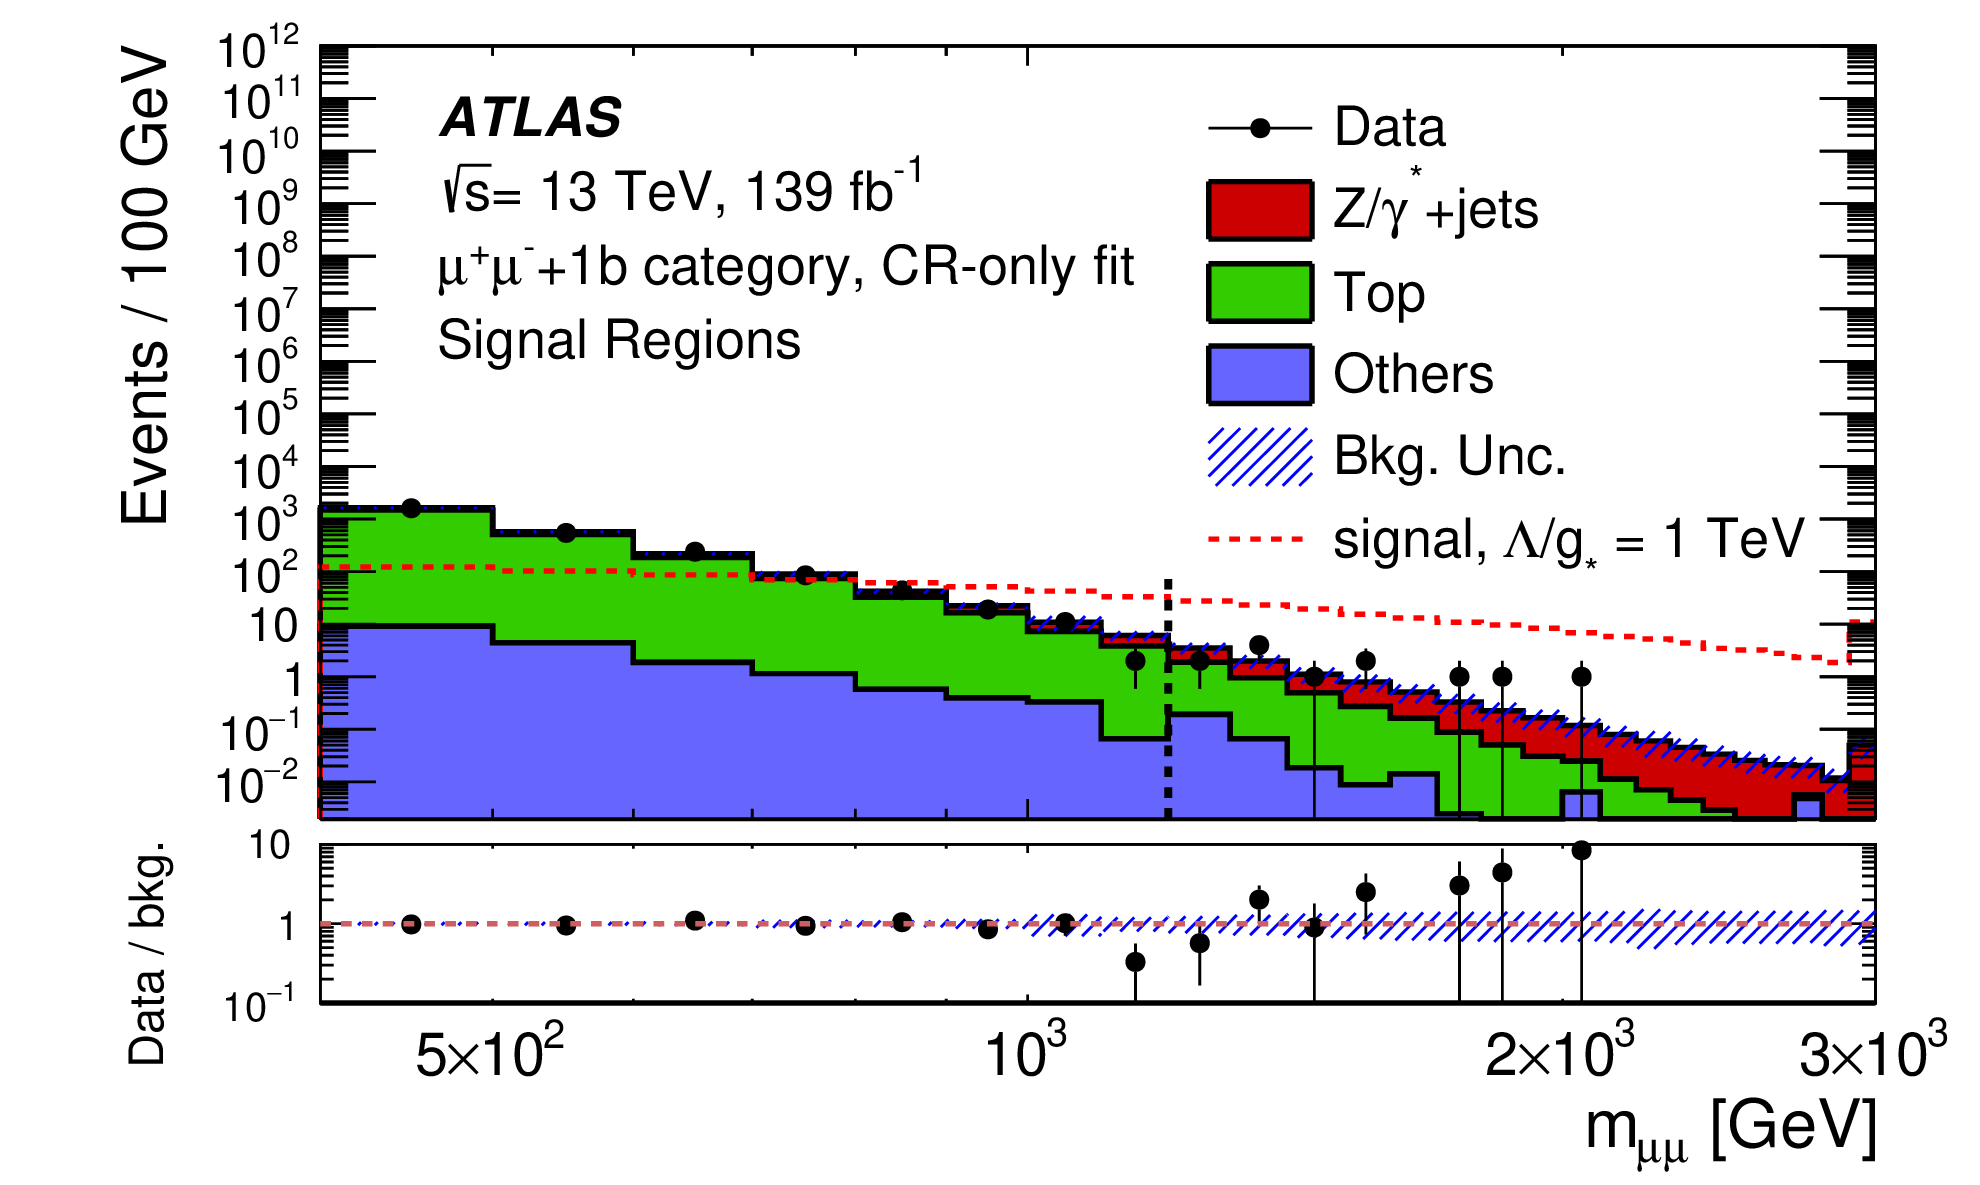
The good agreement between data and Standard Model (SM) background is shown in Figure 3 [3] for the selection with ee0b, ee1b, 0b, 1b. There is no indication in the data for a Leptoquark signal.
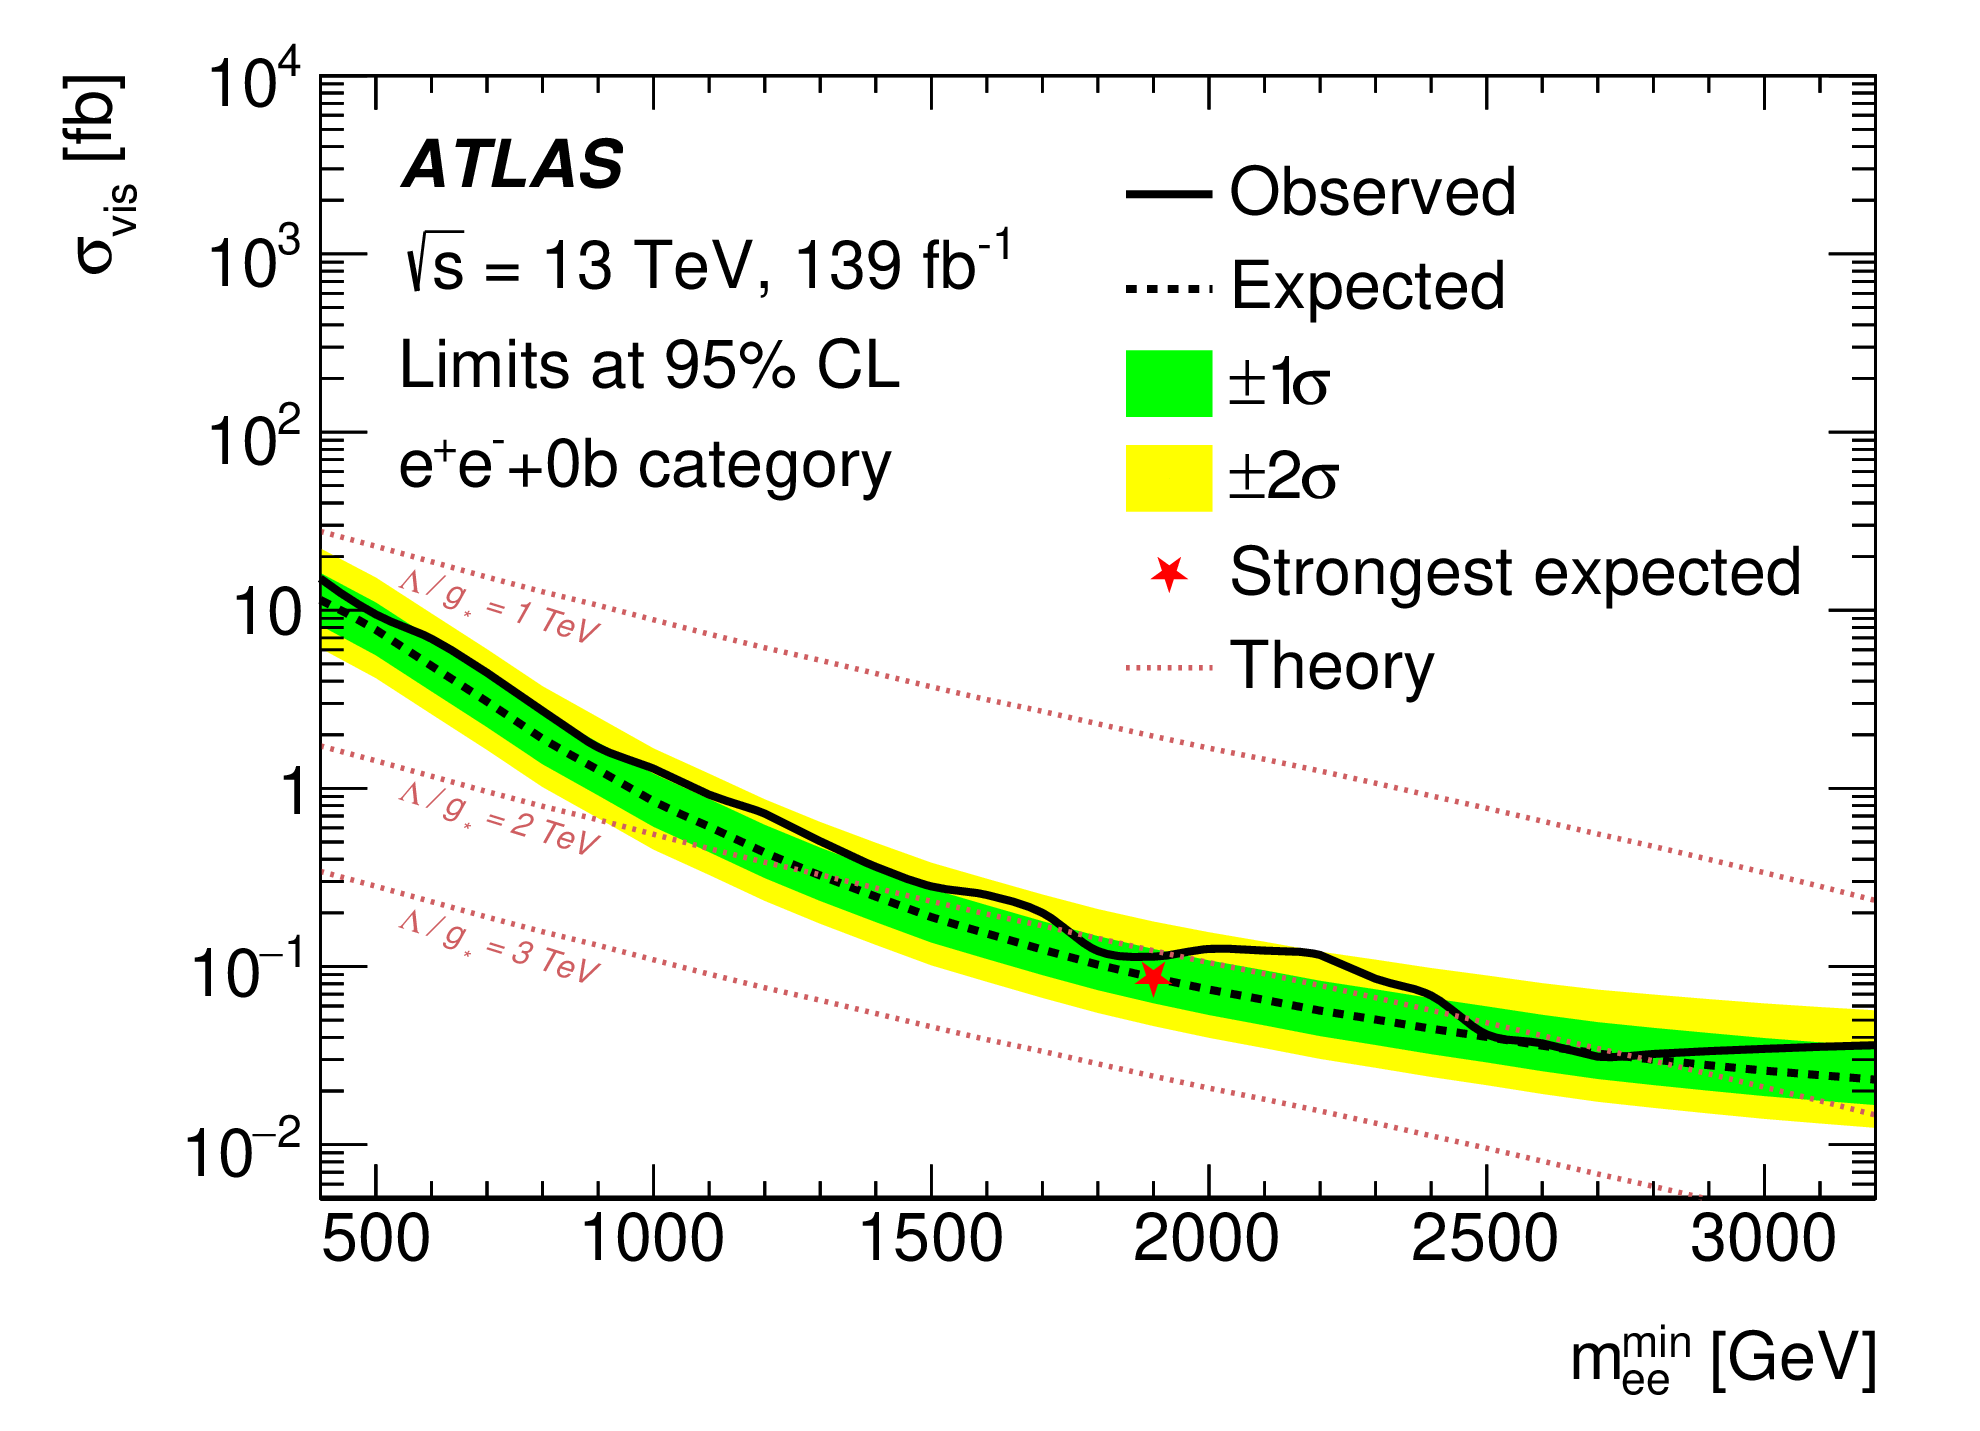
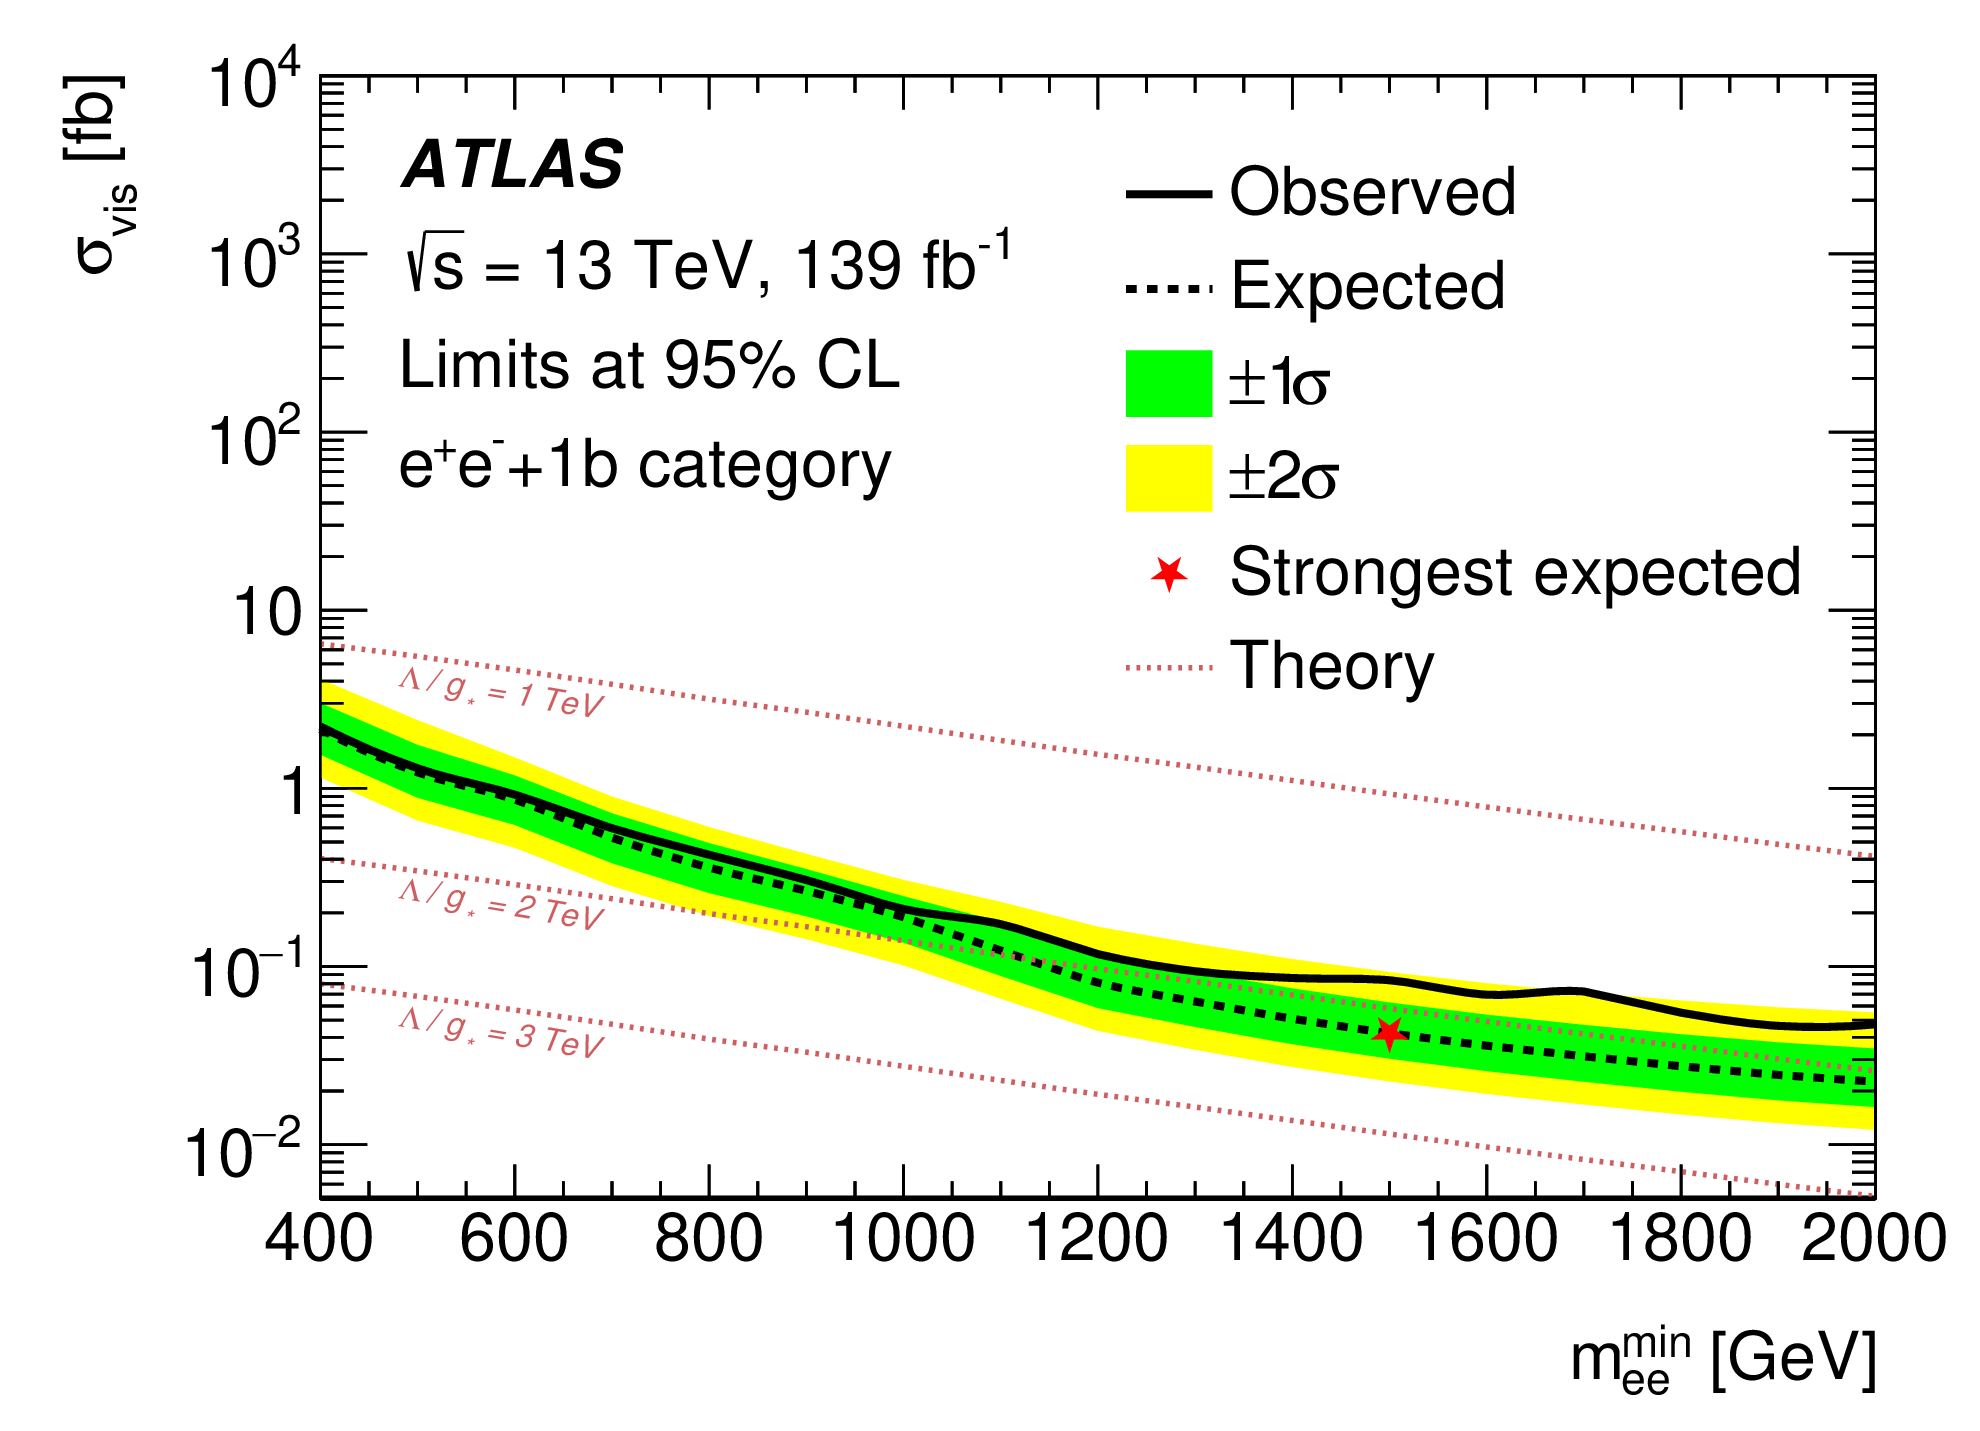
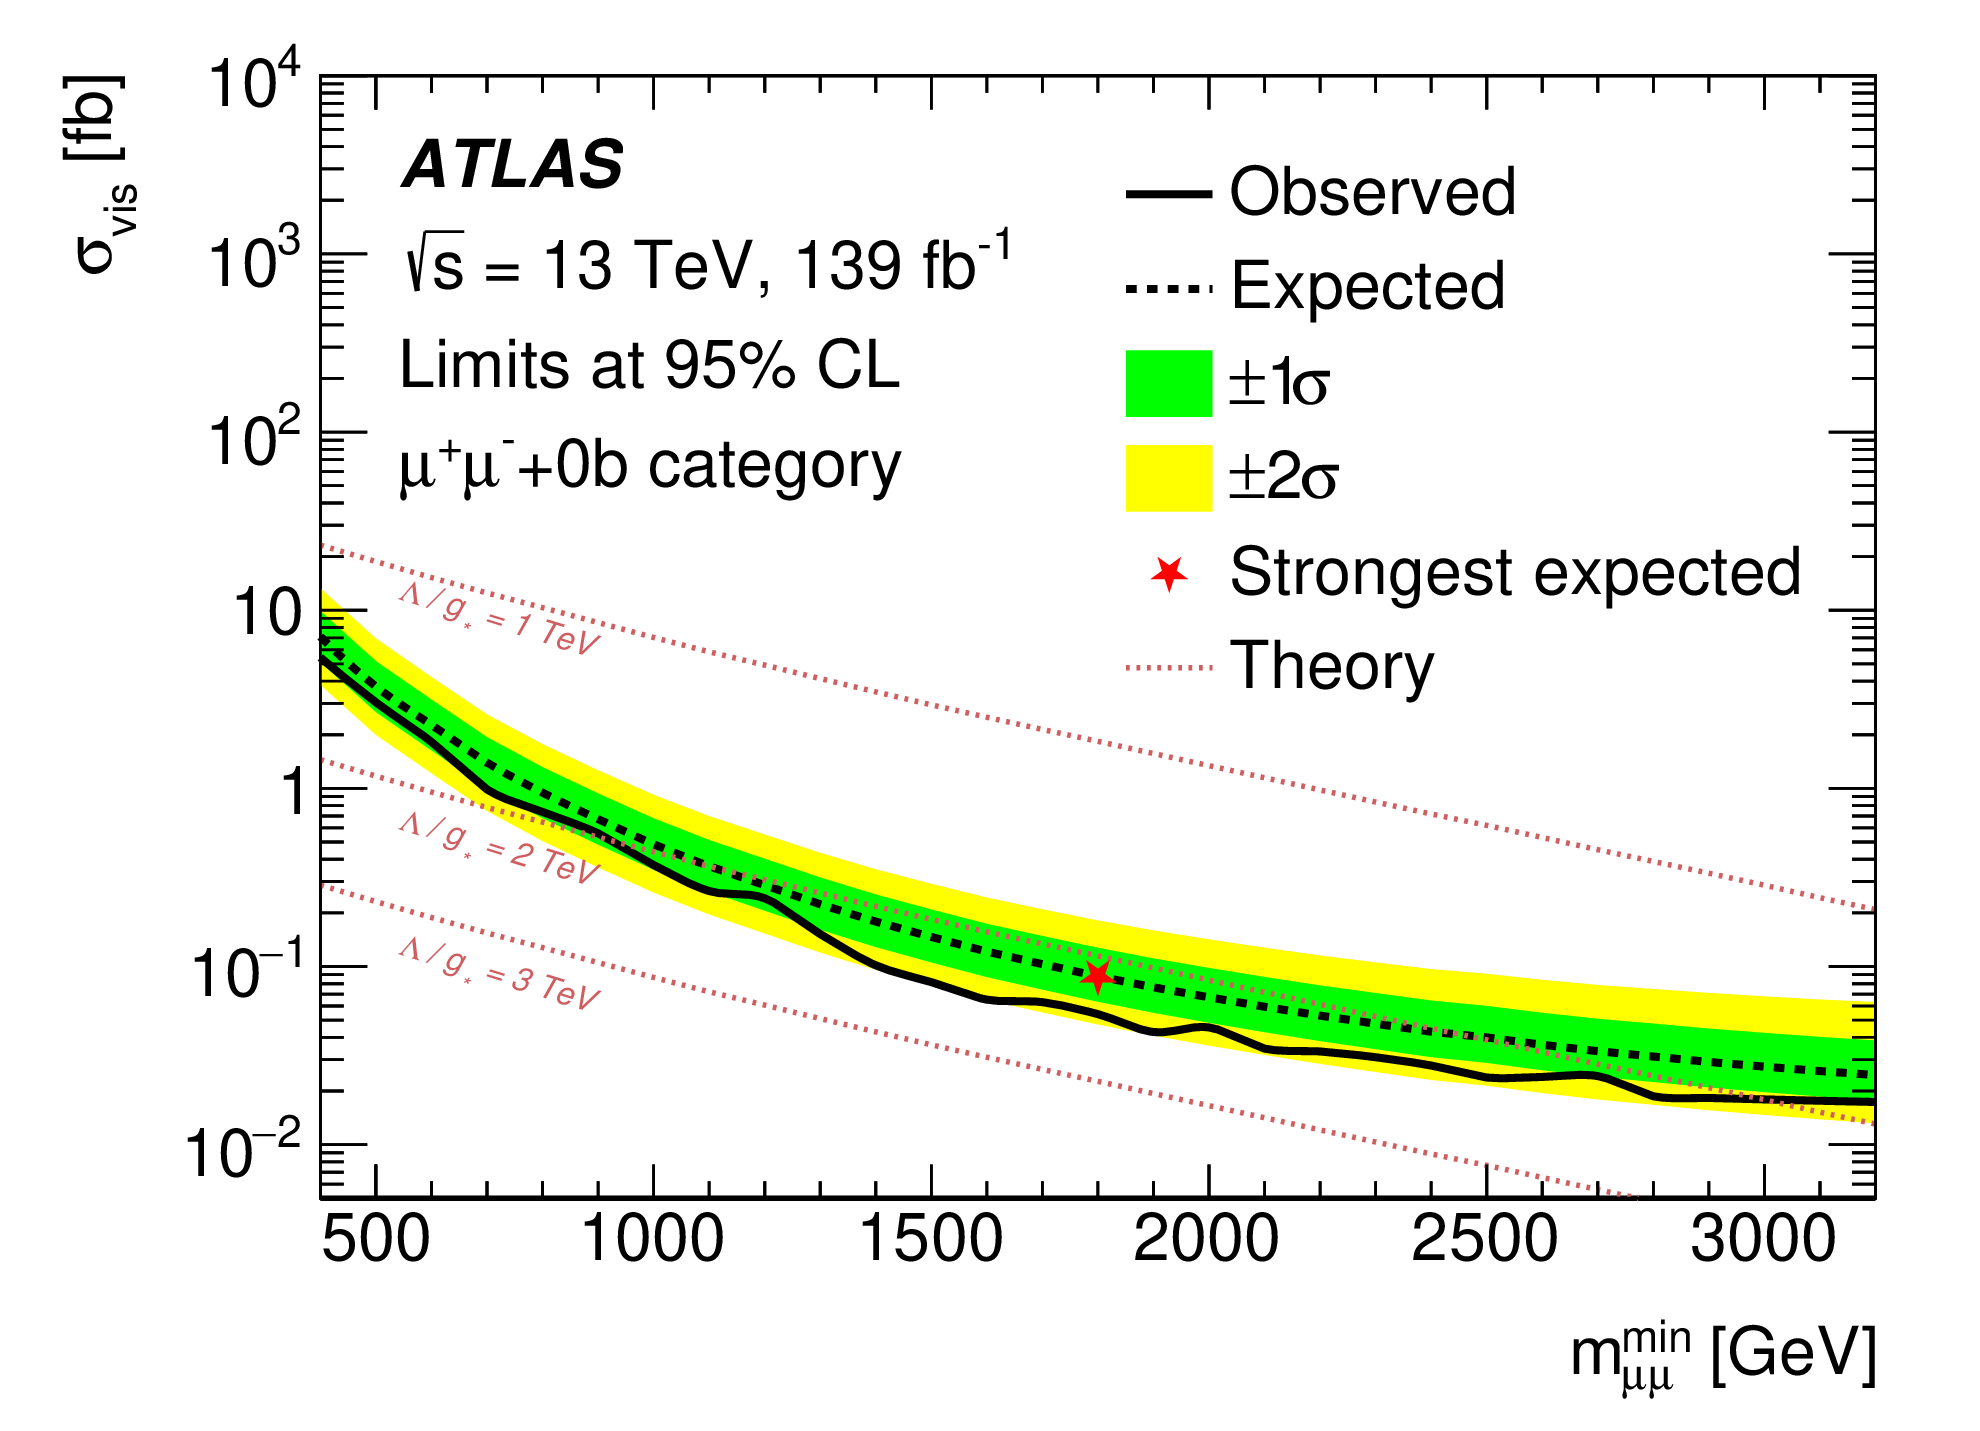
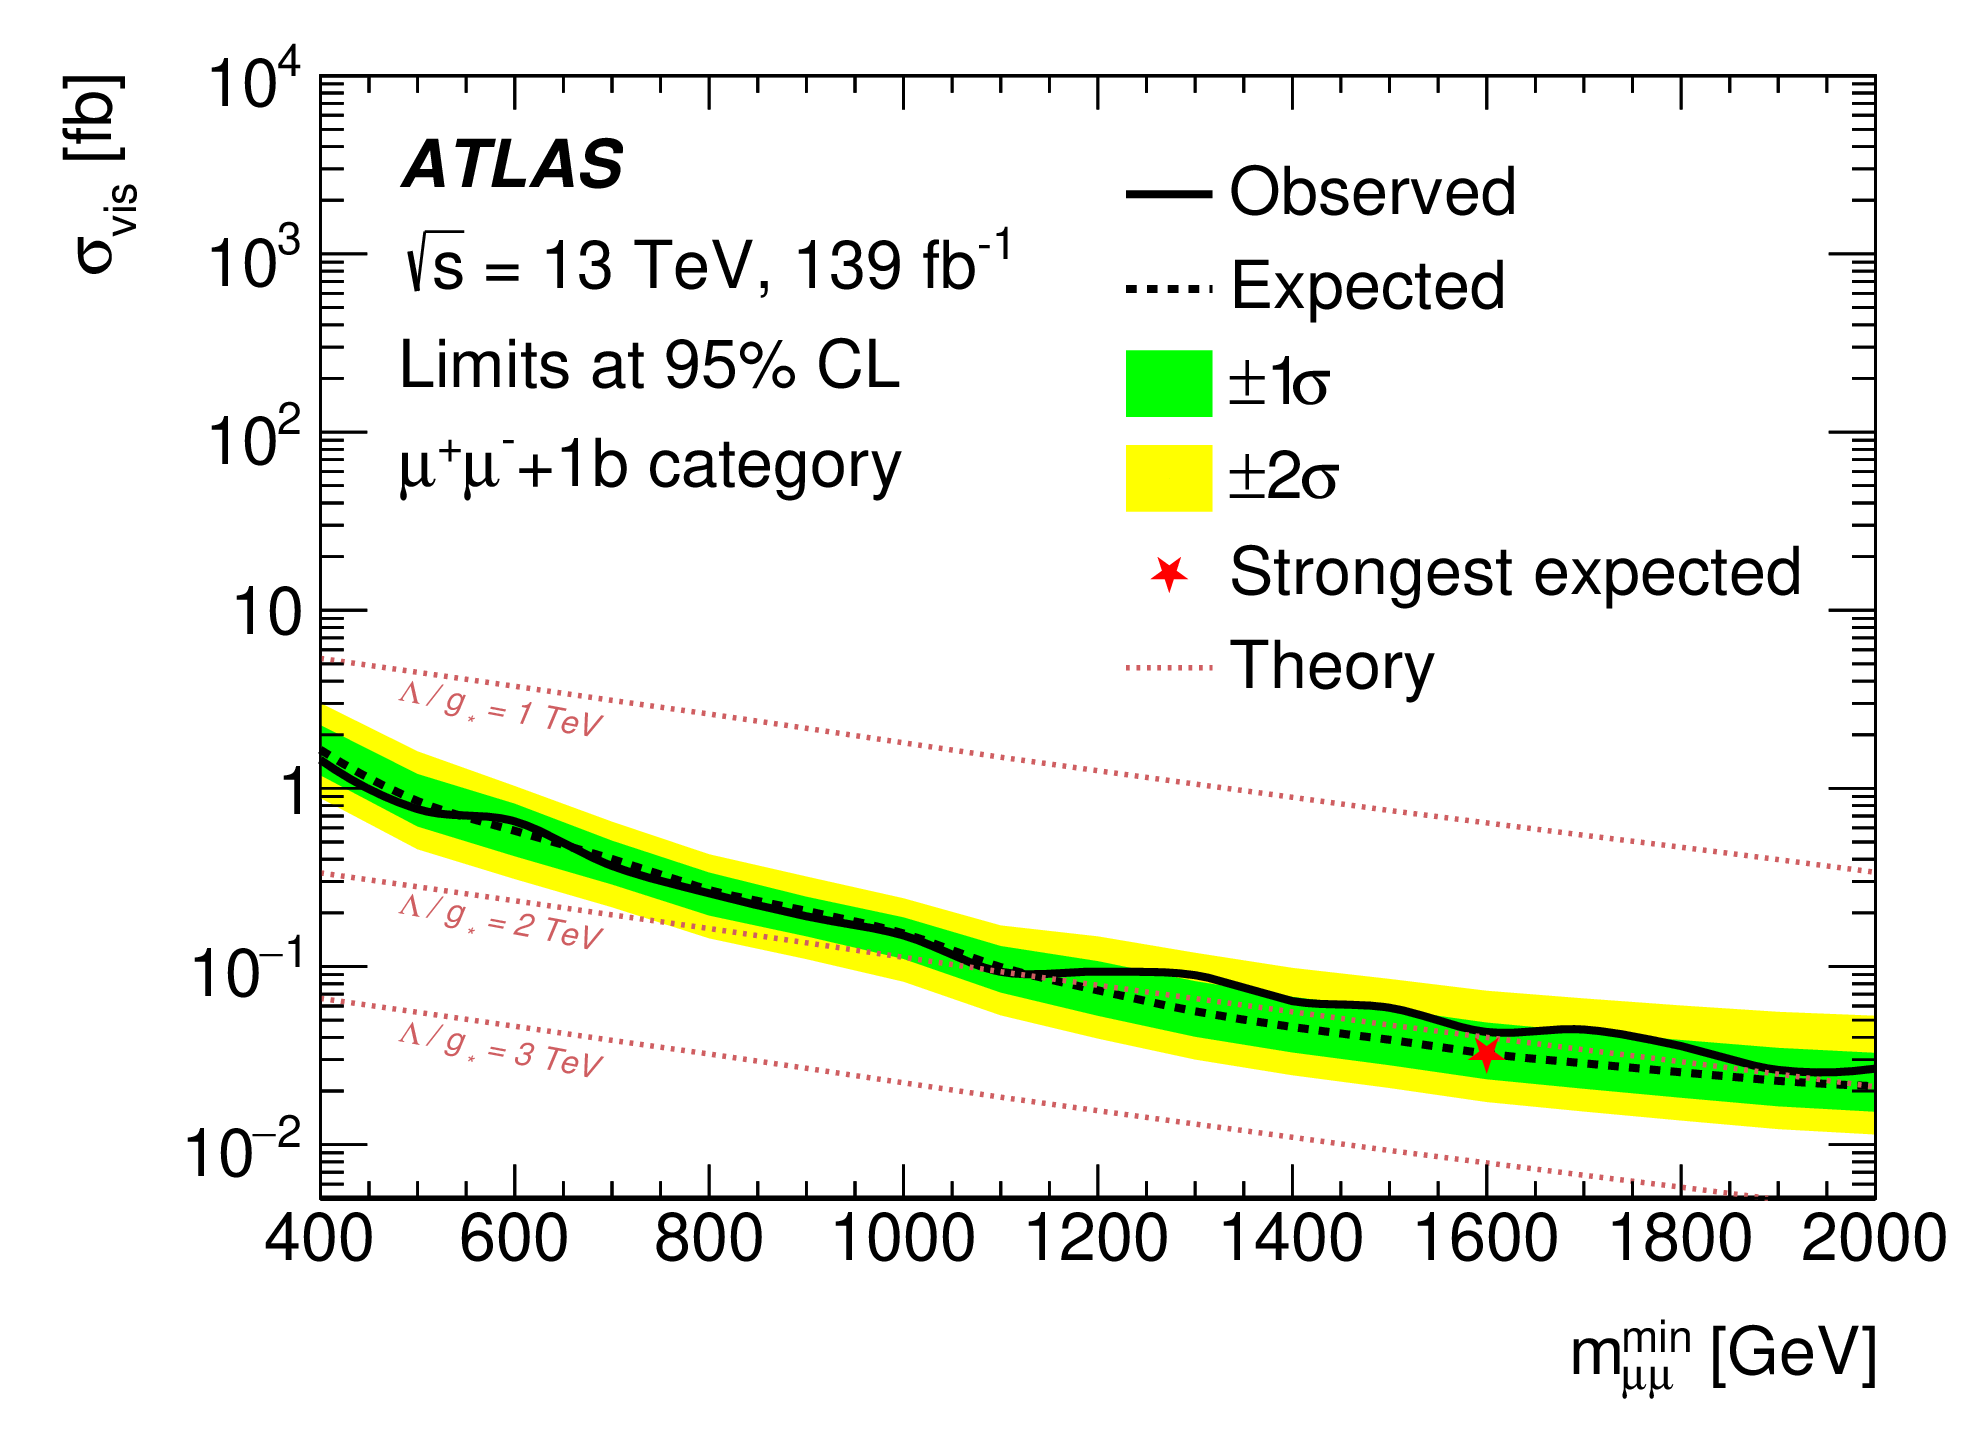
The resulting cross-section limits at 95% Confidence Level (CL) are given in Figure 4 [3]. A set of signal regions (SRs) is defined with lower bounds on , , ranging from 400 GeV to 3200 (2000) GeV for the b-veto (b-tag) category. Table 2 [3] lists the sources of the relative systematic uncertainties for signal regions with GeV.
![[Uncaptioned image]](/html/2107.10094/assets/Pheno21leptoquarks/plots/bsll/tab_01.png)
Contact interactions with TeV are excluded for ee() at 95% CL, still far from the value which is favoured by the B-meson decay anomalies. Model-independent limits are set as a function of the di-lepton invariant mass for the reinterpretation of the results in terms of other signal scenarios.
3 Search for pair-production of third-generation Leptoquarks in +MET events with taus
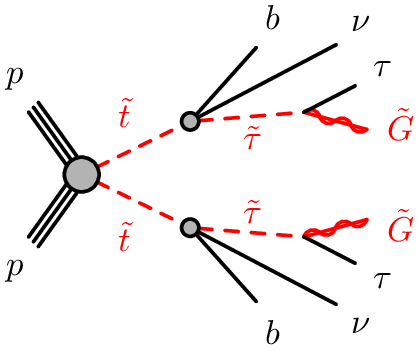
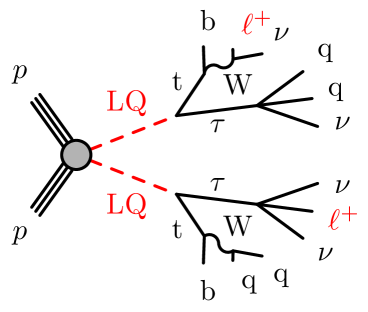
Searches for Supersymmetry with scalar top (stop) have sensitivity for Leptoquark pair-production. In particular the events with b-quarks and missing energy (+MET) together with hadronically decaying tau-leptons are selected to search for the pair-production of third-generation Leptoquarks [4]. Figure 5 [4] shows the Feynman diagrams for scalar-top and Leptoquark production with a signature of b-quarks, missing energy and a tau-lepton. The signatures are

The search strategy is divided in a di-tau and single-tau preselection as detailed in Table 3 [4]. The further selections are given in Tables 4 [4] and 5 [4] for the di-tau and single-tau preselection, respectively.
![[Uncaptioned image]](/html/2107.10094/assets/Pheno21leptoquarks/plots/bbMETtau/tab_02.png)
![[Uncaptioned image]](/html/2107.10094/assets/Pheno21leptoquarks/plots/bbMETtau/tab_03.png)
![[Uncaptioned image]](/html/2107.10094/assets/Pheno21leptoquarks/plots/bbMETtau/tab_04.png)
For the single-tau analysis, an example of the data and simulation agreement is shown in Figure 6 [4] for a control and a signal region.
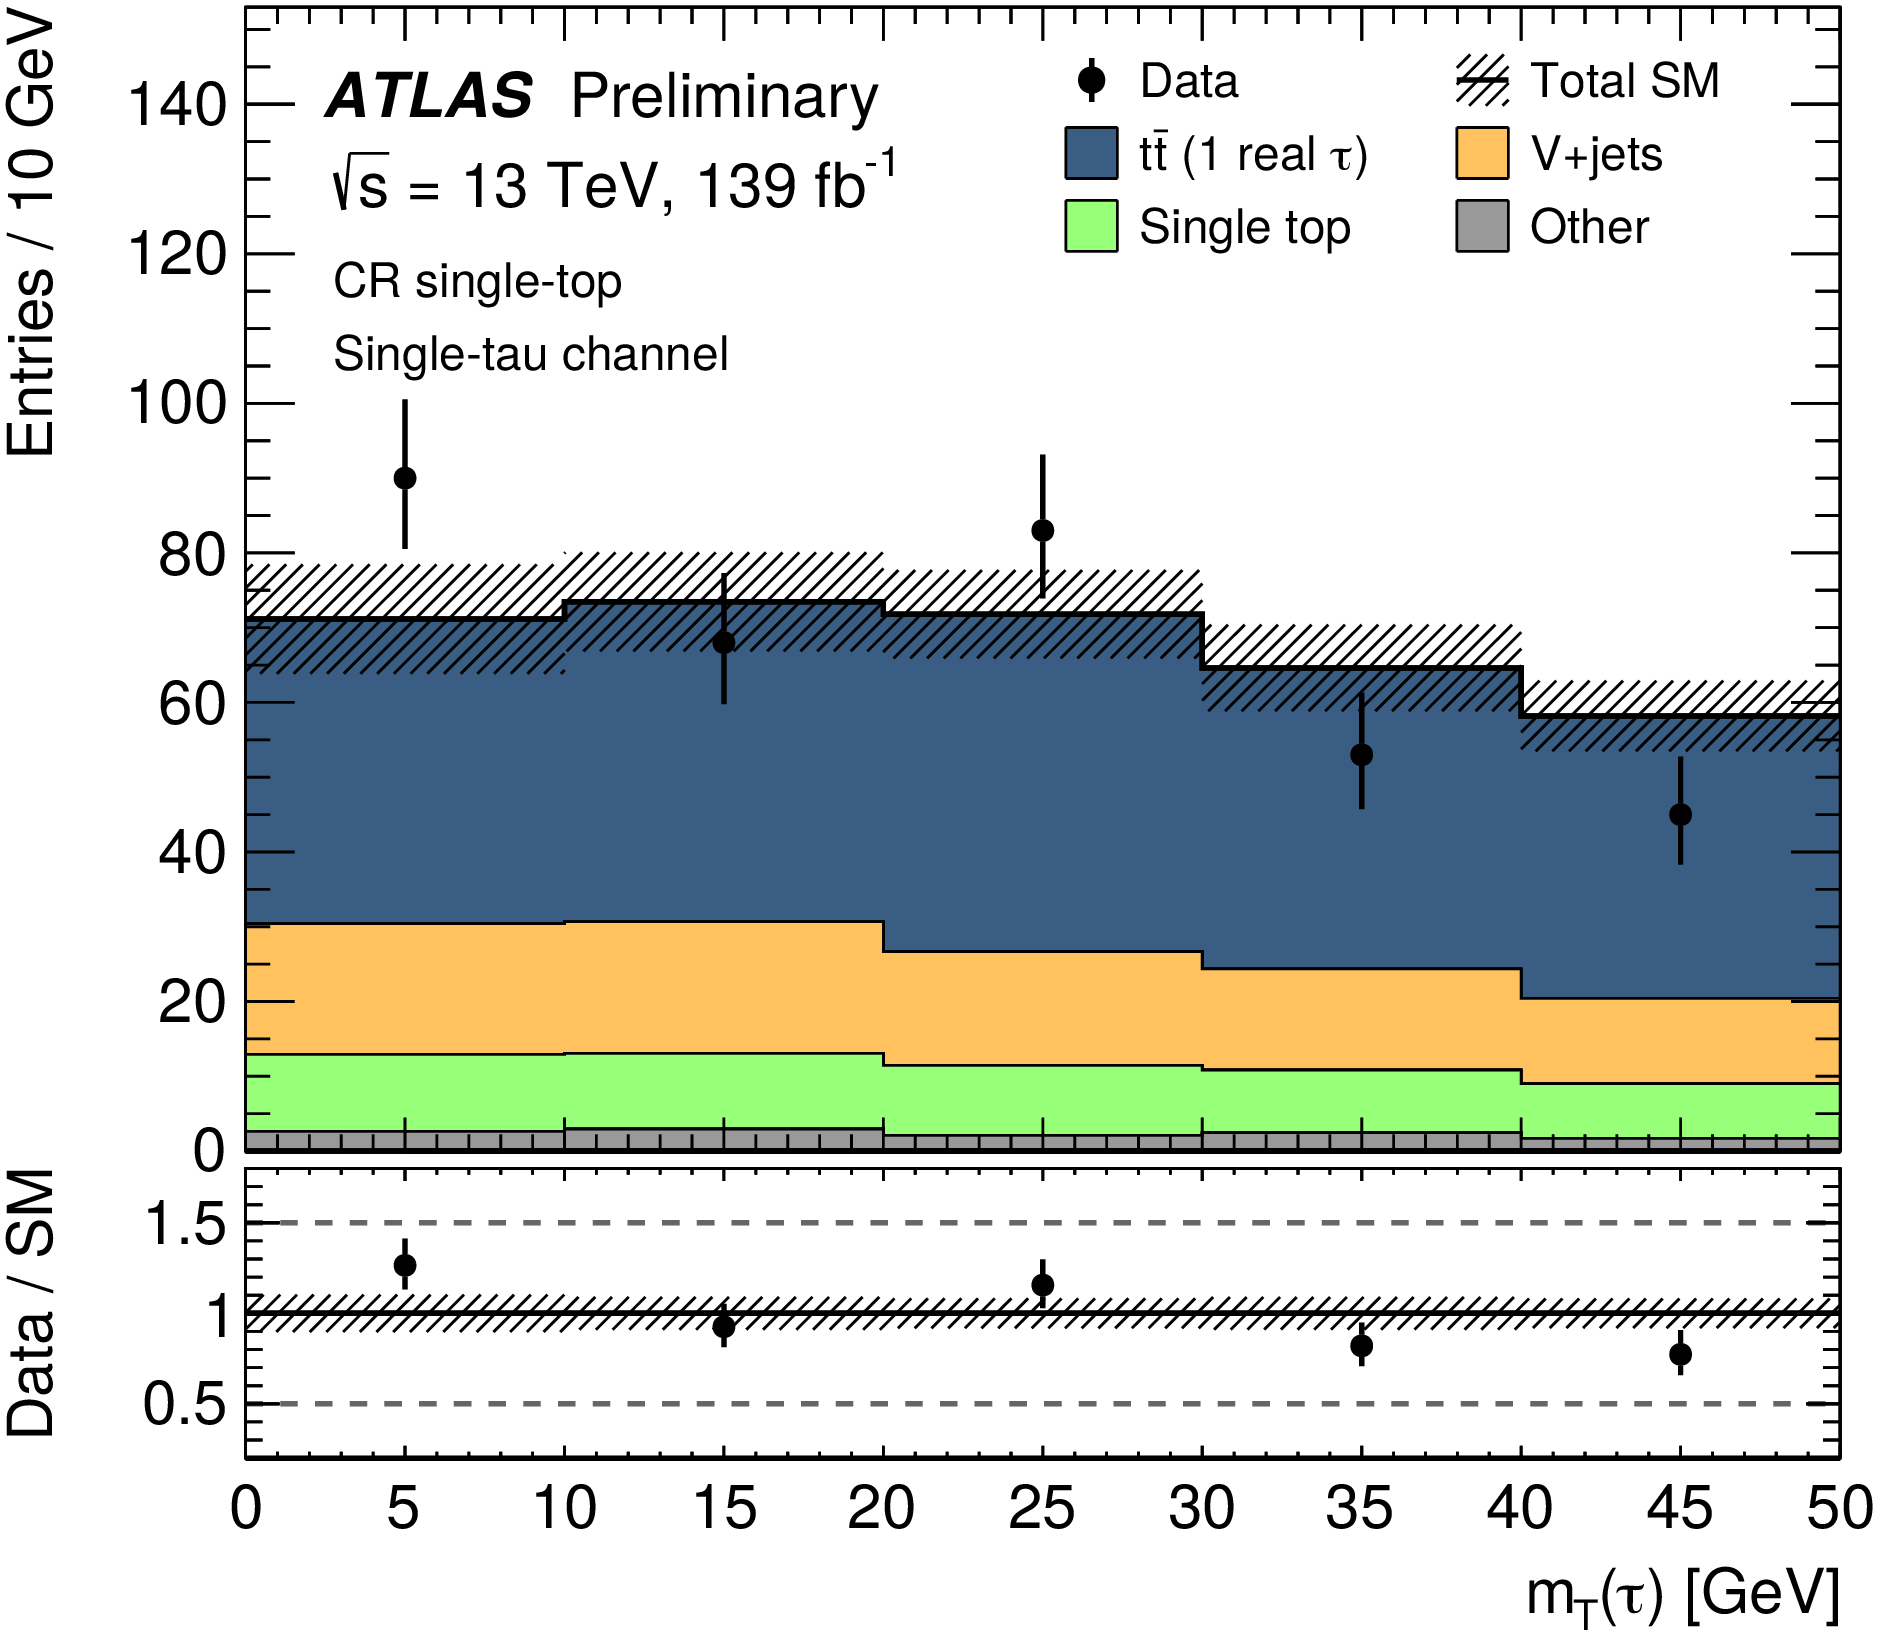
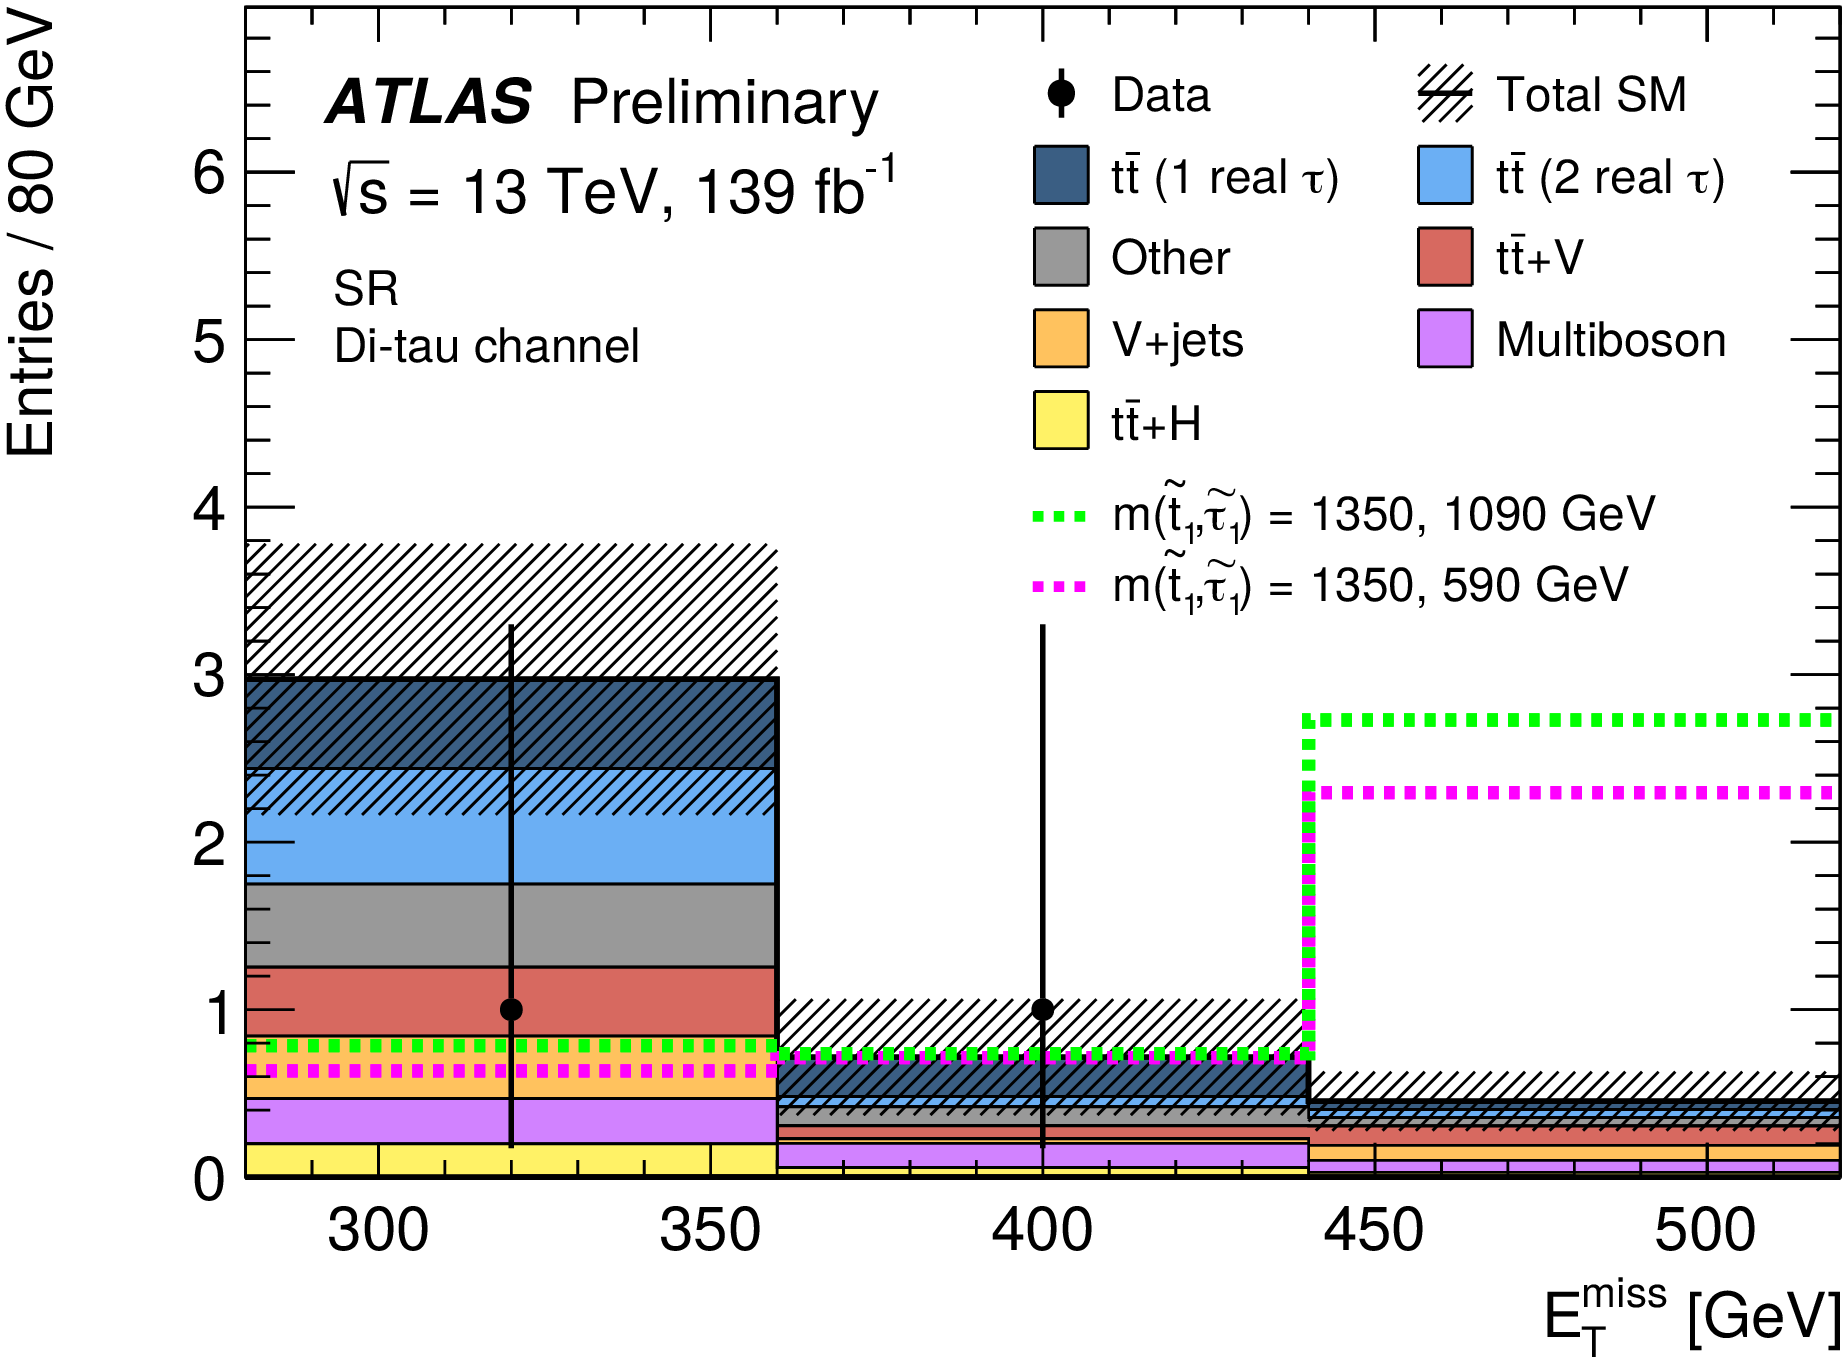
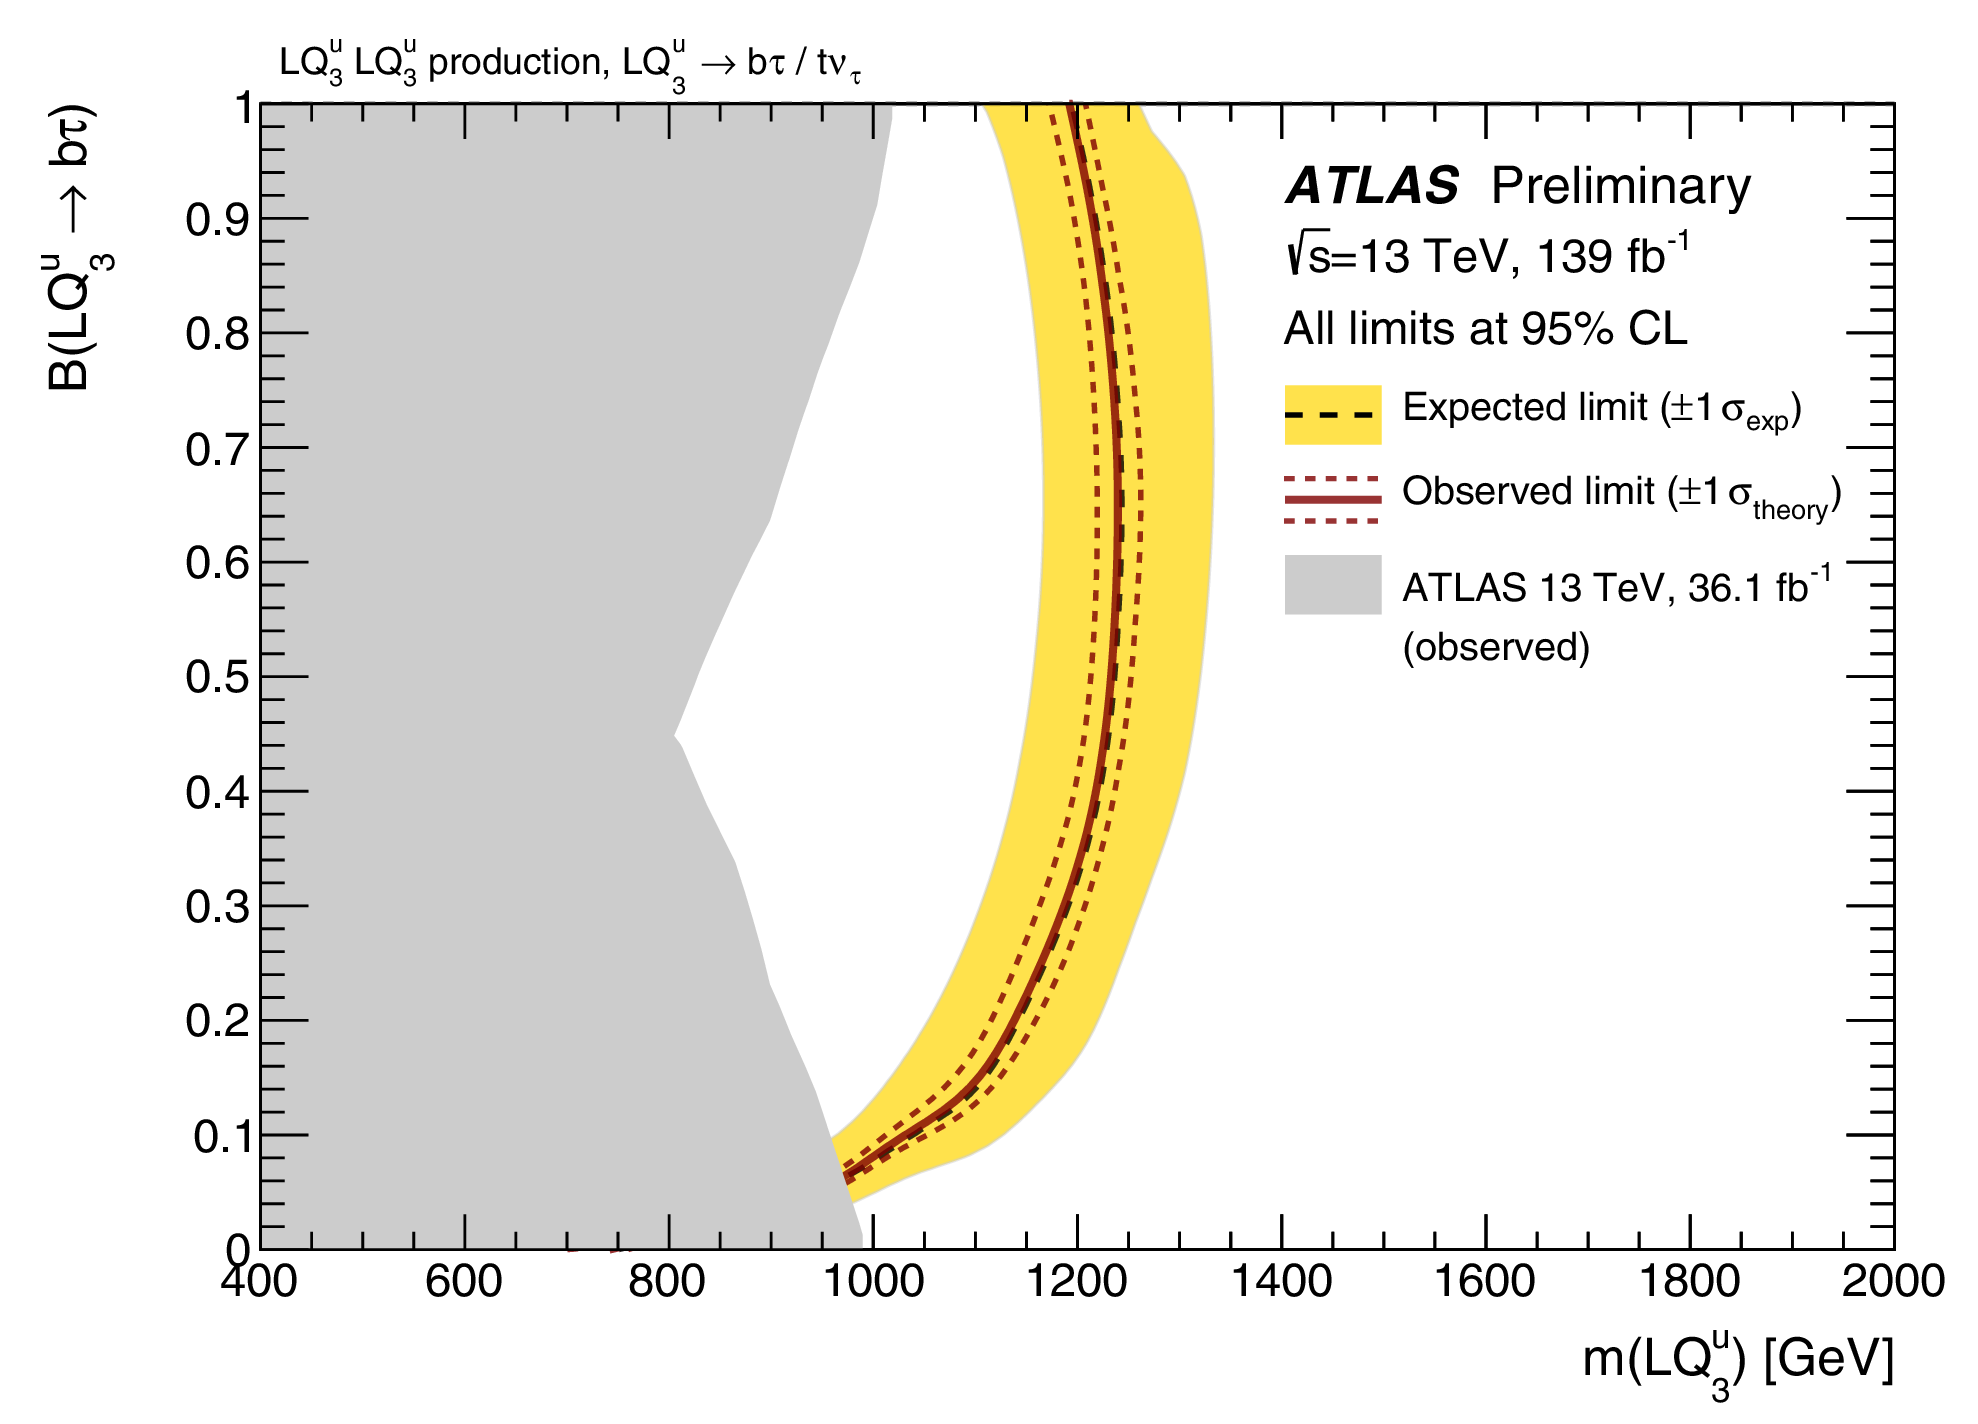
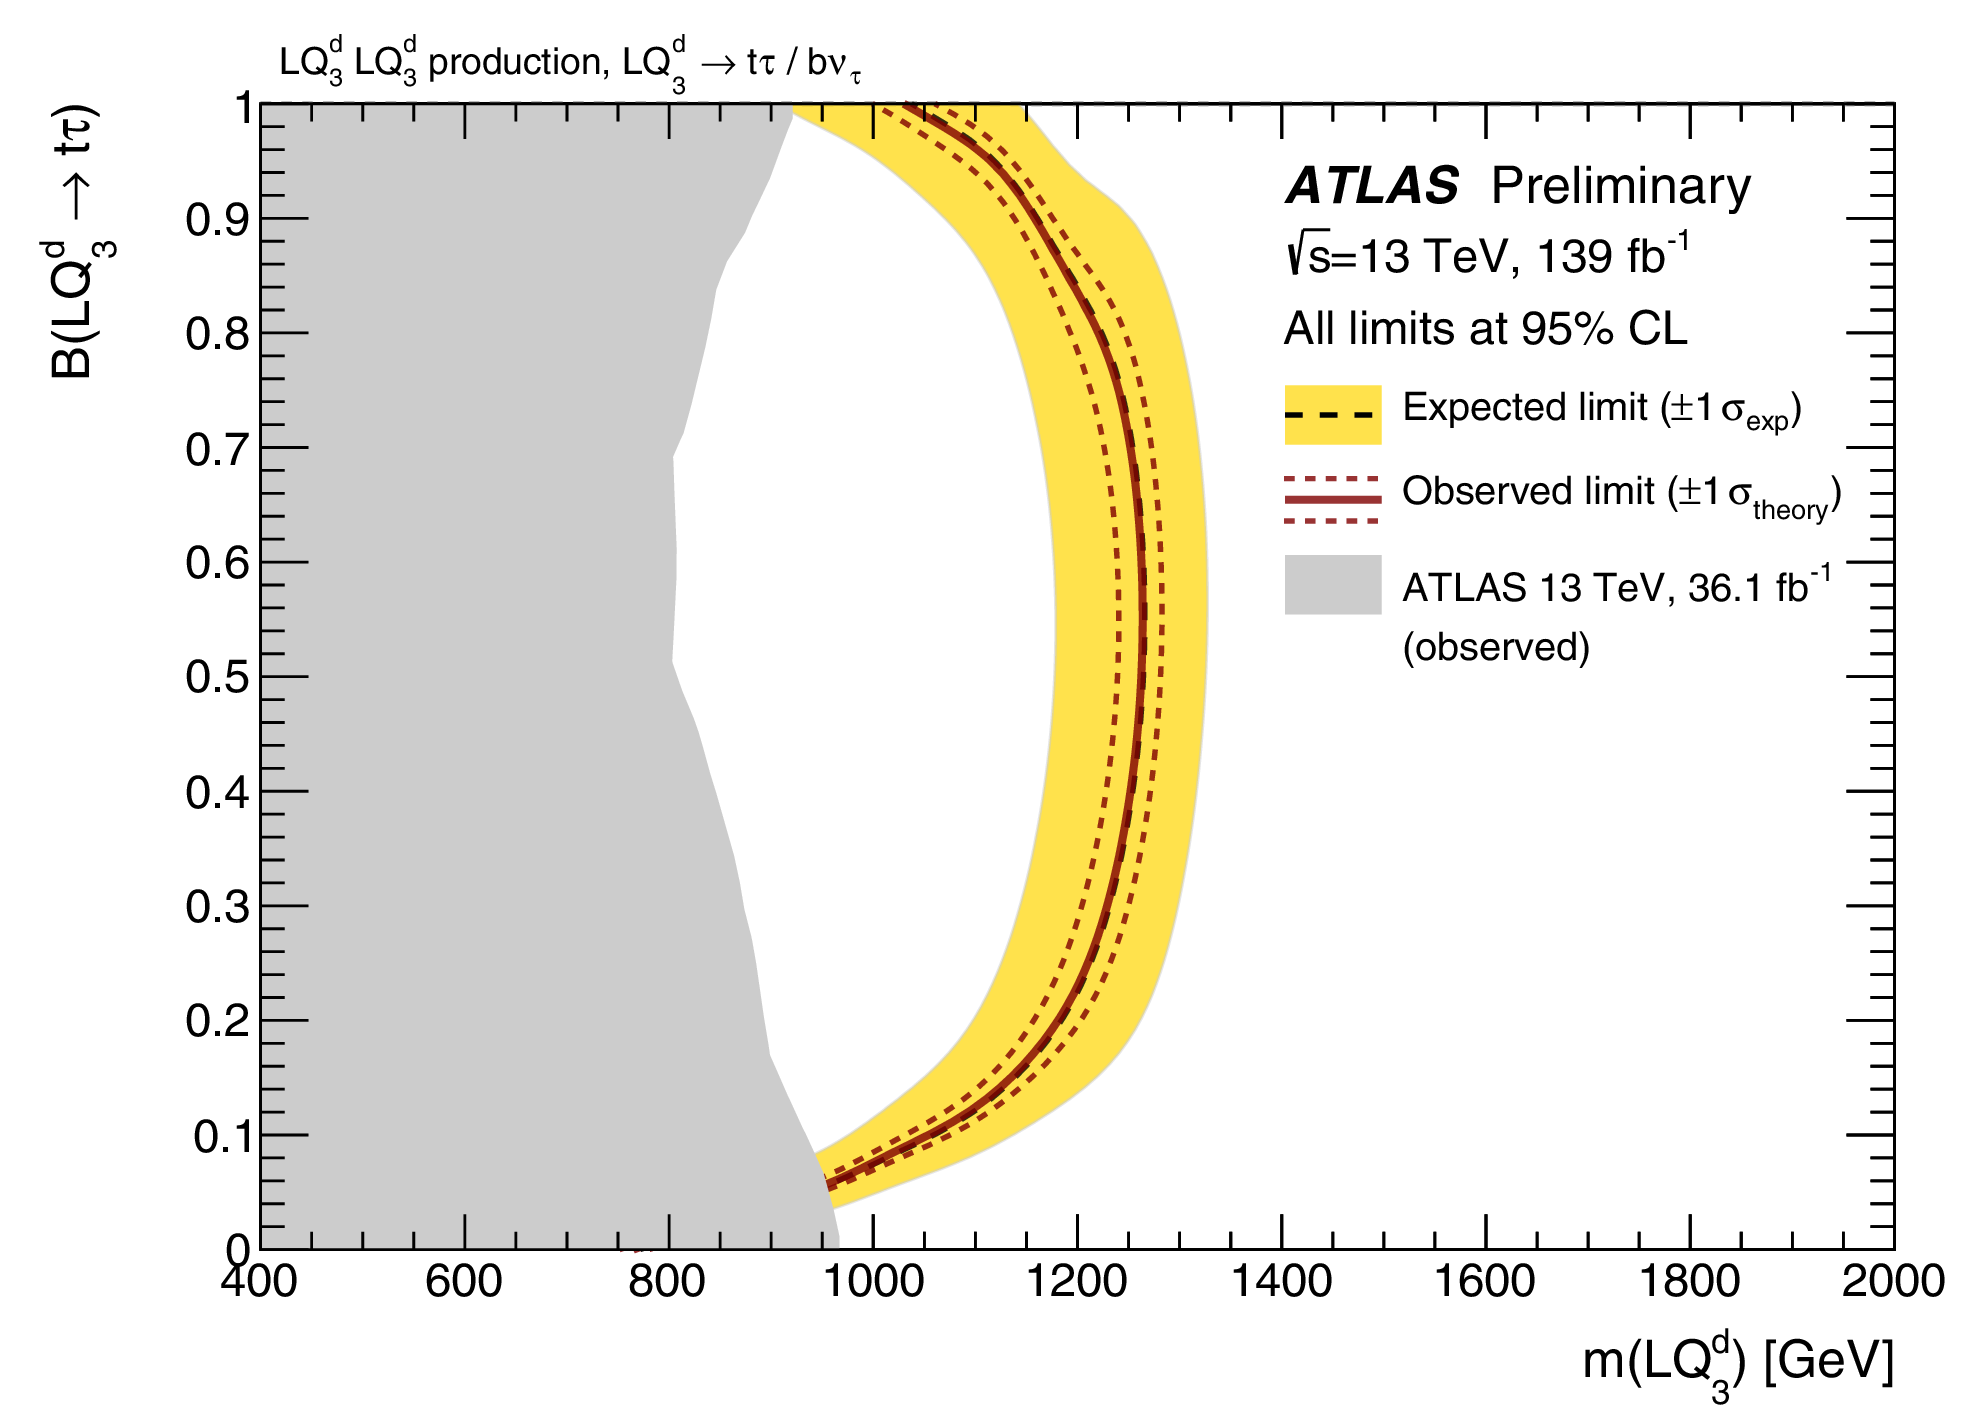
Figure 7 [4] shows expected and observed exclusion contours at 95% CL as a function of (LQ) and the branching ratio into charged leptons. For and , limits for LQs reach 1.25 TeV.
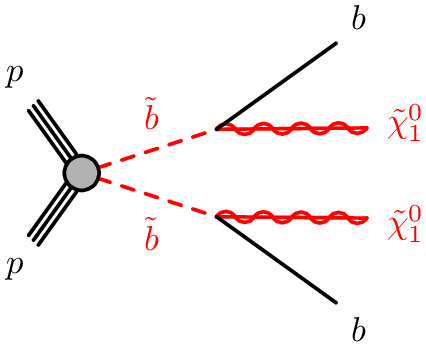
4 Search for pair-production of third-generation down-type Leptoquarks in +MET events
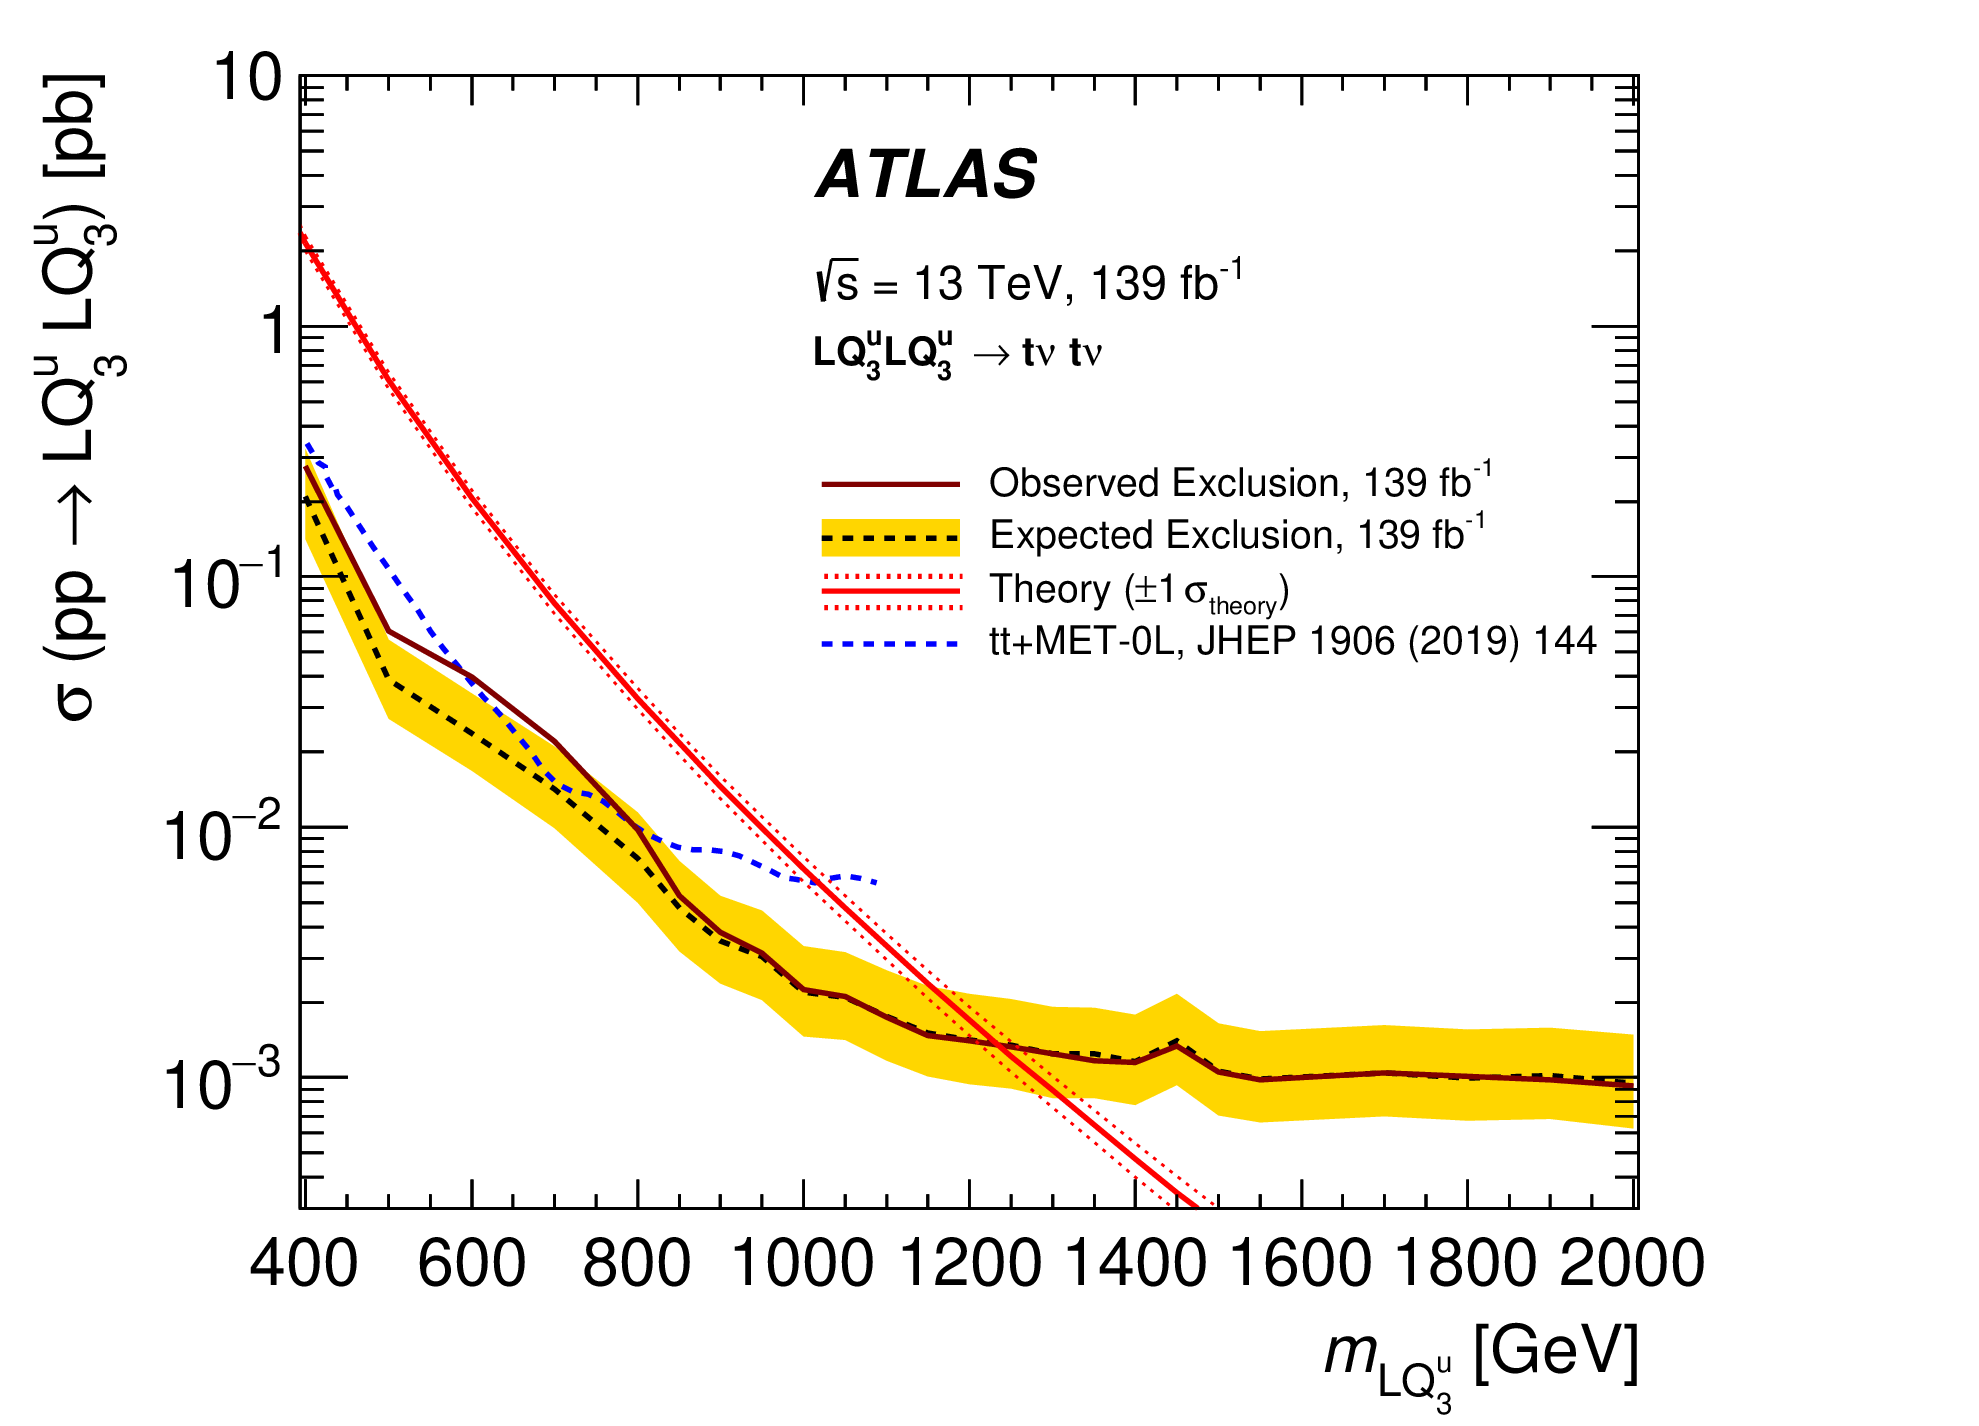
Searches for +MET Supersymmetric prompt decays have sensitive to pair-production of third-generation LQs. The corresponding Feynman graphs are shown in Figure 8 [5]. Expected and observed mass limits, and cross-section upper limits at 95% CL are also give in Figure 8 [5].

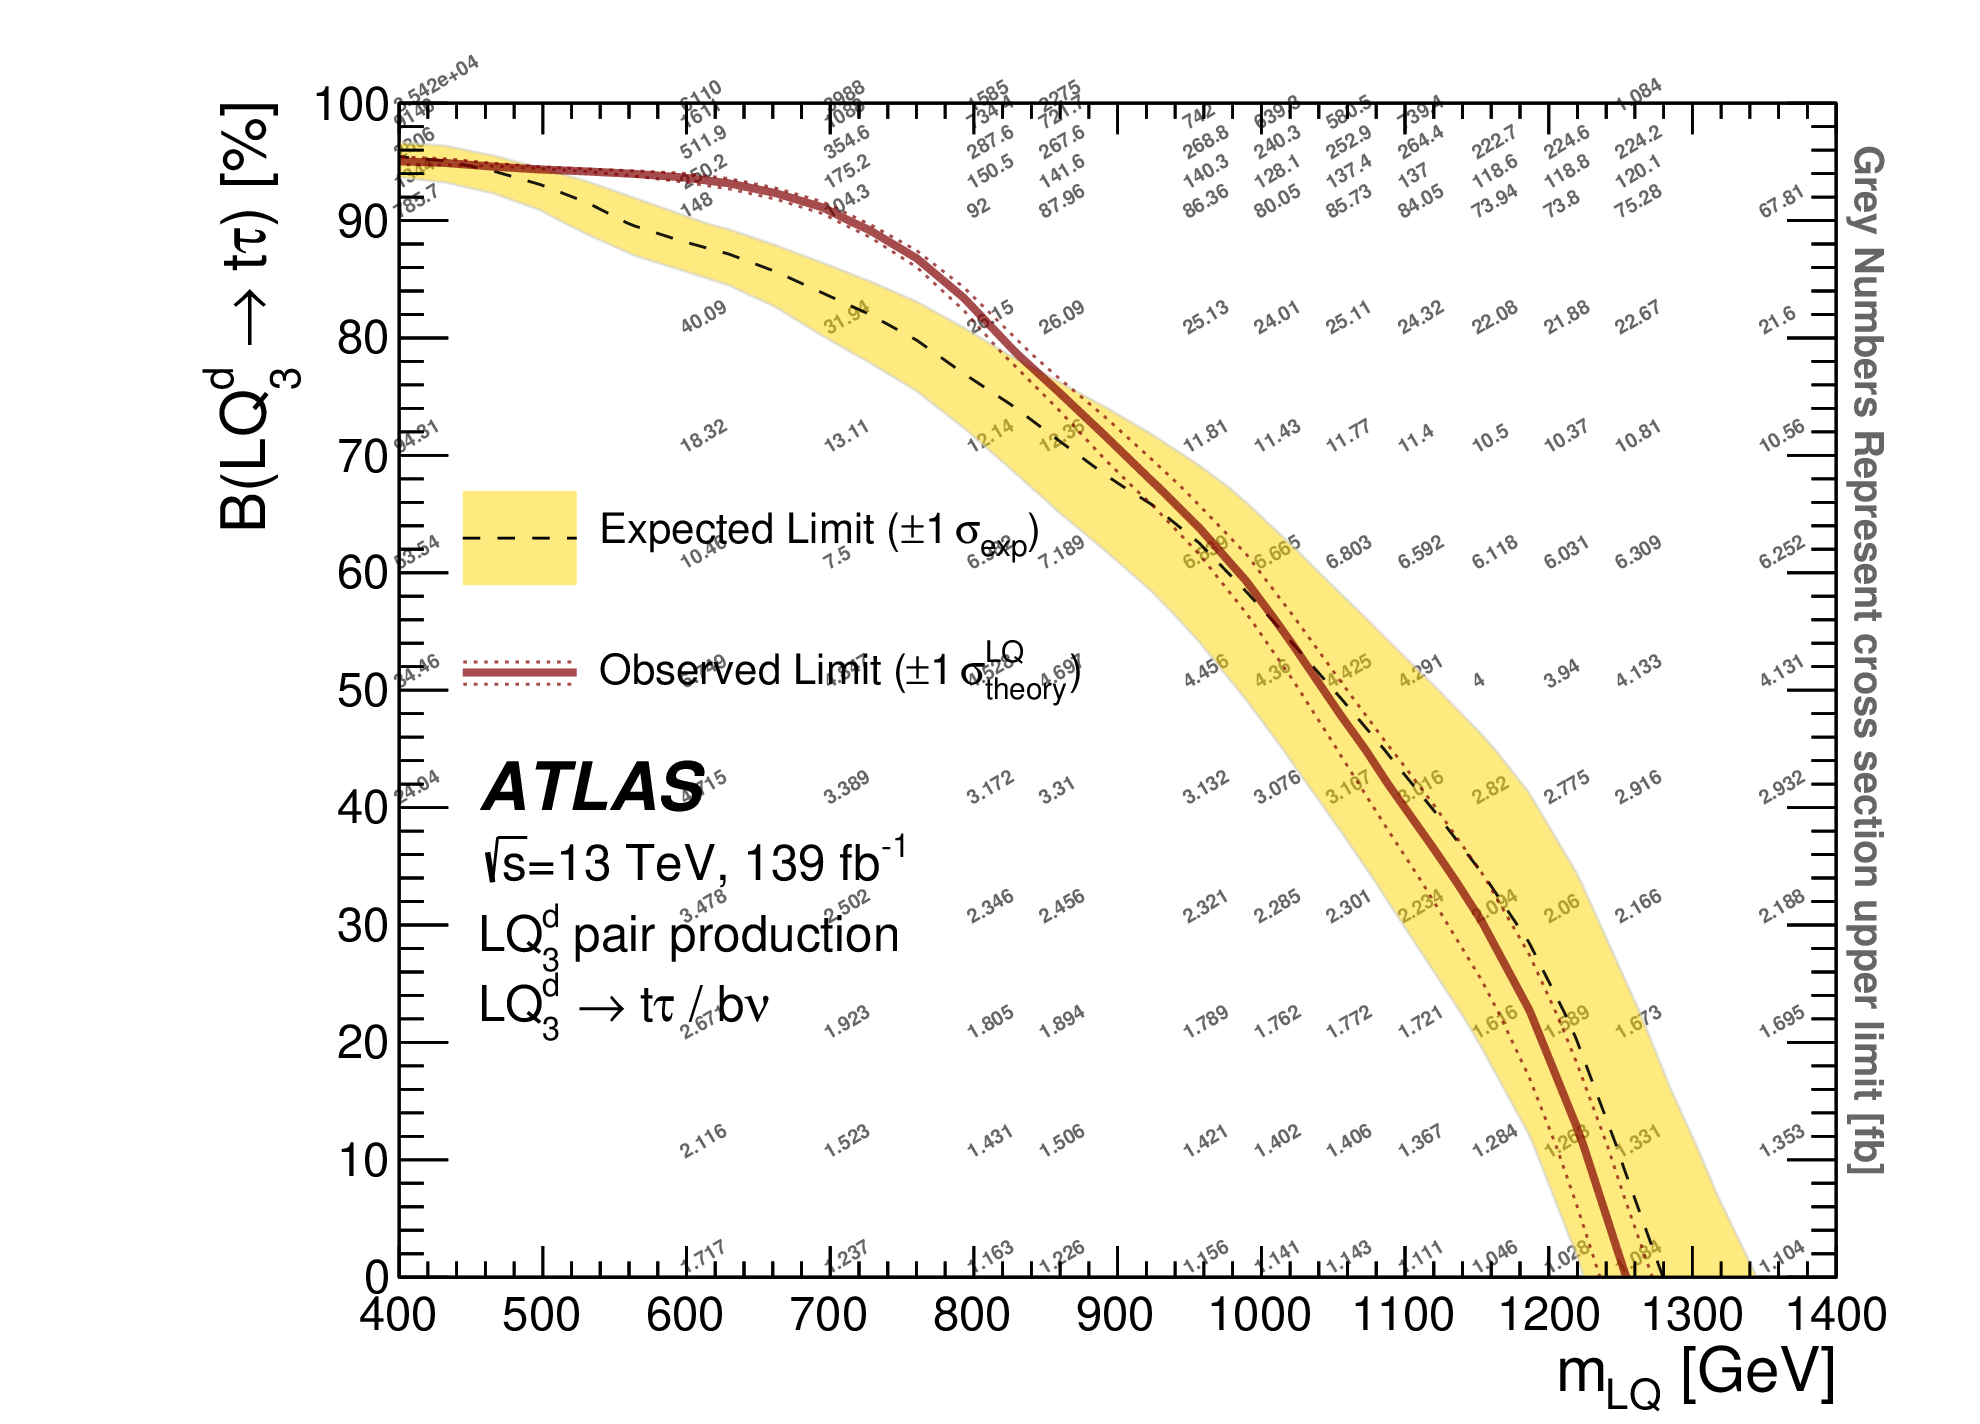
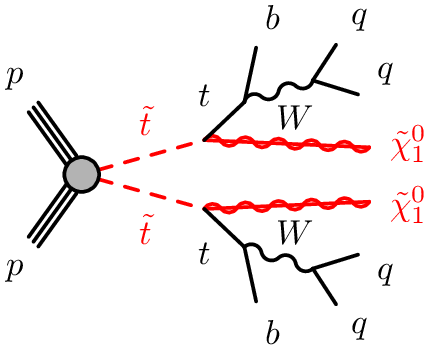
5 Search for pair-production of third-generation down-type Leptoquarks in +MET all-hadronic events
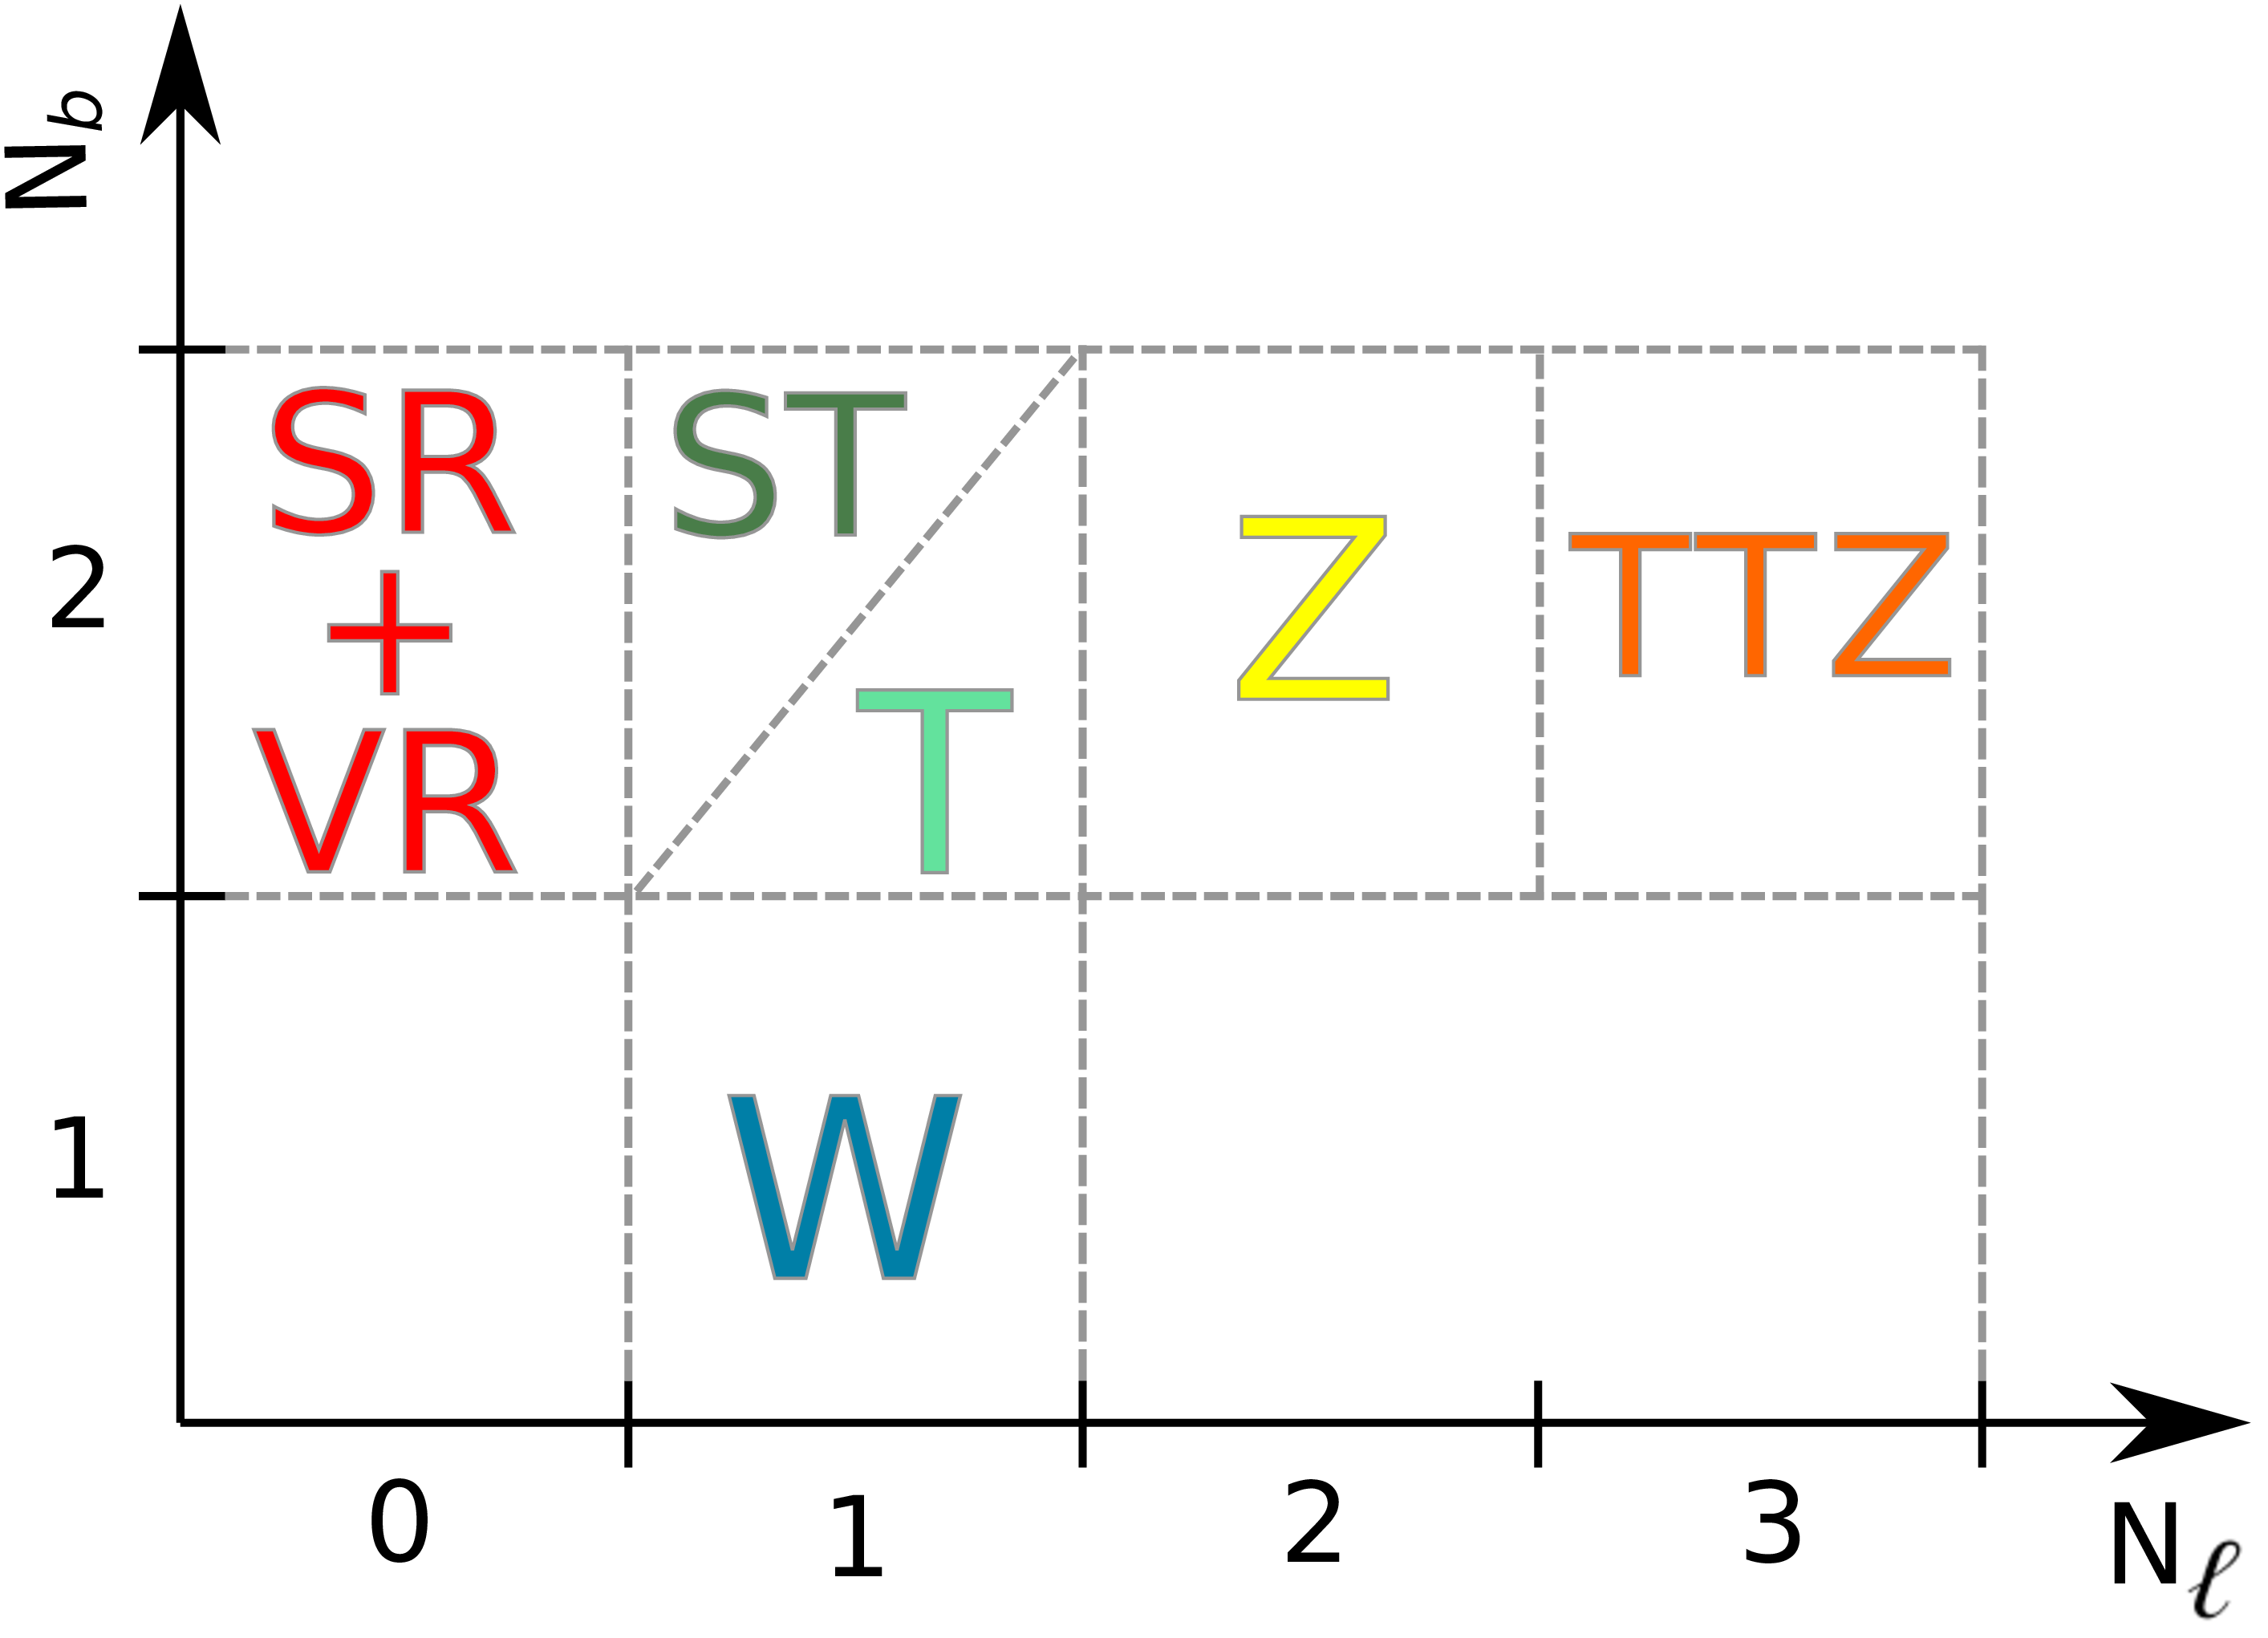
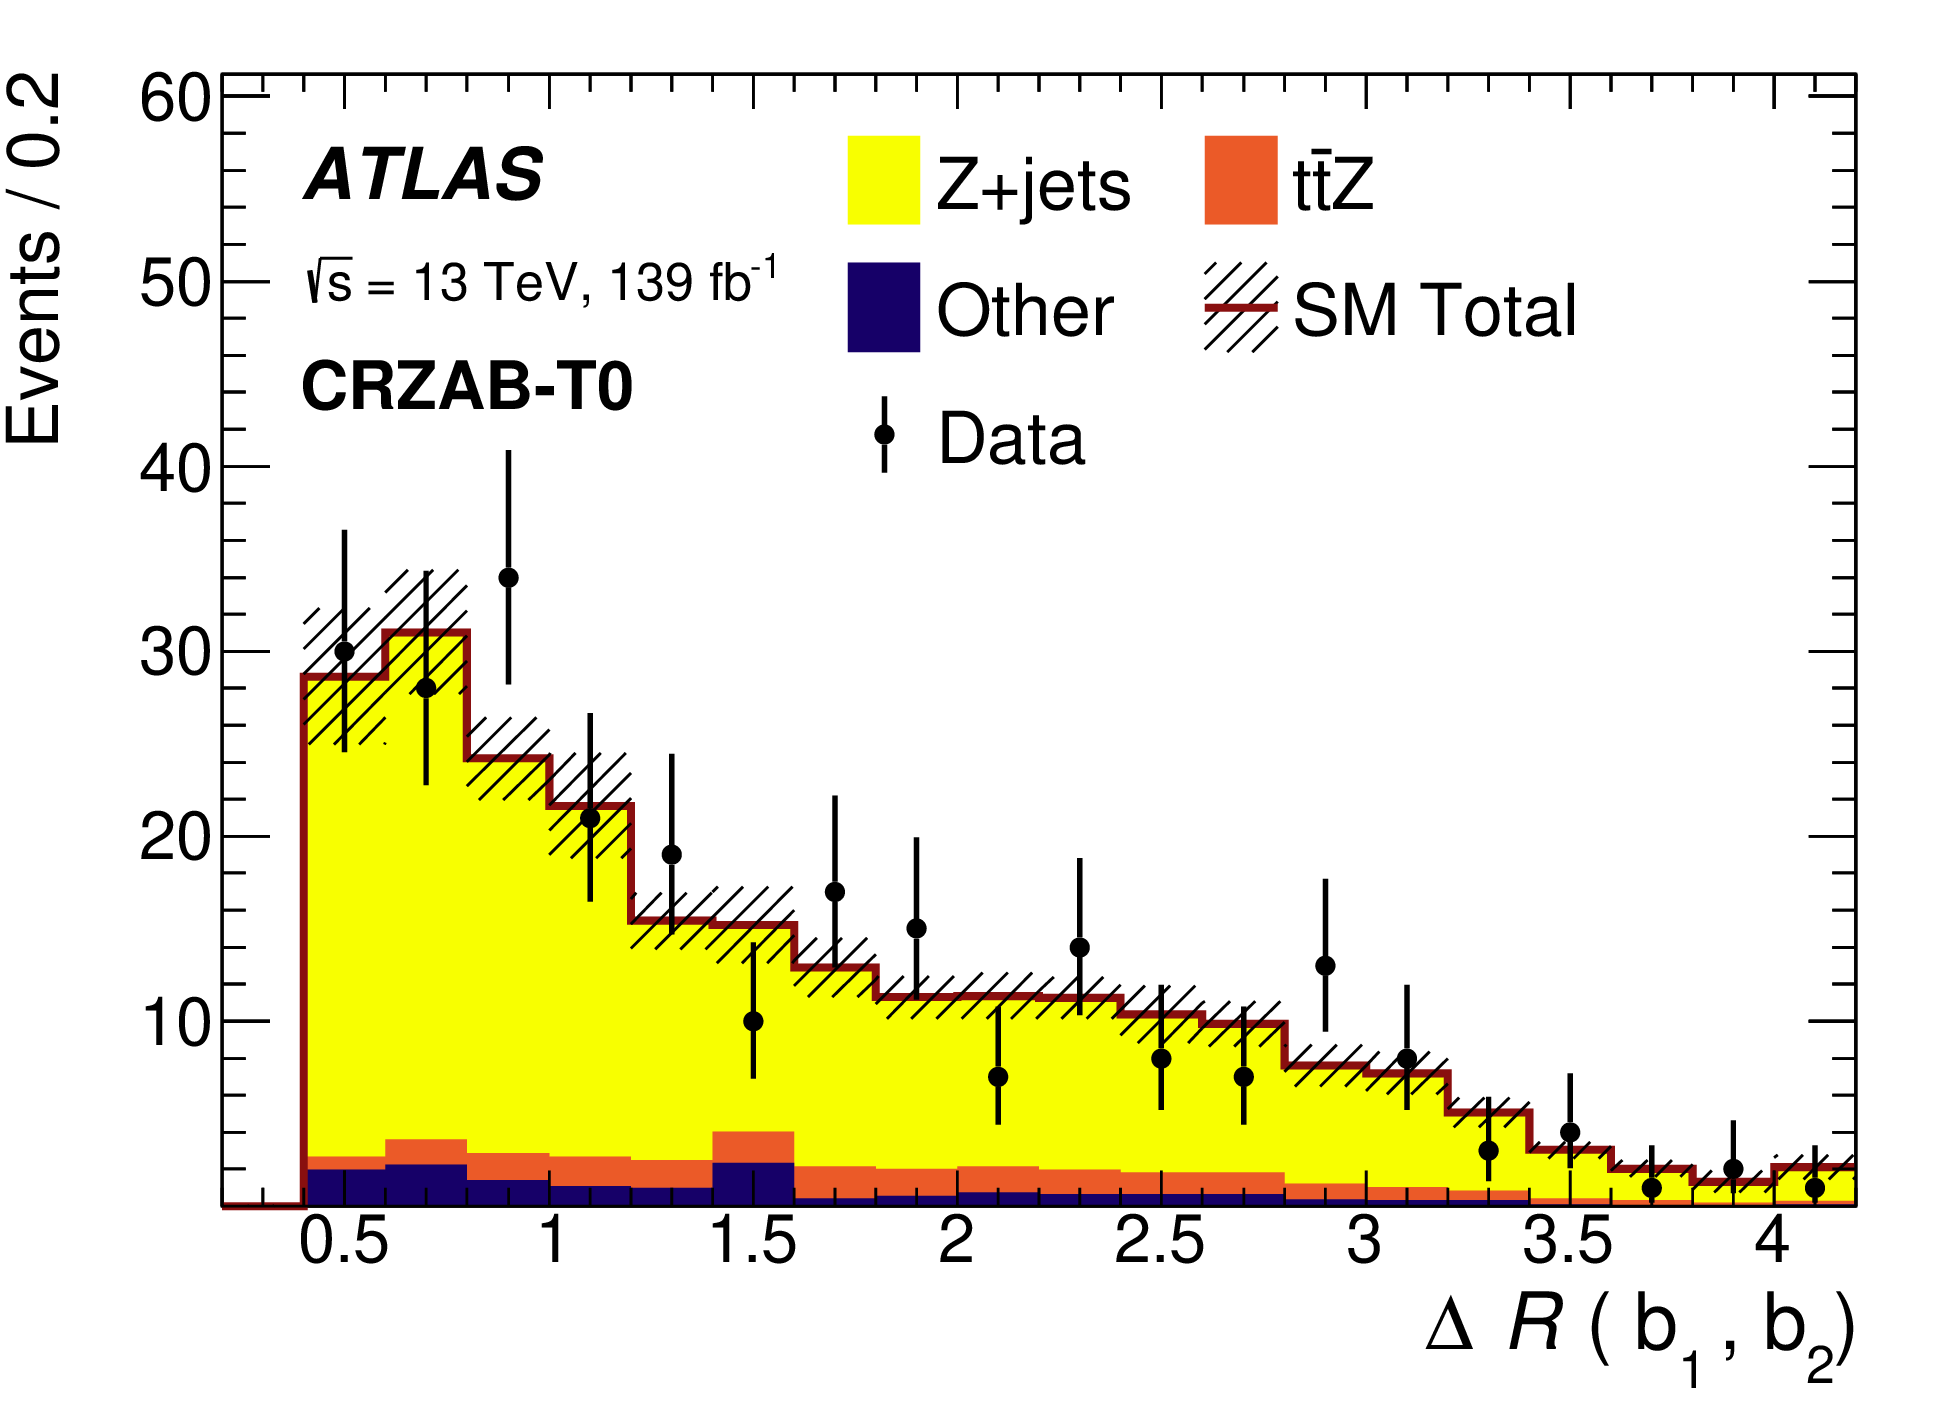
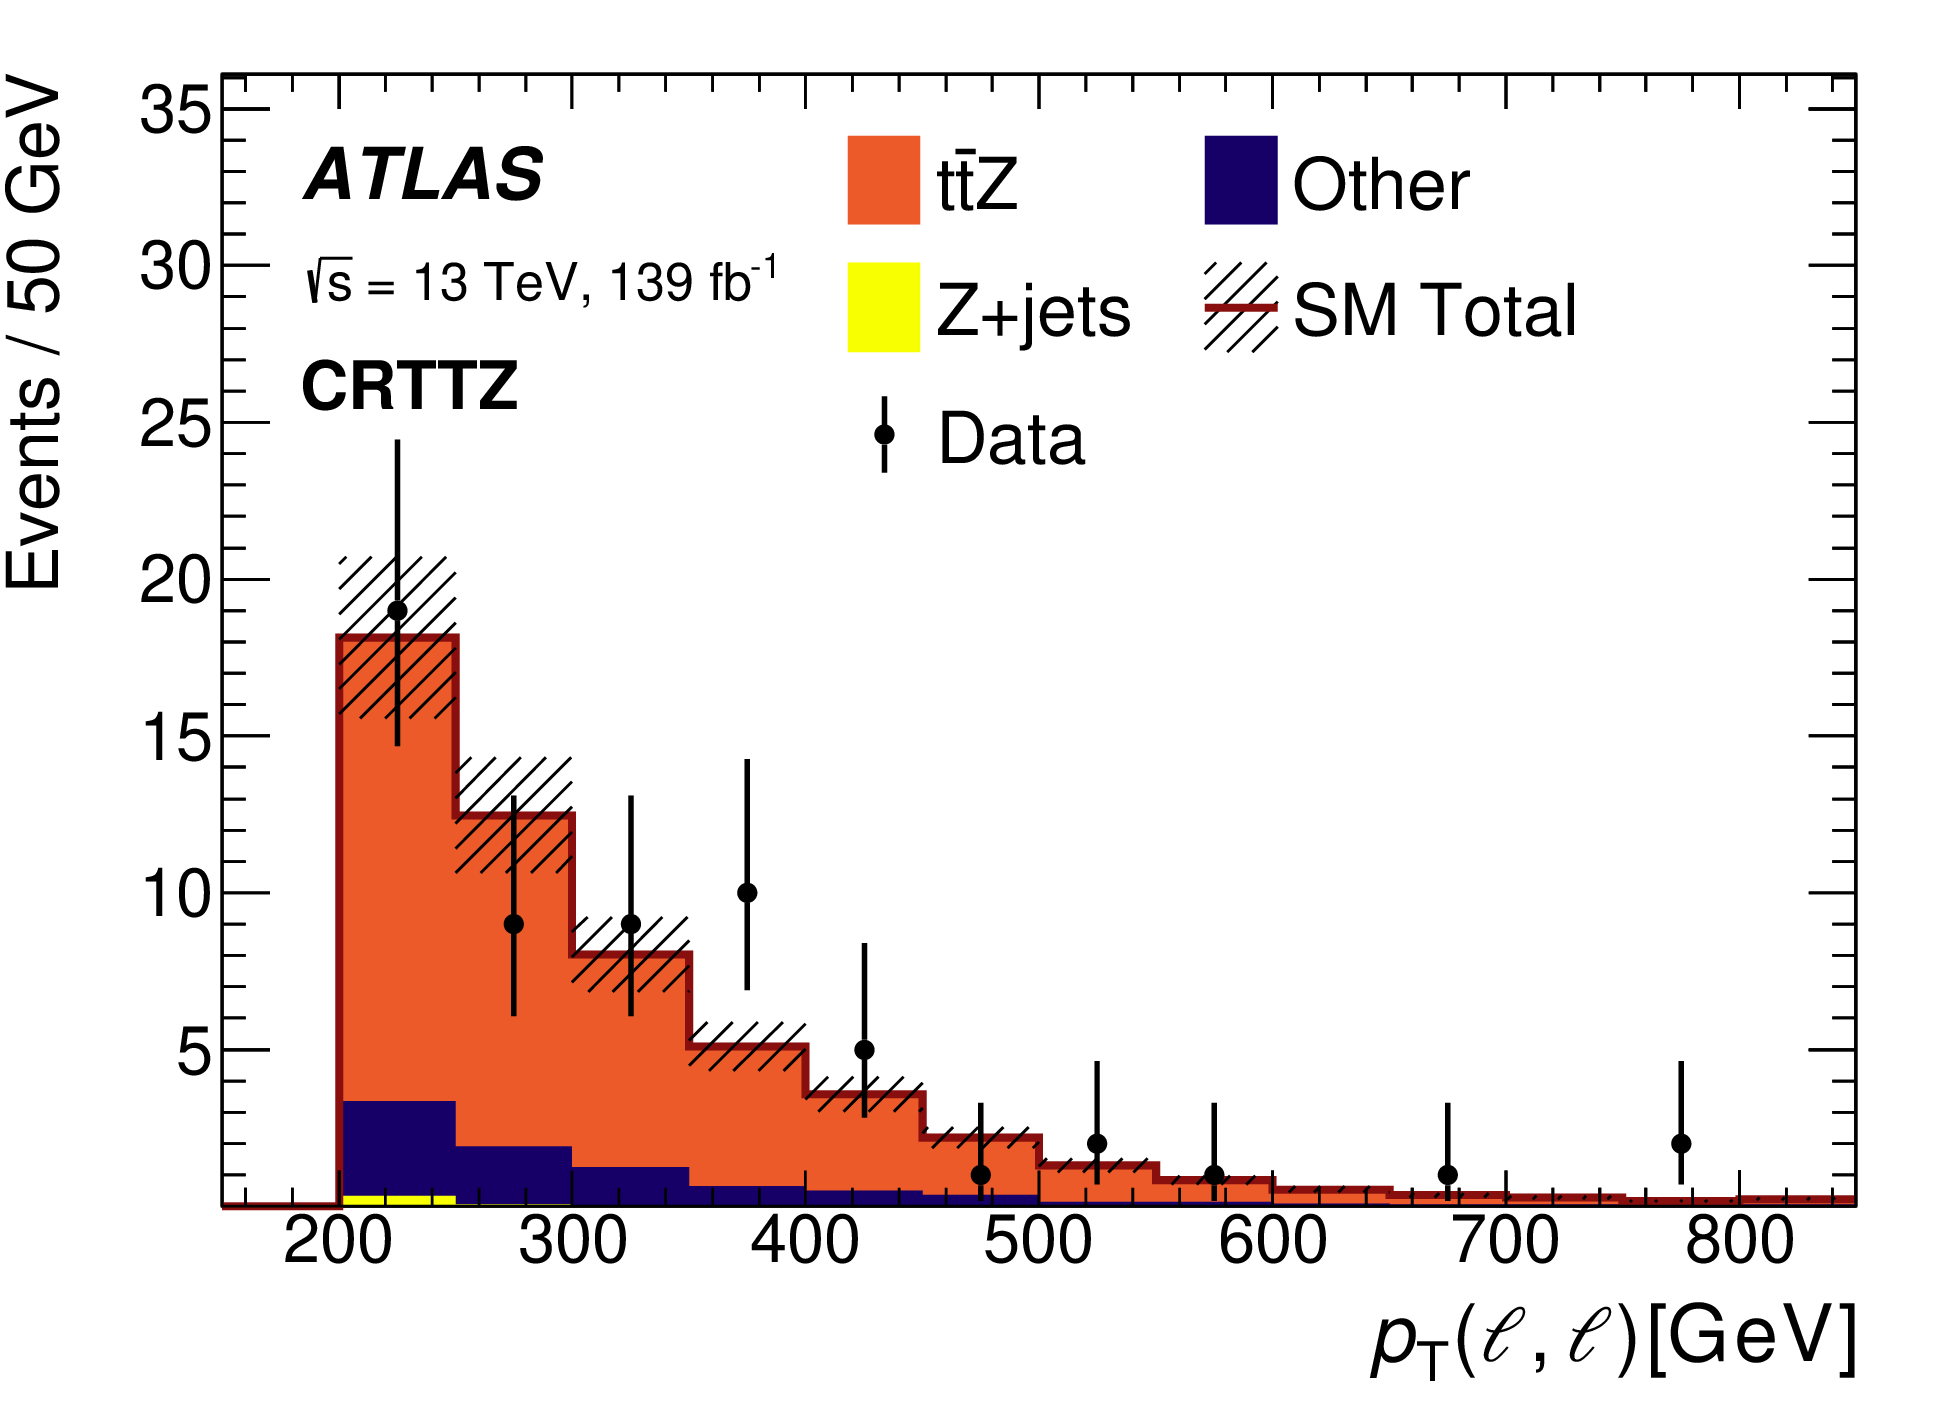
Searches for +MET Supersymmetric prompt decays have sensitivity to pair-production of third-generation Leptoquarks. The corresponding Feynman graphs are shown in Figure 9 [6]. The control regions for Z+jets (Z), Z (TTZ), (T), W+jets (W), and single-top (ST) backgrounds are ordered according to the numbers of leptons and b-jets, as also shown in Figure 9 [6]. Examples of the control regions for Z+jets and Z are shown in Figure 10 [6]. Excluded (masses, branching ratios) and cross-section limits for pair-production are given in Figure 11 [6].
6 Summary of results
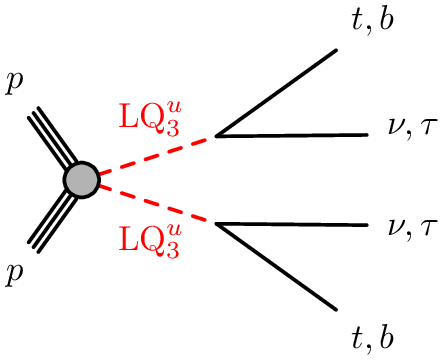
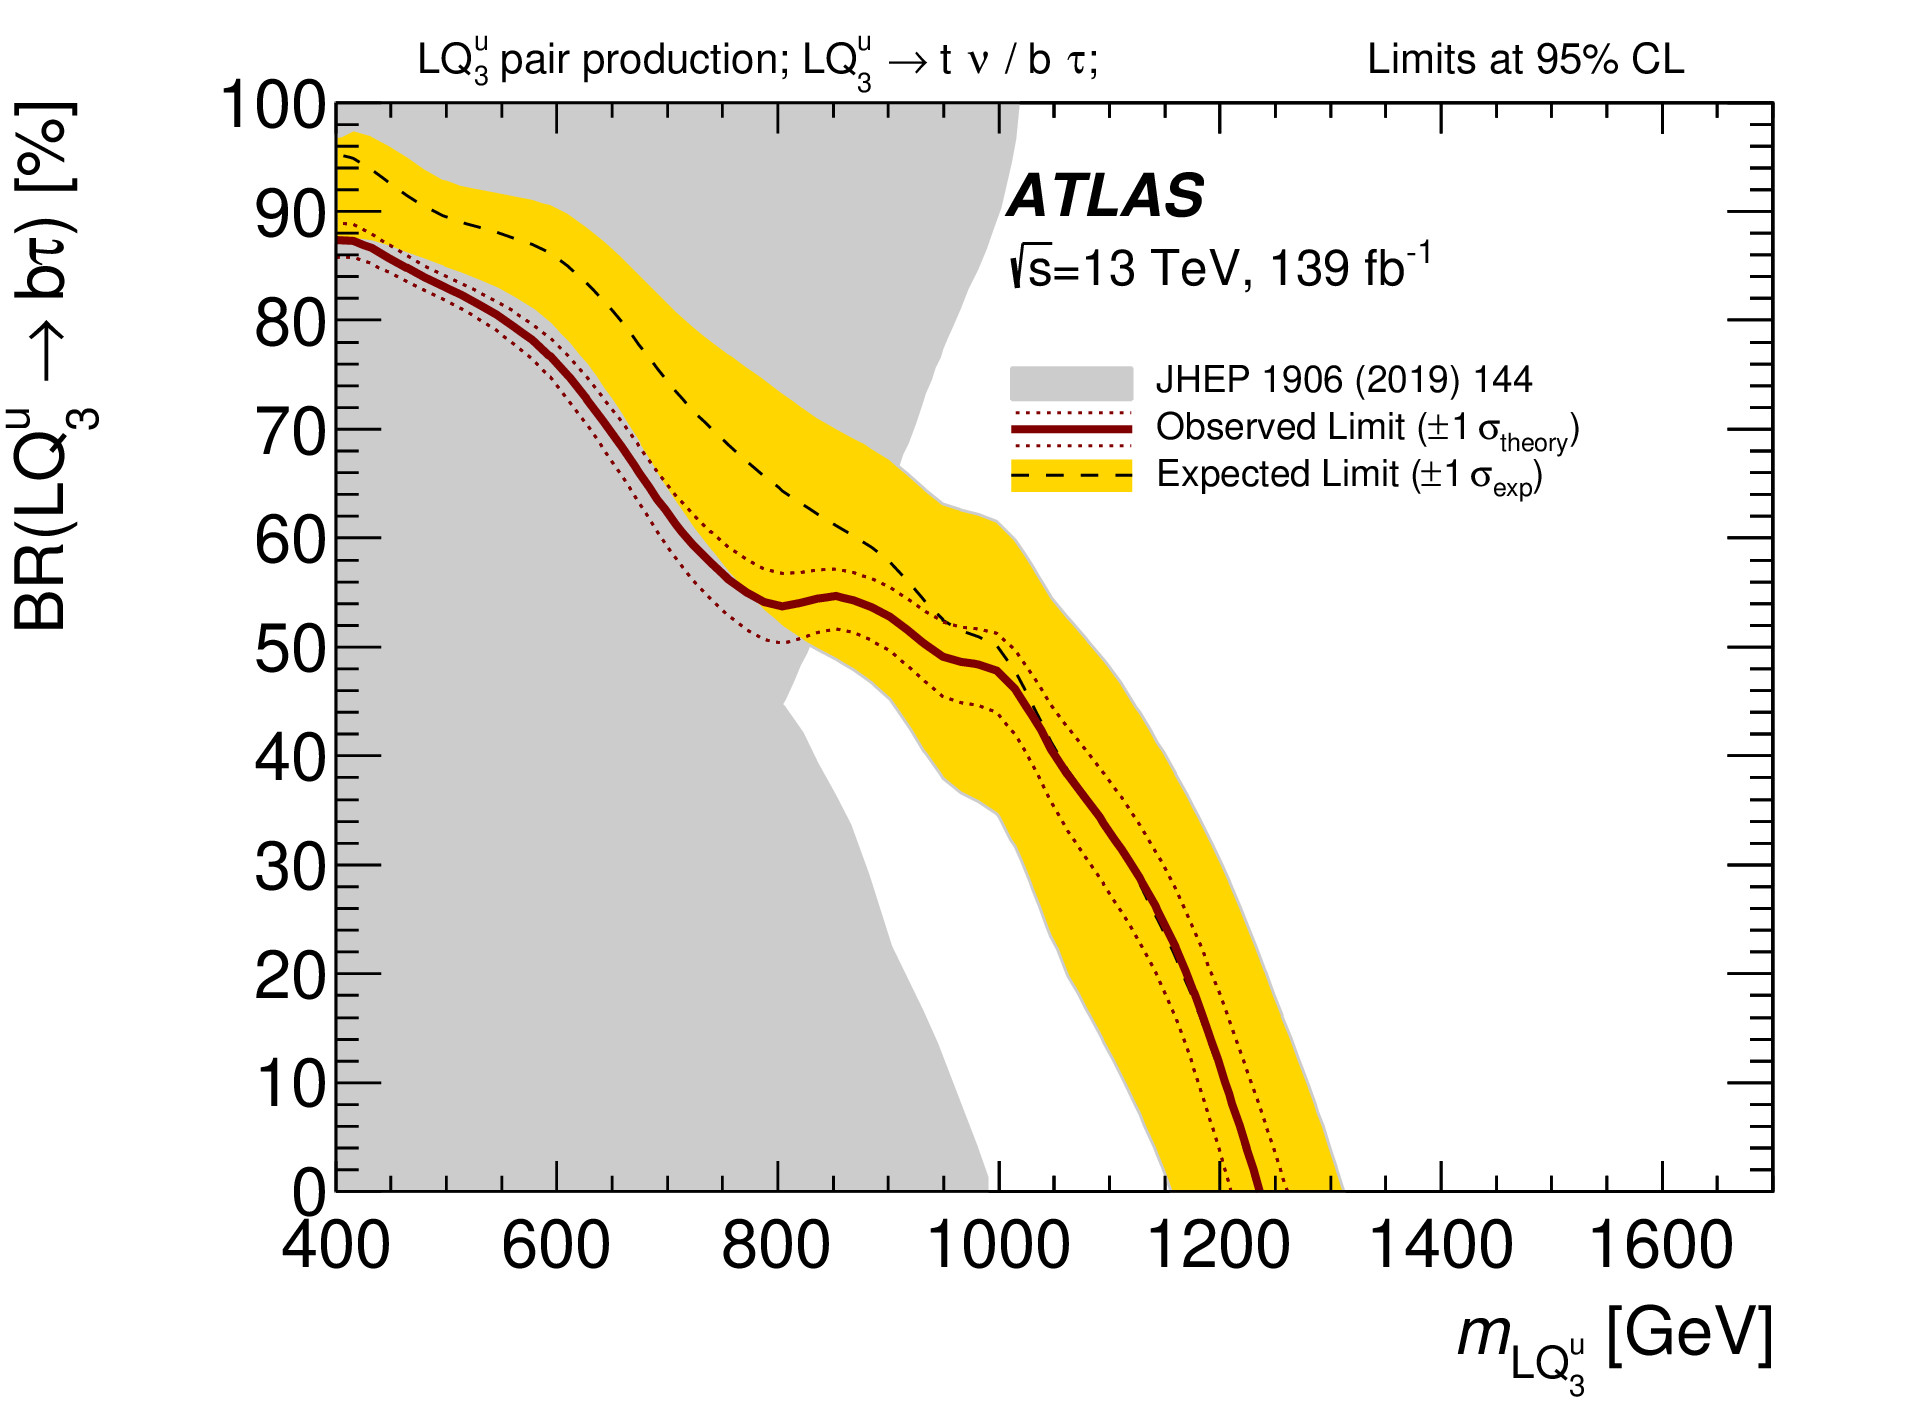
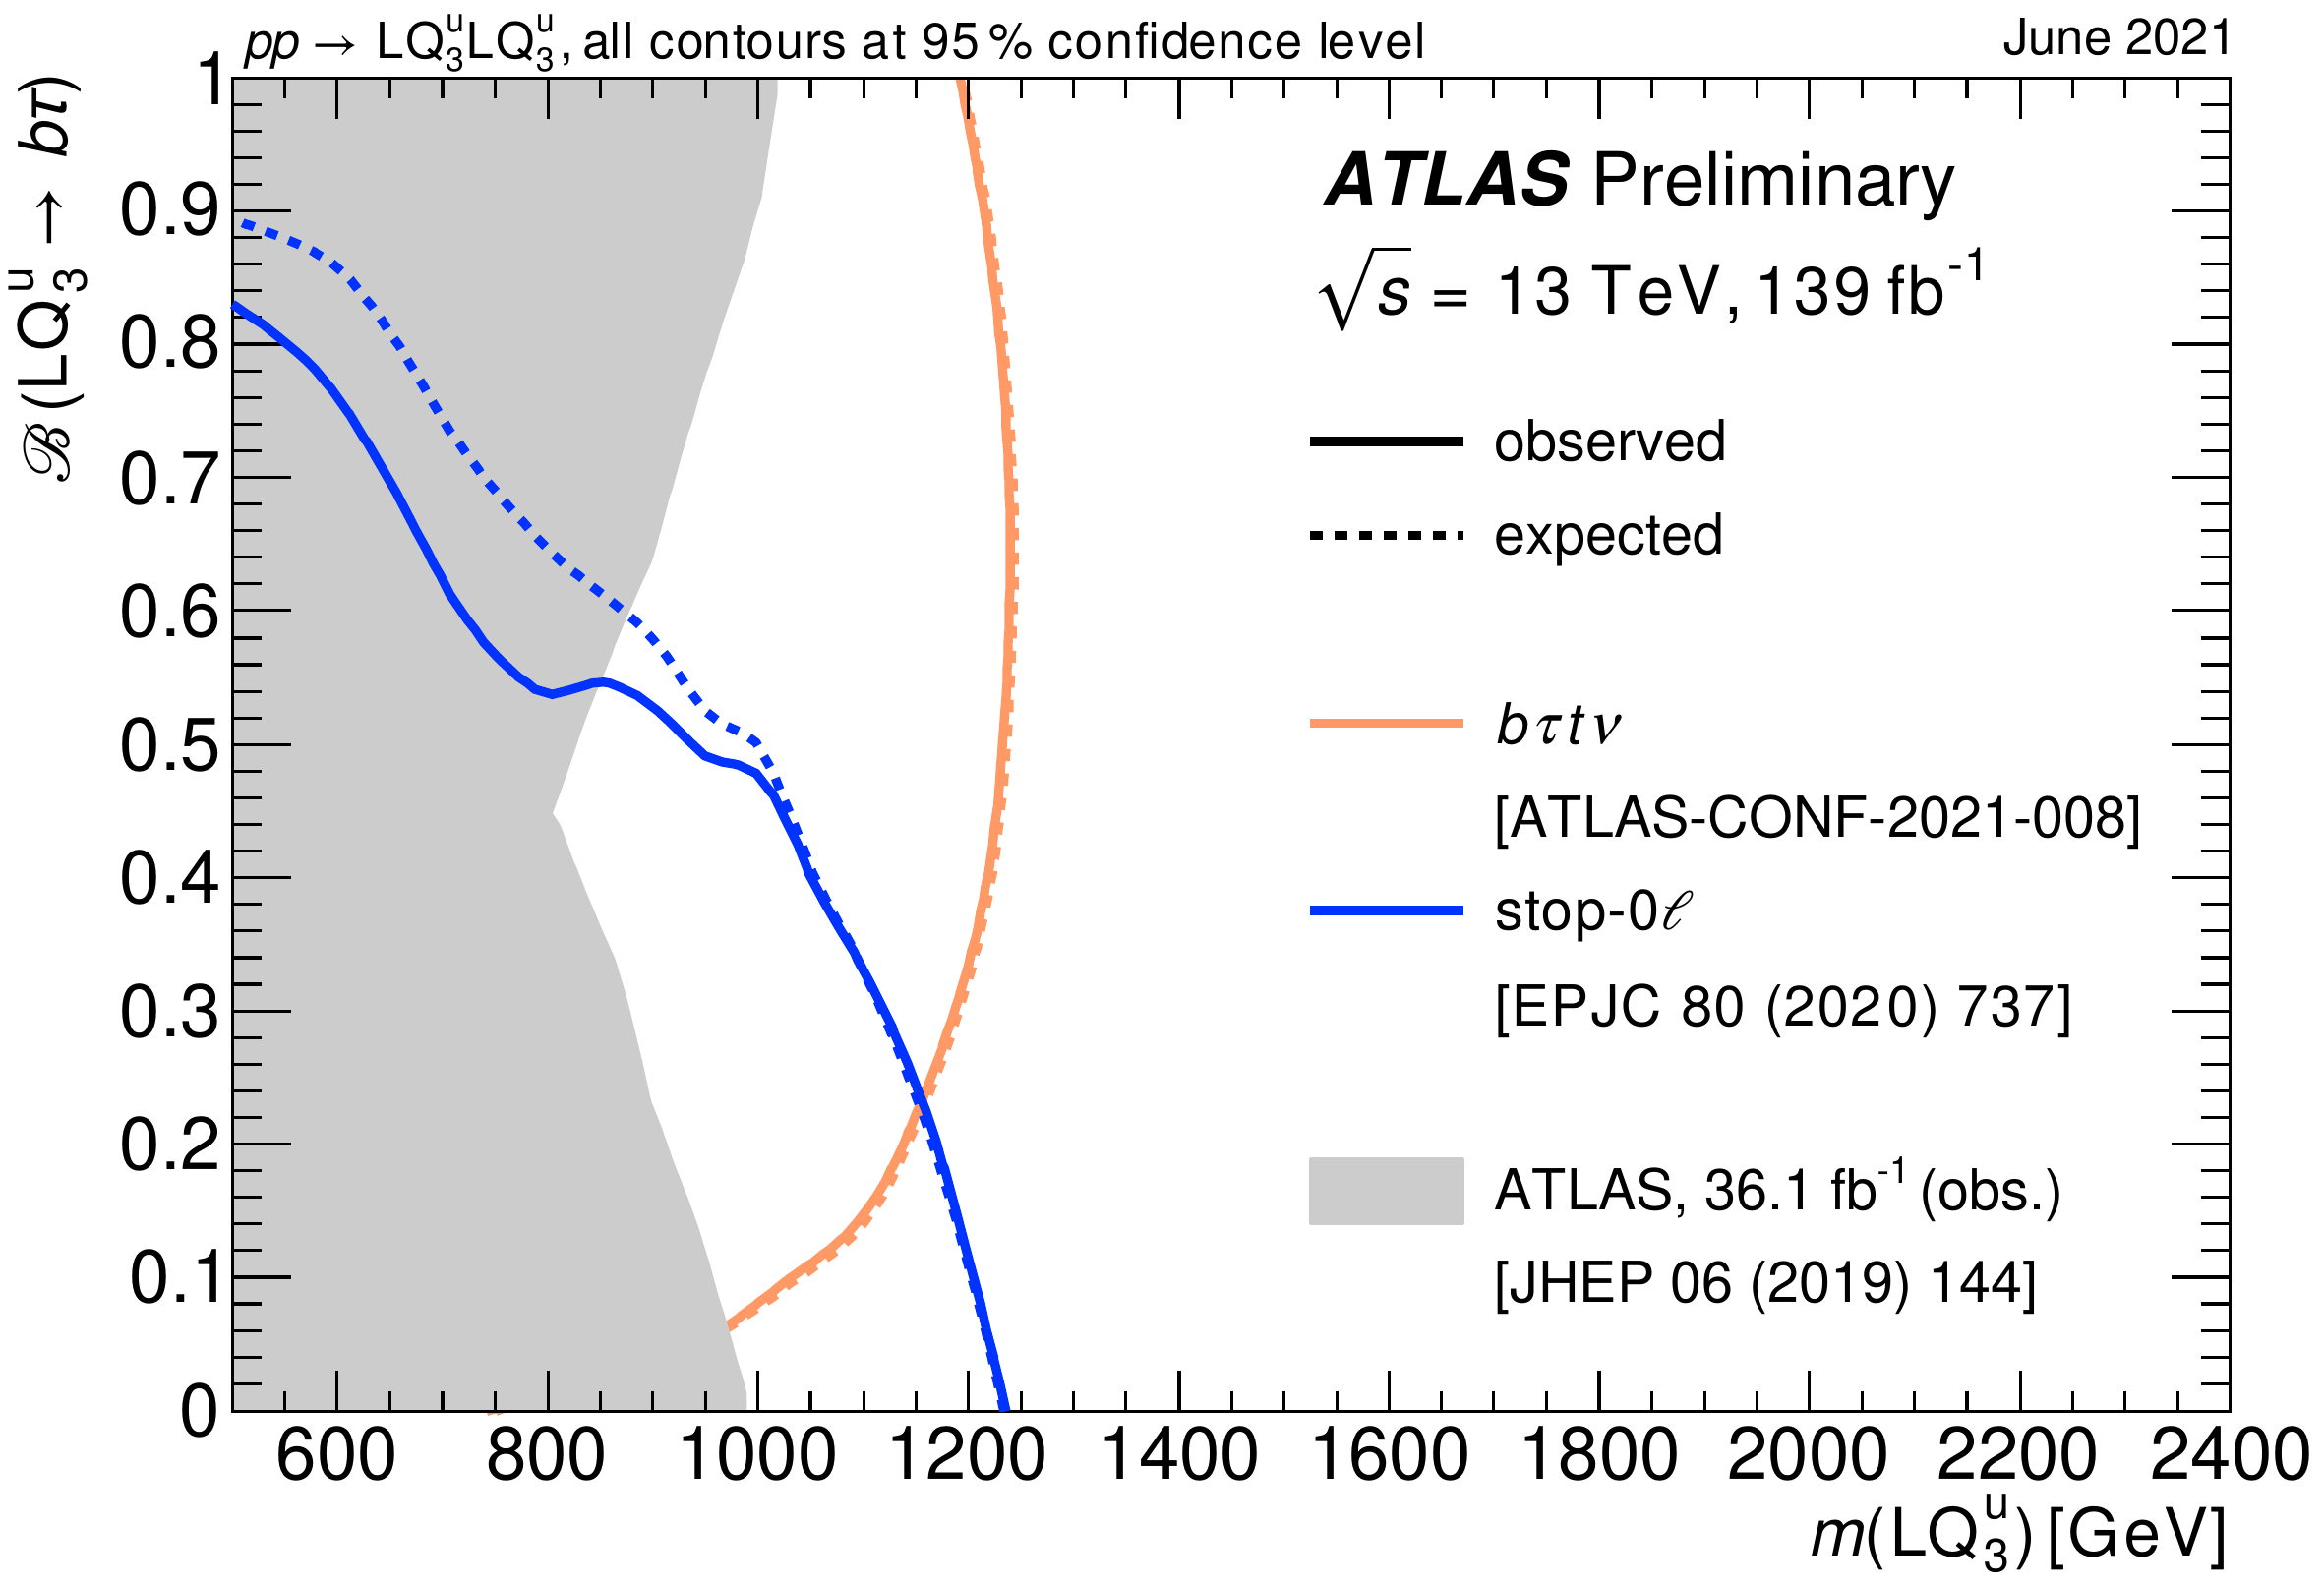
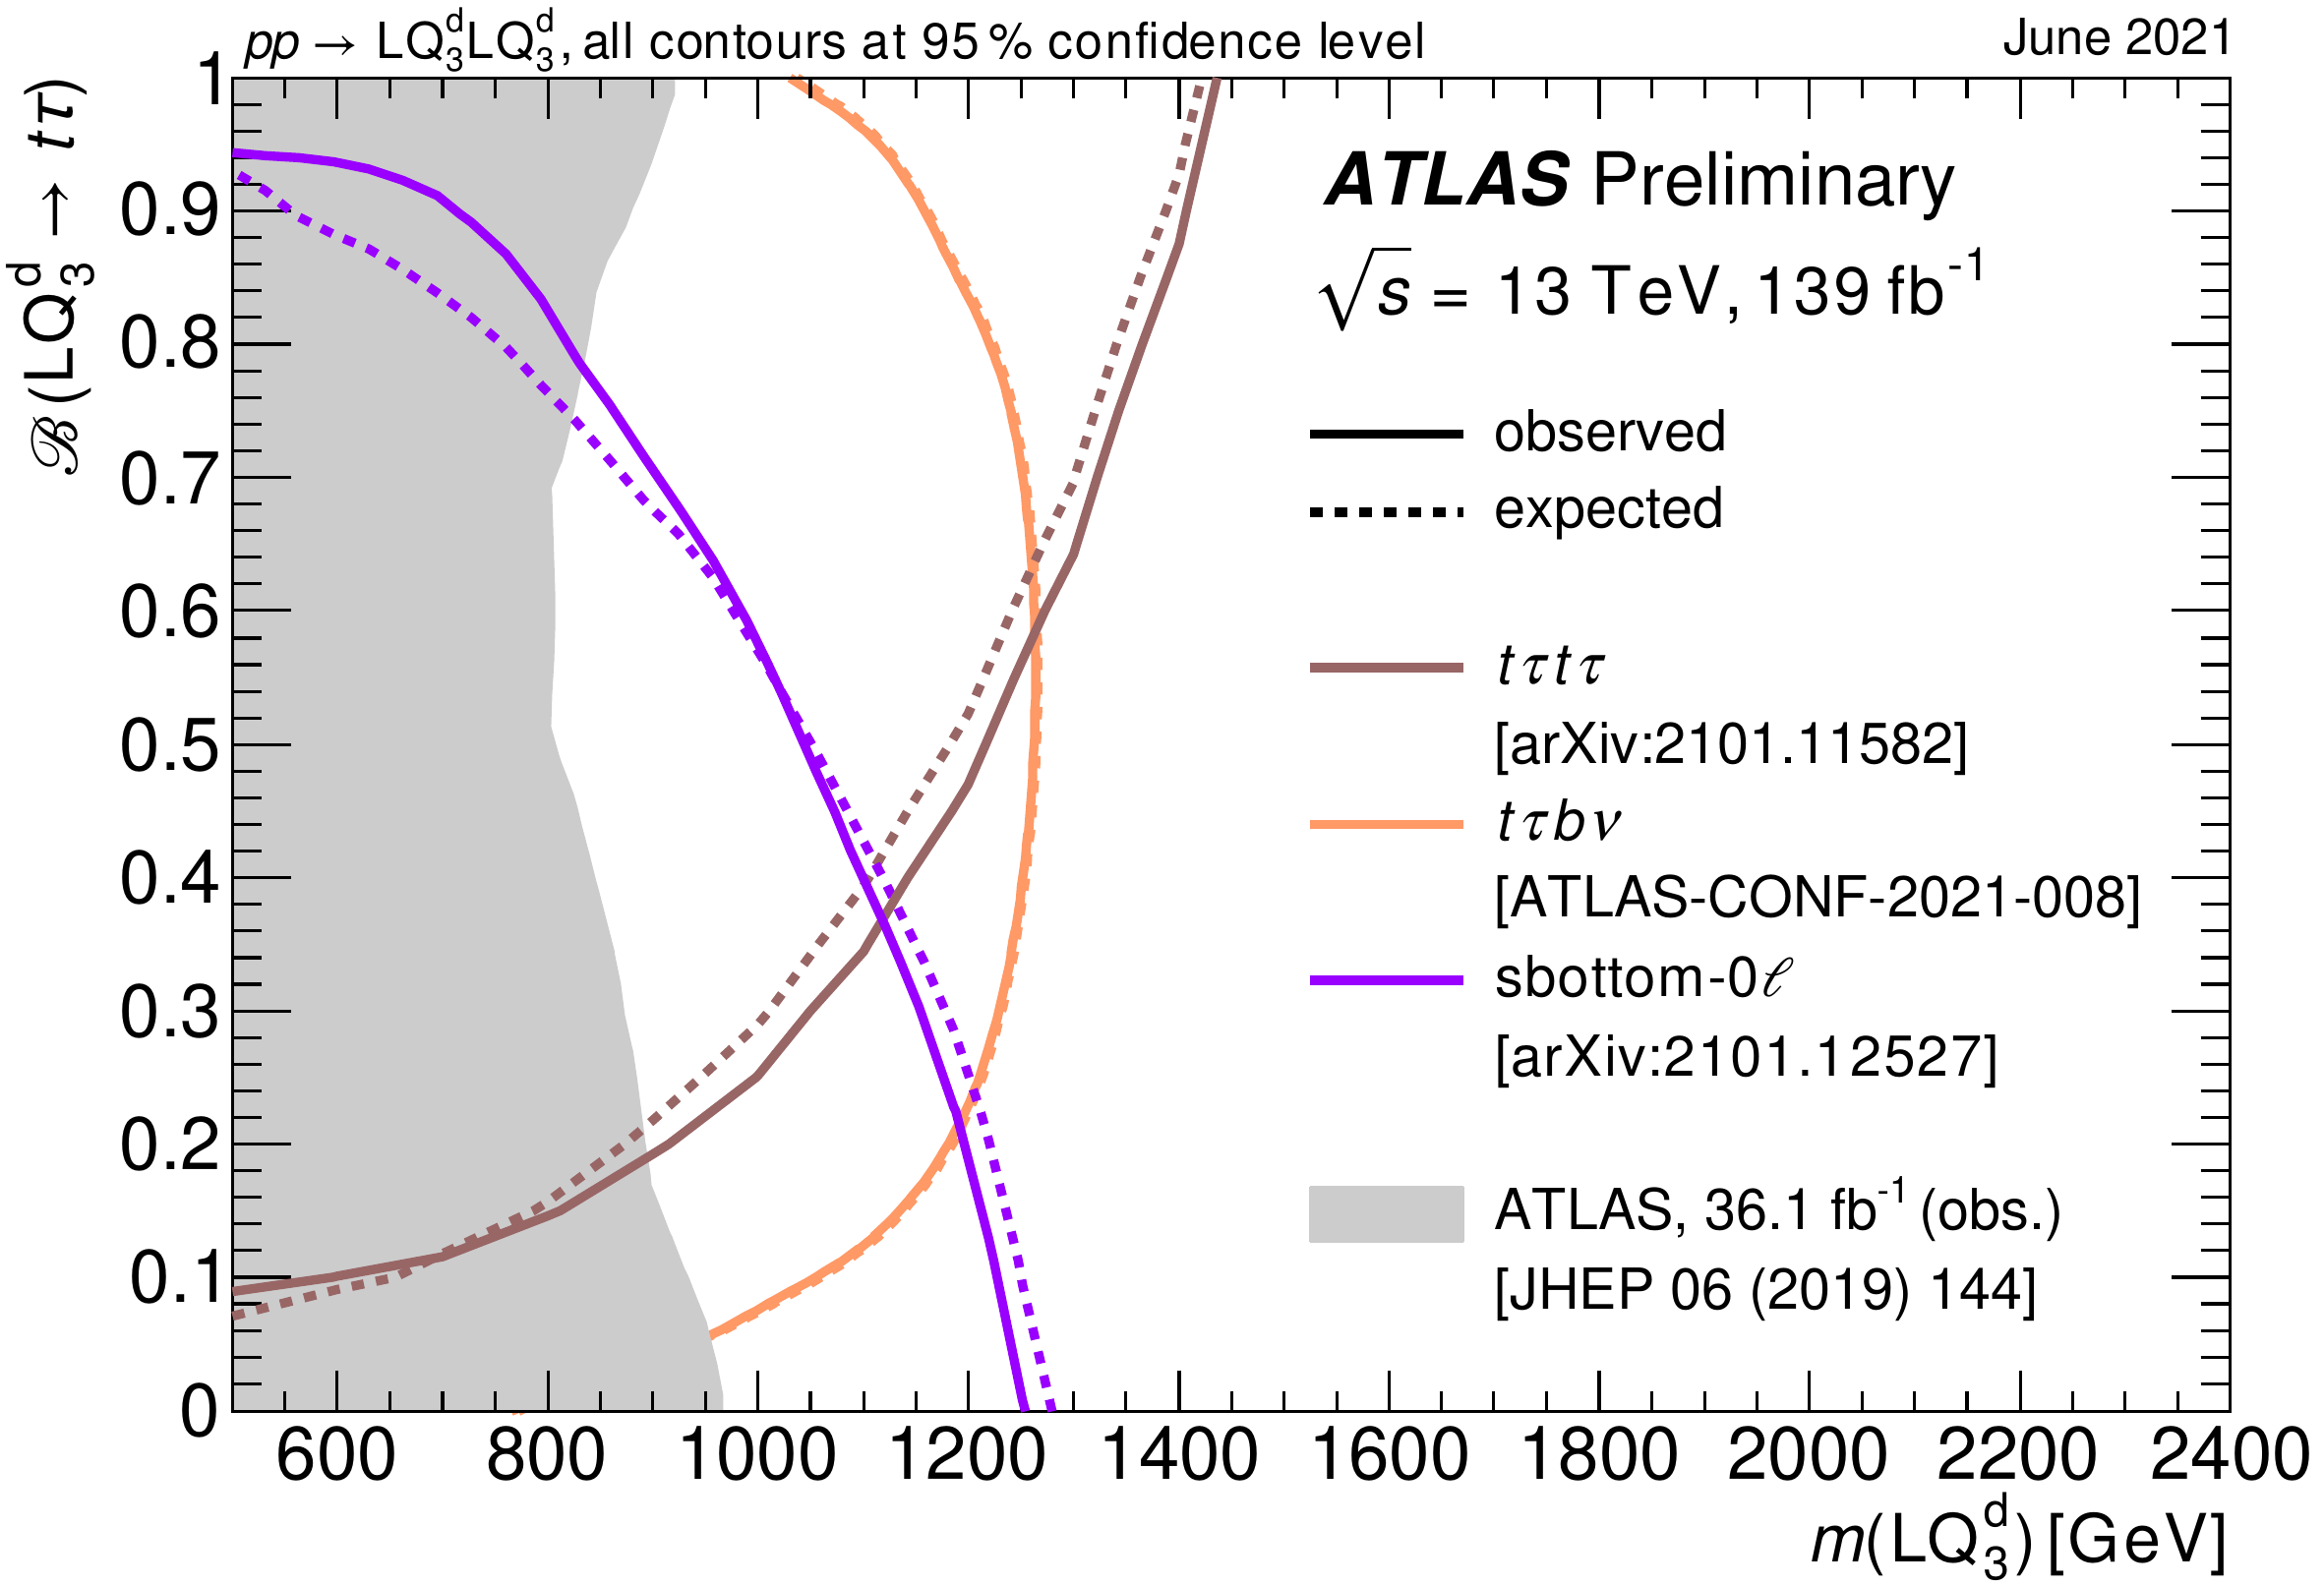
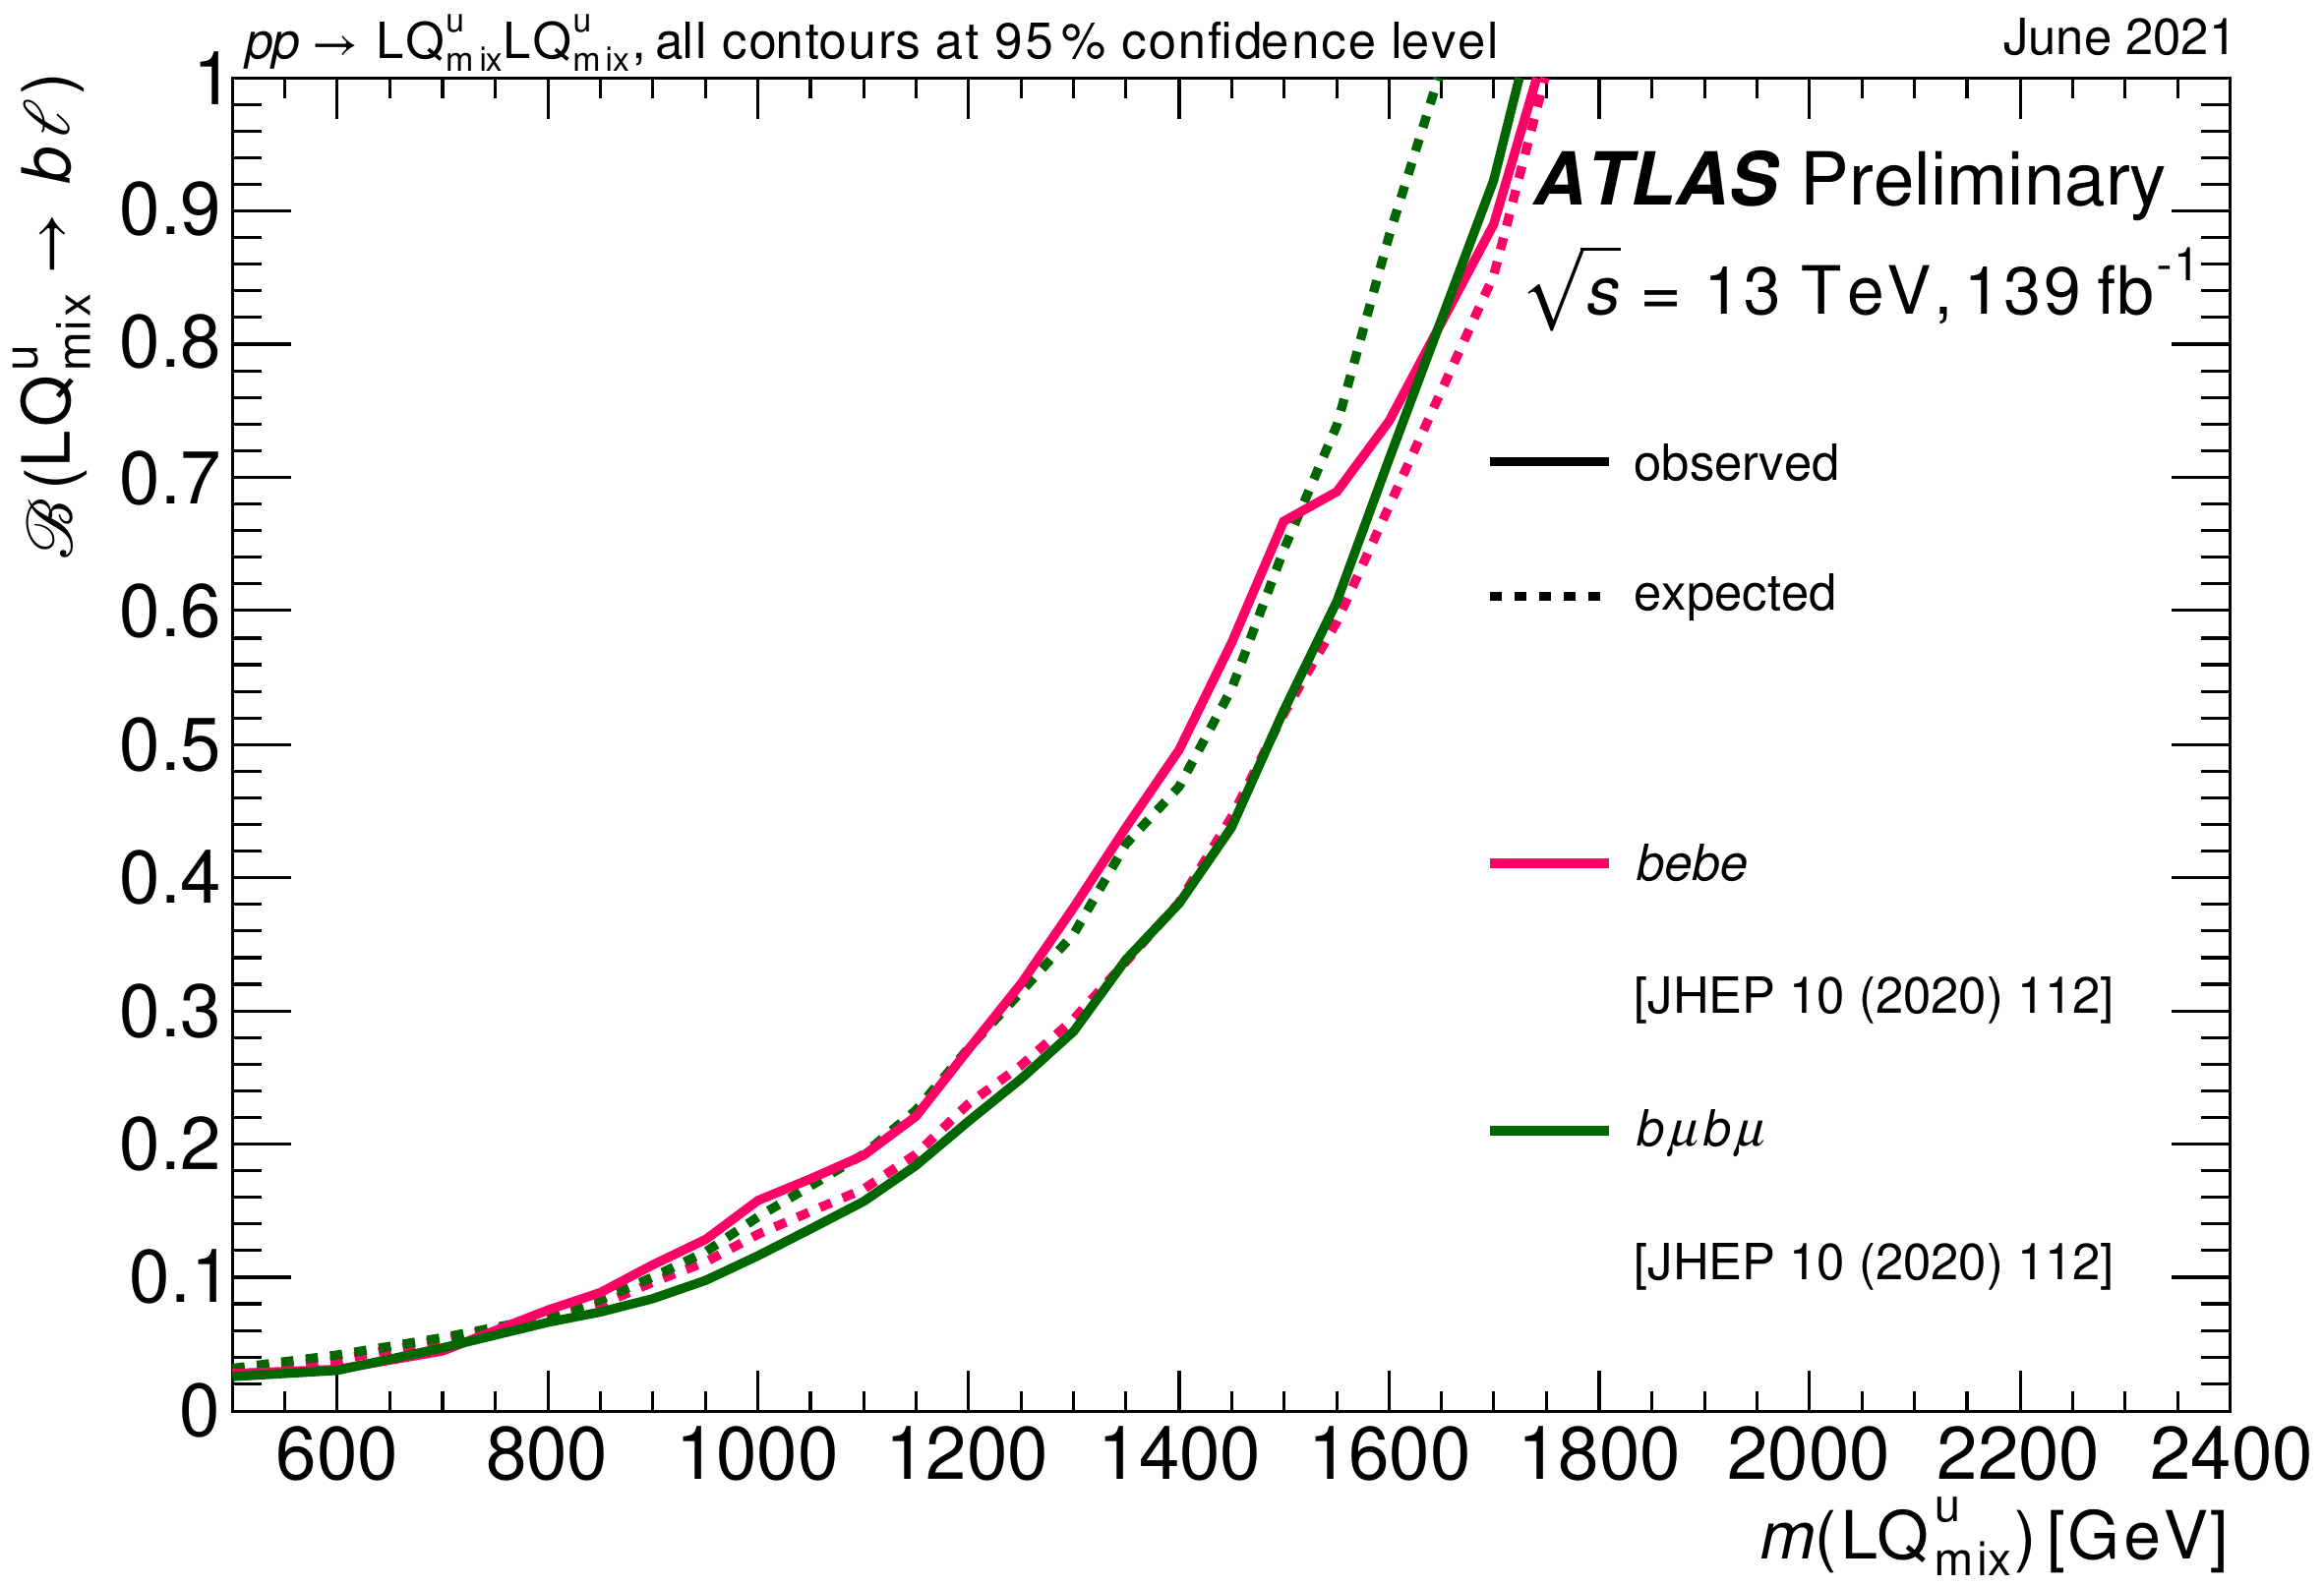
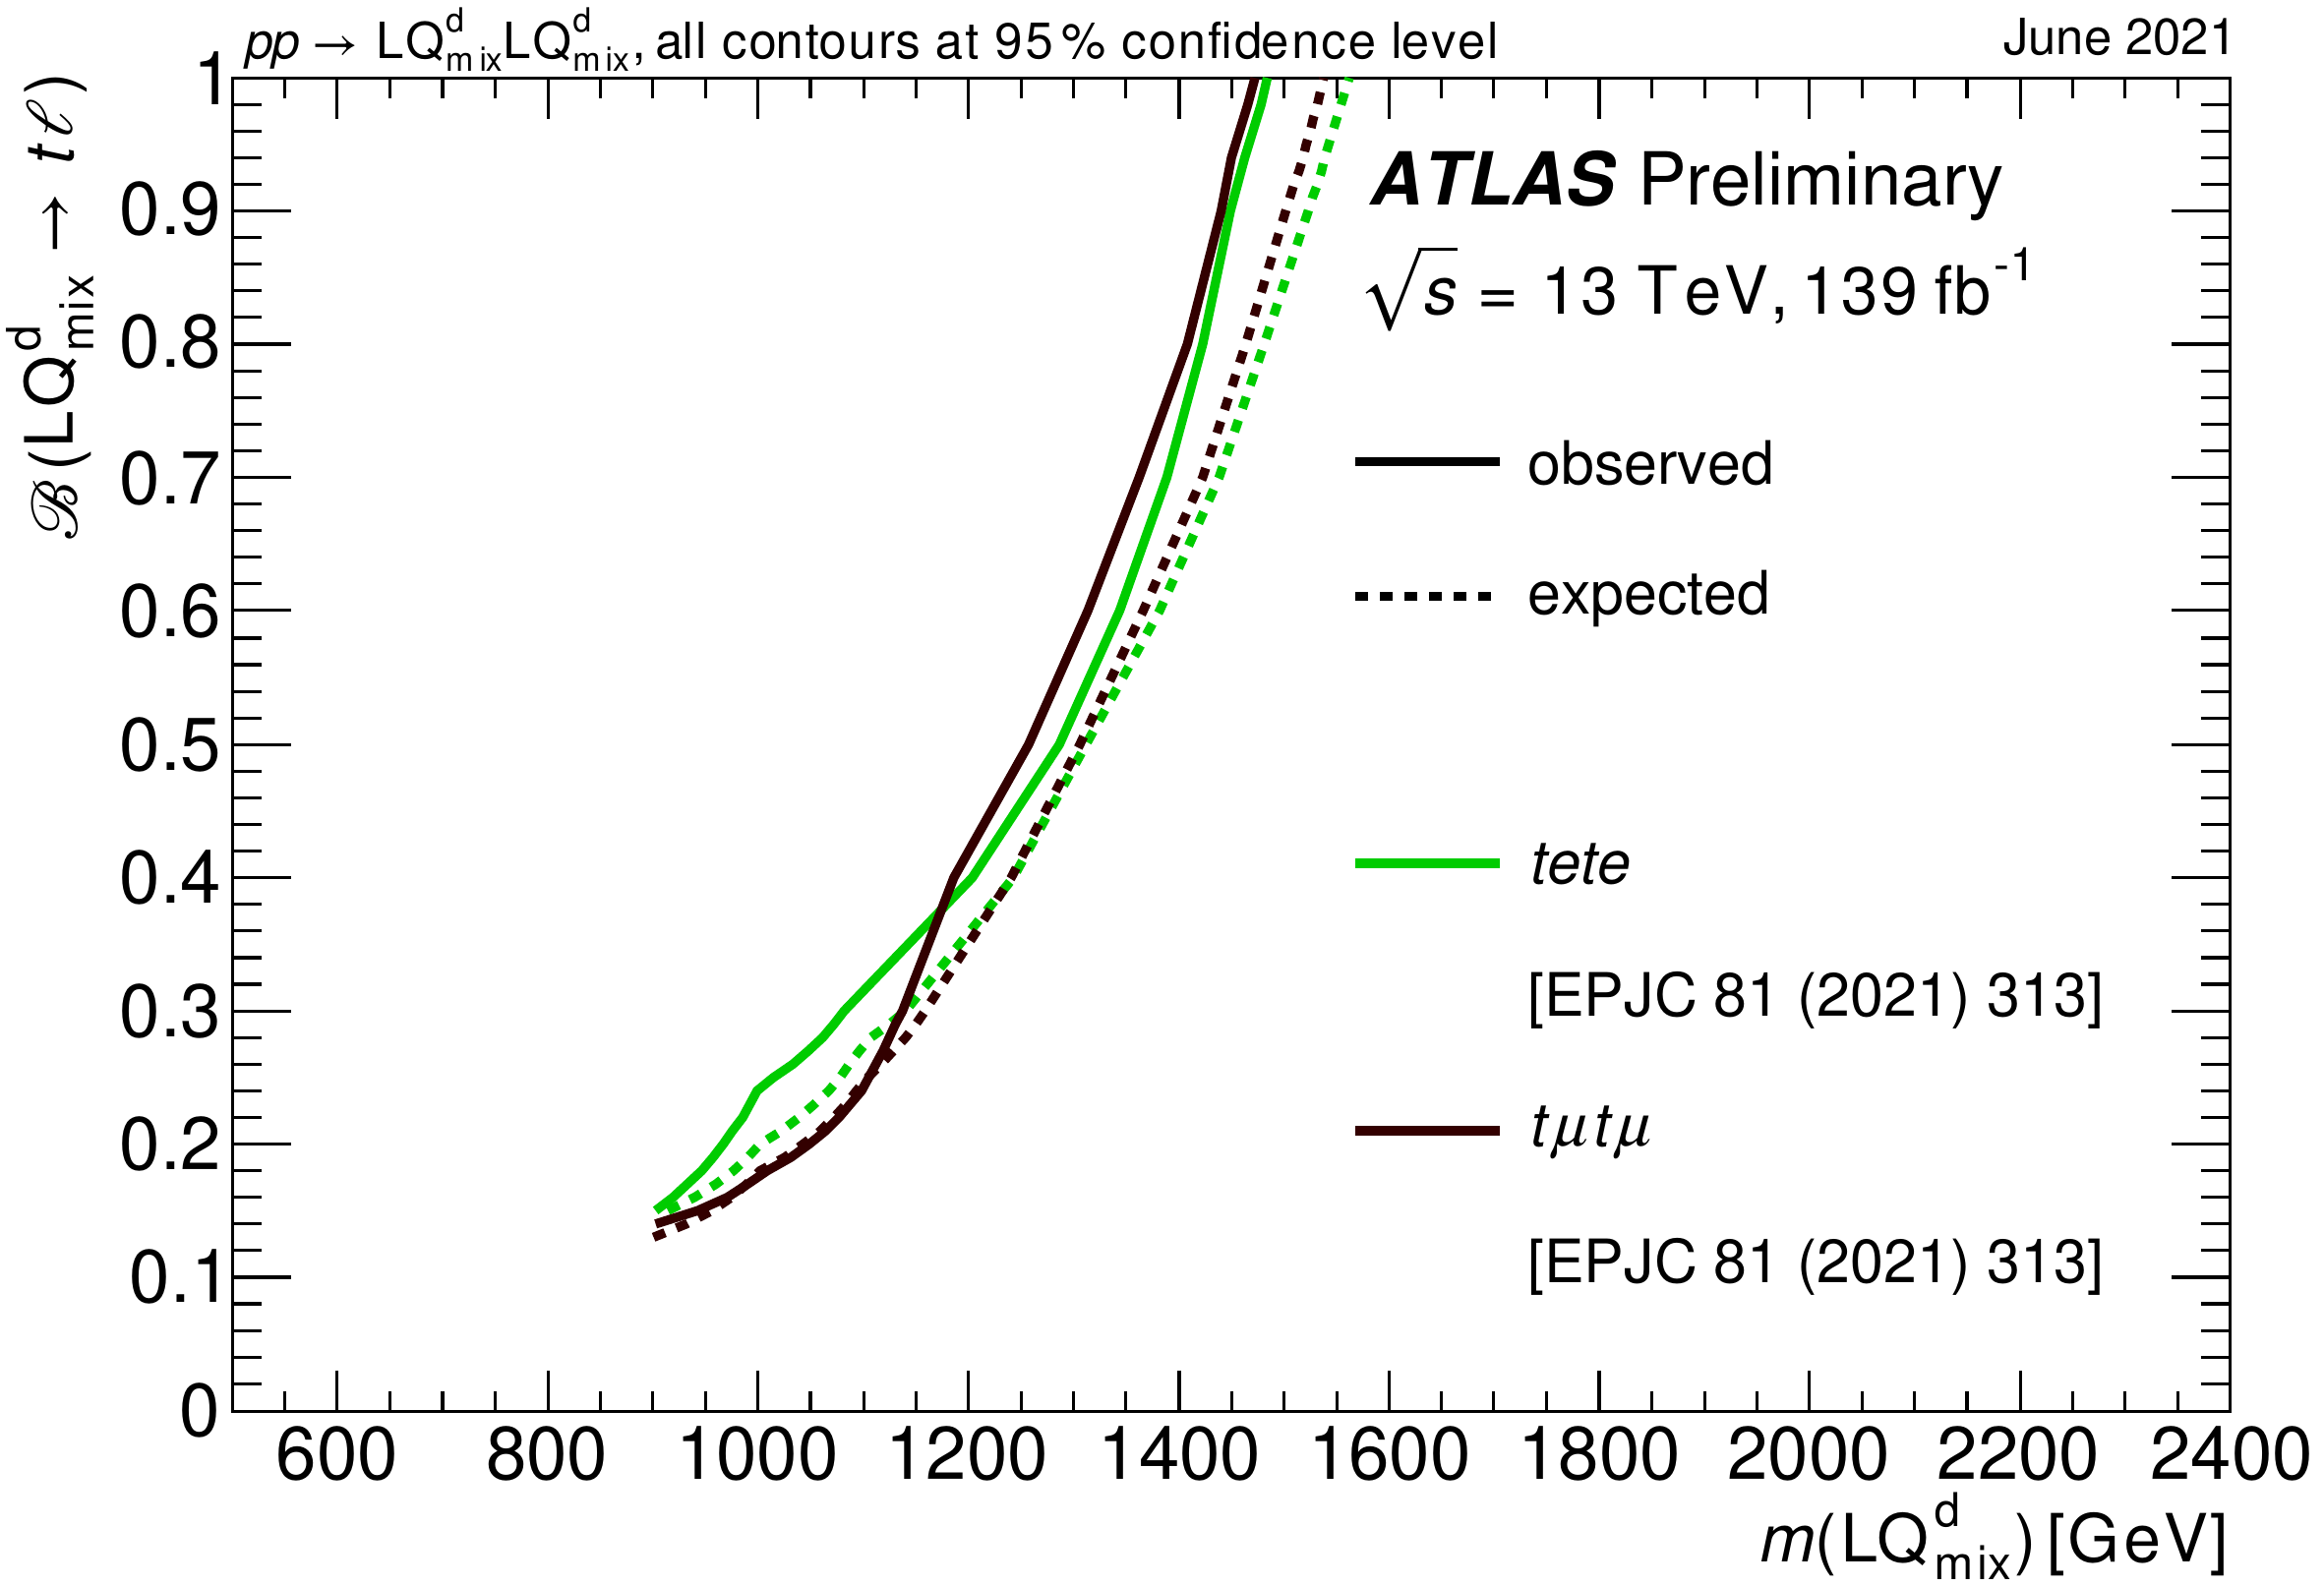
Up-type and down-type third-generation model Leptoquark ( and ) results are summarized in Figure 12 [7]. The corresponding mixed-generation results are given in Figure 13 [7].
An overview of the ATLAS results from searches for Leptoquarks are given in Table 6.
![[Uncaptioned image]](/html/2107.10094/assets/Pheno21leptoquarks/plots/summary/Limits_leptoquarks.png)
7 Leptoquark and Higgs boson searches
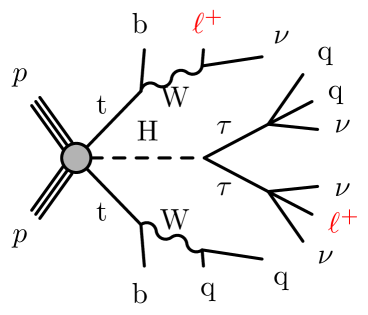
As a novel idea it is noted that there are also possibilities to reinterpret results from Higgs boson searches as limits on Leptoquarks. As an example, the final state with two light leptons and one hadronically decaying tau is given. This final state was studied in [8] production, and it has the same final state as expected in Leptoquark production (Figure 14).
8 Conclusions
There is growing interest in Leptoquarks as a possible explanation of the recently observed B-anomaly (hints for lepton flavour universality violation). Contact interaction limits TeV were set at 95% CL for ee() final states. These are not sensitive yet to probe the suggested range by B-anomaly ( TeV). Model-independent limits are set as a function of the di-lepton invariant mass. Direct searches for Leptoquarks and re-interpretations of searches for Supersymmetry exclude phase-space of 1st, 2nd and 3rd generation Leptoquarks. The current focus is on the 3rd generation, including cross-generational decays. The potential for reinterpretations of Higgs boson results is highlighted. Search results are largely statistically limited, thus more sensitivity is expected with new data. There is a large potential in flavour physics for collaborations of phenomenologists and experimentalists.
Acknowledgments
The project is supported by the Ministry of Education, Youth and Sports of the Czech Republic under project number LTT 17018.
Copyright 2021 CERN for the benefit of the ATLAS Collaboration. CC-BY-4.0 license.
References
References
- [1] LHCb Collaboration. Test of lepton universality in beauty-quark decays. arXiv 2103.11769, 2021.
- [2] ATLAS Collaboration. The ATLAS Experiment at the CERN Large Hadron Collider. JINST, 3:S08003, 2008.
- [3] ATLAS Collaboration. Search for new phenomena in final states with two leptons and one or no -tagged jets at TeV using the ATLAS detector. arXiv 2105.13847, 2021.
- [4] ATLAS Collaboration. Search for new phenomena in collisions in final states with tau leptons, -jets, and missing transverse momentum with the ATLAS detector. ATLAS-CONF-2021-008, 2021. http://cds.cern.ch/record/2759282.
- [5] ATLAS Collaboration. Search for new phenomena in final states with -jets and missing transverse momentum in TeV pp collisions with the ATLAS detector. JHEP, 2105:093, 2021.
- [6] ATLAS Collaboration. Search for a scalar partner of the top quark in the all-hadronic plus missing transverse momentum final state at TeV with the ATLAS detector. Eur. Phys. J. C, 80:737, 2020.
- [7] ATLAS Collaboration. Summary Plots from ATLAS Searches for Pair-Produced Leptoquarks. ATL-PHYS-PUB-2021-017, 2021. https://cds.cern.ch/record/2771726.
- [8] ATLAS Collaboration. Analysis of and production in multilepton final states with the ATLAS detector. ATLAS-CONF-2019-045, 2019. https://cds.cern.ch/record/2693930.