Shear Is Not Always Simple: Rate-Dependent Effects of Flow Type on Granular Rheology
Abstract
Despite there being an infinite variety of types of flow, most rheological studies focus on a single type such as simple shear. Using discrete element simulations, we explore bulk granular systems in a wide range of flow types at large strains and characterize invariants of the stress tensor for different inertial numbers and interparticle friction coefficients. We identify a strong dependence on the type of flow which grows with increasing inertial number or friction. Standard models of yielding, repurposed to describe the dependence of the stress on flow type in steady-state flow and at finite rates, are compared with data.
The rheology of many materials is often characterized by relating the shear stress to the strain rate through a scalar viscosity. However, the strain-rate tensor and the stress tensor contain more information on the flow of the system and their connection cannot necessarily be reduced to such a scalar relation as it may be more complex Schunk and Scriven (1990); Giusteri and Seto (2018). For instance, their eigenvalues may not be related by a single proportionality constant. To fully characterize the tensorial relationship between and , one must also explore more than one type of flow. In dense granular gases, significantly different behavior is observed in laminar versus shear flows Reyes et al. (2011); Wu et al. (2015).
While studies often focus on planar shear flow, there exists a continuous spectrum of types of flow. The type of flow has been found to have a significant effect on yield strength Thornton and Zhang (2010), dilatancy Goddard and Didwania (1998), and fluctuations Didwania et al. (2001) in granular materials and there is a need to develop and apply new methods to explore its effect on granular rheology. Here we measure in steady-state flow and focus on its alignment with and the dependence of a scalar shear stress [Eq. (2)] on the type of flow. This dependence or stress envelope is a surface in the three-dimensional space created by the principal stresses. It defines the set of possible principal stresses produced by a steady-state flow at a given inertial number, a dimensionless measure of strain rate defined in Eq. (7).
The dependence of shear stress on flow type at the onset of flow in granular materials is often described using simple models such as Mohr-Coulomb or Drucker-Prager Drucker and Prager (1952). While these models traditionally characterize the yield stress in the small-strain limit Nedderman (1992), they can be extended to describe steady-state flows at large strains as in the original model Jop et al. (2006). Despite frequent use, these simple models are inaccurate Thornton and Zhang (2010), and advanced models are needed to capture the shape of stress envelopes Matsuoka and Nakai (1974); William and Warnke (1975); Lade and Duncan (1975).
In this work, we use discrete element method (DEM) simulations to explore frictional granular rheology across different irrotational flow types, along with the well-studied simple shear flow. Of these flows, only simple and pure shear are planar while the others are triaxial flows. To reach large strains, we leverage generalized Kraynik-Reinelt boundary conditions Kraynik and Reinelt (1992); Dobson (2014); Hunt (2016) which have been impactful in exploring the rheology of soft materials and complex fluids O’Connor et al. (2018, 2020). This work extends results from earlier studies on the dependence of granular rheology on flow type Thornton and Zhang (2010); Huang et al. (2014); Fleischmann et al. (2014); Cheal and Ness (2018); Redaelli and Prisco (2019) to steady-state flows where we quantify the shape of the stress envelope for a wide range of inertial numbers and friction coefficients.
The relative importance of the flow type is measured in terms of a strength ratio , the ratio of the shear stress in triaxial extension (TXE) to compression (TXC). Importantly, we find that , and therefore the shape of the envelope, heavily depends on the friction coefficient and inertial number. As either of these parameters increase, decreases as the type of flow has a greater impact on rheology. Such characterizations are important for both fundamentally understanding the physics of flow and for developing tensorial formulations of granular rheology relating and Weinhart et al. (2013); Giusteri and Seto (2018); Srivastava et al. (2021); Coquand and Sperl (2021) similar to the development of microstructure-aware constitutive models of suspensions Goddard (2014). Our results are also used to assess the application of yield models to steady-state flow.
It is convenient to use the deviatoric stress and strain-rate tensors and where is the pressure, is the volumetric strain rate, and is the identity tensor. The eigenvalues of and , or their principal components, are designated as and . In granular flows, and are approximately coaxial as they have equivalent time-averaged eigenvectors seen here and in Refs. Nedderman (1992); Rycroft et al. (2009); Weinhart et al. (2013); Bhateja and Khakhar (2020). However, their eigenvalues are not always simply proportional implying the tensors are not codirectional Silbert et al. (2001); Depken et al. (2007); Rycroft et al. (2009); Weinhart et al. (2013); Srivastava et al. (2021) as further discussed below.
To quantify the magnitude of shear stress, we use the second invariant of ,
| (1) |
to define
| (2) |
The third invariant,
| (3) |
includes additional information on the direction of flow and is therefore used to define a Lode angle
| (4) |
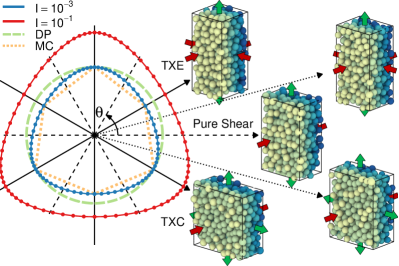
commonly used to categorize types of flow Anand and Govindjee (2020). In this definition, varies between and with the extreme cases corresponding to triaxial compression (TXC, ) and extension (TXE, ), respectively. Between these limits, a continuous spectrum of flows exists with a midpoint of corresponding to pure shear (). Equivalent invariants are defined for the strain-rate tensor : , , , and . If then and are codirectional. Systems sheared with different values of are rendered in Fig. 1.
Simulations of 40000 particles were run in LAMMPS Plimpton (1995); Thompson et al. (2021) with diameters evenly distributed between and and constant densities of , where and are units of length and mass. Similar to Refs. Srivastava et al. (2019, 2020, 2021), interactions included Hookean normal forces with a stiffness , equally stiff tangential frictional forces with a sliding friction coefficient Silbert et al. (2001), and damping forces proportional to the difference in normal and tangential velocities with prefactors of 0.5 and 0.25, respectively, corresponding to a coefficient of restitution between and , depending on particle radii Silbert et al. (2001). A velocity-Verlet integrator was used with a time step of . included both kinetic and virial contributions Allen and Tildesley (1989).
Systems were initialized below jamming for all at a volume fraction of Silbert (2010). The simulation cell was then deformed to maintain a fixed while affinely remapping particle positions. The principal components of are
| (5) | ||||
using definitions of and and the fact that since is trace free. Generalized Kraynik-Reinelt periodic boundaries were used to reach large strains Dobson (2014); Hunt (2016); Nicholson and Rutledge (2016).
To maintain a target pressure of , a Berendsen barostat was used to isotropically expand or contract the simulation cell Berendsen et al. (1984). The length of each side of the cell evolved according to
| (6) |
where is a damping time that controls how fast the barostat responds to deviations in pressure. At small values of , is nearly constant while the volume fluctuates rapidly. At , fluctuations in grow while stabilizes. While fluctuations vary considerably with , no significant effect was detected on the time-averaged stress tensor 111A subset of data was collected for values of and and no detectable effect was observed on any results in this Letter. In steady state, the time-averaged is constant and .
Initially using to accelerate compression, systems were sheared either to a strain of 0.5 or for a duration of , whichever is longer, where and is the time sheared. was then reduced to , to minimize fluctuations in at all studied rates. Above a strain of , the system is in steady-state flow and average properties do not depend on strain Noll (1962). A stress ratio and were calculated using a strain-averaged stress tensor for each combination of , , and .
We first focus on the rheology in TXE, TXC, and pure shear flow. Note that pure shear, like simple shear, is the only planar flow. At each , the rheology seen in Fig. 2 is characteristic of a monotonic relationship where
| (7) |
is the inertial number, a scaled measure of the strain rate da Cruz et al. (2005); Jop et al. (2006), and is the average particle diameter. With decreasing , decreases and approaches a limiting value in the quasistatic limit. With increasing interparticle friction , reaches at a larger value of . is maximized in TXC and decreases with increasing going to TXE. The ratio of between the TXE and TXC limits, , is known as the strength ratio Fossum and Brannon (2006) and depends on both and as further discussed below. A subset of data was also generated for pressures of and but no significant change in curves was observed reflecting the negligible pressure dependence in the hard-particle limit Jop et al. (2006); Favier De Coulomb et al. (2017); Srivastava et al. (2021).
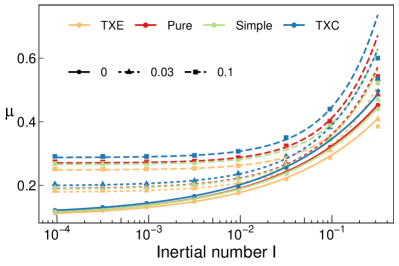
For every and , the rise in with increasing is captured by a monotonic relation:
| (8) |
where and are fitted parameters. This model is commonly used to describe dense granular rheology in simple shear Peyneau and Roux (2008); Degiuli et al. (2015); DeGiuli et al. (2016); Favier De Coulomb et al. (2017); Salerno et al. (2018); Srivastava et al. (2021) but its efficacy across a wide range of Lode angles has not yet been tested. To capture the change in with , there must be either a -dependent or . Due to challenges in fitting power-law models Clemmer et al. (2021), our data is unable to rule out either option. However, data is reasonably described using a -dependent value of and a -independent exponent of , , and for values of , , and , respectively. An increase in with has been previously identified in Refs. Degiuli et al. (2015); DeGiuli et al. (2016); Favier De Coulomb et al. (2017); Salerno et al. (2018); Srivastava et al. (2021). At large , data begins deviating from Eq. (8) and may reflect a transition to a gas regime Jaeger et al. (1996).
Despite being a rotational flow, results from simple shear simulations are also included in Fig. 2 due to its common usage da Cruz et al. (2005); Peyneau and Roux (2008); Salerno et al. (2018); Srivastava et al. (2021); Singh et al. (2020). Our simple shear data overlaps with results from Ref. Srivastava et al. (2021) which used fully stress-controlled simulations and a Nosé-Hoover barostat. In frictionless simulations, there is no significant difference between simple and pure shear. However for , simple shear curves are lower than pure shear. This is not totally unexpected as the kinematics of the flow differ subtly Giusteri and Seto (2018). This behavior could be attributed to microstructural effects Srivastava et al. (2021) although it is not explored here. These two flow types offer the best chance of generalizing rheology to more complex models such as those found in Ref. Srivastava et al. (2021). In fact, the simple shear model in Ref. Srivastava et al. (2021) would reduce to a Reiner-Rivlin type model for pure shear due to the lack of rotation.
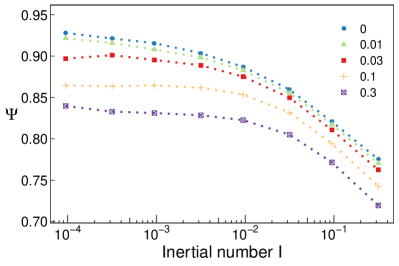
As mentioned above, is a key measure of the effect of flow type on rheology and is plotted against in Fig. 3 for different . As increases, decreases. With increasing friction , curves of shift downward and saturate at larger . Crucially, this implies the stress envelope develops a stronger dependence on flow type at higher and . Interestingly at , curves reach a value of . It is unknown to the authors whether a system could ever reach which would correspond to an isotropic rheology. From our results, this could only be possible for frictionless systems near jamming as anisotropic effects otherwise emerge Giusteri and Seto (2018); Srivastava et al. (2021).
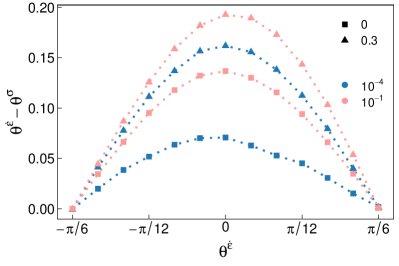
As previously mentioned, the eigenvalues of the deviatoric stress and strain-rate tensors are not always proportional implying the tensors are not codirectional. The breakdown of codirectionality is greatest at intermediate where is smaller as seen in Fig. 4. The maximum deviation is around at and but increases with increasing and up to at and . This effect originates from anisotropy in the contact network and the fabric tensor Thornton and Zhang (2010); Srivastava et al. (2021) which is greater in frictional systems Cheal and Ness (2018). In the TXE and TXC limits, this misalignment is minimized at all and and does not exceed . We therefore assume and are equivalent and the two tensors are codirectional in these limits, simplifying the following discussion of yield models. This would imply and are simply related by a proportionality constant establishing two key limits for a fully tensorial model.
Next we evaluate the shape of the steady-state envelope of the stress ratio: as a function of . Two such envelopes at different values of are rendered in Fig. 1. The symmetry of the envelope reflects the equivalence of the three principal stresses. At both , is maximized in TXC and monotonically decreases with before reaching a minimum at TXE. As increases, not only does increase but the surface becomes more triangular.
The dependence of on is often described using repurposed models of yield surfaces Phillips and Sierakowski (1965) which traditionally define the initial yielding at small strains rather than the stress envelope at constant values of in steady-state flow. In Mohr-Coulomb (MC) theory, a system flows if
| (9) |
where is the angle of internal friction Panteghini and Lagioia (2014). This model assumes the intermediate principal stress is irrelevant producing a polygonal envelope with discontinuous derivatives at (Fig. 1). The Drucker-Prager (DP) model alternatively assumes there is no dependence on the type of flow and only requires that exceeds a threshold , producing a circular profile (Fig. 1) that is only correct if . From our results and simulations in Ref. Thornton and Zhang (2010), neither model is accurate although they bound the actual response. Note that cohesive terms in yield models were ignored for granular materials.
One segment of the envelope is plotted for and in Fig. 5(a) and and in Fig. 5(b). These two sets of data are chosen as they approximately maximize and minimize , respectively. Overlaid are DP and MC curves. For DP, the critical stress ratio was simply set equal to . For MC, was used to calculate Lagioia and Panteghini (2016), although one could calculate in other flow types Fleischmann (2020). As before, neither model is accurate but MC correctly predicts .
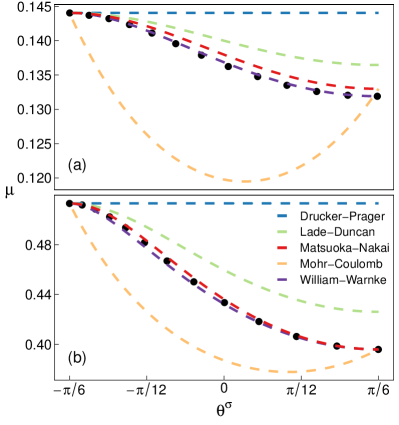
To account for this failure, more complex yield models have been devised including the William-Warnke (WW) William and Warnke (1975), Matusoka-Nakai (MN) Matsuoka and Nakai (1974), and Lade-Duncan (LD) Lade and Duncan (1975) models. The WW model interpolates between the DP and MC models using an elliptical function and is fit using values of and as described in Ref. Fossum and Brannon (2006). The MN and LD models use different combinations of stress invariants to construct yield criteria that include the effect of . For the MN and LD models, we use a unified formulation from Ref. Lagioia and Panteghini (2016) which is fit in terms of from the MC model. Fits from these models are included in Fig. 5.
All models are constrained to predict based on the fitting protocol while only the WW model is also constrained to predict , having been fit with two parameters. Both the WW and MN models are fairly accurate while the LD model overpredicts . Interestingly, this is the opposite of yielding where MN underpredicts and LD correctly predicts Thornton and Zhang (2010); Huang et al. (2014); Fleischmann et al. (2014); Fleischmann (2020). Although the WW and MN models both deviate from the data, they may be sufficiently accurate for continuum rheology models as the root-mean-square error across Lode angles is generally less than a few percentages of for all and tested.
In this work, DEM simulations were used to explore steady-state granular rheology over an extensive range of friction values, strain rates, and flow types. A dataset of the deviatoric stress tensor is available in the Supplemental Material 222See the Supplemental Material at the journal’s website for a dataset of the average stress tensor measured at all friction coefficients, Lode angles, and inertial numbers considered in this study.. The type of flow has a significant effect on granular rheology, an effect that grows with increasing friction or inertial number. The dependence on the type of flow is often simplified and described by Mohr-Coulomb or Drucker-Prager models although actual behavior lies in between the extremes of these two models. There are other granular features which can also affect the stress envelope that should be studied such as other modes of interparticle friction Singh et al. (2020); Santos et al. (2020) and aspherical grain shapes Salerno et al. (2018). Finally, these results motivate the need to formulate tensorial rheological models which describe the effect of flow type Giusteri and Seto (2018); Srivastava et al. (2021); Coquand and Sperl (2021) and parametrize them using bulk simulations across flow types along with simulations of flows in complex geometries Silbert et al. (2001); Depken et al. (2007); Rycroft et al. (2009); Bhateja and Khakhar (2020).
Acknowledgements.
I.S. acknowledges support from the U.S. Department of Energy, Office of Science, Office of Advanced Scientific Computing Research, Applied Mathematics Program under contract No. DE-AC02-05CH11231. This work was performed at the Center for Integrated Nanotechnologies, a U.S. Department of Energy and Office of Basic Energy Sciences user facility. Sandia National Laboratories is a multi-mission laboratory managed and operated by National Technology and Engineering Solutions of Sandia, LLC., a wholly owned subsidiary of Honeywell International, Inc., for the U.S. Department of Energy’s National Nuclear Security Administration under contract DE-NA-0003525.References
- Schunk and Scriven (1990) P. R. Schunk and L. E. Scriven, J. Rheol. 34, 1085 (1990).
- Giusteri and Seto (2018) G. G. Giusteri and R. Seto, J. Rheol. 62, 713 (2018).
- Reyes et al. (2011) F. V. Reyes, V. Garzó, and A. Santos, Phys. Rev. E 83, 021302 (2011).
- Wu et al. (2015) L. Wu, Y. Zhang, and J. M. Reese, J. Comput. Phys. 303, 66 (2015).
- Thornton and Zhang (2010) C. Thornton and L. Zhang, Geotechnique 60, 333 (2010).
- Goddard and Didwania (1998) J. Goddard and A. K. Didwania, Q. J. Mech. Appl. Math. 51, 15 (1998).
- Didwania et al. (2001) A. K. Didwania, Ledniczky K., and Goddard J.D., Q. J. Mech. Appl. Math. 54, 413 (2001).
- Drucker and Prager (1952) D. C. Drucker and W. Prager, Q. Appl. Math. 10, 157 (1952).
- Nedderman (1992) R. Nedderman, Statics and Kinematics of Granular Materials (Cambridge University Press, 1992).
- Jop et al. (2006) P. Jop, Y. Forterre, and O. Pouliquen, Nature 441, 727 (2006).
- Matsuoka and Nakai (1974) H. Matsuoka and T. Nakai, Proc. Jpn. Soc. Civ. Eng. , 59 (1974).
- William and Warnke (1975) K. J. William and E. P. Warnke, Proc. Int. Assoc. Bridge Struct. Eng. 19, 1 (1975).
- Lade and Duncan (1975) P. V. Lade and J. M. Duncan, J. Geotech. Eng. 101, 1037 (1975).
- Kraynik and Reinelt (1992) A. Kraynik and D. Reinelt, Int. J. Multiph. Flow 18, 1045 (1992).
- Dobson (2014) M. Dobson, J. Chem. Phys. 141, 184103 (2014).
- Hunt (2016) T. A. Hunt, Mol. Simul. 42, 347 (2016).
- O’Connor et al. (2018) T. C. O’Connor, N. J. Alvarez, and M. O. Robbins, Phys. Rev. Lett. 121, 047801 (2018).
- O’Connor et al. (2020) T. C. O’Connor, T. Ge, M. Rubinstein, and G. S. Grest, Phys. Rev. Lett. 124, 027801 (2020).
- Huang et al. (2014) X. Huang, K. J. Hanley, C. O’Sullivan, C. Y. Kwok, and M. A. Wadee, Granul. Matter 16, 641 (2014).
- Fleischmann et al. (2014) J. A. Fleischmann, M. E. Plesha, and W. J. Drugan, Geotech. Geol. Eng. 32, 1081 (2014).
- Cheal and Ness (2018) O. Cheal and C. Ness, J. Rheol. 62, 501 (2018).
- Redaelli and Prisco (2019) I. Redaelli and C. Prisco, Int. J. Numer. Anal. Methods Geomech. 43, 2525 (2019).
- Weinhart et al. (2013) T. Weinhart, R. Hartkamp, A. R. Thornton, and S. Luding, Phys. Fluids 25 (2013).
- Srivastava et al. (2021) I. Srivastava, L. E. Silbert, G. S. Grest, and J. B. Lechman, J. Fluid Mech. 907, A18 (2021).
- Coquand and Sperl (2021) O. Coquand and M. Sperl, Phys. Rev. E 104, 014604 (2021).
- Goddard (2014) J. D. Goddard, Acta Mech. 225, 2239 (2014).
- Rycroft et al. (2009) C. H. Rycroft, K. Kamrin, and M. Z. Bazant, J. Mech. Phys. Solids 57, 828 (2009).
- Bhateja and Khakhar (2020) A. Bhateja and D. V. Khakhar, Phys. Fluids 32 (2020).
- Silbert et al. (2001) L. E. Silbert, D. Ertas, G. S. Grest, T. C. Halsey, D. Levine, and S. J. Plimpton, Phys. Rev. E 64, 051302 (2001).
- Depken et al. (2007) M. Depken, J. B. Lechman, M. van Hecke, W. van Saarloos, and G. S. Grest, Europhys. Lett. 78, 58001 (2007).
- Anand and Govindjee (2020) L. Anand and S. Govindjee, Continuum Mechanics of Solids (Oxford University Press, 2020).
- Plimpton (1995) S. Plimpton, J. Comput. Phys. 117, 1 (1995).
- Thompson et al. (2021) A. P. Thompson, H. M. Aktulga, R. Berger, D. S. Bolintineanu, W. M. Brown, P. S. Crozier, P. J. in ’t Veld, A. Kohlmeyer, S. G. Moore, T. D. Nguyen, R. Shan, M. Stevens, J. Tranchida, C. Trott, and S. J. Plimpton, Comput. Phys. Commun. 271, 108171 (2021).
- Srivastava et al. (2019) I. Srivastava, L. E. Silbert, G. S. Grest, and J. B. Lechman, Phys. Rev. Lett. 122, 048003 (2019).
- Srivastava et al. (2020) I. Srivastava, J. B. Lechman, G. S. Grest, and L. E. Silbert, Granul. Matter 22, 41 (2020).
- Allen and Tildesley (1989) M. Allen and D. Tildesley, Computer Simulation of Liquids, Oxford Science Publ (Clarendon Press, 1989).
- Silbert (2010) L. E. Silbert, Soft Matter 6, 2918 (2010).
- Nicholson and Rutledge (2016) D. A. Nicholson and G. C. Rutledge, J. Chem. Phys. 145, 244903 (2016).
- Berendsen et al. (1984) H. J. Berendsen, J. P. Postma, W. F. Van Gunsteren, A. Dinola, and J. R. Haak, J. Chem. Phys. 81, 3684 (1984).
- Note (1) A subset of data was collected for values of , , , and and was not found to have any detectable effect on any results in this Letter.
- Noll (1962) W. Noll, Arch. Ration. Mech. Anal. 11, 97 (1962).
- da Cruz et al. (2005) F. da Cruz, S. Emam, M. Prochnow, J.-N. Roux, and F. Chevoir, Phys. Rev. E 72, 021309 (2005).
- Fossum and Brannon (2006) A. F. Fossum and R. M. Brannon, Acta Geotech. 1, 89 (2006).
- Favier De Coulomb et al. (2017) A. Favier De Coulomb, M. Bouzid, P. Claudin, E. Clément, and B. Andreotti, Phys. Rev. Fluids 2, 102301 (2017).
- Peyneau and Roux (2008) P.-E. Peyneau and J.-N. Roux, Phys. Rev. E 78, 011307 (2008).
- Degiuli et al. (2015) E. DeGiuli, G. Düring, E. Lerner, and M. Wyart, Phys. Rev. E 91, 062206 (2015).
- DeGiuli et al. (2016) E. DeGiuli, J. N. McElwaine, and M. Wyart, Phys. Rev. E 94, 012904 (2016).
- Salerno et al. (2018) K. M. Salerno, D. S. Bolintineanu, G. S. Grest, J. B. Lechman, S. J. Plimpton, I. Srivastava, and L. E. Silbert, Phys. Rev. E 98, 050901(R) (2018).
- Clemmer et al. (2021) J. T. Clemmer, K. M. Salerno, and M. O. Robbins, Phys. Rev. E 103, 042605 (2021).
- Jaeger et al. (1996) H. M. Jaeger, S. R. Nagel, and R. P. Behringer, Rev. Mod. Phys. 68, 1259 (1996).
- Singh et al. (2020) A. Singh, C. Ness, R. Seto, J. J. de Pablo, and H. M. Jaeger, Phys. Rev. Lett. 124, 248005 (2020).
- Phillips and Sierakowski (1965) A. Phillips and R. L. Sierakowski, Acta Mech. 1, 29 (1965).
- Panteghini and Lagioia (2014) A. Panteghini and R. Lagioia, Int. J. Numer. Anal. Methods Geomech. 38, 349 (2014).
- Lagioia and Panteghini (2016) R. Lagioia and A. Panteghini, Proc. R. Soc. A 472, 20150713 (2016).
- Fleischmann (2020) J. A. Fleischmann, Geotech. Geol. Eng. 38, 5409 (2020).
- Note (2) See the Supplemental Material at the journal’s website for a dataset of the average stress tensor measured at all friction coefficients, Lode angles, and inertial numbers considered in this study. .
- Santos et al. (2020) A. P. Santos, D. S. Bolintineanu, G. S. Grest, J. B. Lechman, S. J. Plimpton, I. Srivastava, and L. E. Silbert, Phys. Rev. E 102, 032903 (2020).