[1]\fnmHenry \surWatkins [1]\fnmParashkev \surNachev
[1]\orgdivQueen Square Institute of Neurology, \orgnameUniversity College London, \orgaddress\cityLondon,\countryUnited Kingdom 2]\orgdivSchool of Biomedical Engineering & Imaging Sciences, \orgnameKing’s College London, \orgaddress\cityLondon, \countryUnited Kingdom 3]\orgnameUniversity College London, \orgaddress\cityLondon,\countryUnited Kingdom
Neuradicon: operational representation learning of neuroimaging reports
Abstract
Radiological reports typically summarize the content and interpretation of imaging studies in unstructured form that precludes quantitative analysis. This limits the monitoring of radiological services to throughput undifferentiated by content, impeding specific, targeted operational optimization. Here we present Neuradicon, a natural language processing (NLP) framework for quantitative analysis of neuroradiological reports. Our framework is a hybrid of rule-based and artificial intelligence models to represent neurological reports in succinct, quantitative form optimally suited to operational guidance. We demonstrate the application of Neuradicon to operational phenotyping of a corpus of 336,569 reports, and report excellent generalizability across time and two independent healthcare institutions.
keywords:
Natural Language Processing, Neurology, Neuroradiology, Artificial Intelligence1 Introduction
Neuroradiological reports capture a crucial aspect of the management of patients with neurological disorders, providing radiologist-defined interpretations of imaging as part of the broader electronic health record (EHR) Esteva2019 . Although reporting practices increasingly include structured elements, the complexity of the task compels free prose as the dominant form of communication. This complicates the task of quantitative analysis of radiological content—as opposed to volume—on which the evidence-guided operational optimization of radiological services inevitably depends. A report processing system that can reliably extract operationally-relevant information is fundamental to capturing service workload with adequate fidelity.
Recent developments in the field of natural language processing (NLP) Jurafsky:2009:SLP:1214993 have opened the door to extracting quantitative representations of complex clinical texts, enabling excellent performance in real-world settings wu2020deep . The task nonetheless remains challenging, especially where—as in neuroradiology—both vocabulary and logical grammar may be unusual, and the minimal acceptable standard of fidelity is high. The components of the task generally consist of tokenisation, named entity recognition (NER) and negation detection, along with aligning entities to a structured ontology Pons2016 or other domain-specific frameworks. The key difficulty in training and validating machine learning models here is the paucity of domain-specific training data, and the complexity of aggregating data at scale given privacy and security constraintsSheikhalishahi2019 . Moreover, manual labelling of clinical reports is time-consuming, and requires specialist domain knowledge of low availability and high cost. The sensitivity of clinical data is complicated by the difficulty of reliable anonymisation in a setting where proper names have a multiplicity of uses besides reference to an individual (e.g. eponymous syndromes).
In the field of neuroradiology, the information of operational interest divides across pathological appearances, their anatomical locations, instrumental factors of relevance to interpretation, and such diagnostic conclusions as the appearances justify. In particular, knowing what has been observed where, enables stratification of the imaged population by machine-generated latent representational phenotypes, database queries of individual features of operational concern, such as contrast utilization, and modelling of the distribution of patient radiological appearances. Rich featurisation of reports can both guide actions relevant to service delivery and provide a mechanism for interrogating the contents of the associated image within multi-modal models of text and imaging, amplifying the operational value of the system. Here we present a pipeline crafted with these objectives in mind in the context of a service optimisation project at University College London Hospitals NHS Trust.
Numerical text representation methods such as word2vec Mikolov2013 and Glove pennington2014glove , as well as term-frequency-inverse-document-frequency vectorisation (TF-IDF), have been used to classify texts using logistic regression or support vector machines (SVM). Szlosek and Ferretti Szlosek2016 used a SVM to classify clinical texts as normal or abnormal or needing review categories, while Chen et al. Chen2018 used a TF-IDF vectorisation of CT and MRI reports to classify them using an SVM into ’stable’, ’progression’, ’improvement’ or ’no cancer’ categories. Further works have introduced domain specific biomedical transformer models, like BioBert lee2020biobert and BioGPT luo2022biogpt . These models have provided the most recent advances in performance for drug detection, NER and biomedical text classification.
Aside from NER, another critical task in information extraction is negation detection. Here the aim is to classify a clinical concept present in the text as negated or not, an area of special importance in medicine where the absence of a relevant feature may be just as important as its presence, and in equal need of explicit statement. One rules-based method to achieve this in the field of medical text is Negbio peng2018negbio . Negbio uses grammatical patterns across the dependency parse tree to evaluate whether a concept is negated or not. The universal dependency tree was designed to provide a tree description of the grammatical relationships in a sentence and used by downstream language processing tasks. All universal dependency information can be represented by a directed graph, the vertices of which are labelled with the word and part-of-speech. Work by Sykes et al. Sykes2021 has found that while machine learning approaches are effective, rules-based methods like Negbio perform equally well.
The grammatical dependency parse tree can also be used for relation extraction, whereby we relate two entities tagged by an NER model using their grammatical relationship. RelEx, introduced by Fundel et al. Fundel2007 , showed how this method could extract pairs of entities in a biomedical text with a particular semantic relationship. In particular, they found examples of gene-protein interactions based on abstracts describing human gene and protein interaction studies. However, this method could also be used for a broader range of semantic relationships. Deep learning methods for relation extraction have also been explored, with Li et al. Li2019 using a neural network to model the shortest dependency path in clinical text.
In neuroradiology, rules-based systems such as EDIE-R Alex2019 are able to extract entities and relations, and have been used to phenotype patients using radiological reports Wheater2019 . An extension to neural-network methods found approximately equal performance on a neuroradiological dataset Gorinski2019 . While these results are promising for neuroradiology, we aim to leverage the progress with language models and domain-specific pre-training to create a comprehensive NLP pipeline. This pipeline needs not only to extract named entities and clinical concepts but also to use context-aware numerical representations to classify texts, to recognise negation, to segment reports into relevant sections, and to discover whether a report is compared with previous imaging.
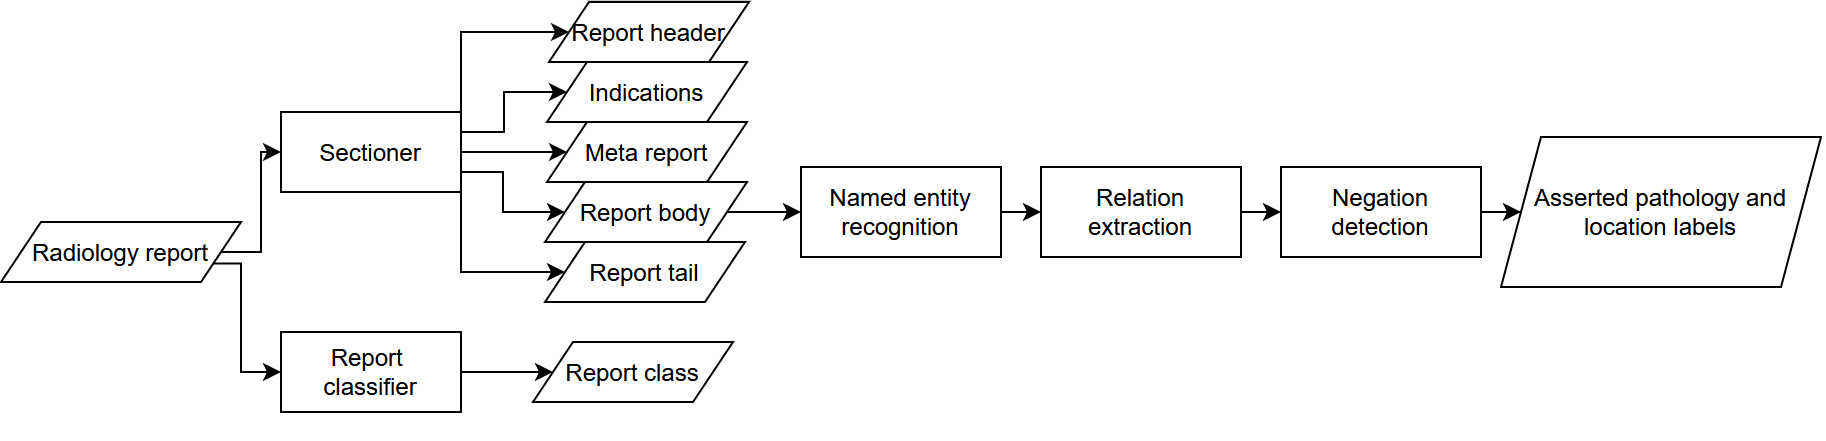
Here we describe ‘Neuradicon’, a framework for deriving rich, quantitative representations of neuroradiological free text reports with the purpose of facilitating the content-aware operational optimization of neuroradiological services. Neuradicon performs a sequence of tasks, each with an associated model, combining rule-based, deep learning, and traditional machine-learning algorithms. While deep learning methods can lead to great improvements in performance across many tasks, conventional methods are sufficient for many components the pipeline and reduce the minimal computational footprint, an important consideration in resource-challenged healthcare environments. The complete list of tasks is as follows:
-
1.
Report classification: classifying reports free from pathological appearances, or rendered potential elliptic by comparison with previous imaging. This stage acts as a filter, to identify interpretable reports.
-
2.
Section classification: assigning sentences to separate sections of the report.
-
3.
Named entity recognition: finding tokens that are clinically relevant named entities.
-
4.
Negation detection: classifying named entities as negated or not.
-
5.
Relation extraction: discovering semantic relations between named entities in the text.
-
6.
Pathological domain classification: classifying a report into one or more pathological domains.
-
7.
Report clustering: where we find a low-dimensional representation of a report for unsupervised phenotyping and finding similar reports.
Our paper proceeds as follows, in section 2 we describe the resulting performance of our pipeline on real cross-site clinical labelled data from both University College London Hospital (UCLH) and King’s College Hospital (KCH). In section 2.2 we present the latent embedding space for appearances present in radiological reports; we describe the patterns in pathological appearances that are now clear when viewed in this unsupervised manner. Section 2.3 covers the application of spatial statistical inference to our neuroradiology space, where we identify key regions and explain their contents. In section 2.4 we describe the results of our phenotyping procedure defined in section 4.11. Descriptions of our pipeline methods and data sets can be found in sections 4.1 to 4.12. In section 3 we discuss the impact and application of this model in the context of practice and our results.
2 Results
2.1 Performance Metrics
The data sets described in 4.1 allow us to evaluate the performance of each of the respective information extraction tasks. The performance for these tasks on held-out data, both prospective and cross-site, is measured in terms of micro precision-recall-f1 metrics presented in table 1.
| Task | precision | recall | f1-score |
|---|---|---|---|
| Report classification | 0.96 | 0.96 | 0.96 |
| Section classification | 0.93 | 0.92 | 0.93 |
| Negation detection | 0.97 | 0.90 | 0.93 |
| Relation extraction | 0.82 | 0.77 | 0.79 |
| Pathological domain classification (UCLH) | 0.96 | 0.93 | 0.94 |
| Pathological domain classification (KCH) | 0.92 | 0.83 | 0.87 |
| Prospective domain classification (UCLH) | 0.97 | 0.96 | 0.96 |
| Prospective domain classification (KCH) | 0.95 | 0.97 | 0.96 |
| \botrule |
Note the ultimate task here is pathological domain classification, where excellent fidelity is maintained both across time and site, despite inevitable variations in reporting styles and digital documentation systems.
2.2 Representation learning
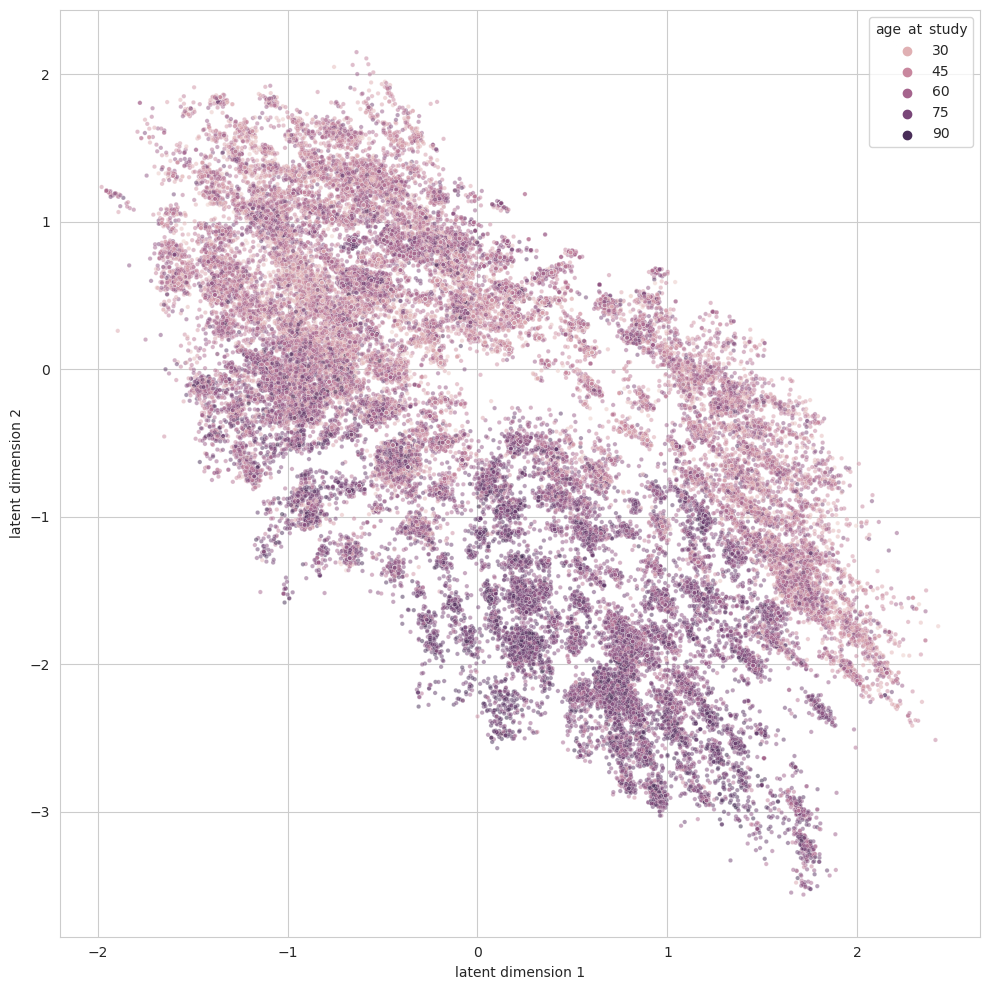
The entire corpus of UCLH neuroradiological reports was embedded into a 2-dimensional latent space with a deep auto-encoder of asserted pathological terms as described in 4.10. This comprehensive representation can be viewed as a surveyable ‘universe’ of neuroradiology, organized into constellations of characteristic patterns of pathological appearances as described and interpreted by radiologists. Annotating the representation with individual variables—both internal and external—provides an indication of the drivers of the underlying structure, and applying topological inference allows us to demarcate regions of the manifold significantly associated with characteristics of operational interest.
Age, shown in fig. 2, a variable external to the model, reveals variation in age-related patterns of pathological appearances across the latent space.
Visual inspection of the latent space reveals patterns of organisation coherent with the ontological structure of neuroimaging appearances. Disentangled areas of the representation are identifiable for the most common domains: ischaemic, haemorrhagic, neurodegenerative, inflammatory, and neoplastic (with and without treatment). Fig. 3 shows a clear subregion of ischaemia-dense reports concentrated in the lower half of the space. Pathological domains that are rarer or more heterogeneous in their description are less well demarcated. Relations between domains are inspectable through joint labelling, e.g. age and treatment as illustrated in fig. 3, where colouring the reports of the treatment class by age shows clearly demarcated regions, some with a dominant age structure.
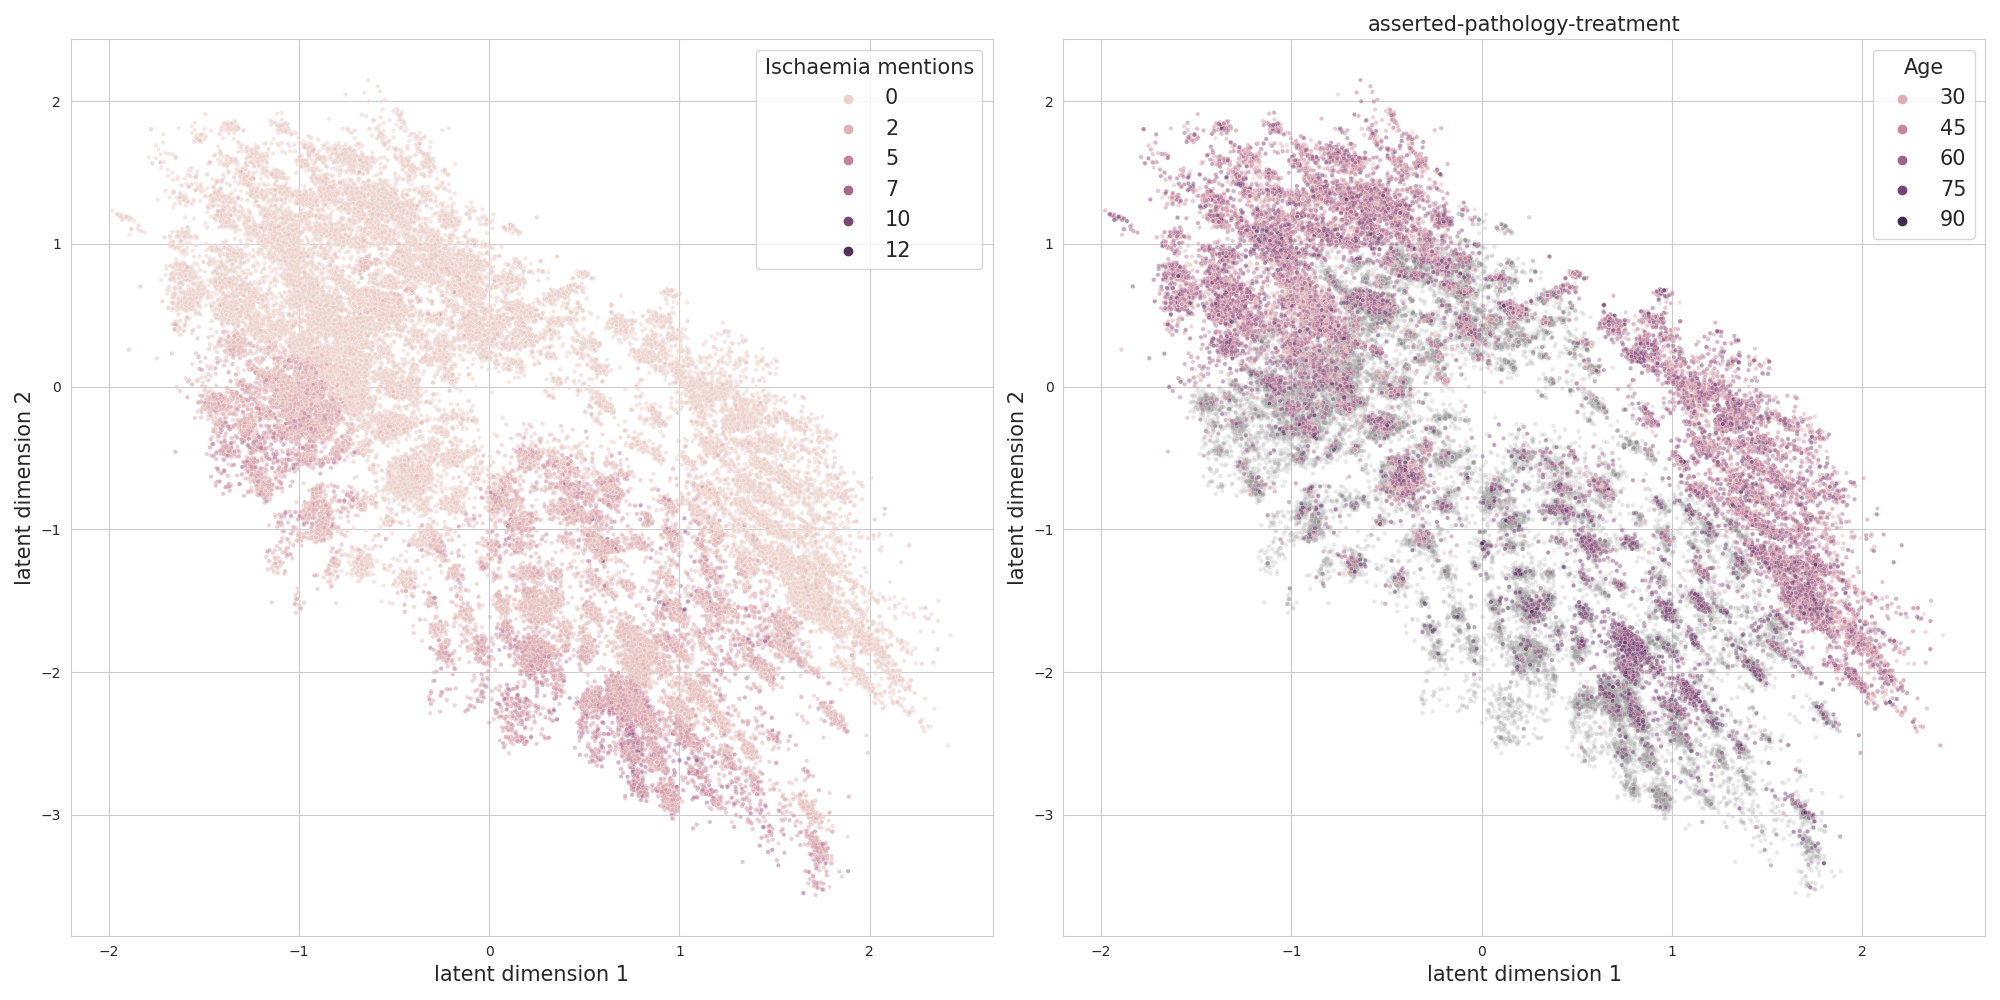
Ischaemic and treatment domains are the largest, the latter dominated by neoplasia. Ischaemic regions are differentiated by the temporality of clinical presentation, and the presence or absence of associated haemorrhagic changes. This is illustrated in fig. 4. The heterogeneity of haemorrhagic changes, arising in the context of multiple distinct pathological processes, is evident in their wide distribution. Aneurysmal disease is distributed across the haemorrhagic and ischaemic regions, and with cavernomas represented as a clear sub-region of haemorrhagic disease.

The neoplastic domain commands a significant area of the latent space, with a broad overlap with treatment (fig. 5). The territory is segregated by common tumour types, and diagnosis-specific interactions with treatment, e.g. well-defined areas for meningiomas and post surgical change.

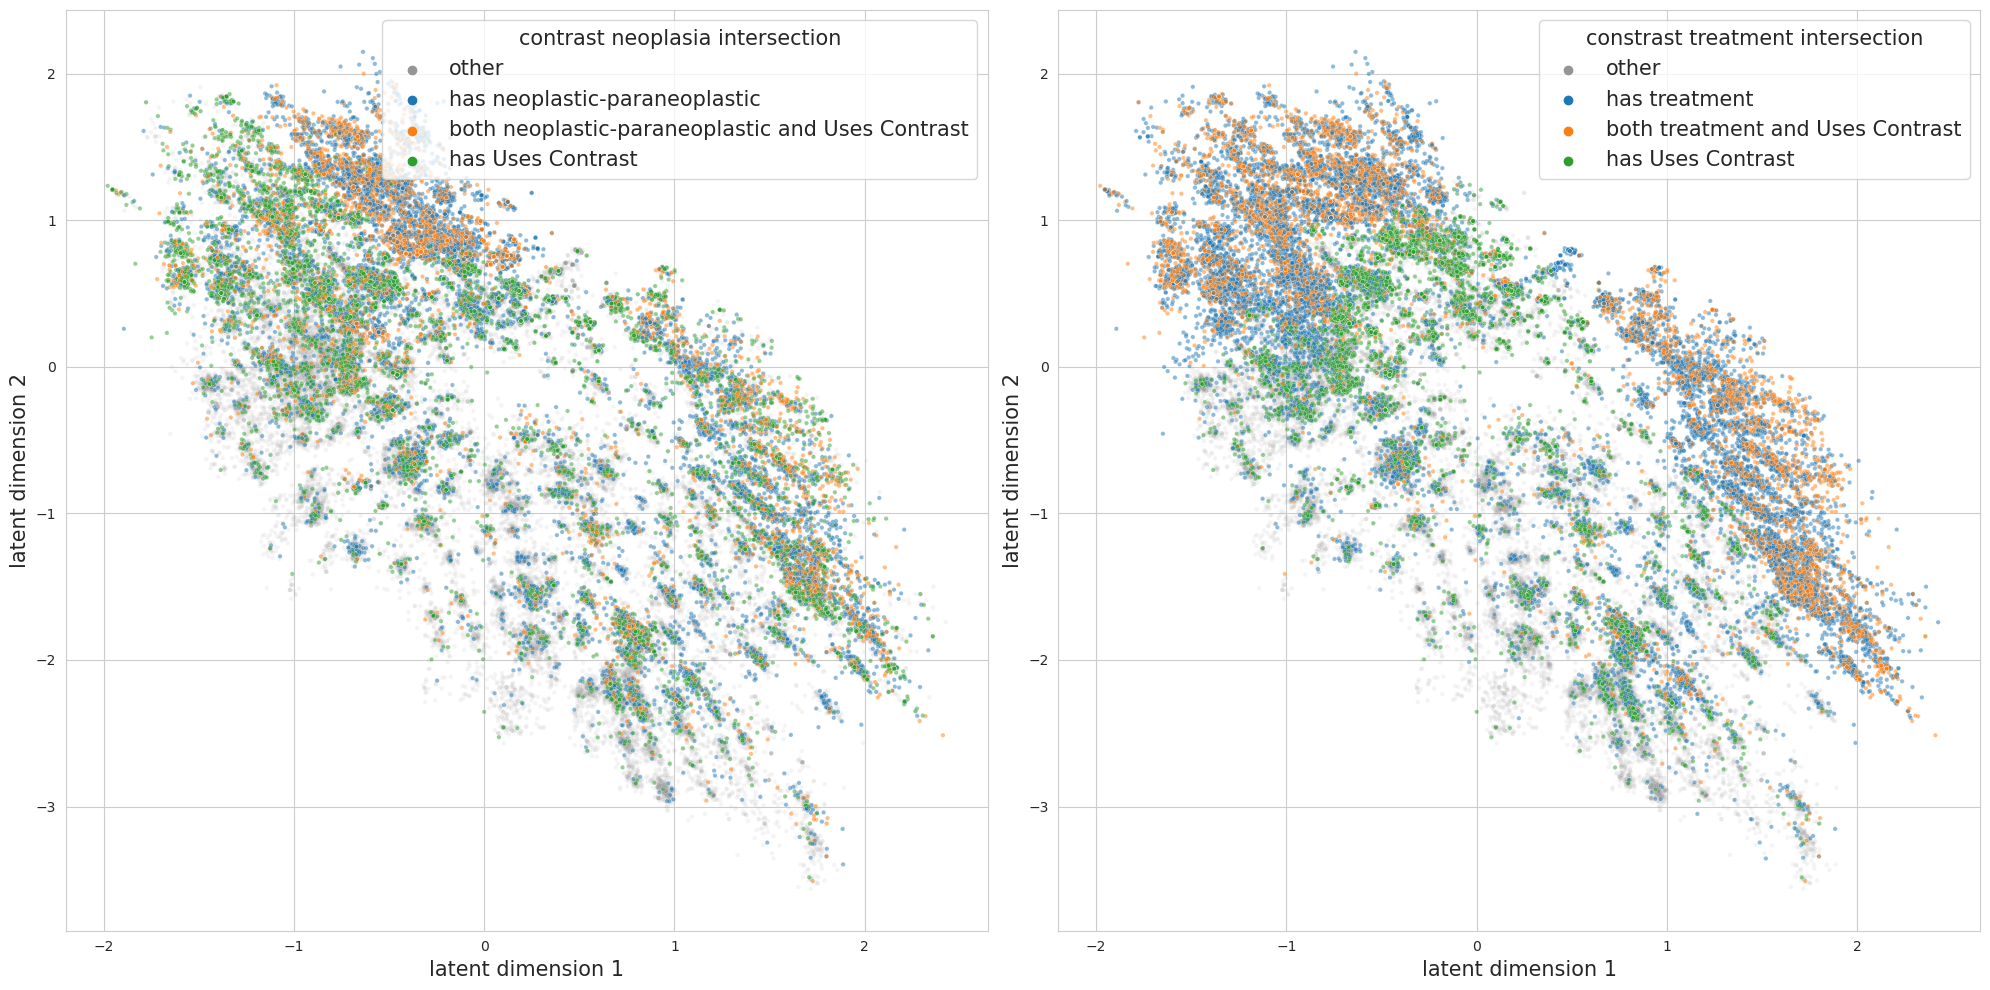
Our model also allows for the stratification of reports by scan modality, use of contrast and ordering clinician, permitting the generation of operational insights around the use of specific treatment modalities and pathways in relation to the content of imaging reports. For example, figure 6 shows the intersection of contrast usage and neoplastic or treatment classes. We can also identify the distribution of reports that describe a contrast-administered scan for patients with neoplastic or paraneoplastic conditions. We find a significant distribution of contrast usage across the space of reports in the treatment class.
2.3 Spatial Inference
We can use topological inference to formalise the task of identifying regions of interest. We use GeoSPM to derive statistical maps identifying sub-regions significantly associated with a given feature, controlled for the influence of confounding variables. The procedure is detailed in section 4.12. Figure 7 shows the regression coefficient maps for patient age and treatment domains.
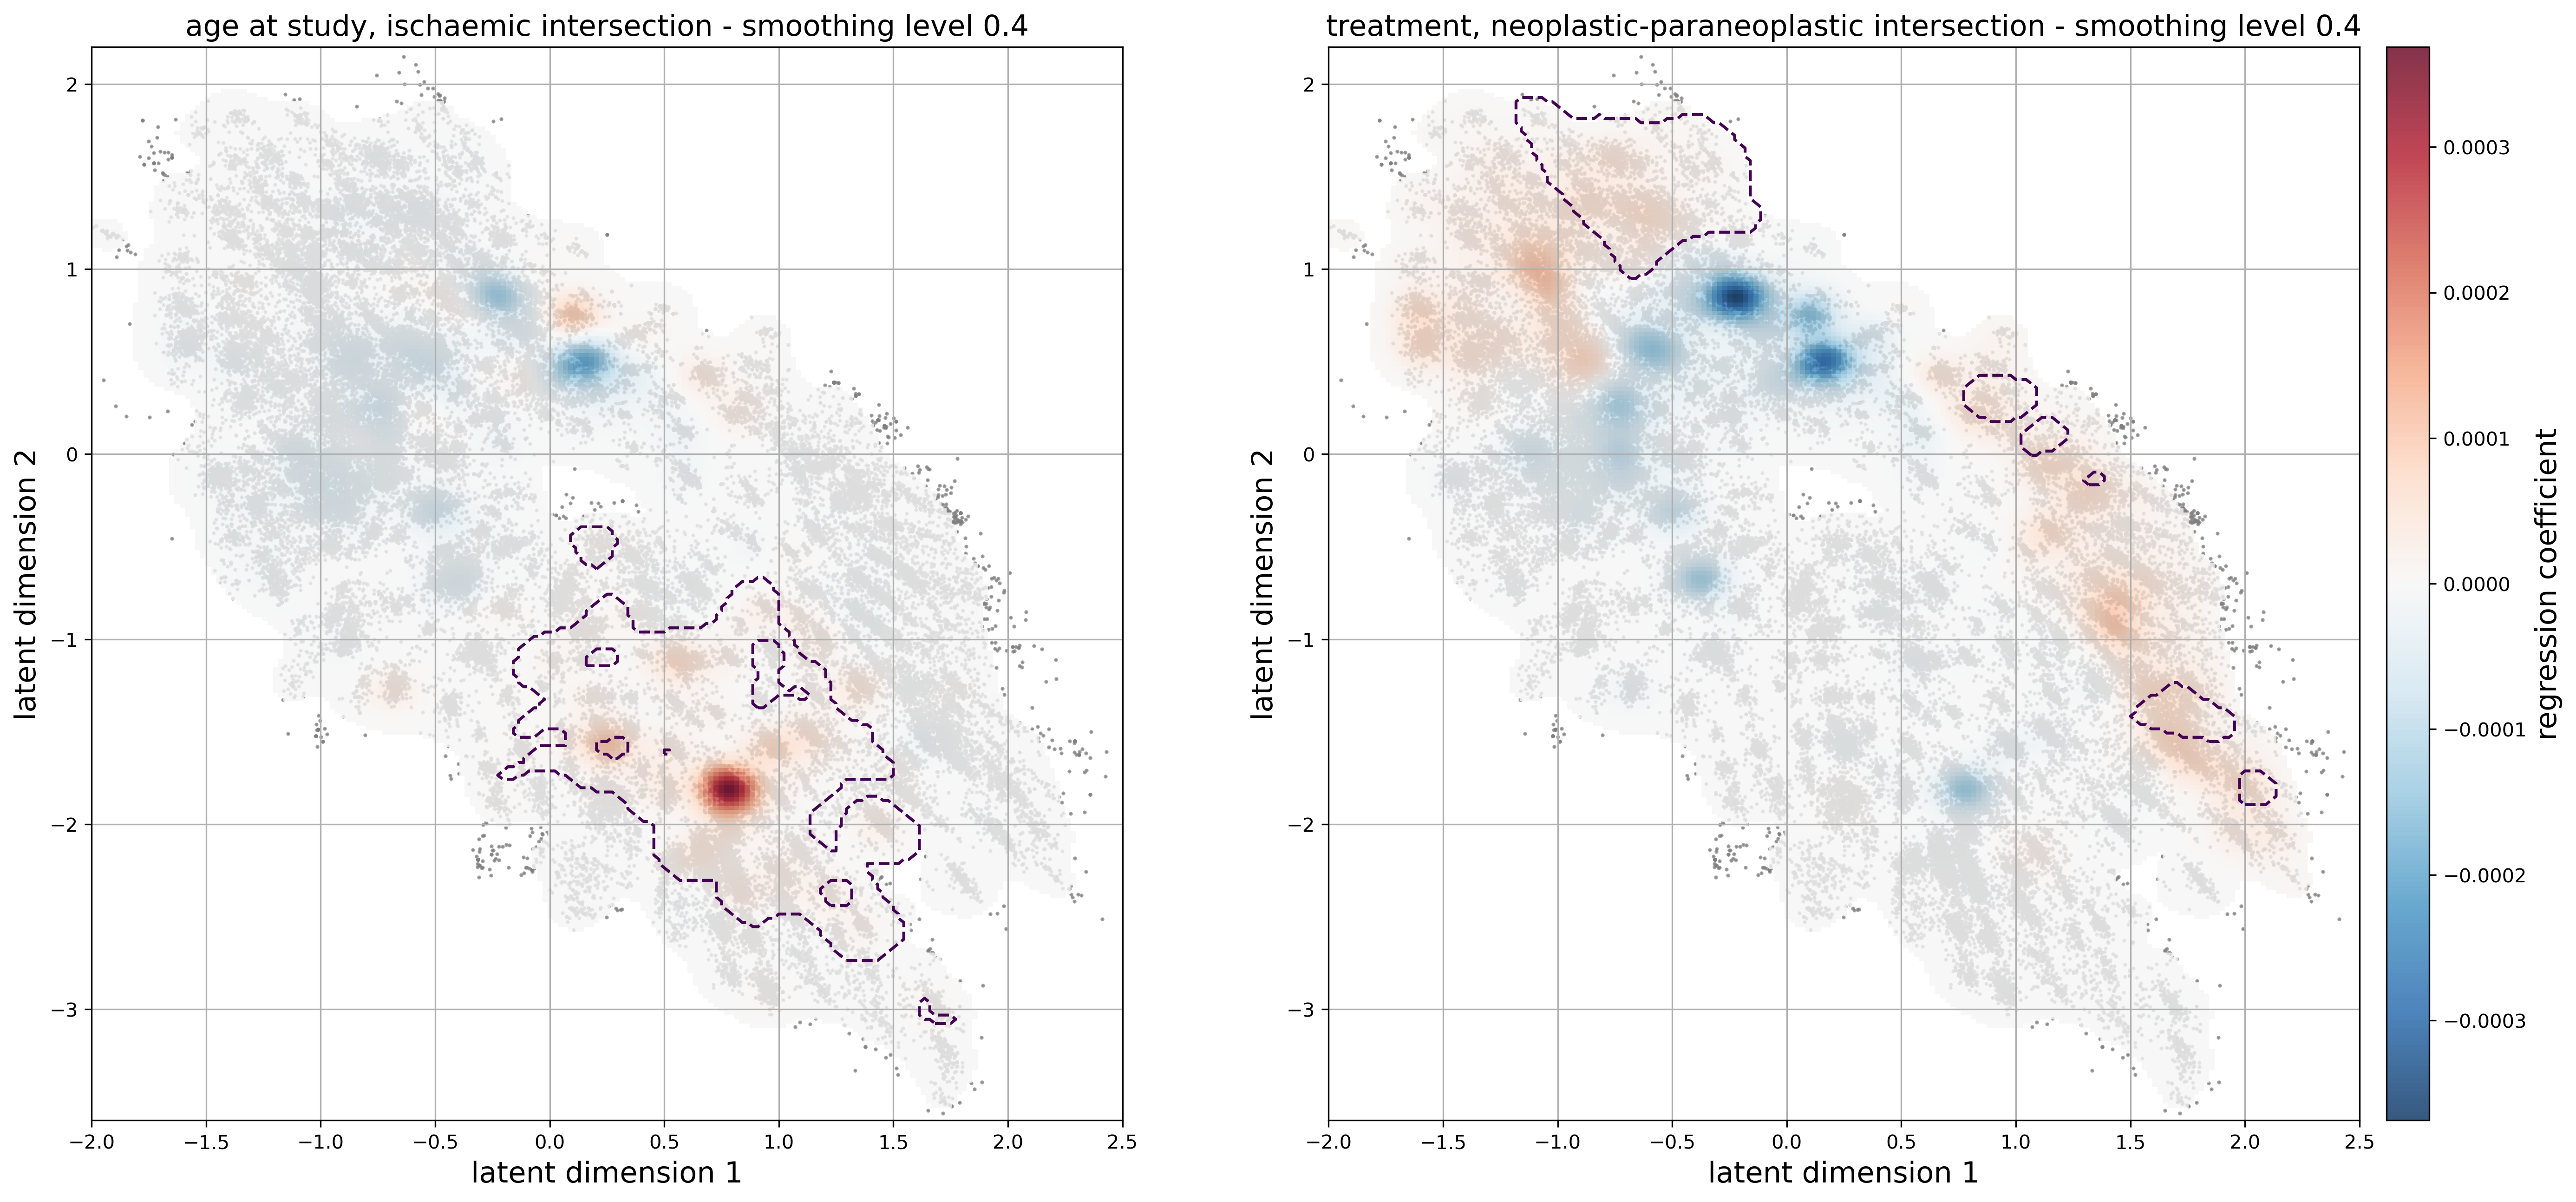
Spatial inference performed with geoSPM shows regions of high significance for particular spatially distributed variables. These maps ground our intuition informed by the metadata-overlay figures. Figure 7 identifies clear regions of statistically significant regression coefficient value for patient age and for treatment, indicating sub-regions where these features are particularly important. One can go further and identify topological relations between variables. GeoSPM can do this by mapping jointly modulated areas arising from the conjunction of two or more thresholded t-statistic maps. Figure 7 shows the conjunction of age and ischaemia, corresponding to the regions where age and more ischaemia coincide. We also identify clear islands jointly modulated by neoplasia and treatment.
2.4 Imaging Report Phenotypes
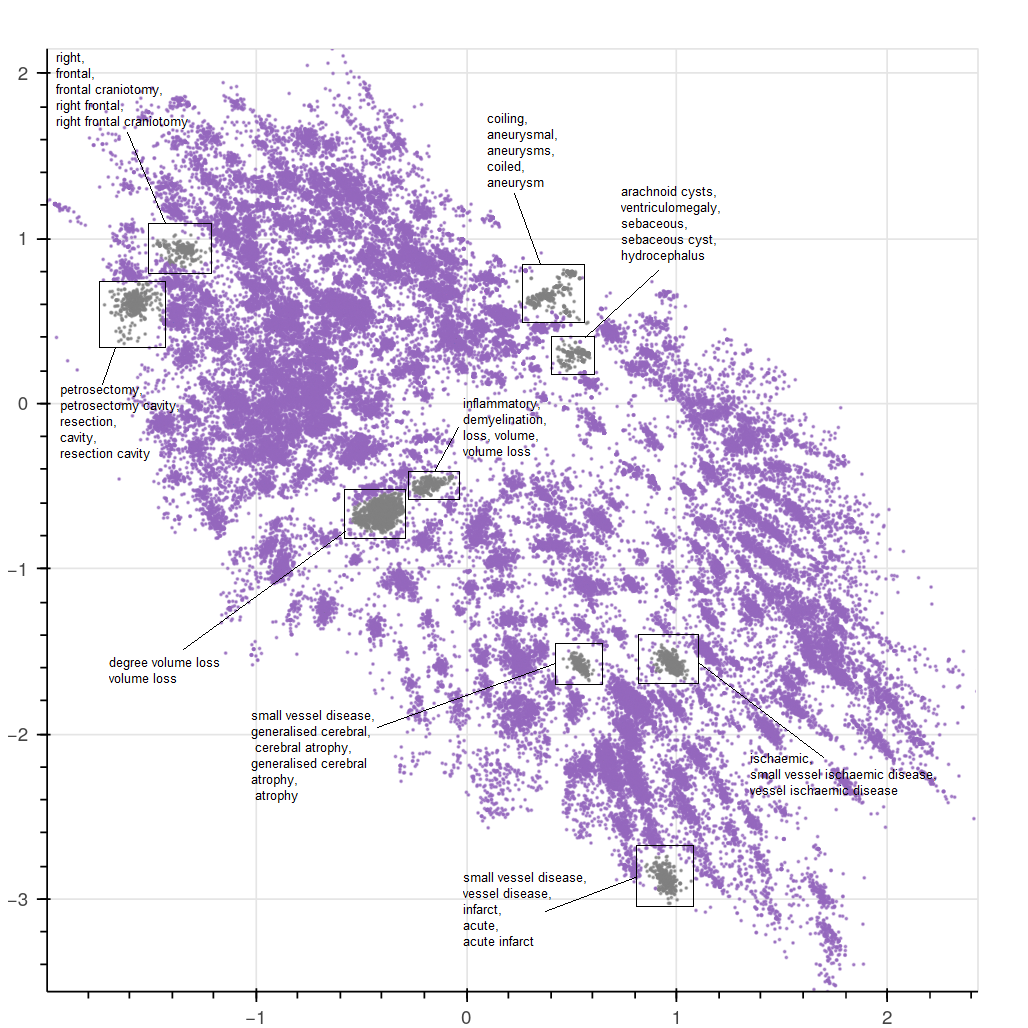
The structure revealed in the latent representation provides a means of deriving a novel set of compressed ’report phenotypes’ defined by characteristic patterns of covariance of individual input features (4.11). Figure 8 shows several example clusters and their characteristic features, as determined by the phenotyping model. For example, we find dense clusters dominated by craniotomy, coiled aneurysms, volume loss, and small vessel disease, but also clusters defined by co-occurring conditions, such small vessel disease and infarction, demyelination and volume loss, and cerebral atrophy and small vessel disease.
Imaging phenotypes enable the compressed representation of neuroradiological activity in terms of rich, yet succinct, descriptions of each report, facilitating the identification of distinct subpopulations where variation in an outcome of interest needs to be specifically detected to optimise service delivery. For example, mean reporting times may found to be longer for a specific phenotype defined not by indication, or any other aspect external to the report, but the appearances themselves.
2.5 Clinical Coding
Although neuroradiology typically provides only part of the evidence on which a diagnosis rests, a correspondence between the latent representation and ICD10 codes associated with the investigational episode should be expected world2004international . Figure 9, shows reports with codes belonging to four neurological conditions: C71 (Malignant neoplasm of brain), I63 (Cerebral infarction), Q03 (Congenital hydrocephalus) and G35 (Multiple sclerosis) available for a subset of episodes. These codes were chosen because they represent conditions with very different aetiologies, and roughly correspond with four of the most common pathological domains defined in section 4.9. These are: pathology-ischaemic and I63; pathology-csf-disorders and Q03; pathology-inflammatory-autoimmune and G35; and pathology-neoplastic-paraneoplastic and C71.
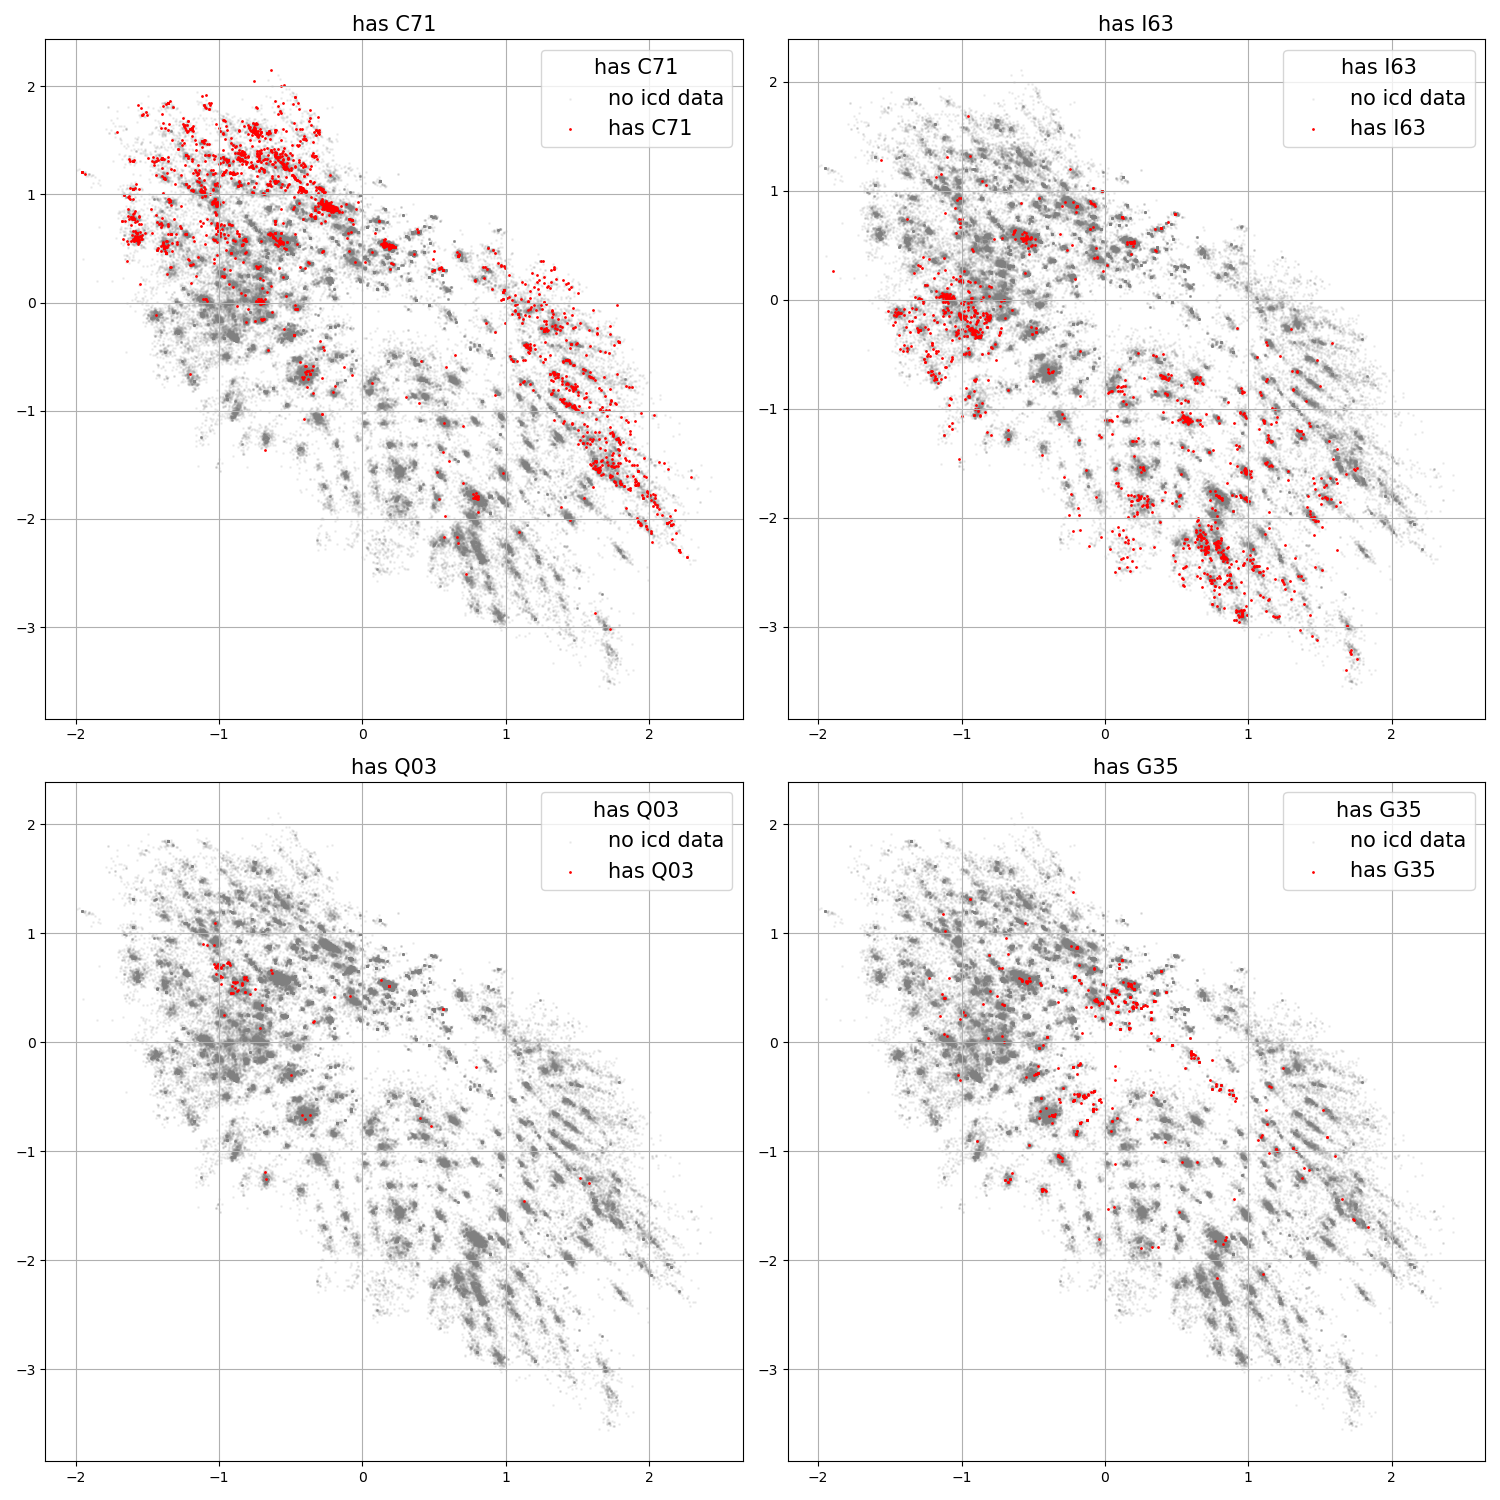
For each of the ICD10 code plots, reports with each specific code occupy a subset of the total space. Comparison with these domains in sections 2.2 and section 2.3 show qualitative intersections in the subspaces dominated by their corresponding ICD10 codes. It must be stressed that these codes were applied at the patient level, reflecting broader clinical management, whereas the latent space position is derived solely from the radiological report. While correlation between the two would be expected, the strongly localised distribution of codes into particular regions of the latent space indicates the connection between radiological description and patient outcomes.
3 Discussion
We have presented a comprehensive representational framework for the operational analysis of neuroradiological reports. Its primary objective is enabling quantitative monitoring sensitive not only to the volume and type of neuroradiological activity but—crucially—its rich content. This functionality provides greater precision and flexibility in the optimisation of service delivery, with a focus on the specifics of the clinical caseload. Our representational approach renders the variety of reported radiological appearances readily surveyable, facilitating operational decision-making responsive to finely nuanced differences in activity.
Deriving actionable representations of radiological reports relies on language modelling but is not achieved by it alone. Our framework makes use of the characteristic structure of reports to identify the assertion and relevant denial of key imaging features as well as their relations: to each other and to the underlying anatomy. This yields a rich representation of the space of possible radiological appearances beyond diagnostic labels (whose derivation imaging in any event naturally precedes) that captures their co-occurrence, both pathological and anatomical. This representation is rendered inspectable by projection to a two-dimensional latent space—employing deep autoencoding to maximise its expressivity—where topological inference can be used to define the dependencies of distinct constellations of appearances on variables of interest. Changes in contrast utilisation, for example, can be interpreted in the context of the reported appearances likely to influence them, not merely the originating clinical pathway. This process allows us to place each report into a learned context, providing a means of interrogating the content and structure of each report relative to all others: a form of data-driven computational phenotyping Hodapp2016 ; yang2020combining ; kim2020validation here used for operational purposes but potentially valuable in other contexts.
Representational analysis is preceded by identification of global features that qualify a report’s informativity: assertions of artefact limiting the interpretability of the underlying image, of comparison rendering the report potentially elliptic, and of overall normality eliminating the need for a detailed interpretation. This ensures that each representation captures the radiologist’s belief or intention on the applicable limits of description, providing a meta-epistemic index while being of operational interest in its own right.
Neuradicon’s representation is anchored in established ontologies, but is designed to extend beyond them to accommodate the broader lexicon of neuroradiology. Though here focused on the interpretation of images of the brain, it is naturally extensible across the entire neuraxis. Though the representation is drawn from a single centre, the volume and temporal range of surveyed activity, in conjunction with the highly specialised nature of neuroradiology, facilitates generalisation, here demonstrated across two sites. The core framework is readily adaptable to the specificities of a given site provided resource for local validation is available.
Recent advances in the field of large language models have demonstrated remarkable improvements in a wide variety of NLP tasks, including in the medical domain thirunavukarasu2023large . Models such as GatorTron yang2022large and Med-PaLMsinghal2023large have shown strong performance in medical question answering tasks and text generation in a medical setting. Trained on general corpora, such large models require computationally expensive tuning to operate in highly specialised domains such as neuroradiology, and do not provide easy mechanisms for the high degree of alignment a clinical setting requires, even in an operational context.
Our approach of employing an inspectable representation promotes trust by rendering the organisation of reports relative to one another recognisable to clinicians nix_understanding_2022 . Indeed, it can facilitate the validation of image analytic models that output machine-generated reports by enabling their comparison with expert generated reports in the latent space.
Operational objectives aside, Neuradicon is in theory applicable to the tasks of organising historical radiological corpora for automated analysis, triggering automated image-analytic routines conditional on the presence of specific reported features, enabling multimodal modelling of the imaged brain, and identifying characteristic descriptive patterns of research and educational interest.
4 Methods
4.1 Data Collection & Labelling
The dataset for this work is a corpus of 336,569 anonymized radiological reports extracted from the PACS system of the National Hospital for Neurology and Neurosurgery (NHNN), London, UK, for the purpose of local service evaluation and optimization. This corpus represents scans for a total of 181,519 unique patients from August 1999 until February 2023. These patients have a mean age of 51.6 (standard deviation=17.1) and are male and female. Samples of reports were extracted from this dataset for hand labelling, while the remaining reports were used for unsupervised training of a custom language model. Labelled data for each task was produced using the prodigy labelling tool (https://prodi.gy/). Each report was labelled in a paired-annotation manner, whereby two annotators pass through each item at the same time and label a report or instance when they both agree.
4.2 Data Sets
For each of the seven tasks, we have produced an accompanying labelled evaluation dataset drawn from a corpus of MRI neuroradiological reports. These are sourced from the UCLH National Hospital for Neurology and Neurosurgery (NHNN). In addition to UCLH data, we also have external evaluation data from King’s College Hospital (KCH). This data was used to verify the cross-site performance. When data is sourced from a single site, the resulting training and test data can be idiosyncratic, limiting domain transfer. It is necessary to include external data from another site to ensure the models have not overfitted to the style and structure of UCLH reporting.
| Task | Type | N reports |
|---|---|---|
| Report classification | multi-class classification | 400 |
| Section segmentation | token classification | 165 |
| Negation detection | entity-wise binary classification | 287 |
| Relation extraction | pair-entity-wise binary classification | 120 |
| Pathological domain classification (UCLH) | multi-label classification | 572 |
| Prospective domain classification (UCLH) | multi-label classification | 170 |
| Pathological domain classification (KCH) | multi-label classification | 526 |
| Prospective domain classification (KCH) | multi-label classification | 537 |
| \botrule |
For the negation detection and relation extraction tasks, the classification is performed at the level of individual entities. The total number of labelled instances is much larger than the number of reports in the test set. Likewise, as a token classification model, the number of individual samples in the section classification dataset is larger than the number of reports.
4.3 Custom Language Model
The foundation for the deep learning tasks in the pipeline is numerical representations of tokens. These n-dimensional feature vectors are then fed into downstream tasks such as classification and named entity recognition. We created a custom language model by fine tuning the biobert language model lee2020biobert on a dataset of 200,000 radiological reports from our corpus. To train our model, we used the huggingface transformers library jain2022hugging . We started with the biobert base model and continued training using the masked-language-modelling object for 100 epochs with a batch size of 32 and learning rate of .
This base language model produces 512-dimensional token vectors that are used as the input to downstream models. While the advances in generative language models has been the subject of significant research, such as Biogpt luo2022biogpt or Med-PaLM tu2023towards , the purpose of this language model is for downstream representation in discriminative probabilistic models. With no need for text generation, the BERT architecture is well suited to our tasks.
4.4 Report Classification
A key feature in clinical decision-making and filtering reports for operational studies is the normality of a report. In the context of neuroradiological reporting, a normal report is devoid of any asserted abnormal neurological appearances. This information can be used as a radiologist-defined label for the imaging associated with this report and identifying it as a healthy brain. With such a label, one could train AI clinical image models on the large datasets of MRI and CT imaging that exist for clinical scans. Another valuable source of information in a radiological report is whether it is a comparative. Ascertaining whether a radiological report is being compared to previous imaging is valuable for the standard radiological workflow. However, often it is only within the text itself that there is an indication that the current image is being compared to previous imaging. For example, many reports in the corpus are considered comparative because they contain phrases like “Comparison is made with the previous scan performed 6 April 2016.”
The full classification task aims to classify texts into five exclusive classes:
-
1.
ABNORMAL: A report where the radiologist has noted pathological appearances, e.g. “There are multiple supertentorial lesions”.
-
2.
NORMAL FOR AGE: A report that has noteworthy features, but not outside what is expected considering the patient’s age, e.g. “There is some age-related volume loss”
-
3.
NORMAL: A report where commentary denotes a normal scan, e.g. “normal appearances”, or wherein all pathological appearances are negated, e.g. “There is no sign of a tumour”.
-
4.
COMPARATIVE: A report compared to previous imaging. This class is exclusive, because it implies there is another report with additional commentary. The nature of radiological reporting means radiologists will omit commentary on appearances that are mentioned in previous reports. As the report is not complete, we cannot conclude the report is NORMAL or ABNORMAL.
-
5.
MISSING: A report that is empty, or a placeholder. e.g. “No report generated for this image”. The reality of in-situ radiological reporting means we must account for missing information and mistakes.
These classes were so chosen because they inform how reporting information is used in downstream operational use. The distinction between NORMAL and NORMAL FOR AGE, while seemingly academic, reflects the actions taken by clinicians in practice. Likewise, the distinction between COMPARATIVE and ABNORMAL is necessary because the potential omission of information in a comparative report must be considered. The downside of these classes is the classification problem is harder than a simple binary healthy/unhealthy classification, but it is necessary when considering real-world data.
The report classification model is a text classification model implemented using the text categorisation tool of Huggingface jain2022hugging . The model was trained with 5-class categorical cross-entropy loss with the Adam optimiser Kingma2015adam , with a learning rate of and a batch size of 32.
4.5 Section Classification
For the section classification task, the aim is to classify sentences of the report into the following report sections:
-
1.
header - the scan protocol and machine-generated information such as the scan number and date.
-
2.
indications - detail of relevant patient medical history and indications.
-
3.
metareport - commentary on the report itself, such as the quality of the scan, or whether it is compared to previous imaging.
-
4.
body - the main content of the report detailing the findings of the scan.
-
5.
tail - radiological reports are conventionally signed by the author.
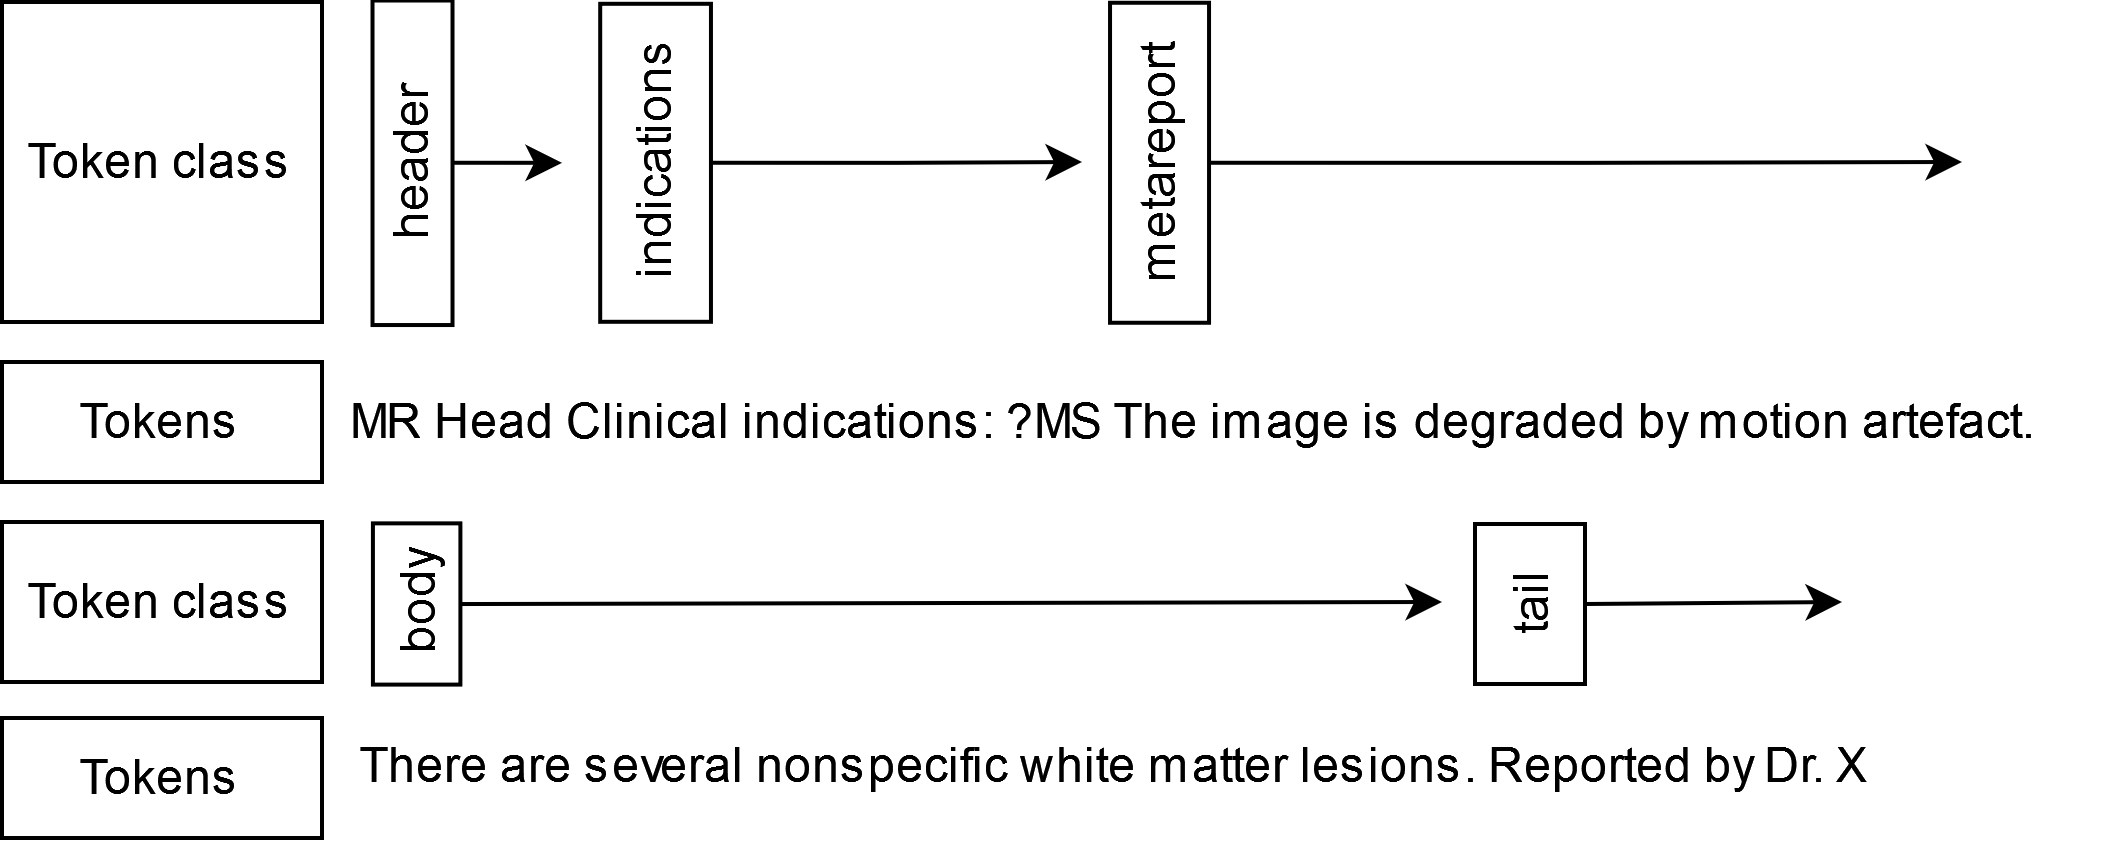
It is essential to segment the report into these sections to aid information extraction and ensure that any extracted information can be placed into the right context in which it is used. This task is a token classification problem. In our architecture, the report is segmented by classifying certain tokens as the ‘section start’ tokens, with all subsequent tokens belonging to that class, see fig. 10 for an illustration.
The section segmentation task is implemented using the token classification model from the Huggingface library. Using the base language model of section 4.3, the token classification layer takes the token representations and classifies them into correct classes. We train the model using batch sizes of 32, a learning rate of 0.0001 with Adam optimisation.
4.6 Named Entity Recognition
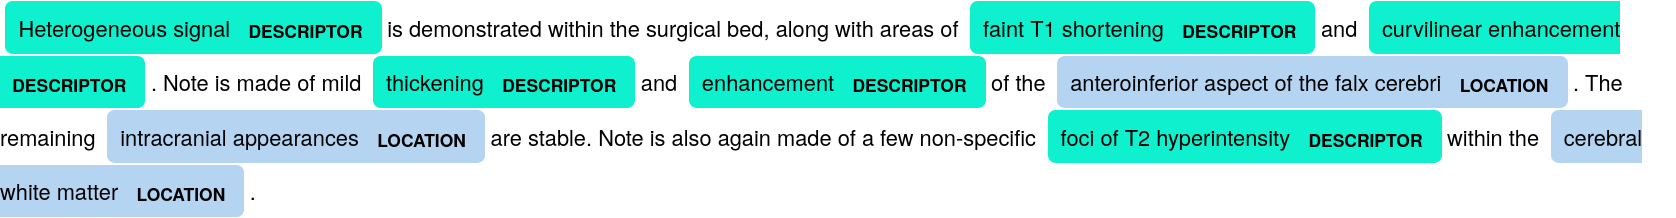
The task of named entity recognition in the field of neurology is to recognise clinical concepts present within the report. For the purposes of neuroradiology, we choose the following broad categories:
-
1.
pathology - a clinical concept that refers to a particular neurological condition
-
2.
location - a particular anatomical location.
-
3.
descriptor - a clinical concept that is used to describe the appearances of the patient’s scan in the context of abnormality.
Within each of these classes, we have chosen a set of subdomains that are important in the context of representing neurological reporting. These classes are summarised in table 3.
| Pathology | Descriptor | Locations |
|---|---|---|
| haemorrhagic | cyst | arteries |
| ischaemic | damage | brain stem |
| vascular | diffusion | diencephalon |
| other cerebrovascular | signal change | ear, nose & throat |
| treatment & surgery | enhancement | eye |
| inflammatory & autoimmune | flow-related | ganglia |
| congenital & developmental | interval & change | grey matter |
| csf disorders | mass & effect | limbic system |
| musculoskeletal | morphology | meninges |
| neoplastic & paraneoplastic | collection | nerves |
| infectious | necrosis | neurosecretory system |
| neurodegenerative & dementia | skull | |
| metabolic, nutritional & toxic | spine | |
| endocrine | telencephalon | |
| ophthalmological | veins | |
| traumatic | ventricles | |
| white matter | ||
| other location | ||
| \botrule |
These domains reflect broad classes of disorders encountered in neurology, and they are each constituted by a set of conditions. For example, the ‘pathology-treatment’ class is constituted by terms such as ‘post surgical change’, ‘shunt’, ‘surgery’, ‘biopsy’, ‘chemotherapy’, ‘surgical defect’, ‘resection’, ‘cranioplasty’, among many others that have been extracted from the reports themselves and assigned to pathological domains.
The architecture for the NER task is also token classification model, using the same implementation and training routine as the section classification model. However, for NER a token aggregation strategy is required to fuse tokens into entities based on model predictions. For our model we use the ’first’ token strategy, where the class of the first token is used for the entity class when there is ambiguity. An example of a report tagged by the NER task is shown in fig. 11
4.7 Negation Detection
Negation detection is performed on each entity produced by the NER task. For this task, we implement the Negbio rule-based method peng2018negbio . The Negbio method uses patterns on universal grammatical dependencies Jurafsky:2009:SLP:1214993 to ascertain whether a clinical finding is negated. The algorithm for this task uses a modified set of Semgrex Chambers2007 patterns to extract tokens that satisfy particular grammatical patterns. Semgrex patterns are strings that encode patterns on a universal dependency parse tree. During development, the full list of patterns used in Negbio was found to be unnecessary for adequate performance on the stereotyped structure of neuroradiological reports. We used a reduced set specific to the field of neurology. For this task, we used the grammatical dependency parse produced by the Spacy parser as input and implemented the patterns using the Spacy dependency matcher. Since the negation classification task is a rule-based method, no training is necessary.
Several of the operators used below are not in the Semgrex standard set, for more information about the implementation of these patterns, see www.spacy.io. Note this pattern set is simpler than that presented in Negbio due to the more stereotyped structure of neuroradiological reporting.
The patterns are:
1. {ner:/PATHOLOGY|DESCRIPTOR/}>
        {dep:/neg|det|case/&lemma:/no|not|none|without/}
2. {ner:/PATHOLOGY|DESCRIPTOR/}$--
        {dep:/neg|det|case/&lemma:/no|not|none|without/}
3. {ner:/PATHOLOGY|DESCRIPTOR/}<<
        {ner:/PATHOLOGY|DESCRIPTOR/}$--
            {dep:/neg|det|case/&lemma:/no|not|none|without/}
4. {ner:/PATHOLOGY|DESCRIPTOR/}<{}$--
        {ner:/PATHOLOGY|DESCRIPTOR/}>
            {dep:/neg|det|case/&lemma:/no|not|none|without/}
5. {ner:/PATHOLOGY|DESCRIPTOR/&dep:/conj|acl|nmod|amod|dobj/}<<
        {ner:/PATHOLOGY|DESCRIPTOR/}>
            {dep:/neg|det|case/&lemma:/no|not|none|without/}
6. {ner:/PATHOLOGY|DESCRIPTOR/};*
        {lemma:/evidence|finding|focus|sign|feature/}>
            {dep:/neg|det|case/&lemma:/no|not|none|without/}
The patterns in this task focus only on entities of the pathological and descriptive classes (see table 3 for their contents). This is because radiological commentary consists primarily of the presence or absence of neurological appearances. As such, anatomical entities, though present in reports, are described as the location of appearances rather than the subject of reporting itself.
4.8 Relation Extraction
The relation extraction task aims to match named entities of the ‘pathology’ and ‘descriptor’ classes to their corresponding anatomical locations, if present. This approach is narrower in scope than the general task of relation extraction found in the literature Jurafsky:2009:SLP:1214993 and is tailored to the needs of neuroradiology. We base our method on the RelEx system Fundel2007 , but in our work, we use relation extraction for one particular relation: entity lies within a location. Like the negation detection algorithm, the relation extraction algorithm uses the grammatical dependency parse of a sentence to extract the relations. This pipe searches for patterns on the grammatical dependency parse tree; pairs of entities are linked by a ‘within’ relation if a ‘location’ class named entity and a ‘pathology’ or ‘descriptor’ named entity satisfy one of these grammatical patterns. Since the relation extraction task is a rule-based method, no training is necessary. Like the negation task, the patterns for the relation extraction task are represented using Semgrex Chambers2007 patterns. These patterns prescribe a path along the dependency parse tree starting at the PATHOLOGY or DESCRIPTOR entity, and traversing the path until a LOCATION entity is reached. Several of the operators used below are not in the Semgrex standard set, for more information about the implementation of these patterns, see www.spacy.io.
The patterns are:
1. {ner:/PATHOLOGY|DESCRIPTOR}>>{ner:/LOCATION/}
2. {ner:/PATHOLOGY|DESCRIPTOR/}\$++{ner:/LOCATION/}
4.9 Report-Level Pathological Domains
The primary goal of this complete pipeline is to identify pathological labels for reports. This means using the outputs from previous tasks to assign multiple non-exclusive binary labels to each report. Pathological domains are assigned to reports according to whether they have at least one asserted pathology entity of that class. Thus each report has potentially several of the following pathological domain labels. The identification of the report-level binary labels is thus criterial, and depends solely on the output of the NER and negation models. Since we have also identified ‘descriptor’ and ‘location’ entity types in the named entity recognition section 4.6, we can also extract labels for anatomical locations and radiological appearances.
4.10 Latent Space Embedding
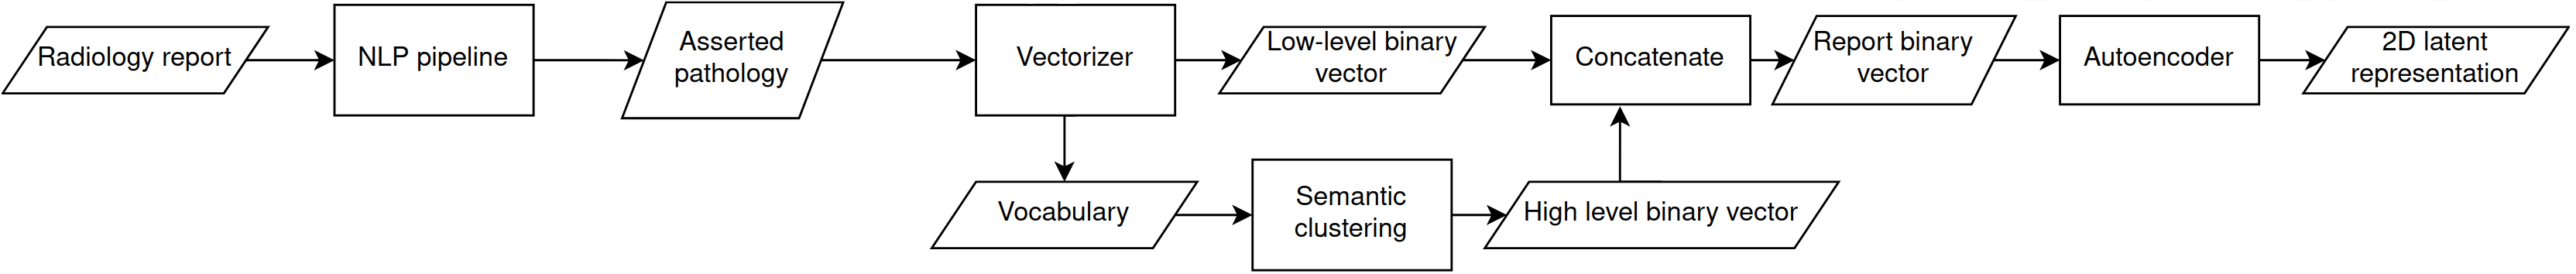
The latent space representation of radiological reporting in neurology was obtained by training an auto-encoder model hinton1993autoencoders to map a binary representation of reports (from section 4.9) to a 2-dimensional vector space. The procedure has four stages:
-
1.
Aggregating semantically similar pathological entity features into super-groups,
-
2.
Creating a high-dimensional binary vector representation of a report
-
3.
Combining these with the super-group and pathological domain labels
-
4.
Training an deep auto-encoder to learn a 2-dimensional real-valued latent representation
Each report is passed through the comprehensive NLP pipeline. This pipeline tags each report with the pathological entities present, and determines whether they are asserted or not. We extract all of the asserted pathological entities and convert these to a binary vector representation, whereby each entry in a binary vector records the presence of that pathological term in the corresponding report. This is done by a n-gram text vectorizer from the scikit-learn library.
Although each report is now represented in a numerical format, we have so far ignored that fact that multiple terms may be semantically similar or synonymous. We aggregate terms together by performing k-means clustering of the word vectors learned in section 4.3. Each feature identified in the vectorization process has a point in the word vector space. We then cluster these points into 100 groups. This means for each report we have two representations, a ‘low-level’ binary representation where every unique asserted pathological entity has an entry, and a smaller ‘high-level’ binary representation where the constituent asserted pathology terms are ‘binned’ into larger semantic groups; each element in this binary vector represents the presence of one of these higher level groups. Finally, we concatenate these two binary vectors together, so that each report has both a ‘low-level’ and ‘high-level’ representation.
These aggregated binary vectors are fed into an autoencoder. For an dimensional binary input , the autoencoder consists of an encoder , that maps to a 2 dimensional latent vector and a decoder that attempts to reconstruct () the original input vector.
| (1) | |||
| (2) |
The autoencoder is composed of 5 hidden layers with sizes (256,64,2,64,256) separated by batch normalisation batchnorm () and ELU activation ELUclevert . Thus the encoder is made up of linear layers ,
| (3) |
and the decoder the mirror image of . The model is trained with a mean squared error loss function and Adam optimisation. The choice of a 2 dimensional embedding was primarily for purposes of inspection and visualisation of the latent space. A latent space of 3, 4 or more dimensions would improve reconstruction performance during training, but we couldn’t intuit the distribution nor plot the resulting latent vectors. Further, we find a low-dimensional bottleneck is necessary to force the model to learn a semantically meaningful representation. The embedding model is illustrated in 12
4.11 Identifying Phenotypes
Once a latent space representation is obtained, we would like to find the characteristic features of a particular group or cluster of reports in the latent space. Because the auto-encoder forces the binary report representations into a small 2d real-valued bottleneck, we can interpret the euclidean distance in this latent space as a similarity metric that incorporates the distribution of patterns of features across the whole set of reports. Thus reports that cluster together in the latent space have similar appearances, and describe patients with similar conditions (and co-occurrences of conditions). This enables us to identify particular phenotypes of patients in an unsupervised manner, one that has been learned from the data itself, rather than according to a prescriptive criterion.
We identify the features that identify the phentotype by calculating the in-group vs out-group phi-correlation coefficient. Also known as the Matthews correlation coefficient, this measure produces a correlation coefficient for each binary feature in the input, and allows us to discover the ‘characteristic’ features of particular clusters and subregions of the latent space. Given an cluster subset of reports selected from the latent space - ideally a set that show a clear clustering - we construct the contingency table for each binary feature in the initial binary featurization.
For example, if we consider a binary pathological feature, say ‘tumour’, each report has a binary vector with a row indicating whether they contain this feature or not. With a sample of 100 reports, we assign 13 to a group or cluster; with these we could create a contingency table for each feature. Our example table would measure the intersection of in vs. out cluster and with vs. without tumour. This contingency table gives us the phi-coefficient for each feature in the input. The highest-phi features are those most strongly correlated with the cluster, and we can identify the cluster by these features - we use these features to define our cluster phenotype. See section 2.4 for an example.
4.12 Spatial Inference
With a learned latent space of pathological appearances, we can use spatial inference to identify regions that are identified with certain variables. For this task we make use of geoSPM engleitner2022geospm , a method of applying statistical parametric mapping to spatial data. Our corpus of reports are mapped to a point in a 2d latent space; each representing a collection of (potential) pathological appearances. GeoSPM runs topological analysis on this space to derive marginalised spatial maps, disentangling appearances and variables of interest from confounding factors. The primary value of this analysis is to identify regions where particular variables are significant. It also allows us to find the conjunctions of multiple variables, representing regions where multiple factors are jointly significant.
For our analysis, geoSPM software was run with a resolution of 256x199, with a smoothing level of 0.4. The areas of significance for individual spatially distributed variables are identified by areas where the local regression coefficient value reaches a significance level of in a two-tailed t-test.
Declarations
Ethics This project was conducted at University College London Hospitals NHS Trust as a service evaluation and optimization project employing irrevocably anonymised data, which does not require research ethics approval since its primary objective is not research but service improvement. KCH data was sourced from the LMIAI Centre for Value-Based Healthcare Anonymised Database, operating under ethical approval from East of Scotland Research Ethics Service (EoSRES). REC reference: 20/ES/0005 IRAS project ID: 257568.
Data Availability In keeping with internal service projects, the terms of access to source data preclude their public dissemination.
Code Availability The software used in this work were as follows: Python 3.8 (https://www.python.org/), scikit-learn 0.23 (https://scikit-learn.org), Numpy 1.21 (https://numpy.org), Scipy 1.7 (https://www.scipy.org/), Pandas 1.3.1 (https://pandas.pydata.org/), Spacy 3.0 (https://spacy.io/), prodigy 1.0 (https://prodi.gy/), Huggingface (https://huggingface.co/), geoSPM (https://github.com/high-dimensional/geospm). All software are open source and publicly available.
Author Contributions H. W., R. G. and P. N. contributed to the design of the study. H. W. is responsible for the creation of the software and models. A. Jha, Y. M., R. G., H. W., W.H.L.P., contributed to the acquisition and analysis of the data, including labelling and evaluation. H.W., A. Julius, and P.N. prepared the manuscript, which was reviewed and approved by all authors.
Competing Interests Statement The authors declare no competing interests
Acknowledgements This work was funded by the Wellcome Trust via an Innovations Project Award Ref. 213038/Z/18/Z. Y.M. is funded by an MRC grant (MR/T005351/1).
References
- \bibcommenthead
- (1) Esteva, A., Robicquet, A., Ramsundar, B., Kuleshov, V., DePristo, M., Chou, K., Cui, C., Corrado, G., Thrun, S., Dean, J.: A guide to deep learning in healthcare. Nature Medicine 25, 24–29 (2019). https://doi.org/10.1038/s41591-018-0316-z
- (2) Jurafsky, D., Martin, J.: Computational Linguistics and Speech Recognition, 2000. Prentice Hall (2000)
- (3) Wu, S., Roberts, K., Datta, S., Du, J., Ji, Z., Si, Y., Soni, S., Wang, Q., Wei, Q., Xiang, Y., et al.: Deep learning in clinical natural language processing: a methodical review. Journal of the American Medical Informatics Association 27(3), 457–470 (2020)
- (4) Pons, E., Braun, L.M.M., Hunink, M.G.M., Kors, J.A.: Natural language processing in radiology: A systematic review. Radiology 279, 329–343 (2016). https://doi.org/10.1148/radiol.16142770
- (5) Sheikhalishahi, S., Miotto, R., Dudley, J.T., Lavelli, A., Rinaldi, F., Osmani, V.: Natural language processing of clinical notes on chronic diseases: Systematic review. JMIR Medical Informatics 7 (2019). https://doi.org/10.2196/12239
- (6) Mikolov, T., Sutskever, I., Chen, K., Corrado, G.S., Dean, J.: Distributed representations of words and phrases and their compositionality. Advances in neural information processing systems 26 (2013)
- (7) Pennington, J., Socher, R., Manning, C.D.: Glove: Global vectors for word representation, pp. 1532–1543 (2014). https://doi.org/10.3115/v1/d14-1162. http://www.aclweb.org/anthology/D14-1162
- (8) Szlosek, D.A., Ferretti, J.M.: Using machine learning and natural language processing algorithms to automate the evaluation of clinical decision support in electronic medical record systems. eGEMs (Generating Evidence and Methods to improve patient outcomes) 4, 5 (2016). https://doi.org/10.13063/2327-9214.1222
- (9) Chen, P.H., Zafar, H., Galperin-Aizenberg, M., Cook, T.: Integrating natural language processing and machine learning algorithms to categorize oncologic response in radiology reports. Journal of Digital Imaging 31, 178–184 (2018). https://doi.org/10.1007/s10278-017-0027-x
- (10) Lee, J., Yoon, W., Kim, S., Kim, D., Kim, S., So, C.H., Kang, J.: Biobert: a pre-trained biomedical language representation model for biomedical text mining. Bioinformatics 36(4), 1234–1240 (2020)
- (11) Luo, R., Sun, L., Xia, Y., Qin, T., Zhang, S., Poon, H., Liu, T.-Y.: Biogpt: generative pre-trained transformer for biomedical text generation and mining. Briefings in Bioinformatics 23(6), 409 (2022)
- (12) Peng, Y., Wang, X., Lu, L., Bagheri, M., Summers, R., Lu, Z.: Negbio: a high-performance tool for negation and uncertainty detection in radiology reports. AMIA Summits on Translational Science Proceedings 2018, 188 (2018)
- (13) Sykes, D., Grivas, A., Grover, C., Tobin, R., Sudlow, C., Whiteley, W., McIntosh, A., Whalley, H., Alex, B.: Comparison of rule-based and neural network models for negation detection in radiology reports. Natural Language Engineering 27, 203–224 (2021). https://doi.org/10.1017/S1351324920000509
- (14) Fundel, K., Küffner, R., Zimmer, R.: Relex - relation extraction using dependency parse trees. Bioinformatics 23, 365–371 (2007). https://doi.org/10.1093/bioinformatics/btl616
- (15) Li, Z., Yang, Z., Shen, C., Xu, J., Zhang, Y., Xu, H.: Integrating shortest dependency path and sentence sequence into a deep learning framework for relation extraction in clinical text. BMC Medical Informatics and Decision Making 19, 22 (2019). https://doi.org/10.1186/s12911-019-0736-9
- (16) Alex, B., Grover, C., Tobin, R., Sudlow, C., Mair, G., Whiteley, W.: Text mining brain imaging reports. Journal of Biomedical Semantics 10, 23 (2019). https://doi.org/10.1186/s13326-019-0211-7
- (17) Wheater, E., Mair, G., Sudlow, C., Alex, B., Grover, C., Whiteley, W.: A validated natural language processing algorithm for brain imaging phenotypes from radiology reports in uk electronic health records. BMC Medical Informatics and Decision Making 19, 184 (2019). https://doi.org/10.1186/s12911-019-0908-7
- (18) Gorinski, P.J., Wu, H., Grover, C., Tobin, R., Talbot, C., Whalley, H., Sudlow, C., Whiteley, W., Alex, B.: Named entity recognition for electronic health records: a comparison of rule-based and machine learning approaches. arXiv preprint arXiv:1903.03985 (2019)
- (19) International Statistical Classification of Diseases and Related Health Problems (10th Ed.). World Health Organization (2019). https://icd.who.int
- (20) Hodapp, C.: Unsupervised learning for computational phenotyping. arXiv preprint arXiv:1612.08425 (2016)
- (21) Yang, Z., Dehmer, M., Yli-Harja, O., Emmert-Streib, F.: Combining deep learning with token selection for patient phenotyping from electronic health records. Scientific reports 10(1), 1–18 (2020)
- (22) Kim, Y., Lee, J.H., Choi, S., Lee, J.M., Kim, J.-H., Seok, J., Joo, H.J.: Validation of deep learning natural language processing algorithm for keyword extraction from pathology reports in electronic health records. Scientific reports 10(1), 1–9 (2020)
- (23) Thirunavukarasu, A.J., Ting, D.S.J., Elangovan, K., Gutierrez, L., Tan, T.F., Ting, D.S.W.: Large language models in medicine. Nature medicine 29(8), 1930–1940 (2023)
- (24) Yang, X., Chen, A., PourNejatian, N., Shin, H.C., Smith, K.E., Parisien, C., Compas, C., Martin, C., Costa, A.B., Flores, M.G., et al.: A large language model for electronic health records. NPJ Digital Medicine 5(1), 194 (2022)
- (25) Singhal, K., Azizi, S., Tu, T., Mahdavi, S.S., Wei, J., Chung, H.W., Scales, N., Tanwani, A., Cole-Lewis, H., Pfohl, S., et al.: Large language models encode clinical knowledge. Nature, 1–9 (2023)
- (26) Nix, M., Onisiforou, G., Painter, A.: Understanding healthcare workers’ confidence in AI. NHS AI Lab (2022). Accessed 2022-01-19
- (27) Wolf, T., Debut, L., Sanh, V., Chaumond, J., Delangue, C., Moi, A., Cistac, P., Rault, T., Louf, R., Funtowicz, M., et al.: Huggingface’s transformers: State-of-the-art natural language processing. arXiv preprint arXiv:1910.03771 (2019)
- (28) Tu, T., Azizi, S., Driess, D., Schaekermann, M., Amin, M., Chang, P.-C., Carroll, A., Lau, C., Tanno, R., Ktena, I., et al.: Towards generalist biomedical ai. arXiv preprint arXiv:2307.14334 (2023)
- (29) Kingma, D.P., Ba, J.L.: Adam: A method for stochastic optimization. 3rd International Conference on Learning Representations, ICLR 2015 - Conference Track Proceedings (2015)
- (30) Chambers, N., Manning, C.D., Cer, D., Grenager, T., Hall, D., Kiddon, C., MacCartney, B., de Marneffe, M.-C., Ramage, D., Yeh, E.: Learning alignments and leveraging natural logic, p. 165 (2007). https://doi.org/10.3115/1654536.1654570
- (31) Hinton, G.E., Zemel, R.: Autoencoders, minimum description length and helmholtz free energy. Advances in neural information processing systems 6 (1993)
- (32) Ioffe, S., Szegedy, C.: Batch normalization: Accelerating deep network training by reducing internal covariate shift. CoRR abs/1502.03167 (2015) 1502.03167
- (33) Clevert, D.-A., Unterthiner, T., Hochreiter, S.: Fast and accurate deep network learning by exponential linear units (elus). arXiv preprint arXiv:1511.07289 (2015)
- (34) Engleitner, H., Jha, A., Pinilla, M.S., Nelson, A., Herron, D., Rees, G., Friston, K., Rossor, M., Nachev, P.: Geospm: Geostatistical parametric mapping for medicine. Patterns 3(12), 100656 (2022)