Predicting transitions in cooperation levels from network connectivity
Abstract
Networks determine our social circles and the way we cooperate with others. We know that topological features like hubs and degree assortativity affect cooperation, and we know that cooperation is favoured if the benefit of the altruistic act divided by the cost exceeds the average number of neighbours. However, a simple rule that would predict cooperation transitions on an arbitrary network has not yet been presented. Here we show that the unique sequence of degrees in a network can be used to predict at which game parameters major shifts in the level of cooperation can be expected, including phase transitions from absorbing to mixed strategy phases. We use the evolutionary prisoner’s dilemma game on random and scale-free networks to demonstrate the prediction, as well as its limitations and possible pitfalls. We observe good agreements between the predictions and the results obtained with concurrent and Monte Carlo methods for the update of the strategies, thus providing a simple and fast way to estimate the outcome of evolutionary social dilemmas on arbitrary networks without the need of actually playing the game.
,
+These Authors contributed equally
1 Introduction
In 1992 Nowak and May observed that cooperators form compact clusters and can thereby withstand invading defectors in an iterated prisoner’s dilemma game on a square lattice [1]. This was a fascinating discovery because cooperators should have died out in agreement with the Nash equilibrium of the game [2, 3]. This would, in fact, always happen in a well-mixed population, but not on a network [4, 5, 6]. The fact that the structure of a network can positively affect the evolution of cooperation is today known as network reciprocity [1, 7], and it constitutes one of five key mechanisms for cooperators to survive social dilemmas [8].
With the advent of network science at the turn of the 21st century [9, 10, 11], the field of evolutionary games on networks rapidly gained on popularity, and various complex networks have been studied for their impact on the evolution of cooperation, including scale-free [12, 13, 14, 15, 16, 17, 18, 19, 20, 21, 22, 23], small-world [24, 25, 26, 27, 28, 29, 30], hierarchical [31, 32], coevolving [33, 34, 35, 36, 37, 38], and empirical social networks [39, 40, 41]. Later on, interdependent and multilayer networks have emerged as an important new paradigm in network science [42, 43], and these were also considered prominently in cooperation research [44, 45, 46, 47, 48, 49, 50, 51, 52], including the discovery of interdependent network reciprocity as an extension of the traditional case [53]. Most recently, the focus has been shifting once more, this time to higher-order networks [54], where evolutionary dynamics has been considered [55, 56, 57].
However, despite the wealth of research concerning the evolution of cooperation on networks, fundamental results have been relatively scarce. Tanimoto [58] and Wang et al. [59] introduced universal scaling parameters to account for the strength of a dilemma disrupting the promotion of cooperation that can evaluate the outcome of a game independently of the reciprocity mechanisms, and showed how these mechanisms relax the dilemma strength [60]. Ohtsuki et al. [61], for instance, presented a simple rule for the evolution of cooperation on graphs and social networks, proving that natural selection favours cooperation if the benefit of the altruistic act, divided by the cost, exceeds the average number of neighbours. Moreover, Allen et al. [62] derived a general formula for pairwise games under weak selection that applies to any graph or social network.
In this paper, we derive a simple conjecture for cooperation transitions in evolutionary social dilemmas based on the unique sequence of degrees in a network. As we will show, the conjecture predicts well at which game parameters important shifts in the level of cooperation can be expected, including phase transitions from absorbing to mixed strategy phases [63, 64].
In what follows, we first present the derivation of the conjecture and then proceed with showing the results obtained for the evolutionary prisoner’s dilemma game on random and scale-free networks. We conclude by discussing the implications of our research to optimise large-scale simulations of evolutionary processes on complex networks and the possibilities for the generalisation of the conjecture to related subjects.
2 Game and conjecture formulation
We start by considering a population of agents playing the Prisoner’s Dilemma (PD) game [65]. At each step of the game, agents are allowed to play different strategies, that is, a node can cooperate with some neighbours and defect with others [66], also known as the mixed strategy system with different offers [67, 68].
Connections between players follow the network structure prescribed by the adjacency matrix , where if players and are linked, and otherwise.
The payoffs in the PD game are extracted from the following matrix:
| (1) |
which means that a cooperator (C) altruistically loses an amount when playing with a defector (D), who wins an amount in such interaction. An interplay between two cooperators results in a mutual benefit of , whereas playing between two defectors results in a null interchange. Note that a defector never looses.
Without loss of generality, one can take () and re-scale the payoff matrix as:
| (2) |
According to the universal scaling for the dilemma strength introduced in Ref. [59], , the parameter measures the dilemma weakness.
For interacting players and , one can define the strategy variable as
and the strategy vector as . In each round of the game, the payoff earned by each player from its interaction with is:
| (3) |
The average payoff collected by player after an interaction round with its neighbors is thus given by
| (4) |
being the set of neighbors of .
Evolution of the game is designed by means of the following update rule: at each time step, all pairs of linked players engage in the PD game and their payoffs are updated according to Eq. (4). Each player then compares its performance with its neighborhood. Let us refer to the neighbor of with the highest payoff as , and as its strategy adopted against . Then, updates its strategy imitating its best neighbor strategy with probability
| (5) |
which is a Fermi function [69], i.e. a sigmoid function of the free parameter (playing the role of a temperature) and the payoff difference (playing the role of an energy). Therefore, the update rule of the strategy of at time is given by
| (6) |
that is, player imitates, at time , the strategy that its best neighbor played against it in the previous step with of its neighbors, and keeps the same strategy is actually playing with each one of the rest.
One can define the node outcoming cooperation rate as
| (7) |
and the incoming cooperation rate as
| (8) |
and the macroscopic cooperation frequency of the whole network as
| (9) |
Note that defection is very profitable when the benefit is close to , while when the profitability of defection reduces. As a consequence, in well-mixed populations, defection is the dominant trait driving cooperation to extinction. However, it is known that, in structured populations, cooperation can survive provided the appropriate conditions [70, 7].
In this context, we now explore how the transition from defection to cooperation depends on the connectivity, as the dilemma weakness increases. To do this, let us consider two linked players and with strategy vectors and . Using Eq. (2), one can write the payoff of the first player from engaging the second as
| (10) |
Therefore, the total payoff accumulated by is
| (12) |
Let us focus now on the probability of changing strategy, which becomes 50% when the payoff difference in Eq. (5). Whenever at some point during the iterated game a player reaches such a null payoff difference with respect to its best performing neighbor , the transition to keep the actual strategies or to change to is critical in the sense that it occurs for a particular value of the parameter . This implies that, evaluating payoffs of and using Eq. (12),
| (13) |
a critical value of is evaluated as
| (14) |
From this relationship, one can formulate a simple conjecture based on the connectivity pattern to locate the values of at which cooperation is likely to transit to higher (or lower) frequencies: given a PD game on a graph , all phase transitions are located at points of the form
| (15) |
where , , are integers (such that the denominator is non-zero).
Note that the set of values resulting from Eq. (15) tells us about the possible locations of a phase transition. Equation (15) entirely depends on the unique sequence of degrees present in the graph and, therefore, it alone allows predicting the transitions without actually playing the game. However, the multiplicity of each does depend on the particular degree distribution, and one can extract important information about the transitions from this degeneracy, as shown in the next section.
While in the game framework described so far, a player can perform different strategies with its neighbors, in the more classic scenario, players adopt a single role in each run. We will refers to this updating rule as node strategy, in opposition to the link strategy defined by Eq. (6). It is straightforward to obtain the equivalent equation to that of Eq. (15) in this latter case:
| (16) |
where and are integers (such that denominator is non-zero) and Eq. (16) indicates that the possible locations for a phase transition in a node strategy situation is reduced with respect to the link strategy choice.
Notice that the two previous conjectures for link ( mixed) and node strategies, Eqs. (15) and (16) respectively, depend on the particular form of the payoff matrix. Therefore, the relationship between game parameters and topology has to be recomputed if we change the dilemma, as the critical points depend on them. For example, in order to illustrate this with a case extensively investigated in the literature, we chose the dilemma’s matrix with no cost
| (17) |
as in Refs.[7, 71, 72]. Note that parameter in Eq. (17) now plays the role of a temptation to defect. In this case, the corresponding universal dilemma strengths [59] are and , therefore, parameter directly accounts for the strength of the dilemma.
Using a similar procedure as the one leading to Eq. (16) one can obtain an equivalent conjecture to locate the phase transitions for the dilemma above,
| (18) |
where and are integers such that , and is the maximum degree present in the network.
3 Results
We test our conjecture by running an extensive set of simulations of PD competition in a wide range of structural and dynamical conditions. Unless otherwise indicated, all the simulations were carried out for a population of players using link strategy, with initially equal densities of cooperation and defection randomly distributed along with the links. Each simulation evolves over 10,000 time steps, and cooperation frequencies are averaged in the last 2,500 time steps. At each time step, all players update their strategies synchronously [1, 73]. Average cooperation frequency is monitored as a function of , and each point is an ensemble average over 100 network realisations.
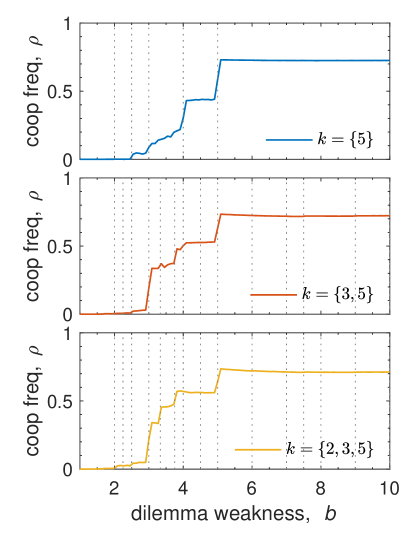
As the conjecture implies that the number of possible transitions depends on the set of degrees present in the network, we initiate our exploration by showing the results of simulations on random regular (RR) graphs composed of groups of equal size whose nodes have all the same connectivity . These graphs are constructed using the configuration model [74], which returns a random graph with no degree correlations consistent with a given degree distribution. Specifically, we explore in Fig. 1 the evolution of the cooperation frequency in RR graphs for the following degree distributions: a unique group of nodes of degree (upper panel); two equally sized groups of agents with degrees (middle panel); and three equally sized groups with degrees respectively (bottom panel). In addition, we have included dotted vertical lines marking the values of predicted by Eq. (15) for the chosen degree sequences. Note that the maximum degree is the same in the three cases but, as smaller degrees are included, the cardinality of increases adding new locations for a potential phase transition. We observe that all significant changes in the cooperation frequency always occur at one of the possible values predicted by Eq. (15).

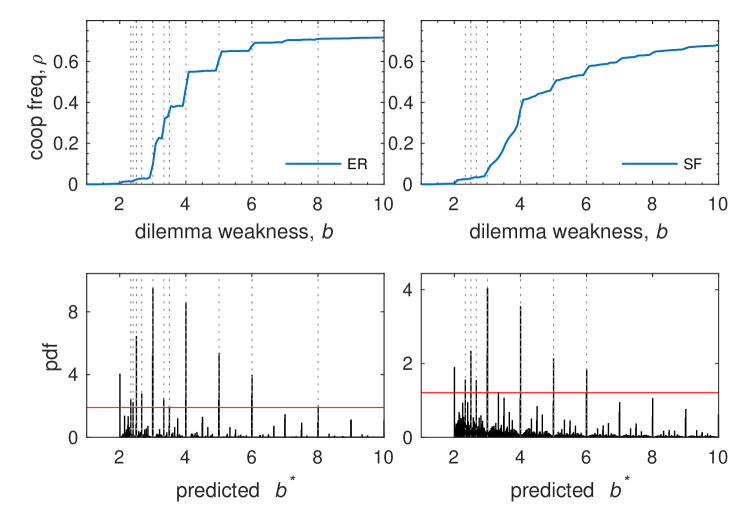
In order to inspect the role of the degree distribution in more detail, we carried out simulations with random Erdös-Renyi [75] and scale-free Barabási-Albert [76] networks, with and average degree . In the upper panels of Fig. 2 we observe that ER networks support higher values of the cooperation frequency and that in both cases, cooperation increases in a stepwise manner, with more pronounced plateaux in the ER case. For such more complex networks, the set of possible values predicted by Eq.(15) is very numerous, and one sees that not in all of them does a significant change in the cooperation frequency appears. To explain this, we consider not only the sequence of unique degrees, but the degree distribution. By knowing how often each degree appears in the network, we can calculate the multiplicity of each value, resulting in an excellent indicator of how probable is that a certain value determines a sharp variation in the cooperation frequency. In the bottom panels of Fig. 2 we plot the histograms of the average multiplicity of the values in Eq. (15) in the degree distributions of the ER (left) and SF (right) networks. The vertical dotted lines mark those local maxima whose prominence (height difference with respect to the local surrounding baseline) is above a given threshold (red horizontal line). Remarkably, the steps transitions observed in the cooperation frequency occur precisely at these more frequent , as shown by the same vertical dotted lines in the top panels.
To further investigate the role played by the second order structural details we study the impact of varying the correlation degree properties of the network while keeping its degree sequence. Figure 3 (top left panel) reports how cooperation evolves in RR networks which include only nodes with degrees , but controlling the population size : equal size () and two asymmetric cases where one population is much larger than the other ( or ). One clearly observes that the relevant jumps in the cooperation occur at exactly the same values of , namely, , matching the predicted values highlighted by the vertical dotted lines. However, the steepness of the transitions is certainly not the same due to a difference in the multiplicity caused by different degree frequencies.
A more subtle but showing case is presented in Figure 3 (top right panel). Here the degree distribution is preserved in all cases and . Therefore, the theoretical multiplicity coming from the degree distribution is the same. However, in this example we control the level of degree-degree correlation measured by the associated Pearson coefficient [77] (see legend in the right panel). Starting from uncorrelated networks (), we perform the rewiring procedure of Ref. [78] that preserves the degree distribution until the desired level of degree-degree correlation is achieved [79, 80]. This way, one can produce graphs with very high positive correlation, in which nodes with the same degree tend to be linked among them (), and networks whose nodes have are more likely to be linked to nodes with (). The clear differences in the transitions (in particular for positively correlated networks) indicates that, since the calculation of involves all possible pairs of degrees, in correlated networks the real multiplicity could be shifted from the neutral one determined only by the degree distribution. Indeed, the bottom panels in Fig. 3 show the histograms for the actual multiplicity of considering the real pairings in the adjacency matrices, revealing that the height of the bars differs in each case, and they provide a closer predictor of a phase transition in the game.

Notice that our conjecture states that if there is a sharp change in the cooperation frequency, the corresponding is one of the values, but the reverse is not always true. This unidirectional correspondence can be verified, for instance, in Fig. 1, where not all the predicted values (indicated by the dotted vertical lines) lead to an abrupt change in the cooperation. As the conjecture involves a critical phenomenon, we also have to carefully inspect the role of the stochastic part of the dynamics, here represented by the temperature parameter which controls the shape of the probability function for the strategy update. To this end, in Fig. 4 we show the evolution of cooperation in RR graphs with ( as in Fig. 1(b)) for several values of the temperature. In addition, we also include the corresponding values as vertical dotted lines. One easily sees substantial changes in cooperation always coinciding with one of the vertical lines but, depending on the temperature, different are selected, and also differences in the height of the transition are observed. For instance, while lower temperatures support cooperation changes around , for , cooperation does not evolve. Temperature dependence of the cooperation is shown on the right panel for values of close to the major transitions observed in the left panel. The results suggest the existence of an optimal temperature that maximises cooperation, with a peak that shifts to lower temperatures as increases.
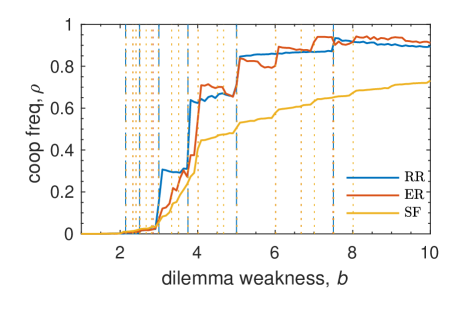
The overall scenario just described in the case of link strategy remains qualitatively unchanged for the simpler case of node strategy, considered as a particular case in Eq. (16). Figure 5 shows the cooperation curves for node strategy in RR graphs with and ER and SF graphs with the same average degree . In general, as compared with Fig. 1(b) and Figs. 2(a,b), one observes that cooperation frequencies reach higher values with node strategy games. Although Eq. (16) predicts a smaller set of than Eq.(15) for the same degree sequence, it is still able to capture the major transitions as shown by the vertical lines corresponding to the with higher prominence in their frequency distribution. For example, if we closely compare the transition to cooperation in the RR graphs using link and node strategies, Fig. 1(b) and Fig.5 (blue line), major changes take place at and , as predicted by both schemes.
For the sake of comparison with other classic studies [7, 18], we also numerically check the conjecture obtained in Eq. (18) for the unpunished case introduced at the end of Sec. 2. Furthermore, in this case the system evolution is carried out by implementing Monte Carlo simulations such that whenever the payoffs of two engaged and randomly selected players verify , then player imitates ’s strategy with a probability for and otherwise, being a normalized payoff difference. Notice that the slope is playing a similar functional role than in the sigmoidal function of Eq. (5) and that corresponds to the case reported in Refs. [81, 18].
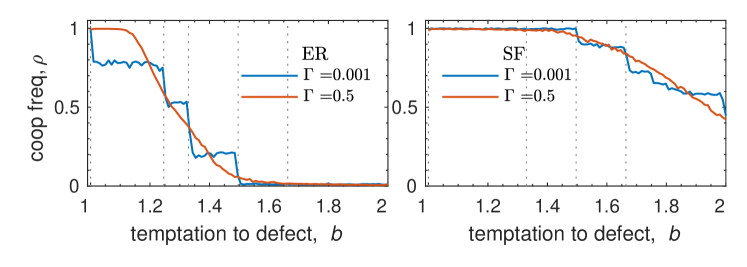
Figure 6 shows how the cooperation evolves as a function of the game parameter for the dilemma with no cost for both ER and SF networks and two values of the parameter quantifying the uncertainty of strategy adoptions. We observe that cooperation evolves in a continuous way for (transition probability is directly the normalised payoff difference as used in Ref. [7]) and, phase transitions from pure cooperation to a mixed state (and from a mixed state to complete defection for ER topologies) are perfectly predicted by those values (marked as dotted vertical lines) in Eq. (18) whose probability density function is above a given threshold. One sees that reducing the value of (i.e. increasing the likelihood of a player to change its strategy even for very low payoff differences) breaks the continuous evolution of the cooperation into a series of plateaux at different mixed levels of defection and cooperation.
4 Discussion
Cooperation is much more widespread in nature than the Darwinian premise of ‘only the fittest survive’ might suggest. Why and under which conditions cooperation thrives is, therefore, an evergreen subject across the social and natural sciences [82, 83, 84, 85, 86, 87]. Evolutionary game theory is traditionally used to formalise the problem mathematically with social dilemmas [88, 89, 90], and networks are commonly used as the backbone for the simulation of these games. We have here shown that the structure of the former in terms of the unique sequence of degrees predict the outcome in the latter, particularly in terms of the game parameters at which significant shifts in the level of cooperation can be expected. In particular, we have proposed a conjecture for cooperation transitions in arbitrary networks, including phase transitions from absorbing to mixed strategy phases.
Results based on the evolutionary prisoner’s dilemma game on random and scale-free networks of various sizes demonstrate the effectiveness of the conjecture. Indeed, since the conjecture is based on the different degrees present in the network, the network size does not modify the set of game parameters critical to produce shifts in the cooperation frequency. We have reported good agreements between the predictions and the results obtained with either a synchronous and asynchronous update of strategies, thus providing a viable alternative to computationally expensive and often time-consuming simulations. We have shown that beyond the main qualitative information provided by the unique sequence of degrees, the degree distribution and the possible second order structural correlations provide further quantitative details about the transitions. Although we have explored the predictive power of the conjecture only for the prisioner’s dilemma, it can be generalized to any social dilemma as the conjecture just operates on the payoff matrix and the critical game parameters are extracted only from the condition that the payoff difference between two agents is zero. Despite the success, we also note the requirements for the conjecture to work best. Namely, the presence of high stochasticity levels in the probability of strategy update may compromise the emergence of sharp transitions, which can explain the fact that these have not been previously observed.
In this light, the conjecture holds the promise of the optimisation of large-scale simulations of evolutionary processes on complex networks, not just related to cooperation as a particular example of prosocial behaviour, but more generally for the broader class of moral behaviour where similar models are often employed [91]. By providing a fast and straightforward way to estimate the outcome of evolutionary processes on arbitrary networks and a wide class of games without the need for actual simulations, the conjecture should prove helpful in a wide range of research fields, further strengthening the role of physics and network science within them.
I.S.N. and I.L. acknowledge support from the Ministerio de Economía, Industria y Competitividad of Spain under project FIS2017-84151-P and the Ministerio de Ciencia e Innovación under project PID2020-113737GB-I00. They also acknowledge the computational resources and assistance provided by CRESCO, the supercomputing center of ENEA in Portici, Italy. M.P. was supported by the Slovenian Research Agency (Grant Nos. P1-0403 and J1-2457).
References
References
- [1] Nowak M A and May R M 1992 Nature 359 826–829
- [2] Nash J 1950 Proc. Natl. Acad. Sci. U.S.A. 36 48–49
- [3] Nash J 1951 Ann. Math. 54 286–295
- [4] Szabó G and Fáth G 2007 Phys. Rep. 446 97–216
- [5] Perc M and Szolnoki A 2010 BioSystems 99 109–125
- [6] Wang Z, Wang L, Szolnoki A and Perc M 2015 Eur. Phys. J. B 88 124
- [7] Santos F C and Pacheco J M 2005 Phys. Rev. Lett. 95 098104
- [8] Nowak M A 2006 Science 314 1560–1563
- [9] Albert R and Barabási A L 2002 Rev. Mod. Phys. 74 47–97
- [10] Newman M E J 2003 SIAM Review 45 167–256
- [11] Boccaletti S, Latora V, Moreno Y, Chavez M and Hwang D 2006 Phys. Rep. 424 175–308
- [12] Santos F C, Pacheco J M and Lenaerts T 2006 Proc. Natl. Acad. Sci. USA 103 3490–3494
- [13] Gómez-Gardeñes J, Campillo M, Floría L M and Moreno Y 2007 Phys. Rev. Lett. 98 108103
- [14] Rong Z, Li X and Wang X 2007 Phys. Rev. E 76 027101
- [15] Poncela J, Gómez-Gardeñes J, Floría L M and Moreno Y 2007 New J. Phys. 9 184
- [16] Masuda N 2007 Proc. R. Soc. B 274 1815–1821
- [17] Tomassini M, Luthi L and Pestelacci E 2007 Int. J. Mod. Phys. C 18 1173–1185
- [18] Szolnoki A, Perc M and Danku Z 2008 Physica A 387 2075–2082
- [19] Assenza S, Gómez-Gardeñes J and Latora V 2008 Phys. Rev. E 78 017101
- [20] Santos F C, Santos M D and Pacheco J M 2008 Nature 454 213–216
- [21] Poncela J, Gómez-Gardeñes J and Moreno Y 2011 Phys. Rev. E 83 057101
- [22] Tanimoto J, Brede M and Yamauchi A 2012 Phys. Rev. E 85 032101
- [23] Amaral M A and Javarone M A 2018 Phys. Rev. E 97 042305
- [24] Abramson G and Kuperman M 2001 Phys. Rev. E 63 030901(R)
- [25] Kim B J, Trusina A, Holme P, Minnhagen P, Chung J S and Choi M Y 2002 Phys. Rev. E 66 021907
- [26] Masuda N and Aihara K 2003 Phys. Lett. A 313 55–61
- [27] Santos F C, Rodrigues J F and Pacheco J M 2005 Phys. Rev. E 72 056128
- [28] Tomassini M, Luthi L and Giacobini M 2006 Phys. Rev. E 73 016132
- [29] Fu F, Liu L H and Wang L 2007 Eur. Phys. J. B 56 367–372
- [30] Vukov J, Szabó G and Szolnoki A 2008 Phys. Rev. E 77 026109
- [31] Vukov J and Szabó G 2005 Phys. Rev. E 71 036133
- [32] Lee S, Holme P and Wu Z X 2011 Phys. Rev. Lett. 106 028702
- [33] Zimmermann M G, Eguíluz V M and San Miguel M 2004 Phys. Rev. E 69 065102(R)
- [34] Pacheco J M, Traulsen A and Nowak M A 2006 Phys. Rev. Lett. 97 258103
- [35] Fu F, Chen X, Liu L and Wang L 2007 Physica A 383 651–659
- [36] Szolnoki A, Perc M and Danku Z 2008 EPL 84 50007
- [37] Fu F, Wu T and Wang L 2009 Phys. Rev. E 79 036101
- [38] Szolnoki A and Perc M 2009 New J. Phys. 11 093033
- [39] Holme P, Trusina A, Kim B J and Minnhagen P 2003 Phys. Rev. E 68 030901
- [40] Guimerà R, Danon L, Díaz-Guilera A, Giralt F and Arenas A 2003 Phys. Rev. E 68 065103
- [41] Lozano S, Arenas A and Sánchez A 2008 PLoS ONE 3 e1892
- [42] Boccaletti S, Bianconi G, Criado R, del Genio C, Gómez-Gardeñes J, Romance M, Sendiña-Nadal I, Wang Z and Zanin M 2014 Phys. Rep. 544 1–122
- [43] Kivelä M, Arenas A, Barthelemy M, Gleeson J P, Moreno Y and Porter M A 2014 J. Complex Netw. 2 203–271
- [44] Gómez-Gardeñes J, Gracia-Lázaro C, Floría L M and Moreno Y 2012 Phys. Rev. E 86 056113
- [45] Jiang L L and Perc M 2013 Sci. Rep. 3 2483
- [46] Wang Z, Wang L and Perc M 2014 Phys. Rev. E 89 052813
- [47] Battiston F, Perc M and Latora V 2017 New J. Phys. 19 073017
- [48] Shen C, Chu C, Shi L, Jusup M, Perc M and Wang Z 2018 EPL (Europhysics Letters) 124 48003
- [49] Fotouhi B, Momeni N, Allen B and Nowak M A 2018 Nat. Human Behav. 2 492
- [50] Shi L, Shen C, Geng Y, Chu C, Meng H, Perc M, Boccaletti S and Wang Z 2019 Nonlinear Dyn. 96 49–56
- [51] Duh M, Gosak M, Slavinec M and Perc M 2019 New J. Phys. 21 123016
- [52] Sun C, Luo C and Li J 2020 Chaos, Solitons & Fractals 135 109769
- [53] Wang Z, Szolnoki A and Perc M 2013 Sci. Rep. 3 1183
- [54] Battiston F, Cencetti G, Iacopini I, Latora V, Lucas M, Patania A, Young J G and Petri G 2020 Phys. Rep. 874 1–92
- [55] Burgio G, Matamalas J T, Gómez S and Arenas A 2020 Entropy 22 744
- [56] Alvarez-Rodriguez U, Battiston F, de Arruda G F, Moreno Y, Perc M and Latora V 2021 Nat. Hum. Behav. 5 586–595
- [57] Guo H, Jia D, Sendiña-Nadal I, Zhang M, Wang Z, Li X, Alfaro-Bittner K, Moreno Y and Boccaletti S 2021 Chaos, Solitons & Fractals 150 111103 ISSN 0960-0779
- [58] Tanimoto J and Sagara H 2007 Biosystems 90 105–114 ISSN 0303-2647
- [59] Wang Z, Kokubo S, Jusup M and Tanimoto J 2015 Physics of Life Reviews 14 1–30 ISSN 1571-0645
- [60] Ito H and Tanimoto J 2018 Royal Society Open Science 5 181085
- [61] Ohtsuki H, Hauert C, Lieberman E and Nowak M A 2006 Nature 441 502–505
- [62] Allen B, Lippner G, Chen Y T, Fotouhi B, Nowak M A and Yau S T 2017 Nature 544 227–230
- [63] Javarone M A, Antonioni A and Caravelli F 2016 EPL 114 38001
- [64] Javarone M A 2016 Eur. Phys. J. B 89 42
- [65] Rapoport A 1989 Prisoner’s dilemma Game Theory (Springer) pp 199–204
- [66] Sendiña Nadal I, Leyva I, Perc M, Papo D, Jusup M, Wang Z, Almendral J A, Manshour P and Boccaletti S 2020 Phys. Rev. Research 2(4) 043168
- [67] Kokubo S, Wang Z and Tanimoto J 2015 Appl. Math. Comput. 259 552–568
- [68] Tanimoto J 2017 Appl. Math. Comput. 304 20–27
- [69] Fermi E 1926 Rendiconti Lincei 3 145–149
- [70] Ohtsuki H, Hauert C, Lieberman E and Nowak M A 2006 Nature 441 502–505
- [71] Nowak M A and Sigmund K 1992 Nature 355 250–253
- [72] Perc M 2009 New J. Phys. 11 033027
- [73] Huberman B and Glance N 1993 Proc. Natl. Acad. Sci. USA 90 7716–7718
- [74] Molloy M and Reed B 1995 Random Structures & Algorithms 6 161–180
- [75] Erdös P and Rényi A 1960 Publ. Math. Inst. Hung. Acad. Sci 5 17–60
- [76] Barabási A L and Albert R 1999 science 286 509–512
- [77] Newman M E J 2003 Phys. Rev. E 67(2) 026126
- [78] Sendiña Nadal I, Leyva I, Navas A, Villacorta-Atienza J A, Almendral J A, Wang Z and Boccaletti S 2015 Phys. Rev. E 91(3) 032811
- [79] Maslov S and K S 2002 Science 296 910–3
- [80] Xulvi-Brunet R and Sokolov I M 2004 Phys. Rev. E 70(6) 066102
- [81] Santos F C and Pacheco J M 2005 Phys. Rev. Lett. 95(9) 098104
- [82] Axelrod R 1984 The Evolution of Cooperation (New York: Basic Books)
- [83] Henrich N and Henrich J P 2007 Why Humans Cooperate: A Cultural and Evolutionary Explanation (Oxford, U.K.: Oxford University Press)
- [84] Nowak M A and Highfield R 2011 SuperCooperators: Altruism, Evolution, and Why We Need Each Other to Succeed (New York: Free Press)
- [85] Rand D G and Nowak M A 2013 Trends in Cognitive Sciences 17 413–425
- [86] Kraft-Todd G, Yoeli E, Bhanot S and Rand D 2015 Current Opinion in Behavioral Sciences 3 96–101
- [87] Perc M, Jordan J J, Rand D G, Wang Z, Boccaletti S and Szolnoki A 2017 Phys. Rep. 687 1–51
- [88] Weibull J W 1995 Evolutionary Game Theory (Cambridge, MA: MIT Press)
- [89] Hofbauer J and Sigmund K 1998 Evolutionary Games and Population Dynamics (Cambridge, U.K.: Cambridge University Press)
- [90] Nowak M A 2006 Evolutionary Dynamics (Cambridge, MA: Harvard University Press)
- [91] Capraro V and Perc M 2021 J. R. Soc. Interface 18 20200880