11email: {qk.zuo,yy.shen,sq.wang}@siat.ac.cn
22institutetext: Shenzhen University, Shenzhen, 518000, China
22email: leiby@szu.edu.cn
33institutetext: Renmin University of China, Beijing, 100000, China
33email: liuyonggsai@ruc.edu.cn 44institutetext: Harbin Engineering University, Haerbin, 150000 , China
44email: fengzhiguang@hrbeu.edu.cn
Multimodal Representations Learning and Adversarial Hypergraph Fusion for Early Alzheimer’s Disease Prediction
Abstract
Multimodal neuroimage can provide complementary information about the dementia, but small size of complete multimodal data limits the ability in representation learning. Moreover, the data distribution inconsistency from different modalities may lead to ineffective fusion, which fails to sufficiently explore the intra-modal and inter-modal interactions and compromises the disease diagnosis performance. To solve these problems, we proposed a novel multimodal representation learning and adversarial hypergraph fusion (MRL-AHF) framework for Alzheimer’s disease diagnosis using complete trimodal images. First, adversarial strategy and pre-trained model are incorporated into the MRL to extract latent representations from multimodal data. Then two hypergraphs are constructed from the latent representations and the adversarial network based on graph convolution is employed to narrow the distribution difference of hyperedge features. Finally, the hyperedge-invariant features are fused for disease prediction by hyperedge convolution. Experiments on the public Alzheimer’s Disease Neuroimaging Initiative(ADNI) database demonstrate that our model achieves superior performance on Alzheimer’s disease detection compared with other related models and provides a possible way to understand the underlying mechanisms of disorder’s progression by analyzing the abnormal brain connections.
Keywords:
Multimodal representation Adversarial hypergraph fusion Alzheimer’s disease Graph convolutional networks.1 Introduction
Alzheimer’s disease(AD) is a severe neurodegenerative diseases among the old people and the pathological changes are reflected on the symptoms including memory decline, aphasia and other decreased brain functions [1]. Since there is no effective medicine for AD, much attention has been attracted on its prodromal stage, that is, mild cognition impairment(MCI) [2], so that intervention can be implemented to slow down or stop the progression of the disease. With the success of deep learning on medical images analysis [3, 4, 5, 6, 7] and other fields [8, 9], non-invasive magnetic imaging technology becomes an effective tool for detecting dementia at early disease stages, and different modalities carry complementary disease-related information. For example, abnormal functional and structural connectivity between brain regions has been discovered in the resting-state functional magnetic resonance imaging(fMRI) [10] and diffusion tensor imaging(DTI) [11] modality, respectively; and the T1-weighted magnetic resonance imaging(MRI) [12] data contains the information of volume changes in different brain regions. Many researchers [13, 14, 15, 16, 17] have achieved good performance in brain disease prediction by fusing either two of the above modalities. Therefore, we take all the three modalities as the input of our model to conduct representations learning and fusion for disease diagnosis.
Considering the number of subjects with complete three modalities is limit, it is necessary to make full use of the input data for learning latent representations. The input data can be used to estimate additional distribution, which is prior information for training a much more discriminative and robust model. To make use of additional distribution, the Generative Adversarial Networks(GAN) [18] provides an appropriate way for representation learning of the graph data by matching the distribution consistency in representation space. The basic principle is variational inference [19, 20, 21] which maximizes the entropy of the probability distribution. It has been applied successfully in medical image analysis [22, 23, 24, 25] and citation network [26, 27]. Besides, Convolution Neural Network(CNN) has great power in recognizing disease-related images [28, 29, 30, 32, 33], which can be utilized to extract features of MRI in data space by a model pre-trained from a great many of unimodal images [31, 34]. Therefore, we designed a Distribution-based Graph GAN (D-GraphGAN) and a CNN-based Graph AutoEncoder(CNN-GraphAE) to extract latent representations from fMRI&DTI and MRI&DTI, respectively.
After the representations extraction, direct fusion of representations concatenation may lead to bad performance in exploring cross-modal interactions, since the data distributions in representation space may be heterogeneous [35]. Adversarial strategy is suitable for translating modality distribution [36]. As traditional graph with pairwise regions interaction is not sufficient to characterize the brain network connectivity and fail to encode high-order intra-modal correlations, a hypergraph [37] beyond pairwise connections is more suitable to describe the complex brain activities behind dementia. It is found that Hypergraph Neural Networks(HGNN) achieve better performance than Graph Convolutional Networks(GCN) in citation networks [38]. Motivated by this, we develop an adversarial hyperedge network to boost multimodal representation fusion performance for AD diagnosis.
In this paper, we propose a Multimodal Representation Learning and Adversarial Hypergraph Fusion(MRL-AHF) to make use of inter-modal complementary and intra-modal correlation information to improve the performance of Alzheimer’s disease detection. The estimated additional distribution and pre-trained model are incorporated to improve the ability of representation learning. A hypergraph fusion strategy is adopted to narrow distribution difference in hyperedge space for efficiently fusion by adversarial training. Our MRL-AHN approach is able to enhance the ability of representation learning and boost the multimodal fusing performance. Experiments on the Alzheimer’s Disease Neuroimging Initiative(ADNI) database show that our approach achieves superior performance on MCI detection compared with other related works.
2 Method
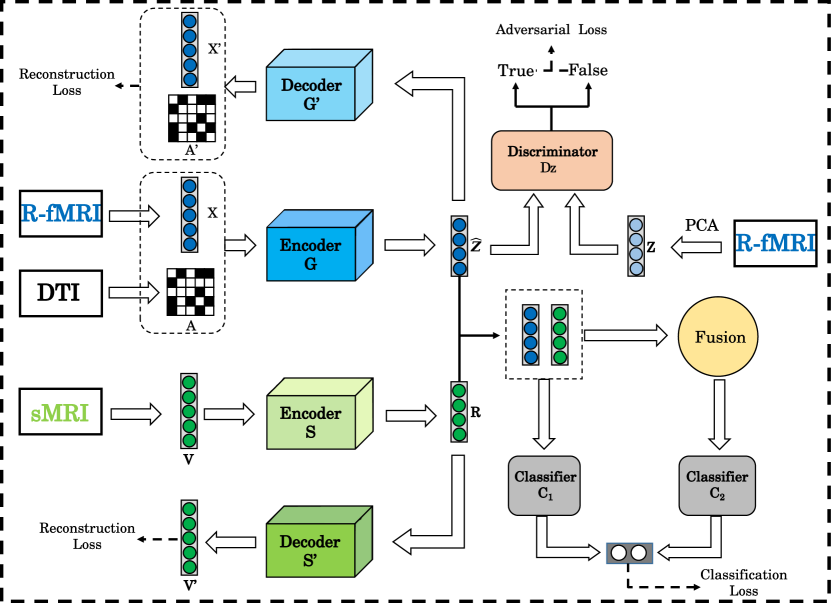
An overview of MRL-AHF is given in Fig. 1. Our framework is comprised of two stages: a representation space learning stage and a adversarial hypergraph fusion stage. The first stage learns the latent representations from fMRI&DTI and MRI&DTI by distribution-based GraphGAN and CNN-based GraphAE, respectively. The second stage utilizes the representations output by encoders and to conduct hypergraph fusion via adversarial training. The symbol meanings are given bellow: and represent the structural connection(SC) and reconstructed SC matrix, respectively. and denote the functional timeseries(FT) at each brain Region-of-Interest(ROI), the reconstructed FT feature, respectively. and are the feature vector(FV) and reconstructed FV. and are features in representation space.
2.1 Distribution-based GraphGAN
2.1.1 Graph construction.
Suppose an indirect graph is formed with N brain Regions of Interest(ROIs) based on anatomical atlas, and are a set of nodes and edges, respectively. Specifically, denotes the node feature matrix of brain functional activities derived from fMRI time series, and represents the physical connections matrix reflecting the brain structural information. The element in adjacent matrix is represented with if there exists connection between th and th region, otherwise .
2.1.2 Additional distribution estimation.
Normal distribution cannot represent the graph properly, and an appropriate can boost the ability in learning discriminative representations in adversarial network. In terms of no other known information except for the give graph data and , we introduce a non-parametric estimation method, Kernel Density Estimation(KDE), to exstimate that approximates to by combining both anatomical and nueroimaging information. Specifically, based on some certain disease-related ROIs, we can obtain a set of nodes by applying Determinant Point Process(DPP) [39] method on matrix , and the corresponding node features are selected to form features matrix with nodes, followed with dimension reduction by Principal Component Analysis(PCA) to get . is the dimension in latent representation space. Assuming is a latent representation of each node, can be defined by
| (1) |
Where is a multi-dimensional Gaussian Kernel function, denotes the bandwidth that determines the smoothness of the distribution
2.1.3 GraphGAN.
The encoder encodes and as latent representations , which are sent to the discriminator as negative samples. The positive samples are estimated from the additional distribution . The adversarial loss function is defined as follows
| (2) |
| (3) |
Besides, the reconstruction loss and the classification loss are given bellow:
| (4) |
| (5) |
Where, , and are the reconstructed graph data, is binary cross entropy function, is the predicted labels. is a two-layer perception. and are two-layer GCN, specifically.
2.2 CNN-based GraphAE
A dense convolutional network with 4 blocks is trained on large number of labeled images and then used to extract a feature vector for each MRI using the last fully connected layer. In order to deploy CNN feature on the ROIs, we equally distribute the feature on the ROIs, and the SC is used to guide the feature to flow between two connected nodes. The latent representations is obtained by a two-layer GCN Encoder , followed with a decoder to reconstruct features. The reconstruct loss and classification loss are defined as
| (6) |
| (7) |
Where, , is the truth one-hot label, is the predicted label.
2.3 Adversarial Hypergraph Fusion
2.3.1 Hypergraph construction.
By denoting a hyperedge connecting multiple nodes, we can construct a hyperedge for each node centered. Specifically, we use K-NearestNeighbor(KNN) method to select the nodes for each hyperedge based on the Euclidean distance. At last, we can get an incident matrix and from the learned representations and , respectively. The formula is given as follows:
| (8) |
2.3.2 Adversarial Hypergraph Learning.
In order to narrow the gap between the representations, we adopt the adversarial training strategy to make the distribution from different modalities the same. The hypergraph convolution is spitted into convex convolution and hyperedge convolution. The hyperedge feature of is computed by Vertex aggregation is sent to the discriminator as a positive sample, the negative sample is obtained by Vertex convolution of hypergraph , the formula is illustrated as follows:
| (9) |
| (10) |
Where, and are the edge degree of and , respectively; is the weighting parameters. Both and are sent to the discrminatr for adversarial training.Then, we fuse the hyperedge features by using edge aggregation to get vertex feature matrix as follows
| (11) |
Finally, the fused features is used to construct connectivity matrix by bilinear pooling and then sent to the classifier for task learning. The adversarial and classification loss are given below
| (12) |
Here, and are the node degree of and , respectively; and is the predicted label.
2.4 Training strategy
In Conclusion, the total loss of the proposed frame is:
| (13) |
Where is a hyper-parameter that determines the relative importance of feature fusion loss items.
During the training process, firstly, we update the generators, encoders and decoders with the loss backpropogation of , and ; next, we use the to update the discriminator to improve the discriminator ability of joint and marginal distribution; then, and are utilized to update encoders and classifier to boost the performance of task learning. After the discriminative representations have been extracted, and are performed to update the parameters in vertex convolution and discriminator alternatively; finally, updates the classifier to get a discrminative decision on the fused features.
3 Experiments
3.1 Data
A total of 300 subjects from ADNI database are used for this study with complete three modalities: fMRI, DTI and T1-weighted MRI, including 64 AD patients (39 male and 25 female, mean age 74.7, standard deviation 7.6), 76 late MCI patients (43 male and 33 female, mean age 75.8, standard deviation 6.4), 82 early MCI patients (40 male and 42 female, mean age 75.9, standard deviation 7.5), and 78 normal controls (39 male and 39 female, mean age 76.0, standard deviation 8.0).
For T1-weighted MRI data, we follow the standard proprocessing steps, including strip non-brain tissue of the whole head, image reorientation, resampling into a voxel size of 91x109x91 in Neuroimaging Informatics Technology Initiative(NIFTI) file format and extracting a 128-dimensional feature vector FV by a pre-trained densnet model. The fMRI data is preprocessed using GRETNA toolbox to obtain node features FT with a size of 90x187, the main steps include magnetization equilibrium, head-motion artifacts, spatial normalization, spatial filter with 0.01-0.08Hz, regression of local time-series, warping automated anatomical labeling(AAL90) atlas and removing the first 10 timepoints. The DTI data preprocessing operation is performed using PANDA toolbox to get 90x90 matrix SC. The detailed procedures are skull stripping, resolution resampling, eddy currents correction, fiber tracking. The generated structural connectivity is input to our model as graph structure.
3.2 Experimental settings
In this study, we use three kinds of binary classification task, i.e., (1)EMCI vs. NC; (2)LMCI vs. NC; (3)AD vs. NC. 10-fold cross validation is selected for task learning. In order to demonstrate the superiority of our proposed model compared with other models, we introduce previous methods for comparison. (1) Support Vector Machine(SVM) [40]; (2) two layers of the diffusion convolutional neural networks(DCNN) [41]; (3) our method with only fMRI and DTI; (4) our method with complete three modalities. For convenient viewing, the above methods using fMRI and DTI are denoted SVM(F-D), DCNN(F-D) and Ours(F-D).
In the experiments, we set the model parameters as follows:, , , , tanh and sigmoid activation function for generators and decoders, respectively. The disease-related ROIs are selected according to previous studies [2, 15, 16]. is a two-layer perception with 16-neuron and 2-neuron in the hidden and output layers. is a two-layer perception with 90-neuron and 2-neuron in the hidden and output layers. and are two-layer GCN, specifically, the hidden and output layers of is 64-neuron and 32-neuron, while the hidden and output layers of is 64-neuron and 187-neuron. The hidden and output layers of is 64-neuron and 32-neuron, the hidden and output layers of is 64-neuron and 128-neuron. For the discriminator , the hidden layer contains 1 filter with the size 32x1, the output layer contains 1 filters with the size 90x1. For the discriminator , the filter size of hidden layer is 1x90, the filter size of output layer is 90x1. To balance the adversarial training, we choose 0.001 learning rate for the generators, encoders, decoders, and classifiers, 0.0001 learning rate for the discriminators. In the training process, 100 epochs are employed on representation learning, followed with 200 epochs for adversarial hypergraph fusion.
3.3 Results
Table 1 summarizes the results of different methods in three binary classification tasks using 10-fold cross validation. As can be seen that our proposed model has the best accuracy of 95.07%, 91.56%, and 87.50% in the tasks of AD vs. NC, LMCI vs. NC, EMCI vs. NC, respectively. Our method behaves better than other methods. It is found that introducing more modal images is beneficial to improve model detection performance. In addition, comparisons between ours(F-D) and DCNN(F-D) indicate that adding distribution-guided GraphGAN can improve detection accuracy. What’s more, when compared with other related algorithms as illustrated in table 2, the proposed method has achieved superior performance for MCI detection. It ourperforms the literature by 2.08%. Note that, methods using fMRI and DTI are denoted F-D, and Ours mean the proposed model using three complete modalities.
| Method | AD vs. NC | LMCI vs. NC | EMCI vs. NC | |||||||||
|---|---|---|---|---|---|---|---|---|---|---|---|---|
| Acc | Sen | Spec | Auc | Acc | Sen | Spec | Auc | Acc | Sen | Spec | Auc | |
| SVM(F-D) | 76.05 | 70.31 | 80.76 | 83.16 | 69.48 | 64.47 | 74.35 | 78.23 | 65.62 | 54.87 | 76.92 | 71.46 |
| DCNN(F-D) | 84.51 | 87.50 | 82.05 | 89.40 | 79.87 | 77.63 | 82.05 | 84.29 | 76.25 | 76.83 | 75.64 | 82.68 |
| Ours(F-D) | 88.73 | 84.37 | 92.31 | 97.48 | 84.42 | 84.21 | 84.62 | 94.01 | 82.50 | 82.93 | 82.05 | 91.65 |
| Ours | 95.07 | 93.75 | 96.15 | 98.20 | 91.56 | 94.74 | 88.89 | 94.64 | 87.50 | 86.59 | 88.46 | 93.05 |
| Method | Modality | subject | MCI vs. NC | |||
|---|---|---|---|---|---|---|
| Acc | Sen | Spec | Auc | |||
| Xing et al. [14] | fMRI&MRI | 368 | 79.73 | 86.49 | 72.97 | - |
| Yu et al. [15] | fMRI&DTI | 184 | 85.42 | 86.57 | 84.42 | 89.98 |
| Zhu et al. [42] | MRI&PET&CSF | 152 | 83.54 | 95.00 | 62.86 | 78.15 |
| Ours | MRI&fMRI&DTI | 160 | 87.50 | 86.59 | 88.86 | 93.05 |
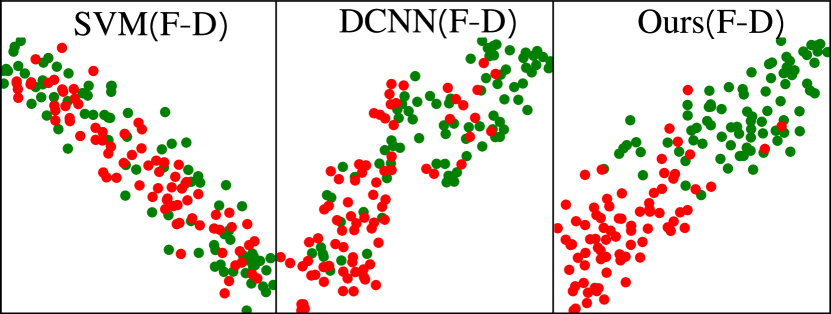
We further investigate the classification performance of our model by t-SNE analysis. Fig. 2 shows the projection of features of three methods on the two dimensional plane in different task learning. Our model has slim and easily divisible plane compared with SVM and DCNN, indicating that the feature obtained from our method is more discriminative than that of SVM or DCNN. This investigation explains in detail why our model performs better than others in task learning.
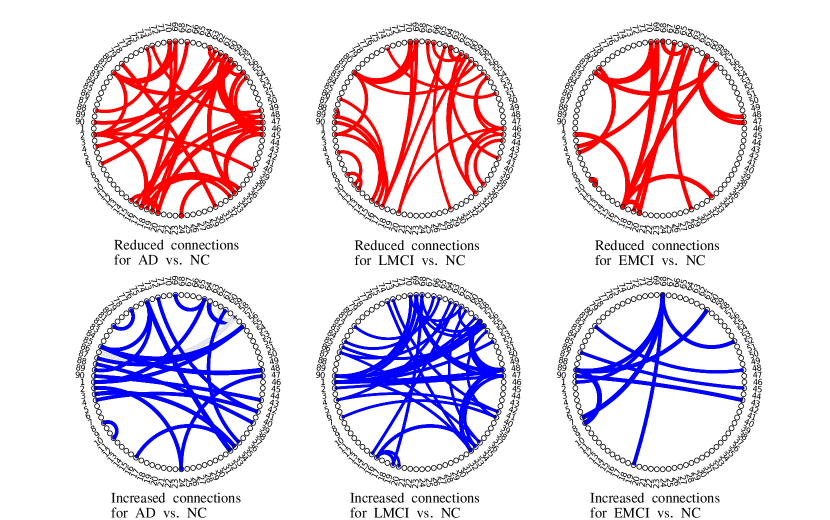
Since the interactions among multiple regions are beneficial for characterizing disease-related brain activities, we construct connectivity matrix using the fused features by bilinear pooling. As is displayed in Fig. 3, we mean the connectivity matrices of each group for each binary classification task and then subtract patients connectivity matrix from NC connectivity matrix to obtain the change of brain network connections. It gives the following information: the connections gradually reduce as the disease worsens, while the increased connections rise up in early stages and drop to a low level when deteriorated to AD. This phenomenon may be explained by compensatory mechanism generation and weakening in the progression of MCI to AD [43, 44, 45].
4 Conclusion
In this paper, we proposed a novel Multimodal-Representaion-Learning and Adversarial-Hypergraph-Fusion frame work for Alzheimer’s disease diagnosis. Specifically, features in representations space are extracted by distribution-based GraphGAN and CNN-based GraphAE, respectively. And an adversarial strategy in modal fusion is utilized for AD detection. Results on ADNI dataset demonstrate that prior information can help to enhance discrimination of representation learning and adding more modalities can boost the detection performance. Furthermore, The study on multimodal fusion gives a possible way to understand the disorder’s underlying mechanisms by analyzing the abnormal brain connections. In our future work, we will focus the abnormal connections among some certain ROIs and extend this work to multitask classification.
Acknowledgment.
This work was supported by the National Natural Science Foundations of China under Grant 61872351, the International Science and Technology Cooperation Projects of Guangdong under Grant 2019A050510030, the Distinguished Young Scholars Fund of Guangdong under Grant 2021B1515020019, the Excellent Young Scholars of Shenzhen under Grant RCYX20200714114641211 and Shenzhen Key Basic Research Project under Grant JCYJ20200109115641762.
References
- [1] Association, A.s.: 2019 Alzheimer’s disease facts and figures. Alzheimer’s & dementia. 15(3), 321–387 (2019)
- [2] Li, Y., Liu, J., Tang, Z., et al.: Deep spatial-temporal feature fusion from adaptive dynamic functional connectivity for MCI identification. IEEE transactions on medical imaging. 39(9), 2818–2830 (2020)
- [3] Wang S., Shen Y., Shi C., et al.: Skeletal maturity recognition using a fully automated system with convolutional neural networks. IEEE Access. 6, 29979–29993 (2018)
- [4] Wang S., Shen Y., Zeng D., et al.: Bone age assessment using convolutional neural networks. In: 2018 International Conference on Artificial Intelligence and Big Data (ICAIBD), pp. 175–178 (2018)
- [5] Wang S., Hu Y., Shen Y., et al.: Classification of diffusion tensor metrics for the diagnosis of a myelopathic cord using machine learning. International journal of neural systems. 28(02), 1750036 (2018)
- [6] Lei, B., Xia, Z., Jiang, F., et al.: Skin lesion segmentation via generative adversarial networks with dual discriminators. Medical Image Analysis. 64, 101716 (2020)
- [7] Wang, S., Wang, X., Shen, Y., et al.: An ensemble-based densely-connected deep learning system for assessment of skeletal maturity. IEEE Transactions on Systems, Man, and Cybernetics: Systems (2020)
- [8] Zeng, D., Wang, S., Shen, Y., et al.: A GA-based feature selection and parameter optimization for support tucker machine. Procedia computer science. 111, 17-23 (2017)
- [9] Wu, K., Shen, Y., and Wang, S.: 3D convolutional neural network for regional precipitation nowcasting. Journal of Image and Signal Processing. 7(4), 200-212 (2018)
- [10] Franzmeier, N., Dyrba, M.: Functional brain network architecture may route progression of Alzheimer’s disease pathology.Brain. 140(12), 3077–3080 (2017)
- [11] Pereira, J.B., Van Westen, D., Stomrud, E., et al.: Abnormal structural brain connectome in individuals with preclinical Alzheimer’s disease. Cerebral cortex. 28(10), 3638–3649 (2018)
- [12] Schuff, N., Woerner, N., Boreta, L., et al.: MRI of hippocampal volume loss in early Alzheimer’s disease in relation to ApoE genotype and biomarkers. Brain. 132(4), 1067–1077 (2009)
- [13] Huang, J., Zhou, L., Wang, L., et al.: Attention-diffusion-bilinear neural network for brain network analysis. IEEE transactions on medical imaging. 39(7), 2541–2552 (2020)
- [14] Xing, X., Li, Q., Wei, H., et al.: Dynamic spectral graph convolution networks with assistant task training for early mci diagnosis. In: International Conference on Medical Image Computing and Computer-Assisted Intervention, pp. 639–646 (2019)
- [15] Yu, S., Wang, S., Xiao, X., et al.: Multi-scale Enhanced Graph Convolutional Network for Early Mild Cognitive Impairment Detection. In: International Conference on Medical Image Computing and Computer-Assisted Intervention, pp. 228–237 (2020)
- [16] Li, Y., Liu, J., Tang, Z., et al.: Graph convolution network with similarity awareness and adaptive calibration for disease-induced deterioration prediction. Medical Image Analysis. 69, 101947 (2021)
- [17] Yu, W., Lei B., Michael K., et al.: Tensorizing GAN with high-order pooling for Alzheimer’s disease assessment. IEEE Transactions on Neural Networks and Learning Systems (2021) \doiDOI: 10.1109/TNNLS.2021.3063516
- [18] Goodfellow, I.J., Pouget-Abadie, J., Mirza, M., et al.: Generative adversarial nets. In: Proceedings of the 27th International Conference on Neural Information Processing Systems, pp. 2672–2680 (2014)
- [19] Mo, L. F., and Wang, S. Q.: A variational approach to nonlinear two-point boundary value problems. Nonlinear Analysis: Theory, Methods and Applications, 71(12), e834–e838 (2009)
- [20] Wang, S. Q.: A variational approach to nonlinear two-point boundary value problems. Computers and Mathematics with Applications, 58(11-12), 2452-2455 (2009)
- [21] Wang, S. Q. and He, J. H.: Variational iteration method for a nonlinear reaction-diffusion process. International Journal of Chemical Reactor Engineering, 6(1) (2008)
- [22] Wang S.Q., Wang X., Hu Y., et al.: Diabetic retinopathy diagnosis using multichannel generative adversarial network with semisupervision. IEEE Transactions on Automation Science and Engineering (2020)
- [23] Hu S., Shen Y., Wang S., et al.: Brain MR to PET Synthesis via Bidirectional Generative Adversarial Network. In: International Conference on Artificial Neural Networks, pp. 698–707 (2020)
- [24] Hu, S., Shen Y., Wang S. et al.: Brain MR to PET Synthesis via Bidirectional Generative Adversarial Network. In International Conference on Medical Image Computing and Computer-Assisted Intervention, pp. 698-707 (2020)
- [25] Hu, S., Yu W., Chen Z., et al.: Medical Image Reconstruction Using Generative Adversarial Network for Alzheimer Disease Assessment with Class-Imbalance Problem. In 2020 IEEE 6th International Conference on Computer and Communications (ICCC), pp. 1323–1327 (2020)
- [26] Dai, Q., Li, Q., Tang, J., et al.: Adversarial network embedding. In: Proceedings of the AAAI Conference on Artificial Intelligence, 32(1) (2018)
- [27] Pan, S., Hu, R., Long, G., et al.: Adversarially regularized graph autoencoder for graph embedding. In: In Proceedings of the 27th International Joint Conference on Artificial Intelligence, pp. 2609–2615 (2018)
- [28] Wen, J., Thibeau-Sutre, E., Diaz-Melo, M., et al.: Convolutional neural networks for classification of Alzheimer’s disease: Overview and reproducible evaluation. Medical image analysis. 63, 101694 (2020)
- [29] Wang, H., Shen, Y., Wang, S., et al.: Ensemble of 3D densely connected convolutional network for diagnosis of mild cognitive impairment and Alzheimer’s disease. Neurocomputing. 333, 145–156 (2019)
- [30] Wang, S., Shen, Y., Chen, W., et al.: Automatic recognition of mild cognitive impairment from mri images using expedited convolutional neural networks. In: International Conference on Artificial Neural Networks, pp. 373–380 (2017)
- [31] Wang, S., Wang, H., Shen, Y., et al.: Automatic recognition of mild cognitive impairment and alzheimers disease using ensemble based 3d densely connected convolutional networks. In: 2018 17th IEEE International Conference on Machine Learning and Applications, pp. 517–523 (2018)
- [32] Hu, S., Yuan, J., Wang, S. et al.: Cross-modality synthesis from MRI to PET using adversarial U-net with different normalization. In 2019 International Conference on Medical Imaging Physics and Engineering (ICMIPE), pp. 1-5 (2019)
- [33] Lei, B., Yang, M., Yang, P., et al.:. Deep and joint learning of longitudinal data for Alzheimer’s disease prediction. Pattern Recognition. 102, 107247 (2020)
- [34] Wang, S., Wang, H., Cheung, A.C., et al.: Ensemble of 3D Densely Connected Convolutional Network for Diagnosis of Mild Cognitive Impairment and. Deep learning applications, 1098, p.53 (2020)
- [35] Baltrušaitis, T., Ahuja, C., Morency, L.P.: Multimodal machine learning: A survey and taxonomy. IEEE transactions on pattern analysis and machine intelligence. 41(2), 423–443 (2018)
- [36] Makhzani, A., Shlens, J., Jaitly, N., et al.: Adversarial autoencoders. arXiv preprint arXiv:1511.05644. (2015)
- [37] Li, Y., Liu, J., Gao, X., et al.: Multimodal hyper-connectivity of functional networks using functionally-weighted LASSO for MCI classification. Medical image analysis. 52, 80–96 (2019)
- [38] Feng, Y., You, H., Zhang, Z., et al.: Hypergraph neural networks. In: Proceedings of the AAAI Conference on Artificial Intelligence, pp. 3558–3565 (2019)
- [39] Kulesza, A., Taskar, B.: Fixed-size determinantal point processes. In: Proceedings of the 28th international conference on Machine learning, pp. 1193–1200 (2011)
- [40] Suykens J. A. K., Vandewalle J.: Least squares support vector machine classifiers. Neural processing letters.9(3), 293–300 (1999)
- [41] Atwood J., Towsley D.. Diffusion-convolutional neural networks. In: Advances in neural information processing systems, pp. 1993–2001 (2016)
- [42] Zhu Q., Yuan N., Huang J., et al.: Multi-modal AD classification via self-paced latent correlation analysis. Neurocomputing. 255,143–154 (2019)
- [43] Montembeault, M., Rouleau, I., Provost, J.S., et al.: Altered gray matter structural covariance networks in early stages of Alzheimer’s disease. Cerebral cortex. 26(6), 2650–2662 (2016)
- [44] Sun, Y., Dai, Z., Li, Y., et al.: Subjective cognitive decline: mapping functional and structural brain changes—a combined resting-state functional and structural MR imaging study. Radiology. 281(1), 185–192 (2016)
- [45] Jin, D., Wang, P., Zalesky, A., et al.: Grab‐AD:Generalizability and reproducibility of altered brain activity and diagnostic classification in Alzheimer’s Disease. Human brain mapping. 41(12), 3379–3391 (2020)