Quasar clustering at redshift 6
Abstract
Context. Large-scale surveys over the last years have revealed about 300 QSOs at redshift above 6. Follow-up observations identified surprising properties, such as the very high black hole (BH) masses, spatial correlations with surrounding cold gas of the host galaxy, or high CIV -MgII velocity shifts. In particular, the discovery of luminous high-redshift quasars suggests that at least some black holes likely have large masses at birth and grow efficiently.
Aims. We aim at quantifying quasar pairs at high redshift for a large sample of objects. This provides a new key constraint on a combination of parameters related to the origin and assembly for the most massive black holes: BH formation efficiency and clustering, growth efficiency and relative contribution of BH mergers.
Methods. We observed 116 spectroscopically confirmed QSOs around redshift 6 with the simultaneous 7-channel imager GROND in order to search for companions. Applying identical colour-colour cuts as for those which led to the spectroscopically confirmed QSO, we perform Le PHARE fits to the 26 best QSO pair candidates, and obtained spectroscopic observations for 11 of those.
Results. We do not find any QSO pair with a companion brighter than M1450 (AB) mag within our 0.1–3.3 cMpc search radius, in contrast to the serendipitous findings in the redshift range 4–5. However, a low fraction of such pairs at this luminosity and redshift is consistent with indications from present-day cosmological-scale galaxy evolution models. In turn, the incidence of L- and T-type brown dwarfs which occupy a similar colour space as QSOs, is higher than expected, by a factor of 5 and 20, respectively.
Key Words.:
Early Universe – Galaxies: active – Quasars: general – Stars: low-mass, brown dwarfs1 Introduction
Clustering of quasars provides one of the most important observational constraints to probe their physical properties, formation and evolution (Haiman & Hui, 2001) as well as the mass of their dark matter (DM) haloes (Sheth et al., 2001). As easily detectable objects throughout the Universe, quasars trace the underlying dark matter distribution (e.g. Haehnelt & Nusser, 1999), and thus provide a powerful test of hierarchical structure formation theory (e.g. Fang, 1989). How this structure formation in the early Universe proceeds in detail is far from understood. How many massive galaxies form in a single massive dark matter halo? Do all of these massive galaxies have a massive black hole (BH)? Do all these black holes accrete from the rich gas reservoir, or what are the duty cycles of QSO activity? Do massive galaxies form sub-structures and/or multiple massive black holes?
Particularly pressing questions over the last years are that of the formation channels and efficiencies of massive BHs, and of their growth rates with cosmic time (e.g. Johnson et al., 2013; Valiante et al., 2017, 2018; Inayoshi et al., 2020). Quantifying the number of QSO pairs at high-z is one observational avenue to constrain a combination of parameters of BH formation and BH growth rate. High-z QSOs can be as massive as the most massive BHs found in the local Universe (e.g. Bañados et al., 2018; Yang et al., 2020; Wang et al., 2021), and so must have grown several orders of magnitude in less than 800 Myrs. Indeed, BH formation mechanisms predict the formation of BH seeds with at most masses of a few (Volonteri, 2010; Inayoshi et al., 2020). If the growth of quasars was mostly through gas accretion, then they must have grown at the Eddington rate a large fraction of their lives. Finding QSO pairs, or the absence of, can help us understand if BH mergers play a role in their growth, and if dense environments can sustain efficient growth for several QSOs in the same region of the sky, or if baryonic processes (e.g., AGN feedback) prevent them from doing so (Wyithe et al., 2005; Kashikawa et al., 2007; Utsumi et al., 2010; Costa et al., 2014; Habouzit et al., 2019, for QSO feedback preventing galaxy formation/growth in their surroundings). Radiation from a QSO can impact a region from sub Mpc to tens of Mpc, depending on the QSO mass, accretion rate, and properties of its surrounding environment, and could therefore also inhibit the accretion activity of nearby BHs. In addition, quantifying the number of QSO pairs also provides us with constraints on BH formation efficiency, i.e. whether BH formation takes place in a large number of halos, but also on whether the formation of massive seeds could be clustered. The existence of many pairs of QSOs could indeed imply that massive seeds can form close to each other. Constraints from QSO pairs on QSO origins and growth with time are likely degenerated, but are key to improve our understanding of these extreme objects.
Quasar clustering has been investigated at different scales and depths, among others using the Sloan Digital Sky Survey (Shen et al., 2007; Hennawi et al., 2010), the 2dF QSO Redshift and Dark Energy Survey (Porciani et al., 2007; Chehade et al., 2016), or the Canada-France-Hawaii Telescope Legacy Survey (CFHTLS) (McGreer et al., 2016). Studies at different depth for a given redshift range are important since a large luminosity dependence is theoretically predicted at higher redshifts (Hopkins et al., 2007). Clustering at large scales, sampling Mpc or larger distances, is stronger at high redshifts () than at low redshifts () (Shen et al., 2007). Clustering at small scales, sampling the 10 kpc - 1 Mpc scale environment, also increases from smaller () to larger () redshift, but shows a much stronger amplitude on kpc scales than on Mpc scales, e.g. a factor 4 stronger at (Eftekharzadeh et al., 2017).
Clustering measurements at high redshift () are confronted with a problem: close quasar pairs are extremely rare. For comparison, the mean quasar separation at is 150h-1 Mpc (given the standard luminosity function of Mpc-1 mag-1 for ; e.g. Willott et al. 2010; Ross et al. 2013; Matsuoka et al. 2018; Shen et al. 2020) and at small scales ( 1 Mpc), the correlation function does not increase as fast as the volume decreases (Hennawi et al., 2010). However, direct observations of pairs might suggest differently - the three hitherto highest-redshift QSO pairs were all found serendipitously: (i) Schneider et al. (2000) reported a pair at z=4.26 with a separation of 33′′ (corresponding to 160 kpc proper on the sky) which was found in the slit while spectroscopically confirming another QSO candidate; (ii) Djorgovski et al. (2003) discovered a z=4.96 quasar at a separation of 196′′ (or proper transverse separation of 0.9 h-1 Mpc) from a z=5.02 quasar discovered by Fan et al. (1999), and (iii) McGreer et al. (2016) reported a pair at z=5.02 with a separation of 21′′ (90 kpc), discovered in a faint quasar (but not pair) search down to mag, and selected simultaneously with identical colour criteria. Given the relatively small sample sizes which these discoveries are based upon, they suggest that quasars are even stronger clustered at redshifts on small scales. This in turn has been used to argue that feedback is very inefficient at high redshift (Willott et al., 2010; McGreer et al., 2016), since inefficient feedback would correspond to the correlation length to flatten out at high redshift, while concordant QSO and host halo mass growth would imply a sharply rising correlation length. In addition, merger models of galaxy formation predict a large fraction of binary QSOs, at least over some time span (e.g. Volonteri et al., 2003a), with the fraction of binary (off-centre and dual) QSOs increasing with redshift (Volonteri et al., 2016). This state of knowledge, and the importance of the conclusions which can be drawn, certainly warrants further searches for clustering properties at high redshift.
Here, we search a sample of 116 spectroscopically confirmed QSOs at redshift 6 (collected from the compilation of Bañados et al., 2016) for a companion. Throughout this paper we use the best-fit cosmological model with , , and (Planck Collaboration, 2016). At a mean sample redshift of 6, an angular separation of 1′′ corresponds to a proper (comoving) transverse separation of 4 kpc (28 kpc). All magnitudes are in the AB system.
2 Selection criteria, observations and data analysis
2.1 Selection
From the sample of 173 spectroscopically confirmed QSOs at compiled in Bañados et al. (2016) we have selected all 144 sources south of Decl. ∘, thus being visible from La Silla (Chile). We have added 6 objects from Mazzucchelli et al. (2017b), and 2 object from Jiang et al. (2016). For the observing campaigns, we have prioritised brighter sources, so that it is easier (less time consuming) to reach limiting magnitudes fainter than the spectroscopically confirmed QSOs. After weather and technical losses, we obtained useful new GROND observations for 77 sources, in addition to those 42 objects from the Bañados et al. (2016) sample, which had already been observed with GROND in 2013–2015 during the selection process towards their spectroscopic sample. Excluding in the following two QSOs at , our sample of 116 QSOs spans a redshift range from 5.6–6.6 and a -band brightness of 18.6–23.1 mag.
2.2 Imaging Observations and Data Analysis
2.2.1 Strategy, Data Analysis and Source Detection
Simultaneous imaging in with GROND (Greiner et al., 2008) of the 77 new fields was performed at six different time slots: 2016 August 14 – September 3, 2016 October 11 – 25, 2017 January 24 – February 7, 2017 April 22 – May 2, 2017 September 18 – 21, and 2018 March 23. Since most fields have SDSS or Pan-STARRS coverage, no further observations for photometric calibration were obtained. The remaining three fields were calibrated against the SkyMapper Survey (DR1.1).
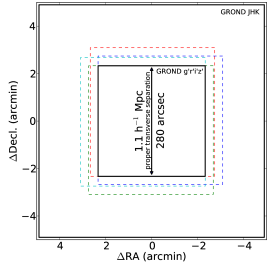
Since the field of view of the 4 visual channels is smaller than that of the NIR channels (Fig. 1), the former define the search distance from the spectroscopically identified QSO to 80′′ distance. Thus, our maximum search radius for a QSO companion is 0.471 Mpc proper or 3.3 Mpc comoving (see Fig. 1). This accounts for the fact, that most of the primary QSOs are not exactly centred in the GROND field of view.
The question to answer before the start of our observing campaign was: how much deeper to look for a companion, relative to the prime QSO? We have picked a 2 mag difference as threshold, based on three reasons: (i) given the QSO luminosity function (Willott et al., 2010; Ross et al., 2013; Shen et al., 2020), this corresponds to a factor more than 10 in the number of objects, and should imply a large enough sample depth, (ii) optical variability is rare above 0.5 mag amplitude, ensuing that the effective difference is not diminished substantially, and (iii) the pair at , found by McGreer et al. (2016) also has such an -band magnitude difference (19.4 vs. 21.4 mag). Thus, exposure lengths of typically 20 minutes was decided upon, ensuring that the 3 limiting magnitude in the -band was at least 2 mag deeper than the brightness of the spectroscopically identified QSOs (see below). While this 2 mag difference might suggest that the search could have been done just on Pan-STARRS data with its typical 5 depth of 22.3 mag, only 11 PS1 QSOs are bright enough to also survive the colour cut of – 1.5 mag at that faint brightness (see below).
GROND data have been reduced in the standard manner (Krühler et al., 2008) using pyraf/IRAF (Tody, 1993; Küpcü Yoldaş et al., 2008). The optical/NIR imaging was calibrated against the Sloan Digital Sky Survey (SDSS)111http://www.sdss.org (Eisenstein et al., 2011), Pan-STARRS1222http://pan-starrs.ifa.hawaii.edu (Chambers et al., 2016) or the SkyMapper Survey333http://skymapper.anu.edu.au (Wolf et al., 2018) catalogs for , and the 2MASS catalog (Skrutskie et al., 2006) for the bands. This results in typical absolute accuracies of 0.03 mag in and 0.05 mag in . Since the GROND dichroics were built after the Sloan filter system (Greiner et al., 2008), the colour terms are very small, below 0.01 mag, except for the -band which is substantially narrower than the SDSS i’-band. All our analysis is done in the SDSS system, with the following transformations used: , , , . For the fields calibrated against Skymapper and PS1, we use their conversion to SDSS (Scolnic et al., 2015). The PS1 -band has a substantial colour term (GROND = PS1 - 0.214(PS1 - PS1) due to the missing tail beyond 920 nm, but this becomes important only for redshift above 6.6 when Ly- moves beyond the -band limit.)
The calibrated - and -band images for each field were stacked after re-sampling due to their different pixel sizes (015 for the visual, and 059 for the near-infrared); for the four objects at we just used the -band images. A source detection procedure on each stacked image then provides a list of all objects per field which then is used as input for ’forced’ photometry on the individual 7-band images. This provides upper limits for the bands where the sources are not detected; otherwise it performs PSF photometry for , and aperture photometry in (with a radius of 1FWHM) at the position of the source in the master catalog which is allowed to re-centre by 0.3 of the PSF width. Table 3.5 contains the details of the observation for each QSO, including the 3 limiting magnitude in the -band. Table 3.5 contains the foreground-AV corrected AB magnitudes of all 116 QSOs in the individual GROND filter bands.
2.2.2 Colour-colour selection of Candidates
With these GROND data in hand, the goal was to search the field around each spectroscopically confirmed QSO for a nearby source with a similar colour, taking advantage of the simultaneous multi-filter optical/NIR spectral energy distributions (SEDs) of all objects inside the field of view (FOV).
We implicitly assume that the searches leading to the discovery of the QSOs have picked the brighter of the pairs; this is corroborated by modelling which suggests that current flux-limited surveys of QSOs at high redshift preferentially detect objects at their peak luminosity, and thus miss a substantial population of similarly massive black holes accreting at lower accretion rates (Costa et al., 2014). Thus, here we are looking for objects fainter than the original QSO.
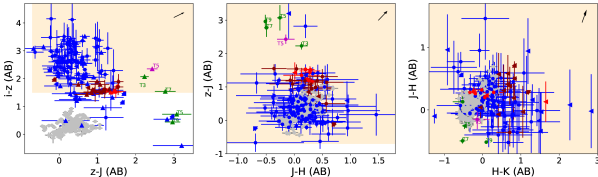
In all 116 fields we apply the following two colour selections (all in AB): – 1.5 mag, and – –0.7 mag. We checked that there are no detections in the and bands. For the objects, we adjust the – colour to –0.5, add –0.5, and require a non-detection. This returns 74 new high-z quasar candidates. We excluded 48 candidates through visual inspection of the 7-channel image cut-outs of these candidates, based on either source confusion, i.e. either a nearby source with overlapping PSF, or an extended source which could either be an interloper galaxy, or a non-resolved equally bright pair of objects. The remaining 26 candidate sources are shown in Fig. 2 as red (light and dark) dots, overplotted over the distribution of the spectroscopically confirmed quasars (shown in blue), which by itself show that our colour cut criteria recover all but 13 objects (with most of these failing due to non-detections, i.e. upper limits, in the -band, i.e. deeper -band exposure would likely recover those as well).
For 9 of the remaining 26 candidate sources we found catalog entries in the ALLWISE all-sky catalog (Wright et al., 2010; Mainzer et al., 2011) within 1 arcsec distance, and after visual checking of the images accepted these as matching objects. Tables 3 and 4 contain the photometry of these 26 candidates, separately for those with and without ALLWISE matches.
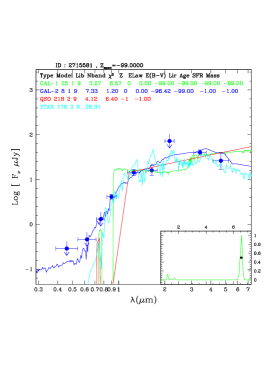
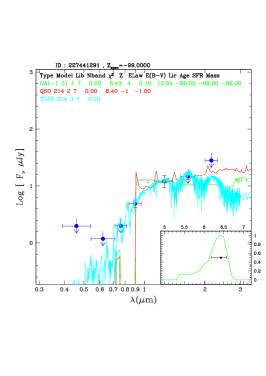
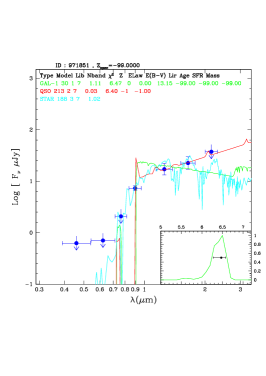
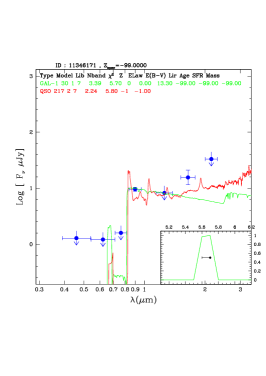
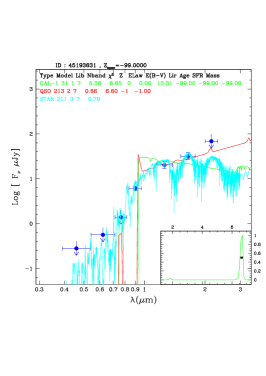
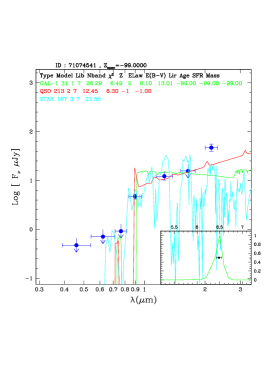
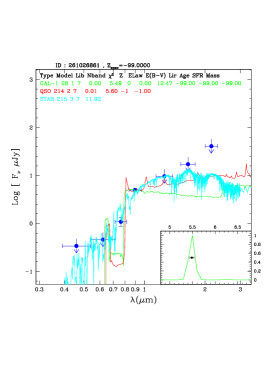
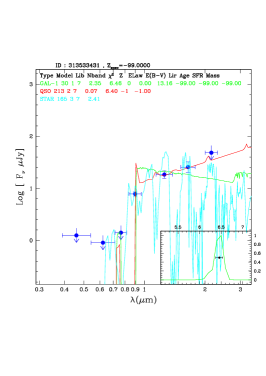
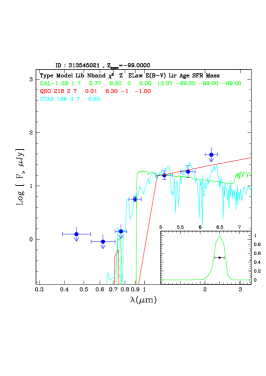
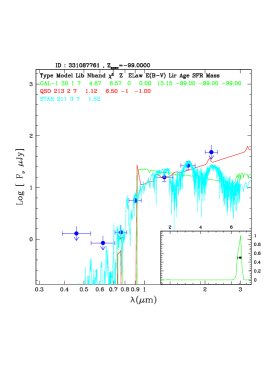
We then performed Le PHARE (Arnouts et al., 1999; Ilbert et al., 2006) fits to the photometry of the 26 candidates (including the ALLWISE magnitudes when available). We included an alternative IGM opacity model (Songaila, 2004) in addition to the default one (Madau et al., 1999), but otherwise used the default spectral templates except for adding about 200 cloned high-z QSO templates based on stacked observed SDSS spectra of low-z QSOs, similar to Willott et al. (2007). The goal of these Le PHARE fits was to distinguish late-type dwarfs from QSO candidates, where the distinction is based on two observational features: the steepness of the SED in the -- range, and the SED shape in the range which is much redder for dwarfs. Since dwarfs in our sensitivity range would be at distances of order 100 pc, their photometry would not be affected by interstellar dust. We thus created two SEDs for each candidate, one without AV-correction (for Le PHARE fits with dwarf templates) and one with full galactic AV-correction (for Le PHARE fits with QSO templates). For 14 (out of the 26) candidates the best-fit template is that of a dwarf (see last column of Tabs. 3, 4), for 10 candidates that of a QSO at high redshift (labeled in boldface in Tabs. 4), for one a galaxy at intermediate redshift, and for 1 candidate (SDSSJ2054-0005_4) the reduced does not provide a clear favorite. The Le PHARE fits of the 10 high-z quasar candidates (i.e. with AV-correction applied) are shown in Fig. 6, which also contains the best-fit photo- (6th field in the red line of labels), all within 13% of the spectroscopic redshift except for PSO J055.4244-00.8035 (the source we did not get a spectrum of).
2.3 Spectroscopic Observations
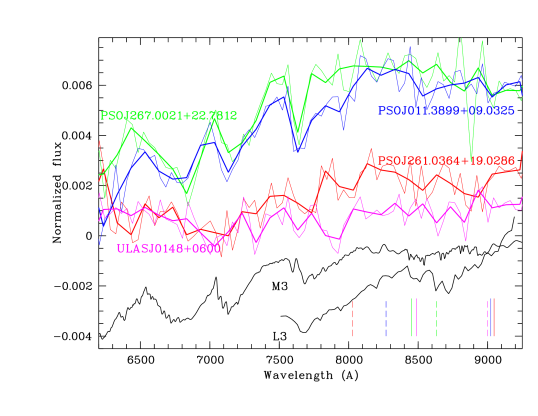
We obtained spectroscopy of 11 objects (9 of the 10 QSO candidates, the galaxy, and the unidentified object), mostly with the GMOS instruments of the Gemini Observatory (under proposal IDs GN-2019B-FT-201 and GS-2019B-FT-202). One object was observed with the FIRE (Folded-port InfraRed Echellette) spectrograph in Prism mode at the Magellan Baade telescope. A log of the observations is given in Tab. 2. At Gemini-North (South), a Hamamatsu detector was used with the R150 grating and filter G5308 (G5326). The spectra cover the range from 615 (750) to 1080 nm. Wavelength calibration was provided by CuAr comparison lamps. Flux calibration was done against the standard stars G191B2B (LTT7987). For the FIRE spectrum, we used archival A0V stars for telluric and flux calibration. The data were reduced in the standard manner, using GMOS specific routines provided within the IRAF (Tody, 1993) package, and a custom-made python code for the FIRE observation.
3 Results and Discussion
3.1 Pair candidates
We do not find a single QSO pair candidate brighter than M1450 (AB) mag in our GROND data of 116 spectroscopically confirmed redshift 6 quasars. Except for two candidate object (near PSOJ055.4244-00.8035 and PSOJ071.0322-04.5591) we have obtained optical spectroscopy for all other Le PHARE-derived QSO pair candidates, but could not confirm the quasar nature as suggested by the colour selection and SED fitting. This is somewhat surprising, since the (post-facto) photometric redshifts we derived with Le PHARE for the prime QSOs where in good agreement with the spectroscopic redshifts reported by Bañados et al. (2016), with only a 5% fraction mismatch. We consider it very unlikely that there is an unrecognised quasar among our identified candidates in Tabs. 3 and 4. This is in contrast to our empirical expectation (at the start of the project) of 3 pairs in our sample, based on the serendipitously discovered pair at z=4.26 (Schneider et al., 2000) and the two pairs at z=5.02 (Djorgovski et al., 2003; McGreer et al., 2016) (see details in the introduction), which when averaged together (1/100, 1/14, 1/47) suggest one pair every 40 QSOs, or 2.5%. This line of reasoning includes a few simplifications. First, it uses post-facto arguments and guesses on the search volume of the above serendipitous discoveries. Next, it assumed that the quasar clustering fraction does not evolve with redshift – the question to be answered by the project. Also, it ignored the different luminosity ranges sampled at different redshifts - the integral over the luminosity function is certainly the most sensitive component contributing to the statistic (see below).
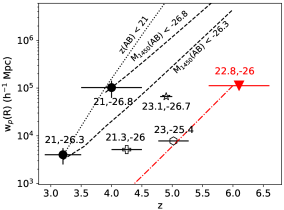
In order to put this in context, we follow Hennawi et al. (2006) and Shen et al. (2010, in particular their eq. 4) in estimating the projected correlation function, or statistics, as defined by e.g., Davis & Peebles (1983). Given the mean seeing in our images and correspondingly the ability to separate two sources, we take an inner radius of 100 kpc (corresponding to 3′′) for the projected comoving area of the cylindrical annulus (the outer one being our search radius of 3.3 Mpc). We use the latest luminosity function description of Shen et al. (2020), as well as their publicly provided tools (https://github.com/gkulkarni/QLF) to convert our observed (AB) magnitude limit and mean redshift to M1450, and applying the corresponding bolometric correction (using their ’global fit A’; we verified our procedure against their Fig. 5). This results in a number density of 910-10 Mpc-3 for quasars with M mag, for our redshift range . We obtain an upper limit of Mpc as shown in Fig. 3, where we use a formal upper limit of our search of 1 pair out of the 116 objects searched for, given the missing spectroscopy for PSOJ055.4244-00.8035. The figure also includes measurements at lower redshifts from Schneider et al. (2000), Shen et al. (2010) and McGreer et al. (2016) (modified by the updated luminosity function and corrected for our search scale according to the powerlaw dependence of from Shen et al. (2010)). Overall, our upper limit corresponds to a similar as previous findings at lower redshift, suggesting that there is no strong rise of clustering towards high redshift.
Using eq. 5 in Shen et al. (2007) and , our upper limit on corresponds to a limit of the auto-correlation length Mpc.
| Publication | No. of pairs | z-range | separation | depth | comments |
|---|---|---|---|---|---|
| (arcsec)/(cMpc) | (AB mag) | ||||
| Shen et al. (2010) | 7 | 2.9–3.5 | – / 1.0 | 1 | |
| 8 | 3.5–4.5 | – / 1.2 | 1 | ||
| Schneider et al. (2000) | 1 | 4.0–4.5 | 33 / 1.2 | 2 | |
| McGreer et al. (2016) | 1 | 4.77–5.27 | 21 / 0.8 | 3 | |
| Djorgovski et al. (2003) | 1 | 4.8–5.0 | 160 / 6.2 | 4 | |
| this paper | 0 | 5.6–6.6 | 3–80 / 3.3 |
Notes on comments column:
1
Out of 319 binary candidates, follow-up spectroscopy
“is about half finished” (Hennawi et al., 2010).
Based on the spectroscopic follow-up, Shen et al. (2010) derive
a search completeness of 0.38 and 0.52 for the low-z and high-z
sub-sample, respectively. These completeness fractions are used
in computing for Fig. 3.
2 The second QSO of the pair was serendipituously in the slit,
so we use the pair separation of 33′′ depite that this
does not correspond to an azimuthally complete search cone.
3 The second QSO of the pair was serendipituously in the slit,
so we use the pair separation of 21′′.
4 The redshift depth is taken as the highest redshift QSO found
in the parent sample. The search radius is estimated from the
imaging field of view
and guessing a 1 arcmin loss in the side-length due to dithering.
3.2 Completeness and biases
In the past, clustering studies have typically relied on selecting pairs from large catalogs (e.g. SDSS), and the most important question is about the completeness of the underlying catalog (e.g. Hennawi et al., 2006; Eftekharzadeh et al., 2017). Here, we have obtained follow-up observations of known quasars at known redshift. Thus, in our case the question of completeness reduces to the questions of (i) whether or not the selection criteria which led to the sample of these known redshift quasars had a bias against selecting binary quasars? and (ii) whether our search strategy misses QSOs? As to item (i), one potential bias is that the seeing limit in the original survey data affects the discovery of QSO on 1-2′′ scales due to nearby contaminating sources. As this is a statistical problem, this is not expected to affect the fraction of binary QSO in the spectroscopically confirmed QSO sample.
As to item (ii), this splits into two sub-questions: First, what is the completeness of our colour-colour cuts? Since we ran our colour-colour selection blindly on all sources in each observation, we can answer this with the recovery rate of the spectroscopically confirmed QSO: out of the 116 QSO, we miss 9, with 3 of those not detected in , and the other 6 due to insufficiently deep -band limits. Since the 3 non-detections are due to variability, they are not counted here (see below on the variability bias), so our incompleteness of the colour-colour selection is about 5%. Second, what is the completeness of the Le PHARE fits in recognizing the QSO nature? Again, this can be answered with the sample of the spectroscopically confirmed QSOs: ignoring sources with detections in less than 3 photometric bands, we ran Le PHARE fits on the remaining 97 spectroscopically confirmed QSOs in the same manner as with the candidates (i.e. two runs, one with and one without AV correction). Only 5 sources are classified as dwarfs, all other 92 as QSOs. We double-checked that the colours and photometric errors of those 5 are not outliers with respect to the sample distribution of the 92 correctly classified QSOs. So this corresponds to only 5% incompleteness.
Further, we note that it is unlikely that even substantial optical variability of the QSOs would affect the fraction of pairs, since statistically one expects the same number of “risers” vs. “faders”. The only exception would be effects due to Malmquist bias, but since only a handful of objects is detected with a -band uncertainty larger than 0.2 mag, this imbalance is unimportant.
Lastly, a potential bias could be due to dust obscuration of AGN, in our case obscuring the companion of the spectroscopically confirmed QSO. Again, this is not expected to be a major issue. First, previous suggestions were that obscuration could primarily happen in the highest mass accretiion phases, one would first expect the brighter object of the pair to be obscured, rather than the lower-luminosity companions of the unobscured spectroscopicall confirmed QSOs. Second, while ALMA observations revealed substantial dust at high redshift, there is no evidence that these dusty objects are obscured AGN (see sect. 3.4 below). Finally, theory of dust production fails to explain dust in large amounts at (Lesniewska & Michalowski, 2019), preventing quantitative estimates or simulations.
Another potential bias could come in if black holes of similar mass have different Eddington ratios at different redshift, such that only the optically brightest QSOs are found at high redshift. However, Mazzucchelli et al. (2017b) have shown that (at least for the biased high-z sample they considered) BH masses and Eddington ratios of the and SDSS samples are consistent in a luminosity-matched sample. Thus, our assumption was that the clustering fraction at redshift 4-5 (Schneider et al., 2000; McGreer et al., 2016) is not much different than at redshift 6, leading to our expectation of more pairs as compared to our findings.
Further, our search comes with the biases, that the luminosity difference between the two members of the pair can of course be larger than our selected 2 mag, due to at least two different reasons: firstly, the BH masses and/or accretion rates can differ substantially, and secondly the Ly emission which contributes to the -band magnitude, can be drastically different between the two members of the pair, replicating the differences in the spectroscopically confirmed QSO sample (see e.g. Bañados et al., 2016). As to the first reason, simulations suggest differently. Based on the large-scale cosmological hydrodynamical Horizon-AGN simulations, Volonteri et al. (2016) find that the luminosity ratio between the central BH (the more massive one) and an off-centre BH is within a factor of ten (rms = 5x) for the cases of erg/s and BH masses up to 108 M⊙. While this corresponds to the ratio we employed, it should be noted that this ratio depends on selected input parameters for the simulation, among others a mass ratio 1:6 for the merging galaxies at which AGN activity is triggered in both black holes. Similarly, Bhowmick et al. (2019) find that in the MassiveBlack II simulations the satellite quasar luminosity is similar to that of central quasars. Finally, we note that for 41 of our targets the 3 limiting -magnitude reached in our observations is actually 3 mag fainter than that of the spectroscopically confirmed QSO, which still would lead to an expectation of one pair in our sample.
3.3 Comparison to simulations
The upper limit to the projected correlation function for bright QSO pairs at presented in Section 3.1 serves as an important constraint for galaxy evolution models. Currently, cosmological-scale simulations typically either focus on quasar properties below due to improved statistics (e.g. DeGraf & Sijacki 2017; Bhowmick et al. 2019; Habouzit et al. 2021) or above due to reduced computational limitations (e.g. Di Matteo et al. 2017; Tenneti et al. 2019; Marshall et al. 2020). Zoom-in simulations of haloes containing QSOs at have been performed (e.g. Costa et al. 2014; Lupi et al. 2019), however these do not readily provide statistics on large scales. Consequently, model predictions for the total number of bright QSO pairs at the redshift of our sample are still lacking in the literature.
At lower redshift, models suggest that bright QSO pairs are rare. For example, in the MassiveBlack-II simulation box of volume , Bhowmick et al. (2019) find no pairs of QSOs with within a search radius of 4 Mpc at , and only three such systems by .
At higher redshift, work on the BlueTides simulation has shown that QSOs bright enough to match observations are also very rare, even when accounting for large black hole seeds (Di Matteo et al., 2017). There is only one black hole of mass above M⊙ present in the BlueTides box at , which has a luminosity of (Di Matteo et al., 2017; Tenneti et al., 2019).
However, despite the lack of pairs, galaxy evolution models still find that brighter QSOs cluster more strongly than their fainter counterparts, particularly on smaller scales. For example, on scales of kpc at , DeGraf & Sijacki (2017) find the two-point auto-correlation function, , for AGN with erg/s in the Illustris simulation is higher by a factor of three compared to that for all AGN. On the larger scales probed by our observational measurement (), this enhancement is reduced but still remains present for the brightest objects, as also seen in the L-Galaxies semi-analytic model (Bonoli et al., 2009) and the Horizon-AGN simulation (Volonteri et al., 2016). All three of these models report a value of at for AGN with erg/s, with the expectation that this value will be higher at , as also seen in the observations discussed in Section 1.
In order to better probe the exact epoch and search volume of our observational QSO sample, we have carried-out a census of bright AGN pairs at in the Illustris-TNG300 (hereafter, TNG300) and L-Galaxies 2020 galaxy evolution models. TNG300 (Pillepich et al., 2018; Springel et al., 2018; Naiman et al., 2018; Marinacci et al., 2018; Nelson et al., 2018) is a magneto-hydrodynamical simulation run in a box, using a Bondi-Hoyle-Lyttleton BH accretion model with no boost factor but an assumed BH seed mass of M⊙ (see Habouzit et al. 2021). L-Galaxies 2020 (Henriques et al., 2020) is a semi-analytic model run on the larger Millennium-I box (Springel et al., 2005), but with a more simplified phenomenological model of quasar- and radio-mode BH accretion and no BH seed mass (see Croton et al. 2006). In both cases, we assume that all AGN are radiatively efficient when calculating their luminosities, which provides an upper limit on the expected number of bright pairs. Therefore, the AGN bolometric luminosity for both models is calculated here as
| (1) |
where is the assumed radiative efficiency of the accretion disc, is the BH accretion rate, and is the speed of light. Given that the detection limit for the fainter of the two QSOs in our observational search is mag (i.e. erg/s), we assume a minimum bolometric luminosity of erg/s when searching for BH pairs in the models, given the bolometric conversion factor of 5.13 recommended by Duras et al. (2020).
For the same search area as our observational sample (i.e. an inner radius of and outer radius of comoving, see Section 3.1), we find no BH pairs with erg/s in either TNG300 or L-Galaxies 2020 at . This holds true even when doubling the assumed radiative efficiency from to . Indeed, there are no BHs at that luminosity at all within the TNG300 box above when assuming . This theoretical result is nicely consistent with the null result returned by our observational search at , especially when considering the relatively large box sizes of L-Galaxies 2020 and TNG300.
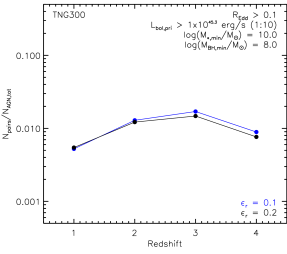
We do not find any BH pairs at in TNG300 or L-Galaxies 2020 that match the serendipitous discovery by McGreer et al. (2016) of a bright pair with (i.e. erg/s) separated by 21′′ (i.e. 816 ckpc) at . These simulations are therefore somewhat in tension with this discovery, although the exact search area to use is not well constrained. However, we do find pairs in TNG300 that match the serendipitous discovery on a BH pair with mag (i.e. erg/s) by Schneider et al. (2000) at . When assuming , and a standard search volume around the mean deprojected separation of cMpc with inner radius cMpc and outer radius cMpc, we find 14 BH pairs with erg/s at in TNG300. This equates to an upper limit on the pair fraction (i.e. the number of BH pairs divided by the total number of BHs at that luminosity) of %. We are also able to reproduce a fairly redshift invariant pair fraction of % between and 1 (see Fig. 4) for BH pairs with a primary BH luminosity of erg/s, when selecting systems as Silverman et al. (2020) do for the Horizon-AGN simulation (see their section 5.1). No such pairs were found in TNG300 above .
In conclusion, the observed number of bright QSO pairs seen at high redshift appears largely consistent with that predicted by current cosmological-sized galaxy evolution models. Although, further modelling efforts at the redshift of our observational sample are still required to confirm this.
3.4 The number of QSO pairs as a constraint on massive BH origins and assembly
The origin of M⊙ black holes in massive galaxies at is largely unconstrained (e.g. Johnson et al., 2013; Valiante et al., 2017, 2018; Inayoshi et al., 2020). The cosmic time since the Big Bang is likely too short for light seeds with masses of M⊙ (e.g., PopIII remnant model, Madau & Rees, 2001; Bromm & Loeb, 2003; Volonteri et al., 2003b) to grow to such masses even if the seeds accrete at the Eddington rate most of their lifetime. Instead, more massive seeds with masses of order M⊙ would have a somewhat less challenging growth history to reach the masses of the high-z QSOs.
Several theoretical models have been put forward to explain the formation of such massive BH seeds. By analogy with the nuclear clusters that we commonly observe in low-redshift galaxies, compact nuclear clusters in metal-poor environments are predicted to form very massive stars by runaway stellar collisions (Omukai et al., 2008; Devecchi & Volonteri, 2009; Regan & Haehnelt, 2009). These very massive stars would collapse onto BH seeds of . Seeds of about the same masses can be formed by runaway black hole mergers in metal-poor star clusters in the centre of high-redshift galaxies. The direct collapse model predicts the most massive seeds, called direct-collapse BHs (DCBHs): atomic cooling halos form single supermassive stars, which can collapse onto massive seeds of (Loeb & Rasio, 1994; Bromm & Loeb, 2003; Spaans & Silk, 2006; Begelman et al., 2006; Lodato & Narayan, 2006; Dijkstra et al., 2008; Visbal et al., 2014; Latif & Volonteri, 2015; Habouzit et al., 2016b). In order to avoid the fragmentation of the gas into multiple and less massive stars, the presence or formation of efficient gas coolants (i.e., molecular hydrogen and metals) must be prevented. Therefore, the formation of the first DCBHs depends on the number of surrounding haloes as the Lyman-Werner radiation (photons with energy in the 11.2–13.6 eV range) needed to prevent H2 formation comes from surrounding star-forming galaxies (Habouzit et al., 2016a).
These mechanisms yield different galaxy occupation fractions, i.e. the probability for a galaxy to host a BH, and therefore could a priori lead to different predictions on the number of QSO pairs at high redshift. While the compact nuclear stellar cluster model and the model of runaway black hole mergers in clusters predict potentially large occupation fractions, i.e. the presence of BHs in many galaxies, the number density of direct collapse BHs is predicted to be small (e.g., Dijkstra et al., 2008; Habouzit et al., 2016b). However, DCBHs could appear clustered. Indeed, whether the large Lyman-Werner radiation is produced by several or a single star-forming halo, the high intensity required could irradiate several nearby halos, potentially forming DCBHs in some of these halos if metal-poor conditions are met. The need for clustered halo environments is not required for all the variations of the direct collapse model (e.g., the synchronised pair model, Visbal et al., 2014). It has also been proposed that DCBHs themselves could ignite a runaway process of further DCBH formation (Yue et al., 2014). Indeed, DCBHs are expected to be Compton thick, and their reprocessed radiation outshines small high-redshift galaxies by more than a factor 10. Thus, once the first DCBHs form, their Lyman-Werner radiation could help providing surrounding halos with the needed conditions to form new DCBHs (Yue et al., 2014). This process comes to an end when the host atomic-cooling halos are rapidly photo-evaporated by ionizing photons. An analytical model of these processes (Yue et al., 2014) shows that a highly clustered spatial distribution of haloes is the pre-requisite to triggering the formation of several DCBHs in the same region.
The different mechanisms of BH formation are not a priori mutually exclusive in the Universe, which therefore makes the interpretation of the QSO clustering difficult. Moreover, successive mergers of halos with time alter the initial halo occupation fraction and clustering of BHs at birth.
Observing several QSO pairs in our sample would likely suggest that massive BH seeds can form in the same regions (on scales of up to a Mpc), and that they can grow efficiently in the dense environments in which we often find high-redshift QSOs. The fact that we find no QSO pairs, i.e. no bright companion to any of our 116 spectroscopically confirmed QSOs could mean that (i) most QSOs are isolated objects with no massive galaxy in their surroundings, (ii) QSOs are often located in dense environments but nearby galaxies are devoid of BHs or devoid of massive BHs, or (iii) QSOs are often located in dense environments and nearby galaxies also host massive BHs, however these BHs have high variability/low duty cycle and no companion BHs were active when observed.
While the question of whether QSOs are embedded in the densest environments is still subject to debate in observations (Kim et al., 2009; Husband et al., 2013; Mazzucchelli et al., 2017a; McGreer et al., 2016; Habouzit et al., 2019, and references therein), the hypothesis (i) of a large fraction of QSOs being isolated objects is unlikely. Theoretical models suggest that the first massive galaxies formed through mergers of gas-rich galaxies at very high redshift. Recently, Decarli et al. (2017) and Neeleman et al. (2019) identified six QSOs with close, gas-rich companions through ALMA observations of [CII] and dust emission; 5 of these are in our sample: SDSSJ0842+1218, PSOJ167.6415-13.4960, SDSSJ1306+0356, PSOJ308.0416-21.2339 and CFHQSJ2100-1715. These QSO-galaxy pairs prove that QSOs are not living isolated from the surrounding matter in their halos. This QSO-galaxy clustering is consistent with the quasar/LBG clustering at , see Fig. 3 in Decarli et al. (2017). Recent deep X-ray observations of some of the above sources did not reveal potentially obscured quasars. So far, there is no strong evidence of these obscured companions of quasars to be obscured AGN (Connor et al., 2020; Vito et al., 2021).
Therefore, our non-detection of bright QSO-QSO pairs could hint towards an evolutionary scenario which prevents the formation of a massive accreting BH in the potentially gas-rich QSO companion. This could be due to tidal interaction of the primary QSO being more rapid than the accretion on the central BH of the companion. Feedback from the QSO could also reduce the gas reservoir of the companion galaxy through its lifetime, therefore diminishing the ability of a BH to efficiently accrete and become as massive as the BH powering the QSO. Additionally, efficient stripping of gas from companion galaxies of massive systems is seen out to several virial radii at low redshift in cosmological simulations (Ayromlou et al., 2021a, b). If this effect is present in the neighbourhood of the brightest QSOs at high redshift, it could also contribute to a reduction in the gas reservoir of companion BHs. The absence of QSO pairs could also be explained in case of low efficiency of BH formation, so that early massive BH formation happens only in a small fraction of galaxies, or alternatively if the formation of light seeds is dominant in the Universe. Due to their low masses, light seeds would have a hard time growing and even sinking efficiently to the potential well of their host galaxies. Indeed, searching for companions of the ten most massive BHs in TNG300 reveals none with masses M⊙ at z=5 and above. There is just one companion BH with a mass of M⊙ at z=6, but with a luminosity of only erg/s, which is not even the brightest luminosity in the companion sample (which is erg/s), and below our search sensitivity. With its limited volume of (205 cMpc)3 there is no environment in TNG300 that was able to build up two extremely massive and luminous BHs in the same region by .
Finally, this leads us to our hypothesis (iii) of very short coincident activity periods of both QSOs (see, e.g., Haiman & Hui (2001) for an early account of the lifetime-dependence of QSO clustering). In that case, QSO companion galaxies would also host massive BHs, but these BHs would not be efficiently accreting at the time of observation. In that case, the companion massive BHs would have grown by several orders of magnitude, potentially releasing a significant amount of energy in their host galaxies through cosmic time, which could explain an accretion history with a succession of “on and off” phases. In the observations presented here, we can only detect very bright objects. Further investigations at larger telescopes (e.g. with the GROND-descendant SCORPIO instrument at Gemini Observatory) will shed new light onto the degenerate scenarios to explain the absence of QSO pairs with mag.
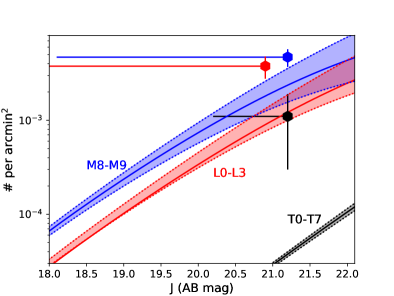
3.5 Incidence of Brown dwarfs
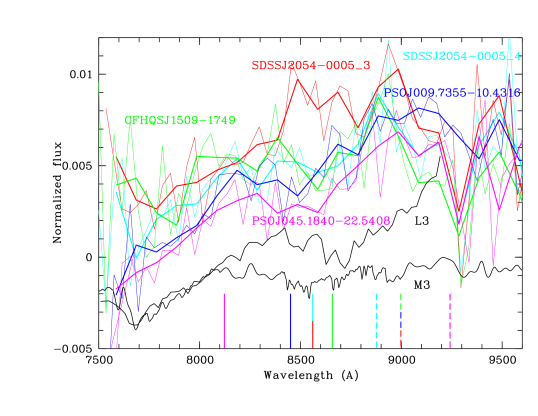
The exposure for the spectroscopic observations was determined to provide 5 detections of flux redwards of Ly- (if it existed) binned at 200 Å. Thus, the signal-to-noise ratio in these spectra is good enough to distinguish brown dwarfs and low-redshift galaxies from QSOs, but way too small to perform a spectral classification of the dwarfs or galaxies. We therefore revert to the results of the Le PHARE fits, and provide the spectral types of the best-fitting template in the last columns of Tabs. 3, 4. For the conversion from the Le PHARE best-fit temperature to spectral type we used the “mean” value from the compilation of Kellogg (2017). The associated error is 2 sub-types over most of the range.
Since after the selection of our targets for spectroscopic follow-up the unWISE (Schlafly et al., 2019) and CatWISE (Marocco et al., 2021) catalogs became available, we run a new cross-correlation of our targets against these catalogs. From our list of 17 candidates without ALLWISE counterparts (Tab. 4) we find 6 objects with W1 and W2 entries. Re-running Le PHARE fits with this extended photometry yields consistent results for three dwarf identifications (within the above mentioned 2 sub-type error), but deviates for the other three objects: (i) two SEDs, previously best fit with a QSO or M8 dwarf template are now best fit with a low-redshift ( in both cases) galaxy, similar to ULASJ0148+0600 (Tab. 3), (ii) for another source, SDSSJ2054-0005_3, the best-fit template is that of a galaxy at redshift 6, which is inconsistent with our absolute photometry. The second-best template (nearly identical ) is that of a QSO at redshift 6, which is unlikely given our GMOS spectrum, and the third-best template is that of a L2 dwarf, but with substantially worse - we therefore do not assign an identification in Tab. 5.
For the candidate of PSOJ055.4244-00.8035, which also had a QSO template as best fit in Le PHARE but for which we did not obtain a spectrum, we refrain from changing the ID, though Occam’s razor would argue against a QSO.
The combination of our spectroscopic results and the Le PHARE fits results in identifications as follows: 20 dwarfs, 3 low-redshift galaxies, 1 QSO, and 2 unsettled cases (Tabs. 3, 4, 5). Their spectral range is rather wide, from M5–T8, though accurate spectral typing remains to be done. The large incidence rate of such dwarfs is a surprise, both, because our search was not tuned towards late dwarfs, and also given our small search size of just 0.52 square degrees (summing over all 116 candidates). For instance, Kakazu et al. (2010) found 6 faint () ultracool T dwarfs over a 9.3 deg2 area with a limiting magnitude of (AB) 23.3 mag. This is even slightly deeper than our mean depth of (AB) 23.1 mag, yet we find 2 T-dwarfs per 0.52 deg2, as compared to their 0.6 deg-2, a factor 6 higher. Given that we pointed at known high-z QSOs, our search area similarly avoids the galactic plane. In a more recent compilation, Ryan & Reid (2016) used thick/thin exponential disk models and the luminosity function of ultracool dwarfs to predict their surface density for per spectral type. While this depends strongly on the galactic coordinates, the prediction for T-dwarfs has only a small dependence on galactic latitude, suggesting an even higher excess in our data, about a factor of 20, with even the Kakazu et al. (2010) surface density being higher by a factor of 3. For early L-type dwarfs, the excess is smaller, and for the M8-9 dwarfs we find consistency. Fig. 5 summarises the findings.
Since we observe a substantial excess of T dwarfs, search completeness cannot be an issue. Also foreground extinction correction should not be an issue, since most of these dwarfs are within of order 100 pc distance. Even if we adopt a twice as large (systematic?) error in the temperature estimates from the Le PHARE fits, this would not change our numbers. One potential reason could be the appropriateness of the templates in Le PHARE, i.e. that dwarfs are more numerous than e.g. low-redshift red galaxies. This is contrary to the case of high-z QSOs, for which late dwarfs form a numerous class of false positives. This finding of a larger than expected T dwarf number density is a surprising puzzle, which warrants further study. Existing GROND data could provide a first step in this direction, though spectroscopic typing of the candidate dwarfs is the ultimate step.
[x]lcccccc
Details of the GROND observations of selected known QSOs, sorted by Right Ascension.
The redshift and the observed -magnitude are taken from the original
discovery papers, i.e. predominantly Bañados et al. (2016) unless marked
as follows:
a = Willott et al. (2007), b = Venemans et al. (2013),
c = Jiang et al. (2016), d = Mazzucchelli et al. (2017b),
e = Zeimann et al. (2011), f = Matsuoka et al. (2016),
g = Kim et al. (2015), h = Reed et a. (2015),
i = Venemans et al. (2015), j = Jiang et al. (2009),
k = Willott et al. (2009), l = Carnall et al. (2015),
m = Willott et al. (2010).
The 4th column is the date at the start of the observing night, and the
5th column indicates the nth observing night of that target (first
number) and which observation blocks (OB)s were used in the analysis
(numbers after the underscore): more than one number indicates stacking
of multiple OBs. Column six provides the 3 limiting magnitude
of the (stacked) observation, not corrected for galactic foreground
extinction (which is given in column 7, based on (Schlafly & Finkbeiner, 2011)).
The letter attached to the limiting magnitude denotes the catalog
used for photometric calibration of the optical channels :
S=SDSS (DR12), P=PanSTARRS1, SM=SkyMapper (DR1.1).
Name z z (AB) Obs.-date OB
limiting z′ calib AV
(mag) (mag)
\endfirstheadcontinued.
Name z z (AB) Obs.-date OB
limiting z′ calib AV
(mag) (mag)
\endhead\endfootPSOJ000.3401+26.8358 5.75 19.280.02 2016-10-25 2_1 22.6S 0.11
SDSSJ0005-0006 5.85 20.440.04 2016-08-29 1_1 23.3S 0.09
PSOJ002.1073-06.4345 5.93 20.250.03 2013-09-09 1_123 22.8S 0.09
PSOJ004.3936+17.0862 5.80 20.820.07 2016-10-25 1_1 22.6S 0.17
PSOJ004.8140-24.2991 5.68 19.620.02 2013-09-09 1_12 22.4P 0.04
PSOJ007.0273+04.9571 6.00 20.560.05 2013-01-14 2_12 22.9S 0.04
CFHQSJ0033-0125a 6.13 22.440.08 2016-08-26 1_1 23.0S 0.06
PSOJ009.3573-08.1190 5.72 19.910.03 2015-11-05 1_1 23.2S 0.11
PSOJ009.7355-10.4316 5.95 20.820.04 2014-12-14 2_12 23.1S 0.08
PSOJ011.3899+09.0325d 6.42 22.33 2016-09-20 1_12 23.1S 0.16
CFHQSJ0055+0146k 6.01 22.190.06 2016-09-01 1_1 24.1S 0.06
SDSSJ0100+2802 6.30 18.610.01 2016-08-31 1_1 23.3S 0.15
CFHQSJ0102-0218k 5.95 22.300.08 2016-08-18 1_1 23.0S 0.11
PSOJ021.4213-25.8822 5.79 19.660.03 2014-09-21 1_1 22.7P 0.04
SDSSJ0129-0035j 5.78 22.160.11 2016-09-02 1_3 23.4S 0.09
PSOJ023.0071-02.2675 5.90 20.190.03 2013-09-10 2_12 23.4S 0.09
CFHQSJ0136+0226 6.21 22.060.16 2016-09-02 1_1 23.4S 0.11
PSOJ025.2376-11.6831 5.85 20.180.02 2013-09-08 1_123 22.9P 0.06
ATLASJ025.6821-33.4627l 6.31 19.630.08 2016-08-18 1_1 22.3SM 0.07
ULASJ0148+0600 5.98 19.450.01 2016-08-31 1_1 23.7S 0.16
PSOJ029.5172-29.0886 5.99 19.480.02 2013-09-10 1_12 22.8P 0.04
ATLASJ029.9915-36.5658l 6.02 19.540.08 2016-08-18 1_1 22.4SM 0.04
ULASJ0203+0012 5.72 20.740.06 2016-08-29 1_1 23.1S 0.07
CFHQSJ0210-0456m 6.43 22.670.05 2016-09-02 1_1 23.4S 0.05
CFHQSJ0221-0802m 6.16 22.630.05 2016-08-18 1_1 23.0S 0.08
PSOJ036.5078+03.0498 6.54 21.440.12 2016-08-29 1_1 23.1S 0.09
CFHQSJ0227-0605k 6.20 21.710.06 2016-09-01 1_1 23.6S 0.09
PSOJ037.9706-28.8389 6.00 20.730.06 2013-01-17 1_123 23.4P 0.04
SDSSJ0239-0045j 5.82 22.080.11 2016-08-18 1_1 22.8S 0.08
PSOJ040.0159+17.5458 5.68 20.600.05 2016-08-30 2_1 23.8P 0.23
PSOJ042.6690-02.9174 5.89 20.490.05 2013-09-10 1_123 23.4S 0.12
PSOJ045.1840-22.5408 5.68 20.340.05 2013-01-14 1_123 23.2P 0.07
SDSSJ0303-0019 6.08 20.990.06 2016-08-30 1_1 23.9S 0.29
VIKJ0305-3150b 6.60 22.120.07 2016-09-02 12_1 23.7SM 0.03
CFHQSJ0316-1340 5.99 21.570.12 2016-08-30 1_1 24.1S 0.14
PSOJ049.2934-26.5543 5.94 20.770.06 2016-08-31 2_1 23.4P 0.05
VIKJ0328-3253i 5.86 19.830.02 2016-08-21 1_1 23.1P 0.03
PSOJ053.9605-15.7956 5.87 20.340.04 2016-08-21 1_1 23.3P 0.24
PSOJ055.4244-00.8035 5.68 20.190.04 2014-02-02 1_1 22.6S 0.25
PSOJ056.7168-16.4769 5.99 20.000.04 2016-08-19 1_1 22.8P 0.14
SDSSJ0353+0104 6.07 20.810.07 2016-08-15 1_1 23.4S 0.78
PSOJ060.5529+24.8567 6.18 20.180.03 2014-12-16 1_12 23.0P 0.64
PSOJ065.4085-26.9543 6.14 20.480.05 2014-02-05 2_1 22.8P 0.11
PSOJ065.5041-19.4579 6.12 19.790.03 2014-12-17 1_1 22.8P 0.10
PSOJ071.0322-04.5591 5.89 20.300.04 2015-11-06 1_12 23.6S 0.12
PSOJ071.4507-02.3332 5.69 19.180.01 2016-08-20 + 30 12_1 23.6P 0.10
DESJ0454-4448h 6.10 20.200.01 2016-08-21 1_1 23.4SM 0.03
PSOJ075.9356-07.5061 5.88 20.330.05 2017-09-18 2_1 23.6P 0.52
PSOJ089.9394-15.5833 6.05 19.660.03 2015-11-08 1_12 23.4P 0.79
PSOJ108.4429+08.9257 5.92 19.450.02 2015-11-08 1_1 22.8P 0.23
SDSSJ0818+1722 6.02 19.550.02 2017-01-26 1_1 22.9S 0.09
ULASJ0828+2633 6.05 20.720.06 2017-02-07 1_1 22.5S 0.21
PSOJ127.2817+03.0657 5.85 20.690.05 2014-12-15 1_12 22.8S 0.04
SDSSJ0836+0054 5.81 18.700.01 2012-01-05 1_12 23.3S 0.13
VIKJ0839+0015i 5.84 21.090.05 2017-01-26 1_1 23.3S 0.12
SDSSJ0842+1218 6.07 19.830.03 2017-05-02 1_2 21.9S 0.18
HSCJ0859+0022f 6.39 22.770.01 2017-01-25 1_1 23.4S 0.08
PSOJ135.3860+16.2518 5.63 20.670.04 2014-02-04 1_1 22.8S 0.11
PSOJ135.8704-13.8336 5.91 20.310.04 2014-12-17 12_12 23.2P 0.18
PSOJ157.9070-02.6599 5.88 20.240.03 2017-01-25 2_1 23.1S 0.12
PSOJ159.2257-02.5438 6.38 20.460.04 2017-01-26 1_1 23.5S 0.13
SDSSJ1044-0125 5.78 19.310.01 2017-01-26 1_1 24.1S 0.14
CFHQSJ1059-0906 5.92 20.840.06 2017-01-24 1_1 23.6P 0.09
PSOJ167.6415-13.4960d 6.51 22.94 2017-05-02 1_1 23.4S 0.15
PSOJ174.7920-12.2845 5.81 20.040.04 2017-01-28 1_1 23.4P 0.09
PSOJ175.4091-20.2654 5.69 20.170.04 2017-01-24 1_1 23.6P 0.14
VIKJ1152+0055f 6.37 21.830.01 2014-02-05 1_123 23.3S 0.06
PSOJ183.2991-12.7676 5.86 19.470.02 2017-04-29 1_3 23.3P 0.13
PSOJ184.3389+01.5284 6.20 21.200.07 2017-05-01 1_1 23.2P 0.06
PSOJ187.1047-02.5609 5.77 20.920.05 2014-01-29 1_123 23.1S 0.09
PSOJ187.3050+04.3243 5.89 20.920.04 2017-04-30 1_1 23.4S 0.05
SDSSJ1306+0356 6.02 19.760.03 2017-04-30 1_1 23.2S 0.07
ULASJ1319+0950 6.13 20.130.02 2017-04-29 1_1 23.6S 0.05
PSOJ209.2058-26.7083 5.72 19.350.01 2014-02-02 1_12 23.2P 0.17
PSOJ210.8297+09.0474 5.88 20.310.03 2016-08-23 1_1 22.4S 0.07
PSOJ210.8722-12.0094 5.84 21.090.07 2018-03-23 23_1 23.3S 0.19
PSOJ212.2974-15.9865 5.83 20.980.06 2015-05-21 1_123 23.2S 0.26
SDSSJ1411+1217 5.90 20.580.02 2016-08-22 1_1 22.2S 0.06
PSOJ213.3629-22.5617 5.92 19.550.02 2016-08-22 2_1 22.9P 0.23
PSOJ213.7329-13.4803 5.78 20.860.05 2016-08-23 2_1 23.0P 0.21
PSOJ215.1514-16.0417 5.73 19.080.02 2011-03-05 9_123 22.8P 0.21
PSOJ217.0891-16.0453 6.11 20.460.04 2016-08-22 2_1 22.8P 0.25
PSOJ217.9185-07.4120 6.14 21.100.08 2015-05-19 1_123 23.1P 0.18
CFHQSJ1509-1749a 6.12 20.260.02 2016-08-17 1_1 23.2P 0.24
PSOJ228.6871+21.2388 5.92 20.920.06 2017-04-29 2_1 23.4S 0.13
PSOJ235.9450+17.0079 5.82 20.230.03 2016-08-21 2_1 23.1S 0.09
PSOJ236.2912+16.6088 5.82 20.690.05 2016-08-20 1_1 23.0S 0.09
PSOJ238.8510-06.8976 5.81 20.430.05 2015-05-21 1_12 22.7P 0.45
PSOJ239.7124-07.4026 6.11 19.780.03 2016-08-21 12_1 23.4P 0.45
PSOJ242.4397-12.9816 5.83 19.760.04 2014-02-04 1_1 23.0P 0.80
PSOJ245.0636-00.1978 5.68 21.150.07 2015-05-19 1_1 23.1S 0.26
PSOJ247.2970+24.1277d 6.48 22.77 2017-05-01 12_1 23.7S 0.14
PSOJ261.0364+19.0286d 6.44 22.92 2017-04-22 2_1 23.8P 0.12
PSOJ267.0021+22.7812 5.95 20.890.06 2016-08-17 1_1 23.0P 0.27
PSOJ308.0416-21.2339 6.24 21.120.08 2014-09-24 1_12 23.0S 0.14
PSOJ308.4829-27.6485 5.80 19.710.02 2013-09-08 12_12 23.0P 0.13
SDSSJ2053+0047j 5.92 21.410.06 2016-08-21 1_1 23.3S 0.22
SDSSJ2054-0005 6.04 21.030.09 2016-08-22 1_1 23.5S 0.26
CFHQSJ2100-1715 6.09 21.550.09 2016-08-21 1_1 23.6S 0.17
PSOJ319.6040-10.9326 5.90 19.940.02 2013-09-10 1_123 23.4P 0.13
SDSS211951.9-004020c 5.87 21.680.10 2017-09-21 1_1 23.2S 0.12
PSOJ320.8703-24.3604 5.73 20.170.04 2013-09-05 1_123 22.8P 0.10
PSOJ323.1382+12.2986d 6.59 21.560.10 2017-04-27 1_1 23.3S 0.28
SDSSJ2147+0107j 5.81 21.610.08 2016-08-22 1_1 23.3S 0.30
PSOJ328.7339-09.5076 5.92 20.820.06 2016-08-22 1_1 23.2P 0.12
IMSJ2204+0012g 5.94 22.950.07 2016-08-23 1_1 23.4S 0.13
HSCJ2216-0016f 6.10 22.780.02 2016-08-31 1_1 23.7S 0.20
SDSSJ2220-0101 5.62 20.360.05 2016-10-20 2_1 23.4S 0.19
SDSSJ2228+0110e 5.95 22.280.20 2016-10-20 2_1 23.4S 0.18
CFHQSJ2229+1457 6.15 21.840.12 2016-09-03 1_1 23.8S 0.15
PSOJ340.2041-18.6621 6.01 20.140.03 2012-05-22 1_123 23.7P 0.09
SDSSJ2310+1855c 6.00 19.210.09 2016-10-25 1_1 22.7S 0.46
CFHQSJ2329-0403k 5.90 21.870.08 2016-08-26 1_1 23.0S 0.12
PSOJ357.8289+06.4019 5.81 21.310.10 2014-09-25 1_1234 23.2S 0.21
PSOJ359.1352-06.3831 6.15 19.970.03 2014-09-25 1_1 22.6S 0.09
SDSSJ2356+0023j 6.00 21.660.08 2016-08-29 1_1 23.2S 0.10
[x]rccccccc
Full GROND photometry of all 116 QSOs observed.
All magnitudes are in the AB system, and corrected for the Galactic
extinction (see Tab. 3.5). Upper limits are at the 3
confidence level.
Name
(mag) (mag) (mag) (mag) (mag) (mag) (mag)
\endfirstheadcontinued.
Name
(mag) (mag) (mag) (mag) (mag) (mag) (mag)
\endhead\endfootPSOJ000.3401+26.8358 24.66 22.920.15 21.550.11 19.430.04 19.440.10 19.100.13 19.19
SDSSJ0005-0006 24.95 24.55 22.720.15 20.540.04 20.550.15 20.350.19 19.810.23
PSOJ002.1073-06.4345 23.62 23.62 22.70 20.240.05 19.820.11 19.910.17 19.03
PSOJ004.3936+17.0862 24.62 24.09 22.59 20.400.06 20.260.20 19.990.29 19.45
PSOJ004.8140-24.2991 23.36 22.85 22.220.22 19.550.04 18.960.22 19.010.13 17.87
PSOJ007.0273+04.9571 23.75 23.85 22.640.20 20.250.04 19.910.13 19.69015 19.45
CFHQSJ0033-0125 24.45 23.95 23.33 22.450.22 21.100.24 20.90 19.05
PSOJ009.3573-08.1190 24.56 22.940.26 22.200.11 20.090.04 19.450.24 18.42 19.03
PSOJ009.7355-10.4316 24.42 24.08 23.35 20.830.06 19.560.10 19.410.12 19.430.20
PSOJ011.3899+09.0325 23.44 23.51 23.20 22.94 20.63 20.08 19.13
CFHQSJ0055+0146 25.50 25.19 24.26 22.410.09 21.96 21.44 20.04
SDSSJ0100+2802 24.80 24.53 20.590.04 18.270.03 17.600.05 17.490.05 17.200.08
CFHQSJ0102-0218 22.83 23.34 22.98 22.660.29 21.57 21.13 20.30
PSOJ021.4213-25.8822 23.91 22.890.18 22.360.19 19.440.10 19.190.07 19.200.09 19.200.17
SDSSJ0129-0035 25.13 24.80 23.490.26 22.240.14 21.42 20.54 19.70
PSOJ023.0071-02.2675 24.99 24.37 23.390.28 20.580.05 19.850.09 19.810.12 19.280.30
CFHQSJ0136+0226 25.00 24.65 23.67 22.210.14 21.46 20.63 21.88
PSOJ025.2376-11.6831 23.79 24.05 22.570.16 19.730.04 19.840.09 19.440.10 19.35
ATLASJ025.6821-33.4627 22.38 22.84 21.320.25 19.450.05 18.860.06 18.670.08 18.570.21
ULASJ0148+0600 25.26 24.80 22.510.09 19.530.03 19.190.06 19.030.07 18.780.14
PSOJ029.5172-29.0886 23.24 23.54 21.940.09 19.210.04 19.120.07 19.210.09 18.420.16
ATLASJ029.9915-36.565 22.35 22.95 21.710.20 19.910.05 19.99 19.430.13 19.99
ULASJ0203+0012 24.89 24.56 23.49 20.570.05 19.620.08 19.220.08 19.330.13
CFHQSJ0210-0456 25.09 24.75 23.82 22.860.20 21.76 21.13 19.57
CFHQSJ0221-0802 22.72 23.34 22.93 22.440.24 21.69 20.50 20.20
PSOJ036.5078+03.0498 24.68 24.34 22.690.16 20.540.05 19.340.07 19.610.10 19.360.16
CFHQSJ0227-0605 25.45 25.05 24.06 22.740.17 21.350.24 21.12 20.18
PSOJ037.9706-28.8389 25.13 24.77 23.280.20 20.650.04 20.670.17 20.62 19.80
SDSSJ0239-0045 22.55 22.85 22.59 22.88 21.70 21.01 20.38
PSOJ040.0159+17.5458 24.94 24.24 23.640.25 20.870.04 20.270.10 20.280.14 19.91
PSOJ042.6690-02.9174 24.16 24.05 23.280.28 20.320.04 20.370.12 20.440.18 19.67
PSOJ045.1840-22.5408 25.29 23.430.17 22.400.14 20.320.05 19.680.10 19.470.12 19.230.21
SDSSJ0303-0019 25.36 25.29 23.98 21.170.05 20.920.15 20.92 19.98
VIKJ0305-3150 24.99 21.66 23.99 21.960.18 21.320.28 20.82 18.50
CFHQSJ0316-1340 25.43 25.21 23.980.27 21.430.05 20.790.22 20.650.26 20.39
PSOJ049.2934-26.5543 24.85 24.47 23.80 20.720.05 21.390.27 21.26 18.84
VIKJ0328-3253 23.39 23.57 22.770.23 20.170.04 20.140.10 19.980.14 19.49
PSOJ053.9605-15.7956 23.52 23.57 22.96 20.840.05 20.770.18 20.690.28 19.740.28
PSOJ055.4244-00.8035 23.41 23.59 22.000.19 20.510.07 20.120.23 20.040.26 19.28
PSOJ056.7168-16.4769 22.25 22.63 22.45 19.920.04 19.550.10 20.070.28 19.400.28
SDSSJ0353+0104 23.83 24.82 23.80 20.860.06 19.760.11 20.060.17 19.110.21
PSOJ060.5529+24.8567 24.53 24.30 23.38 19.940.04 19.640.12 19.550.17 19.410.26
PSOJ065.4085-26.9543 23.74 23.91 22.430.24 20.150.05 19.040.10 19.100.10 18.94
PSOJ065.5041-19.4579 24.00 23.83 22.85 19.800.04 20.030.24 19.080.12 19.160.23
PSOJ071.0322-04.5591 25.19 24.54 22.880.13 20.080.03 20.260.10 20.220.14 19.850.19
PSOJ071.4507-02.3332 24.95 22.270.05 21.470.05 19.100.03 18.970.06 18.950.06 19.110.16
DESJ0454-4448 23.73 24.18 22.770.15 20.540.04 20.320.12 19.950.15 19.640.30
PSOJ075.9356-07.5061 24.94 24.66 23.320.26 20.500.04 20.340.15 20.370.21 19.31
PSOJ089.9394-15.5833 24.87 24.64 22.810.22 19.450.03 18.840.06 18.510.06 18.280.09
PSOJ108.4429+08.9257 24.40 24.04 22.360.19 19.210.03 19.150.08 18.940.09 18.890.14
SDSSJ0818+1722 24.23 24.12 21.710.09 19.540.04 19.040.09 18.590.09 17.46
ULASJ0828+2633 22.64 23.11 22.58 20.580.08 20.070.17 20.100.25 18.57
PSOJ127.2817+03.0657 24.09 23.75 23.29 20.690.06 20.730.23 20.130.22 19.760.24
SDSSJ0836+0054 24.64 22.200.05 21.180.05 18.750.03 18.510.06 18.170.06 17.990.09
VIKJ0839+0015 24.49 24.34 23.56 21.510.08 20.610.29 20.68 18.15
SDSSJ0842+1218 22.39 22.55 21.71 19.790.07 19.480.11 19.350.13 18.940.29
HSCJ0859+0022 24.60 24.52 23.70 23.060.27 20.11 19.81 17.41
PSOJ135.3860+16.2518 24.20 23.91 22.790.27 20.730.07 20.510.18 20.49 19.72
PSOJ135.8704-13.8336 24.86 24.36 23.200.23 20.250.04 20.880.22 20.420.25 19.93
PSOJ157.9070-02.6599 24.23 22.280.09 22.530.15 20.160.04 20.030.12 20.380.22 19.23
PSOJ159.2257-02.5438 24.85 24.63 23.93 20.410.05 19.740.12 19.810.18 18.65
SDSSJ1044-0125 24.74 22.800.08 21.820.07 19.190.03 18.940.07 18.880.08 18.58
CFHQSJ1059-0906 25.25 24.81 23.57 20.740.04 20.340.15 20.350.20 18.36
PSOJ167.6415-13.4960 24.54 24.44 23.66 22.120.13 20.700.21 20.280.23 19.46
PSOJ174.7920-12.2845 24.87 23.880.16 22.660.14 20.250.04 20.370.19 20.25 19.99
PSOJ175.4091-20.2654 25.02 23.950.21 22.860.14 20.290.04 19.800.10 19.590.10 18.68
VIKJ1152+0055 24.90 24.72 23.90 22.300.15 21.180.28 21.16 20.21
PSOJ183.2991-12.7676 24.77 23.490.13 21.790.07 18.810.04 19.020.06 18.800.07 18.990.22
PSOJ184.3389+01.5284 24.35 24.40 23.61 21.290.07 20.98 20.62 19.36
PSOJ187.1047-02.5609 24.32 23.94 23.18 21.020.07 20.700.18 20.410.21 20.06
PSOJ187.3050+04.3243 24.82 24.55 23.79 21.160.06 20.940.29 20.68 19.64
SDSSJ1306+0356 24.84 24.48 23.040.21 19.710.04 19.02 19.15 17.61
ULASJ1319+0950 25.31 24.50 22.740.12 20.160.04 19.600.08 19.530.11 19.50
PSOJ209.2058-26.7083 24.39 23.57 21.980.10 19.410.03 19.200.08 19.200.10 19.320.22
PSOJ210.8297+09.0474 24.26 23.60 22.74 20.390.07 20.17 20.02 19.99
PSOJ210.8722-12.0094 25.01 24.64 23.30 21.040.06 20.960.23 20.27 19.78
PSOJ212.2974-15.9865 24.61 24.24 23.74 21.200.07 20.530.16 20.340.19 20.03
SDSSJ1411+1217 24.07 23.49 22.82 19.680.05 20.090.20 19.480.23 19.25
PSOJ213.3629-22.5617 24.41 24.17 23.14 19.730.04 19.940.12 20.040.21 18.99
PSOJ213.7329-13.4803 24.39 23.97 22.940.29 20.950.07 20.700.26 20.200.28 19.37
PSOJ215.1514-16.0417 24.50 22.850.12 22.260.13 19.070.03 18.790.06 18.610.07 18.590.26
PSOJ217.0891-16.0453 24.34 24.16 22.460.21 20.290.05 19.590.10 19.970.19 19.43
PSOJ217.9185-07.4120 24.90 24.49 23.410.24 20.740.04 19.790.08 19.730.11 19.770.21
CFHQSJ1509-1749 23.17 23.73 23.02 20.050.04 19.710.09 19.660.16 19.690.27
PSOJ228.6871+21.2388 25.34 24.92 23.65 20.640.04 20.510.17 20.190.21 19.16
PSOJ235.9450+17.0079 24.77 23.520.14 22.640.16 20.350.04 20.210.12 19.920.18 19.47
PSOJ236.2912+16.6088 24.91 23.96 23.50 21.040.08 20.70 20.09 20.15
PSOJ238.8510-06.8976 24.13 23.92 22.91 20.320.06 20.110.18 20.160.25 19.94
PSOJ239.7124-07.4026 24.95 23.50 22.330.15 19.690.03 19.270.09 19.220.11 18.920.18
PSOJ242.4397-12.9816 23.91 23.15 22.42 19.720.04 19.420.11 19.490.16 19.210.28
PSOJ245.0636-00.1978 24.34 24.10 23.38 21.570.11 20.830.27 20.57 19.77
PSOJ247.2970+24.1277 25.59 25.26 24.06 21.070.05 20.020.10 19.860.15 19.45
PSOJ261.0364+19.0286 25.02 24.69 23.960.26 22.120.09 20.720.17 20.390.17 19.94
PSOJ267.0021+22.7812 22.73 23.28 22.97 21.760.19 20.75 20.36 19.91
PSOJ308.0416-21.2339 24.66 24.35 23.28 20.470.05 20.030.11 19.630.12 19.470.17
PSOJ308.4829-27.6485 23.95 23.560.28 22.220.13 19.660.04 19.460.09 19.390.12 18.870.19
SDSSJ2053+0047 23.50 23.71 23.31 21.210.07 20.93 20.730.25 19.92
SDSSJ2054-0005 23.67 24.02 23.01 20.670.04 20.330.11 20.040.15 19.310.22
CFHQSJ2100-1715 23.99 24.16 23.73 21.450.06 20.450.12 19.910.12 19.840.23
PSOJ319.6040-10.9326 24.30 24.43 22.410.12 19.990.03 19.960.09 19.720.11 19.470.30
SDSS211951.9-004020 24.75 24.66 23.45 22.300.17 20.65 20.08 18.72
PSOJ320.8703-24.3604 23.89 24.05 22.840.27 20.270.05 20.190.12 19.420.10 19.64
PSOJ323.1382+12.2986 23.79 24.58 23.400.26 20.290.04 19.320.07 19.200.10 19.070.22
SDSSJ2147+0107 23.62 24.05 23.45 21.710.10 21.27 20.80 19.69
PSOJ328.7339-09.5076 23.70 24.03 23.14 20.580.05 20.130.12 20.000.15 19.47
IMSJ2204+0012 23.58 24.02 23.16 22.960.23 21.34 20.77 19.69
HSCJ2216-0016 25.22 25.18 24.25 22.910.19 21.87 21.25 19.98
SDSSJ2220-0101 24.83 23.73 22.180.10 20.820.05 20.340.14 20.070.16 20.28
SDSSJ2228+0110 25.73 24.51 23.64 22.180.14 21.280.28 20.71 18.92
CFHQSJ2229+1457 25.19 24.96 23.36 21.870.08 21.24 21.04 20.60
PSOJ340.2041-18.6621 25.25 25.00 23.560.22 20.170.03 20.050.09 19.910.15 19.600.24
SDSSJ2310+1855 24.71 24.25 21.760.13 19.240.04 18.630.06 18.730.10 19.99
CFHQSJ2329-0403 24.00 24.30 23.36 21.900.17 20.21 19.59 17.72
PSOJ357.8289+06.4019 24.57 23.78 23.66 21.430.09 21.12 20.85 20.02
PSOJ359.1352-06.3831 23.87 23.57 22.36 19.900.05 19.890.15 19.760.20 18.910.21
SDSSJ2356+0023 24.54 24.23 23.46 23.10 20.66 20.31 19.54
| QSO candidate | Date / Time | Instrument/ |
|---|---|---|
| (MM-DD HH:MM) | Telescope | |
| IMSJ2204+0012 | 06-26 08:01 | FIRE/Baade |
| SDSSJ2054-0005_4 | 09-03 01:34 | GMOS-S |
| SDSSJ2054-0005_3 | 09-03 02:04 | GMOS-S |
| PSOJ261.0364+19.0286 | 09-03 08:59 | GMOS-N |
| PSOJ267.0021+22.7812 | 09-03 09:30 | GMOS-N |
| CFHQSJ1509-1749 | 09-04 00:03 | GMOS-S |
| PSOJ011.3899+09.0325 | 09-06 14:22 | GMOS-N |
| ULASJ0148+0600 | 09-06 14:52 | GMOS-N |
| PSOJ009.7355-10.4316 | 09-19 05:34 | GMOS-S |
| PSOJ045.1840-22.5408 | 09-22 04:38 | GMOS-S |
| PSOJ071.0322-04.5591 | 10-29 05:29 | GMOS-S |
| Prime QSO | RA/Decl. (2000.0) | W1 | W2 | ID | |||||||
|---|---|---|---|---|---|---|---|---|---|---|---|
| CFHQSJ0227-0605 | 36.9473 06.0495 | 25.56 | 24.260.17 | 21.640.05 | 20.110.04 | 18.910.06 | 18.650.06 | 18.840.13 | 19.670.10 | 20.380.33 | L0 |
| HSCJ0859+0022 | 134.7528 +00.3927 | 24.90 | 23.300.10 | 20.880.04 | 19.290.03 | 18.050.06 | 17.820.06 | 17.72 | 18.670.05 | 19.260.16 | L0 |
| PSOJ037.9706-28.8389 | 38.0071 28.8519 | 25.02 | 24.59 | 23.270.21 | 21.750.08 | 20.270.12 | 19.990.14 | 19.700.23 | 20.290.15 | – | M9 |
| PSOJ055.4244-00.8035 | 55.4110 00.8079 | 23.72 | 23.52 | 23.25 | 21.710.19 | 20.080.24 | 20.26 | 19.21 | 20.040.15 | 19.950.30 | QSO |
| PSOJ075.9356-07.5061 | 75.9660 07.4760 | 25.59 | 25.11 | 22.030.07 | 20.430.04 | 19.270.07 | 18.950.07 | 18.970.28 | 19.640.11 | 19.93 | L3 |
| PSOJ135.8704-13.8336 | 135.8657 13.8220 | 25.08 | 23.440.11 | 21.130.04 | 19.430.03 | 17.910.05 | 17.620.05 | 17.860.08 | 18.290.04 | 18.780.10 | L3 |
| PSOJ340.2041-18.6621 | 340.2045 18.6680 | 25.36 | 24.87 | 22.090.06 | 20.530.04 | 19.080.06 | 18.810.07 | 19.140.15 | 19.650.12 | 19.770.26 | L1 |
| SDSSJ0005-0006 | 1.4755 00.0968 | 25.06 | 23.760.18 | 21.400.05 | 19.670.03 | 18.140.05 | 17.940.06 | 17.880.08 | 18.670.06 | 18.790.11 | M9 |
| ULASJ0148+0600 | 27.1558 +06.0265 | 25.46 | 24.89 | 23.92 | 22.410.13 | 21.060.18 | 20.930.27 | 19.28 | 19.900.14 | 19.89 | QSO/Gal |
| Prime QSO | RA/Decl. (2000.0) | ID | |||||||
|---|---|---|---|---|---|---|---|---|---|
| CFHQSJ1509-1749 | 227.4413 17.8303 | 23.47 | 23.94 | 23.32 | 22.310.16 | 21.280.27 | 21.01 | 20.32 | QSO/M8 |
| DESJ0454-4448 | 73.5198 44.8196 | 23.65 | 24.21 | 23.490.26 | 21.600.08 | 20.050.10 | 20.410.20 | 19.700.29 | L1 |
| IMSJ2204+0012 | 331.0878 +01.2344 | 23.79 | 24.20 | 23.66 | 22.090.11 | 20.950.21 | 20.370.21 | 19.71 | QSO/M8 |
| PSOJ009.7355-10.4316 | 9.718510.4161 | 24.52 | 24.36 | 23.17 | 21.790.12 | 20.850.28 | 20.540.30 | 19.99 | QSO/M9 |
| PSOJ011.3899+09.0325 | 11.3462 +09.0813 | 23.84 | 23.84 | 23.51 | 21.540.09 | 21.67 | 20.960.33 | 20.13 | QSO/M6 |
| PSOJ036.5078+03.0498 | 36.5245 +03.0958 | 24.79 | 24.69 | 23.300.28 | 21.600.09 | 20.060.10 | 20.020.14 | 20.08 | |
| PSOJ045.1840-22.5408 | 45.1936 22.5280 | 25.37 | 24.59 | 23.60 | 21.970.12 | 20.660.19 | 20.160.20 | 19.33 | QSO/M9 |
| PSOJ071.0322-04.5591 | 71.0745 04.5348 | 24.87 | 24.38 | 24.08 | 22.290.13 | 21.220.20 | 20.94 | 19.740.18 | |
| PSOJ071.4507-02.3332 | 71.4815 02.3637 | 25.08 | 24.75 | 23.250.18 | 21.650.07 | 20.450.11 | 20.520.18 | 20.11 | |
| PSOJ261.0364+19.0286 | 261.0269 +19.0228 | 25.23 | 24.85 | 23.900.23 | 22.230.09 | 21.48 | 20.84 | 19.89 | QSO/? |
| PSOJ267.0021+22.7812 | 266.9979 +22.7922 | 23.07 | 23.51 | 23.14 | 21.350.09 | 20.850.23 | 20.280.25 | 19.86 | QSO/T6 |
| PSOJ328.7339-09.5076 | 328.7633 09.4779 | 23.80 | 24.10 | 23.250.32 | 21.630.09 | 20.440.14 | 20.030.13 | 19.38 | |
| SDSSJ0303-0019 | 45.8859 00.3281 | 25.72 | 25.16 | 24.49 | 22.890.14 | 22.02 | 21.53 | 20.06 | T8 |
| SDSSJ2053+0047_1 | 313.3294 +00.7677 | 23.53 | 23.91 | 23.41 | 22.200.14 | 21.010.25 | 21.040.33 | 19.99 | M9 |
| SDSSJ2053+0047_3 | 313.3766 +00.7606 | 23.78 | 23.70 | 23.49 | 22.060.15 | 21.340.30 | 20.91 | 20.34 | M5 |
| SDSSJ2054-0005_3 | 313.5334 00.0914 | 24.00 | 24.25 | 23.71 | 21.810.10 | 20.820.18 | 20.440.25 | 19.73 | |
| SDSSJ2054-0005_4 | 313.5450 00.0525 | 24.00 | 24.25 | 23.71 | 22.160.12 | 20.980.20 | 20.790.28 | 19.98 |
| Prime QSO | unWISE | CatWISE | ID1 | ID2 | ||
|---|---|---|---|---|---|---|
| W1 | W2 | W1 | W2 | |||
| PSOJ036.5078+03.0498 | – | – | 20.960.16 | 21.030.32 | L2 | L0 |
| PSOJ071.0322-04.5591 | 19.470.04 | 19.570.09 | 19.390.04 | 19.630.09 | QSO | low-z Gal |
| PSOJ071.4507-02.3332 | 21.090.04 | – | 21.370.21 | 21.450.45 | M9 | M9 |
| PSOJ328.7339-09.5076 | 19.060.05 | 19.260.10 | 19.130.04 | 19.310.07 | M8 | low-z Gal |
| SDSSJ2054-0005_3 | 19.730.08 | – | 19.800.06 | 20.460.17 | QSO | ? |
| SDSSJ2054-0005_4 | – | – | 21.060.18 | 21.15NULL | QSO | M8 |
4 Conclusions
No candidate QSO pair has been found in a search of 116 spectroscopically confirmed redshift 6 quasars within our 0.1–3.3 cMpc search radius with a companion brighter than M1450 (AB) mag. Although this result is consistent with cosmological-scale galaxy evolution simulations (given the redshift, search volume, and luminosity limits), the serendipitously discovered pairs at z=4.26 (Schneider et al., 2000) and z=5.02 (McGreer et al., 2016) suggested one pair every 40 QSOs, or 2.5%, implying an empirical expectation of 3 pairs in our sample of 116 search targets. At first glance, this result suggests little clustering at redshift 6. However, with updated knowledge of the faint end of the luminosity function, the statistics returns more than an order of magnitude higher value than inferred from the low-redshift clustered QSOs; thus, given the still low statistics in our search and the uncertainties (in particular in the unknown search volumes) of the serendipitous detections, we are not able to claim that the clustering at redshift 6 is indeed smaller than up to redshift 5.
As a consequence of our search, we do find a higher than expected rate of ultracool dwarfs. While the excess of L dwarfs is marginally consistent with statistics and could be due to the accidental lack of a single source about 1 mag fainter, this argument does not hold for the T dwarfs. The observed excess of a factor of 20 suggests either (i) strong surface density variations over the sky, (ii) a lack of appropriate templates for other source types (e.g. low-redshift red galaxies) such that the T templates just happen to be the closest in shape to the observed SEDs, or (iii) an under-estimate of the true rate of T dwarfs. A larger survey at our depth would be needed to settle this question.

Acknowledgements.
We thank the referee for the detailed comments. Part of the funding for GROND (both hardware as well as personnel) was generously granted from the Leibniz-Prize to Prof. G. Hasinger (DFG grant HA 1850/28-1). PS acknowledges support through the Sofja Kovalevskaja Award from the Alexander von Humboldt Foundation of Germany while at MPE. JG greatly acknowledges the GROND observers Thomas Krühler, Tassilo Schweyer, Simon Steinmassl, Helmut Steinle and Phil Wiseman.We explicitly acknowledge the open attitude of providing the detailed model predictions for dwarfs by Ryan & Reid (2016) for download, which only enabled the creation of Fig. 5.
The reported spectroscopy is based on observations obtained at the international Gemini Observatory, a program of NSF’s NOIRLab, which is managed by the Association of Universities for Research in Astronomy (AURA) under a cooperative agreement with the National Science Foundation on behalf of the Gemini Observatory partnership: the National Science Foundation (United States), National Research Council (Canada), Agencia Nacional de Investigación y Desarrollo (Chile), Ministerio de Ciencia, Tecnología e Innovación (Argentina), Ministério da Ciência, Tecnologia, Inovações e Comunicações (Brazil), and Korea Astronomy and Space Science Institute (Republic of Korea).
This paper includes data gathered with the 6.5 m Magellan Telescopes located at Las Campanas Observatory, Chile.
This research has made use of the NASA/IPAC Infrared Science Archive, which is operated by the Jet Propulsion Laboratory, California Institute of Technology, under contract with the National Aeronautics and Space Administration.
For photometric calibration, the Sloan Digital Sky Survey, PanSTARRS, SkyMapper and 2MASS are acknowledged: Funding for SDSS-III has been provided by the Alfred P. Sloan Foundation, the Participating Institutions, the National Science Foundation, and the U.S. Department of Energy Office of Science. The SDSS-III web site is http://www.sdss3.org/. SDSS-III is managed by the Astrophysical Research Consortium for the Participating Institutions of the SDSS-III Collaboration including the University of Arizona, the Brazilian Participation Group, Brookhaven National Laboratory, Carnegie Mellon University, University of Florida, the French Participation Group, the German Participation Group, Harvard University, the Instituto de Astrofisica de Canarias, the Michigan State/Notre Dame/JINA Participation Group, Johns Hopkins University, Lawrence Berkeley National Laboratory, Max Planck Institute for Astrophysics, Max Planck Institute for Extraterrestrial Physics, New Mexico State University, New York University, Ohio State University, Pennsylvania State University, University of Portsmouth, Princeton University, the Spanish Participation Group, University of Tokyo, University of Utah, Vanderbilt University, University of Virginia, University of Washington, and Yale University. The Pan-STARRS1 Surveys (PS1) have been made possible through contributions of the Institute for Astronomy, the University of Hawaii, the Pan-STARRS Project Office, the Max-Planck Society and its participating institutes, the Max Planck Institute for Astronomy, Heidelberg and the Max Planck Institute for Extraterrestrial Physics, Garching, The Johns Hopkins University, Durham University, the University of Edinburgh, Queen’s University Belfast, the Harvard-Smithsonian Center for Astrophysics, the Las Cumbres Observatory Global Telescope Network Incorporated, the National Central University of Taiwan, the Space Telescope Science Institute, the National Aeronautics and Space Administration under Grant No. NNX08AR22G issued through the Planetary Science Division of the NASA Science Mission Directorate, the National Science Foundation under Grant No. AST-1238877, the University of Maryland, and Eotvos Lorand University (ELTE). The national facility capability for SkyMapper has been funded through ARC LIEF grant LE130100104 from the Australian Research Council, awarded to the University of Sydney, the Australian National University, Swinburne University of Technology, the University of Queensland, the University of Western Australia, the University of Melbourne, Curtin University of Technology, Monash University and the Australian Astronomical Observatory. SkyMapper is owned and operated by The Australian National University’s Research School of Astronomy and Astrophysics. The survey data were processed and provided by the SkyMapper Team at ANU. The SkyMapper node of the All-Sky Virtual Observatory (ASVO) is hosted at the National Computational Infrastructure (NCI). Development and support the SkyMapper node of the ASVO has been funded in part by Astronomy Australia Limited (AAL) and the Australian Government through the Commonwealth’s Education Investment Fund (EIF) and National Collaborative Research Infrastructure Strategy (NCRIS), particularly the National eResearch Collaboration Tools and Resources (NeCTAR) and the Australian National Data Service Projects (ANDS). This publication makes use of data products from the Two Micron All Sky Survey, which is a joint project of the University of Massachusetts and the Infrared Processing and Analysis Center/California Institute of Technology, funded by the National Aeronautics and Space Administration and the National Science Foundation.
Facilities: Max Planck:2.2m (GROND), SDSS, PanSTARRS, SkyMapper, IRSA, ALLWISE, Magellan, Gemini
References
- Arnouts et al. (1999) Arnouts S., Cristiani S., Moscardini L. et al. 1999, MNRAS 310, 540
- Ayromlou et al. (2021a) Ayromlou M., Nelson D., Yates R.M., et al. 2021, MNRAS 502, 1051
- Ayromlou et al. (2021b) Ayromlou M., Kauffmann G., Yates R.M., et al. 2021, MNRAS 505, 492
- Bañados et al. (2016) Bañados E., Venemans B.P., Decarli R. et al. 2016, ApJ Suppl. 227, 11
- Bañados et al. (2018) Bañados E., Venemans B.P., Mazzucchelli C., et al. 2018, Nat. 553, 473
- Begelman et al. (2006) Begelman M.C., Volonteri M., Rees M.J., 2006, MNRAS 370, 289
- Bhowmick et al. (2019) Bhowmick A.K., DiMatteo T., Eftekharzadeh S., Myers A.D., 2019, MNRAS 485, 2026
- Bonoli et al. (2009) Bonoli S., Marulli F., Springel V., et al., 2009, MNRAS, 396 423
- Bromm & Loeb (2003) Bromm V., Loeb A., 2003, ApJ 596, 34
- Cappelluti et al. (2010) Cappelluti N., Ajello M., Burlon D. et al. 2010, ApJ 716, L209
- Carnall et al. (2015) Carnall A.C., Shanks T., Chehade B. et al. 2015, MNRAS 451, L16
- Chambers et al. (2016) Chambers K.C., Magnier E.A., N. Metcalfe N. et al. 2016, arXiv:1612.05560
- Chehade et al. (2016) Chehade B., Shanks T., Findlay J. et al. 2016, MNRAS 459, 1179
- Connor et al. (2020) Connor T., Bañados E., Mazzucchelli C. et al. 2020, ApJ 900, 189
- Costa et al. (2014) Costa T., Sijacki D., Trenti M., Haehnelt M.G., 2014, MNRAS 439, 2146
- Croton et al. (2006) Croton D.J., Springel V., White S.D.M., et al., 2006, MNRAS 365, 11
- Das et al. (2021) Das A., Schleicher D.R.G., Leigh N.W.C., Boekholt T.C.N., 2021, MNRAS 503, 1051
- Davis & Peebles (1983) Davis M., Peebles P.J.E., 1983, ApJ 267, 465
- Decarli et al. (2017) Decarli R., Walter F., Venemans B.P. et al. 2017, Nat 545, 457
- DeGraf & Sijacki (2017) DeGraf C., Sijacki D., 2017, MNRAS, 466 3331
- Devecchi & Volonteri (2009) Devecchi B., Volonteri M., 2009, ApJ 694, 302
- Devecchi et al. (2012) Devecchi B., Volonteri M., Rossi E.M., et al. 2012, MNRAS 421, 1465
- Dijkstra et al. (2008) Dijkstra M., Haiman Z., Mesinger A., Wyithe J.S.B., 2008, MNRAS 391, 1961
- Di Matteo et al. (2017) Di Matteo T., Croft R.A.C., Feng Y., et al., 2017, MNRAS 467, 4243
- Djorgovski et al. (2003) Djorgovski S.G., Stern D., Mahabal A.A., Brunner R., 2003, ApJ 596, 67
- Duras et al. (2020) Duras F., Bongiorno A., Ricci F., et al., 2020, A&A, 636 73
- Eftekharzadeh et al. (2017) Eftekharzadeh S., Myers A.D., Hennawi J.F. et al. 2017, MNRAS 468, 77
- Eisenstein et al. (2011) Eisenstein D.J., Weinberg D.H., Agol E. et al. 2011, AJ 142, 72
- Fan et al. (1999) Fan X., Strauss M.A., Schneider D.P., et al. 1999, AJ 118, 1
- Fang (1989) Fang L.Z., 1989, Int. J. Mod. Phys. A, vol. 4, p. 3477 (DOI: 10.1142/S0217751X89001394)
- Greiner et al. (2008) Greiner J., Bornemann W., Clemens C., et al. 2008, PASP 120, 405
- Habouzit et al. (2016a) Habouzit M., Volonteri M., Latif M., et al. 2016a, MNRAS 456, 1901
- Habouzit et al. (2016b) Habouzit M., Volonteri M., Latif M., Dubois Y., Peirani S., 2016b, MNRAS 463, 529
- Habouzit et al. (2019) Habouzit M., Volonteri M., Somerville R.S., et al. 2019, MNRAS 489, 1206
- Habouzit et al. (2021) Habouzit M., Li Y., Somerville R.S., et al., 2021, MNRAS 503, 1940
- Haiman & Hui (2001) Haiman Z., Hui L., 2001, ApJ 547, 27
- Haehnelt & Nusser (1999) Haehnelt M., Nusser A., 1999, in “Evolution of large scale structure: from recombination to Garching, Proc. MPA-ESO cosmology conf., August 1998, eds. A.J. Banday et al., p. 375
- Hennawi et al. (2006) Hennawi J.F., Strauss M.A., Oguri M. et al. 2006, AJ 131, 1
- Hennawi et al. (2010) Hennawi J.F., Myers A.D., Shen Y. et al. 2010, ApJ 719, 1672
- Henriques et al. (2020) Henriques B.M.B., Yates R.M., Fu J. et al., 2020, MNRAS 491, 5795
- Hopkins et al. (2007) Hopkins P.F., Lidz A., Hernquist L. et al. 2007, ApJ 662, 110
- Husband et al. (2013) Husband K., Bremer M.N., Stanway E.R et al. 2013, MNRAS 432, 2869
- Ilbert et al. (2006) Ilbert O., Arnouts S., McCracken H.J. et al. 2006, A&A 457, 841
- Inayoshi et al. (2020) Inayoshi K., Visbal E., Haiman Z., 2020, ARAA 58, 27
- Johnson et al. (2013) Johnson J.L., Whalen D.J., Li H., Holz D.E., 2013, ApJ 771, 116
- Jiang et al. (2009) Jiang L., Fan X., Bian F. et al. 2009, AJ 138, 305
- Jiang et al. (2016) Jiang L., McGreer I.D., Fan X. et al. 2016, ApJ 833, 222
- Kakazu et al. (2010) Kakazu Y., Hu E.M., Liu M.C. et al. 2010, ApJ 723, 184
- Kashikawa et al. (2007) Kashikawa N., Kitayama T., Doi M. et al., 2007, ApJ 663, 765
- Katz et al. (2015) Katz H., Sijacki D., Haehnelt M.G., 2015, MNRAS 451, 2352
- Kellogg (2017) Kellogg K., 2017, Electronic Thesis and Dissertation Repository, 4857 (https://ir.lib.uwo.ca/etd/4857)
- Kim et al. (2009) Kim S., Stiavelli M., Trenti M. et al. 2009, ApJ 695, 809
- Kim et al. (2015) Kim Y., Im M., Jeon Y. et al. 2015, ApJ 813, L35
- Krühler et al. (2008) Krühler T., Küpcü Yoldaş A., Greiner J., et al. 2008, ApJ 685, 376
- Küpcü Yoldaş et al. (2008) Küpcü Yoldaş A., Krühler T., Greiner J., et al. 2008, AIP Conf. Proc., 1000, 227
- Krumpe et al. (2012) Krumpe M., Miyaji T., Coil A.L., Aceves H., 2012, ApJ 746, 1
- Latif & Volonteri (2015) Latif M.A., Volonteri M., 2015, MNRAS 452, 1026
- Lesniewska & Michalowski (2019) Leśniewska A., Michalowski M.J., 2019, A&A 624, L13
- Lodato & Narayan (2006) Lodato G., Narayan P., 2006, MNRAS 371, 1813
- Loeb & Rasio (1994) Loeb A., Rasio F.A., 1994, ApJ 432, 52
- Lupi et al. (2019) Lupi A., Volonteri M., Decarli R., et al. 2019, MNRAS, 488, 4004
- Madau & Rees (2001) Madau P., Rees M.J., 2001, ApJ 551, L27
- Madau et al. (1999) Madau P., Haardt F., Rees M.J., 1999, ApJ 514, 648
- Mainzer et al. (2011) Mainzer A., Bauer J., Grav T., et al. 2011, ApJ 731, 53
- Marshall et al. (2020) Marshall M. A., Ni Y., Di Matteo T. et al., 2020, MNRAS 499, 3891
- Marinacci et al. (2018) Marinacci F., Vogelsberger M., Pakmor R. et al., 2018, MNRAS 480, 5113
- Marocco et al. (2021) Marocco F., Eisenhardt P.R.M., Fowler J.W. et al. 2021, ApJS 253, 8
- Matsuoka et al. (2016) Matsuoka Y., Onoue M., Kashikawa N. et al. 2016, ApJ 828, 26
- Matsuoka et al. (2018) Matsuoka Y., Strauss M.A., Kashikawa N. et al. 2018, ApJ 869, 150
- Mazzucchelli et al. (2017a) Mazzucchelli C., Bañados E., Decarli R. et al. 2017a, ApJ 834, 83
- Mazzucchelli et al. (2017b) Mazzucchelli C., Bañados E., Venemans B.P. et al. 2017b, ApJ 849, 91
- McGreer et al. (2016) McGreer I.D., Eftekharzadeh S., Myers A.D., Fan X., 2016, AJ 151, 61
- Naiman et al. (2018) Naiman J. P., Pillepich A., Springel V. et al. 2018, MNRAS 477, 1206
- Neeleman et al. (2019) Neeleman M., Bañados E., Walter F. et al. 2019, ApJ 882, 10
- Nelson et al. (2018) Nelson D., Pillepich A., Springel V. et al. 2018, MNRAS 475, 624
- Omukai et al. (2008) Omukai K., Schneider R., Haiman Z., 2008, ApJ 686, 801
- Pillepich et al. (2018) Pillepich A., Springel V., Nelson D. et al., 2018, MNRAS 473, 4077
- Planck Collaboration (2016) Planck Collaboration XIII, 2016, A&A 594, A13
- Porciani et al. (2007) Porciani C., Magliocchetti M., Norberg P., 2007, MNRAS 355, 1010
- Reed et a. (2015) Reed S.L., McMahon R.G., Banerji M. et al. 2015, MNRAS 454, 3952
- Regan & Haehnelt (2009) Regan J.A., Haehnelt M.G., 2009, MNRAS 393, 858
- Ross et al. (2013) Ross N.P., McGreer I.D., White M. et al., 2013, ApJ 773, 14
- Ryan & Reid (2016) Ryan R.E., Reid I.N., 2016, AJ 151, 92
- Schlafly & Finkbeiner (2011) Schlafly E.F., Finkbeiner D.P., 2011, ApJ 737, 103
- Schlafly et al. (2019) Schlafly E.F., Meisner A.M., Green G.M., 2019, ApJS 240, 30
- Schneider et al. (2000) Schneider D.P., Fan X., Strauss M.A. et al. 2000, AJ 120, 2183
- Scolnic et al. (2015) Scolnic D., Casertano S., Riess A., et al. 2015, ApJ 815, 117
- Shen et al. (2007) Shen Y., Strauss M.A., Oguri M. et al. 2007, AJ 133, 2222
- Shen et al. (2010) Shen Y., Hennawi J.F., Shankar F. et al. 2010, ApJ 719, 1693
- Shen et al. (2020) Shen X., Hopkins P.F., Faucher-Giguer̀e C.-A., et al. 2020, MNRAS 495, 3252
- Sheth et al. (2001) Sheth R.K., Mo H.J., Tormen G., 2001, MNRAS 323, 1
- Silverman et al. (2020) Silverman J.D., Tang S., Lee K.-G., et al. 2020, ApJ 899, 154
- Skrutskie et al. (2006) Skrutskie M.F., Cutri R.M., Stiening R. et al. 2006, AJ 131, 1163.
- Songaila (2004) Songaila A., 2004, AJ 127, 2598
- Spaans & Silk (2006) Spaans M., Silk J., 2006, ApJ 652, 902
- Springel et al. (2005) Springel V., White S.D.M., Jenkins A. et al., 2005, Nature 435, 629
- Springel et al. (2018) Springel V., Pakmor R., Pillepich A. et al., 2018, MNRAS 475, 676
- Tenneti et al. (2019) Tenneti A., Wilkins S.M., Di Matteo T. et al., 2019, MNRAS 483, 1388
- Tody (1993) Tody, D. 1993, ASP Conf. Ser. 52, Astronomical Data Analysis Software and Systems II, ed. R.J. Hanisch, R.J.V. Brissenden, & J. Barnes, p. 173
- Utsumi et al. (2010) Utsumi Y., Goto T., Kashikawa N., et al. 2010, ApJ 721, 1680
- Valiante et al. (2017) Valiante R., Agrarval B., Habouzit M., Pezzulli E., 2017, PASA 34, e031
- Valiante et al. (2018) Valiante R., Schneider R., Graziani L., Zappacosta L., 2018, MNRAS 474, 3825
- Venemans et al. (2013) Venemans B.P., Findlay J.R., Sutherland W.J. et al. 2013, ApJ 779, 24
- Venemans et al. (2015) Venemans B.P., Verdoes Kleijn G.A., Mwebaze J. et al. 2015, MNRAS 453, 2259
- Visbal et al. (2014) Visbal E., Haiman Z., Bryan G.L., 2014, MNRAS 445, 1056
- Vito et al. (2021) Vito F., Brandt W.N., Ricci F. et al. 2021, A&A 649, A133
- Volonteri (2010) Volonteri M., 2010, A&ARv 18, 279
- Volonteri et al. (2003a) Volonteri M., Haardt F., Madau P., 2003a, ApJ 582, 559
- Volonteri et al. (2003b) Volonteri M., Madau P., Haardt F.. 2003b, ApJ 594, 661
- Volonteri et al. (2016) Volonteri M., Dubois Y., Pichon C., Devriendt J., 2016, MNRAS 460, 2979
- Wang et al. (2021) Wang F., Yang J., Fan X. et al. 2021, ApJ 907, L1
- Willott et al. (2007) Willott C.J., Delorme P., Omont A. et al. 2007, AJ 134, 2435
- Willott et al. (2009) Willott C.J., Delorme P., Reyle C. et al. 2007, AJ 137, 3541
- Willott et al. (2010) Willott C.J., Albert L., Arzoumanian D. et al. 2010, AJ 140, 546
- Wolf et al. (2018) Wolf C., Onken C.A., Luvaul L.C. et al. 2018, PASA 35, 10
- Wright et al. (2010) Wright E.L., Eisenhardt P.R.M., Mainzer A.K. et al., 2010, AJ 140, 1868
- Wyithe et al. (2005) Wyithe J.S.B., Loeb A., Carilli C., 2005, ApJ 628, 575
- Yang et al. (2020) Yang J., Wang F., Fan X. et al. 2020, ApJ 897, L14
- Yue et al. (2014) Yue B., Ferrara A., Salvaterra R., et al. 2014, MNRAS 440, 1263
- Zeimann et al. (2011) Zeimann G.R., White R.L., Becker R.H. et al. 2011, ApJ 736, 57