SiO masers and 7 mm continuum emission in binary AGB stars Mira and R Aqr.
Abstract
Interactions between AGB stars and a secondary in a close orbit are one possible explanation of why some AGB stars develop into aspherical planetary nebulae. This study uses millimeter observations of the continuum and SiO maser emission in several symbiotic Miras looking for evidence of an interaction between the two stars. New JVLA observations at 45 mas resolution are analyzed, imaging continuum and SiO masers. Two of the three targets were detected and accurately registered continuum and line images were derived. No clear evidence of an interaction was found between components B and A in Mira. R Aqr has a well known jet arising from the secondary star. The jet may be disturbing the circumstellar envelop of the AGB star or possibly just nearly aligned with it.
keywords:
Stars: AGB and post-AGB – Stars:binaries:symbiotic – Radio lines:stars – Radio continuum:stars1 Introduction
A substantial fraction of main sequence stars, up to 50%, are known to exist in systems with multiple components. The importance of close binaries on stellar evolution has been recognized lately, but their effects on the close circumstellar environment is under active study. The influence of a companion on the region near to the surface of Asymptotic Giant Branch (AGB) stars may play a pivotal role in the formation of aspherical Planetary Nebulae (PNe). Observations of molecules in the winds of a sample of AGB stars (Ramstedt et al., 2014, 2017, 2018; Doan et al., 2017; Decin et al., 2020) show a variety of non spherical shapes which are attributed to the interactions with companion stars. Similar shaping might affect the episodes of mass loss leading to the formation of PNe.
SiO masers are usually found within the pulsating atmospheres of AGB stars at about 2 stellar radii, at about the distance at which silicate and other dust forms in the outflows (Karovicova et al., 2013; Gobrecht et al., 2016; Höfner & Freytag, 2019). These masers generally appear in the form of a ring centered on the photosphere and reveal motions in the inner envelope (Boboltz et al., 1997; Hollis et al., 1997b; Cotton et al., 2004, 2006; Ragland et al., 2008). Single dish monitoring of semi-regular and Mira AGB stars by Gómez-Garrido et al. (2020) show large and rapid variations of the SiO masers in the semi-regular giants RX Boo and RT Vir and slower variations in several Miras.
One of the current unknowns in stellar evolution is the shaping mechanism from asymptotic giant branch (AGB) stars to planetary nebulae. On the one hand, both recent optical spectro–polarimetry and radio/submm maser observations indicate unexpectedly high magnetic fields near or at the stellar surface (Lèbre et al., 2014; Vlemmings, 2018) and references therein. On the other hand, ALMA observations indicate the presence of companions around stars that were previously believed to be isolated e.g. the iconic ALMA observations of R Sculptoris; (Maercker et al., 2012). Whether binarity or magnetic fields dominate the evolutionary shaping mechanism is a matter of current debate.
One of the best places to study how the out-flowing material is shaped is at, or near, the stellar surface. Long baseline ALMA observations of the surfaces of AGB stars Mira and W Hya reveal hot-spots that likely influence and cause asymmetry in the near–circumstellar environment (Vlemmings et al., 2015, 2017). Towards binary system Mira AB, we have also recently discovered signs of the influence of the white dwarf Mira B at only a few stellar radii from AGB star Mira A (Humphreys et al., in prep). In this case, using ALMA long baseline data we found that SiO masers trace a portion of a bubble wall formed by the interacting Mira AB winds, also seen as a spiral plume in SiO thermal gas. In this paper, we present observations of continuum and SiO maser lines using the JVLA of Mira and two other AGB stars with known companions, W Aql and R Aqr. Our aims are to study the effect of the companions on the observed maser spot distribution.
Cotton et al. (2004, 2006) give a sequence of VLBA images of the SiO masers in the atmosphere of Mira. These appear as partial rings with diameters in the range 60 to 75 mas. The diameter of the =1,J=1-0 maser ring tends to be slightly larger than that of the =2,J=1-0 masers. Mennesson et al. (2002) give a uniform disk diameter of the photosphere in K band of 28.79 0.10 mas. Wittkowski et al. (2016) give a diameter of 28.5 1.5 mas at 2.25 m. Perrin et al. (2020) give the photospheric diameter in H band of 21.1 mas. The distance to Mira is given by Haniff et al. (1995) as 110 9 pc. at which distance 1” corresponds to 110 AU. The Hipparcos distance (van Leeuwen, 2007) is 9211 pc.
W Aquilae (W Aql) is a binary S–type AGB star sometimes showing SiO maser emission. SiO maser emission observed towards W Aql (Nakashima & Deguchi, 2007) disappeared for a time around 2011 (Ramstedt et al., 2012), which could be due to disruption by an additional companion (the known companion lies at about 0.46 arcseconds from the S–type AGB star, about 180 AU at a distance to W Aql of 395 pc). Peak SiO maser emission can reach 21 Jy (single–dish; Ramstedt et al. (2012)).
R Aquarii (R Aqr) is a symbiotic binary and a well–known host of millimeter and submillimeter SiO masers (Boboltz et al., 1997; Hollis et al., 1997b; Gray et al., 1998; Cotton et al., 2004, 2006; Ragland et al., 2008). Cotton et al. (2004, 2006) give a sequence of VLBA images of the SiO masers in the atmosphere of R Aqr with ring diameters of 31 to 33 mas. Infrared measurements of the photospheric size show a range of values between 11.2 and 18.4 mas (Tuthill et al., 2000; Mennesson et al., 2002; Ragland et al., 2008; Wittkowski et al., 2016).
The maser emission is variable but peak values in single–dish observations lie in the range up to 300 Jy. R Aqr consists of a Mira variable and an accreting, hot companion with a remarkable jet outflow. HST observations of the jet shows considerable change over a several year timescale (Hollis et al., 1997a). In 2014 the stars were separated by 45 mas (Schmid et al., 2017) or 9.8 AU at the distance to R Aqr of 218 pc (Min et al., 2014). ALMA observations of Bujarrabal et al. (2018) detect both stars with a bridge of material joining them, likely material flowing from the AGB primary to the accretion disk around the WD secondary. Cotton et al. (2004) show an unusual rotating ring of masers in January 2001. This ring was interpreted as arising in a rotating equatorial disk of material.
2 Observations
The observations were made on the JVLA near 7 mm wavelength during 2019 August 12 from 06:00:00 UT to 13:00:00 UT under project code 19A-220 in the most extended (“A”) configuration. The target stars (astrometric/bandpass calibrators) were W Aquilae (J1939-1525), R Aquarii (J2348-1631) and Mira, AKA omicron Ceti, (J0217+0144). The pulsation phase for W Aquilae was 0.27, for R Aquarii was 0.21 and 0.79 for Mira. The photometric calibrator was 3C48.
The observing sequence consisted of cycling between one of the targets (7 min) and its calibrator (2 min) for an hour and then proceeding to another target. Reference pointing was used with a pointing measurement made on the calibrator at the beginning of each sequence. The integration time was 2 seconds and only the parallel hand data (RR,LL) were recorded.
The masers observed were the SiO =2,J=1-0 and =1,J=1-0 transitions at 42.820587 and 43.122027 GHz respectively. Each transition was covered by 256 channels of 62.5 kHz bandwidth(0.9 km/s after Hanning). The center LSR velocity of the observation was 47 km/sec for Mira and -22 km/sec for R Aqr and W Aql for which the true systemic velocity is approximately -26 and -18 km/sec respectively. The continuum observations consisted of 58 spectral windows in the range of 41.0 to 48.7 GHz using 7424 1 MHz channels; spectral regions containing the masers were not included.
3 Calibration
The conditions of these observations, Summertime, high frequency and high resolution render the proper calibration of the data more difficult. In order to allow accurate comparison of the continuum and line images they must be aligned both photometrically and especially astrometrically. The relatively poor phase coherence of the data make this more difficult. Photometric calibration is complicated by the relatively poor sensitivity and strong resolution of the photometric calibrator by the 45 mas resolution of the given data. Fortunately, the masers in two of the targets are quite strong and allow relative phase calibration following the general approach of Reid & Menten (1990, 1997, 2007), adapted to the wide-band nature of the present data.
Data were translated from the archive format to AIPS format and were processed in the Obit package (Cotton, 2008). Hanning smoothing was used on the line data to suppress the artifacts resulting from the interaction of the strong, narrow maser signals and the finite delay range of the correlator.
3.1 Amplitude
The traditional amplitude calibration scheme for connected element interferometers is to compare the gain solutions of the astrometric and photometric calibrators to infer the flux density of the astrometric calibrator. This works well in the high signal-to-noise regime with well modeled and only marginally resolved calibrators but can produce poor results with low SNR data with strongly resolved photometric calibrators as is the case here. All of the centimeter wavelength stable photometric calibration sources, including 3C48 used in this work, are strongly resolved at the 45 mas resolution of this data.
We have adopted an alternate approach of using an initial, assumed flux density for the astrometric calibrator and apply this calibration to the photometric calibrator. The ratio of the apparent integrated flux density of the derived image of the photometric calibrator to its true flux density gives the factor needed to correct the assumed flux density of the astrometric calibrator. Astrometric calibrators are generally physically very small sources, hence variable, but are well modeled by a point at the current resolution. This approach has the advantage that a super accurate structural model of the photometric calibrator is not needed but only an accurate total flux density. The adopted flux density of 3C48 at 40.98 GHz was 0.611 Jy and at 48.6 GHz was 0.506 Jy (Perley & Butler, 2017). The systematic error in the amplitude scale is estimated to be 20%.
3.2 Phase
The phase calibration approach of Reid & Menten (1990, 1997) is to use the phase calibration derived from a self calibration of a strong, simple maser to calibrate the phase of the continuum data. This can work well in the present case of AGB stars which may have very strong, non-thermal masers but very weak thermal emission from the photosphere.
The original scheme of Reid & Menten (1990, 1997) was appropriate for a narrow band system for which a standard group delay calibration was adequate and did not need to be determined from the data-set in question. The continuum bandwidth of the current data is sufficiently wide that corrections to the group delay need to be determined and applied to the data.
The “phase” corrections derived from the self calibration of a maser are largely due to tropospheric refraction, hence are narrow band samples of a group delay function and this needs to be taken into account in transferring the maser calibration to the continuum data which extends for several GHz from the frequency of the maser. Furthermore, the signal from a given maser spot is very narrow band and inadequate to measure the relevant group delay. The calibration method used is similar to that described by Matthews et al. (2015, 2018).
We have adopted the following scheme.
-
1.
System temperature calibration. Amplitude corrections were determined using program SYGain from the on–line calibration measurements.
-
2.
Group delay calibration. The continuum observations of the phase reference sources were used to determine the group delay error (program Calib). These calibrations were transferred to the maser line data and used to calibrate both data sets.
-
3.
Bandpass calibration. The observations of the phase reference sources were used to derive a bandpass response function for each of the line and continuum data for each target star using program BPass.
-
4.
External calibration. The amplitude calibration scheme described in Section 3.1 was used to derive the flux densities of the astrometric calibrators. These were then used to obtain complex gain corrections (program Calib) which were applied to the data.
-
5.
Self calibrate a maser. A strong, simple maser appearing in a few line channels was imaged by SCMap for each target using self calibration. After several cycles of phase only calibration, an amplitude and phase self calibration was done.
-
6.
Transfer phase to continuum data. The time sequences of gain corrections from the maser self calibration were transferred to the continuum data extrapolating phase in frequency using frequency scaling. This is done with program SnCpy.
-
7.
Doppler corrections. Program CVel was used to correct the spectroscopic data for the Earth’s motion.
-
8.
Image. The continuum data were imaged with no further calibration producing a wide-band image using program MFImage. Channels in which maser emission might appear were excluded from the continuum imaging. A spectral cube was imaged (via Imager) from the maser data for each transition using the calibration from the self calibration.
Use of self calibration to set the coordinates of the derived images results in a large uncertainty of the absolute positions. However, the resulting images should have accurate relative positions of both masers and continuum emission with respect to the reference maser.
4 Results
No maser or continuum emission was detected from W Aql but strong masers were detected in Mira and R Aqr and were used to calibrate the continuum. Frequency channels with maser emission are identified from long term, scalar averaged, visibility spectra from individual baselines. The mean channel (0.9 km sec-1 ) visibility amplitude on a given baseline for W Aql is 18 mJy and 5 times this should be easily detectable, a plausible upper limit to a maser peak is 90 mJy. Pimpanuwat et al. (in prep.) report that ALMA observations of the ATOMIUM 111https://fys.kuleuven.be/ster/research-projects/aerosol/atomium/atomium project detected thermal but not maser emissions of several 1.2 mm SiO J=5-4 and J=6-5 transitions in W Aql during June and July 2019.
Many maser features are well separated in velocity and are quite small; centroids can be measured to a small fraction of the resolution. The maser rings can therefore be defined with an accuracy much better than the size of the stellar photosphere. The noise contribution to the position uncertainty of an unresolved, isolated component is where is the full width at half maximum of the resolution and is the signal-to-noise ratio. Since the spatial and frequency resolution of this data is such that masers overlap in space and velocity, a list of “masers” was derived by fitting one or two Gaussians to the image in alternate channels in each of the transitions.
4.1 Mira
The off–source channel noise in the maser cubes is 3.5 and 3.0 mJy beam-1 for =1,J=1-0 and =2,J=1-0 respectively and the CLEAN restoring beams were 51 45 mas at position angle 41∘ and 50 40 mas at position angle -27∘. The integrated spectra of the SiO masers in Mira are shown in Figure 1.
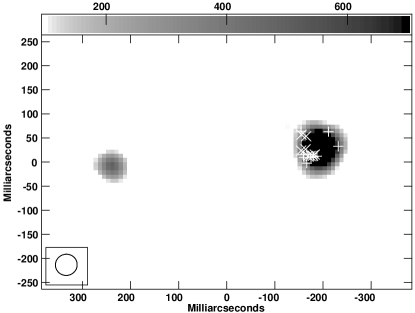
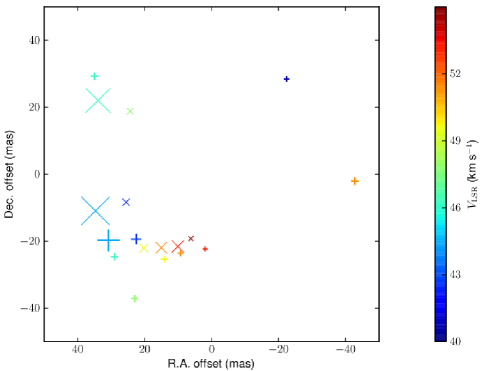
The locations of the masers are plotted on the gray scale of the continuum in Figure 2. The velocities and relative strengths of the masers are shown in Figure 3. The SNR of the masers seen in Figure 1 exceeds 100 so the uncertainty due to noise of the maser locations is less than 0.25 mas, much less than the maser ring size of 60 - 70 mas (Cotton et al., 2004) or the photospheric size of 28.79 mas (Mennesson et al., 2002). The velocity ranges of the masers in the two transitions isn’t the same but this is also the case at several epochs shown in Cotton et al. (2006) and is common in the single dish spectra of Gómez-Garrido et al. (2020). The continuum of the secondary, Mira B, is clearly detected but no SiO was detected except at the location of Mira A. No continuum was detected away from the two stars.
The off-source RMS in the continuum image is 28 Jy beam-1, and the CLEAN restoring beam is 41 39 mas at position angle -79∘. The peak of Mira B is 434 3 mas (53 0.3 AU) from Mira A at an orientation of 95∘ from north through east. The peak flux density of Mira A is 2.7 0.6 mJy. The total flux density of Mira A is 5.0 1.0 mJy with a deconvolved Gaussian size (FWHM) of 39.4 1.5 mas 32.9 1.5 mas at position angle -56.1∘ 4∘.
Mira A being only moderately resolved and its profile, hence area, being not well constrained by the present data, two possible extremes are a uniform disk and a Gaussian. We directly use the factor of 1.6 in (Pearson, 1999) to convert the Gaussian size to an equivalent uniform disk size. We thus get for this extreme possibility a uniform disk diameter of 63.052.6 mas. The brightness temperature of Mira A calculating its area assuming this uniform disk and a total flux density of 5.0 mJy is 1300 270 K. The brightness temperature calculating its area assuming a Gaussian profile with the flux density of 5.0 mJy is 2320 480K. The true brightness temperature is likely between 1300 and 2300 K. Our total flux density was obtained by an intergral over the image pixels and its error is dominated by the 20% estimated uncertainty in the flux density scale. The errors on the Gaussian size include the effects of correlated noise in the image (Condon, 1997). The true uncertainty in the brightness temperature is dominated by the uncertainty in the effective area of the source.
The peak flux density of Mira B is 0.62 0.14 mJy with an integrated value of 0.64 0.14 mJy. This component is at most marginally resolved with an upper limit of 20 mas.

4.2 R Aquarii
The off–source channel noise in the maser cubes is 4.4 and 3.9 mJy beam-1 for =1,J=1-0 and =2,J=1-0 respectively and the CLEAN restoring beams were 59 41 mas at position angle -4∘. The integrated spectra of the SiO masers in R Aqr are shown in Figure 4.
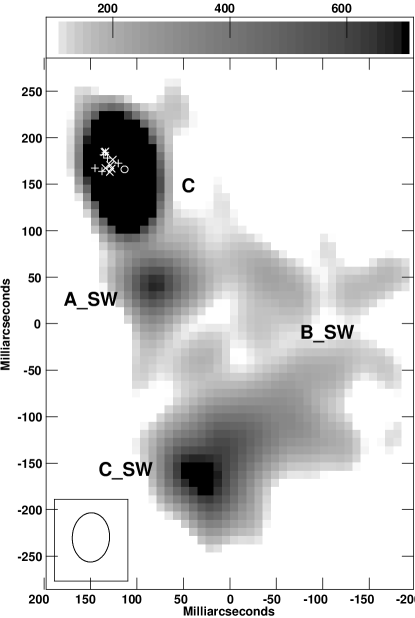
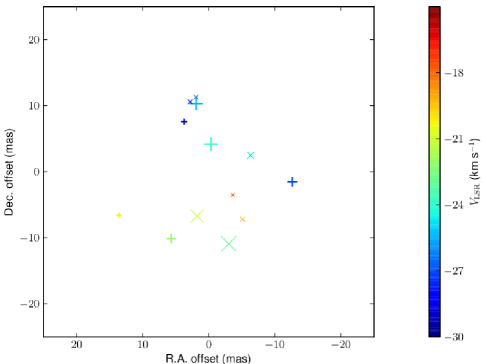
The locations of the masers are plotted on the gray scale image of the continuum in Figure 5. The velocities and relative strengths of the masers are shown in Figure 6. As seen from Figure 4, the SNR of the masers exceed 100 so the uncertainty of the maser locations due to image noise is less than 0.3 mas.
The off–source RMS in the continuum image is 36 Jy beam-1 and the CLEAN restoring beam is 50 36 mas at position angle -1∘. The continuum component in which the masers are imbedded has a peak flux density of 6.1 1.2 mJy and an integrated flux density of 10.8 2.2 mJy and a deconvolved Gaussian size of 58.9 1.6 mas 16.9 1.8 mas at a position angle of 17∘ 1∘. The Gaussian brightness temperature of this component is 6,550 1490 K. For the equivalent uniform disk, the brightness temperature is 3,690 840 K. The integrated flux density of the emission visible in Figure 5 is 40 mJy. No continuum or masers were detected outside of the region shown in Figure 5.

5 Discussion
5.1 Mira
The continuum emission from Mira A is slightly elongated 40∘ from the direction of Mira B. Otherwise there is no hint in the present results of an interaction. While not well defined, the maser ring is basically round. Numerous measurements of the 7 mm SiO masers are available in the literature. The maser rings seen at much higher resolution in Cotton et al. (2004) and Cotton et al. (2006) are even less well defined but also show little hint of an interaction. While there are variations in maser velocity around the ring seen in Figure 3, this is commonly seen in AGB maser rings and shows no obvious effect of the companion. SiO masers tracing the interaction of the AGB star with a close companion was reported in Gru (Homan et al., 2020) although with a closer companion (6 AU) than Mira B is to A.
Reid & Menten (2007) give a uniform disk size for Mira A of 54 4 mas 50 4 mas at position angle -30∘ 50 with a flux density of 4.8 0.2 mJy and a brightness temperature of 1680 250 K in 2000 October. This is somewhat smaller than our uniform disk equivalent of 63.052.6 mas. The Reid & Menten (2007) flux density of 4.8 mJy is in good agreement with our value of 5.0 mJy. Our larger size results in a lower estimated uniform disk brightness temperature, 1300 270 K at 45 GHz; however, this difference is within the errors. The alignment of the SiO maser ring with Mira A in Reid & Menten (2007) generally agrees with that in Figure 2; centered on the photosphere. They do not detect Mira B.
Observations of Mira A in 2014 February by Matthews et al. (2015) give an elliptical Gaussian fit at 46 GHz of 37.5 2.1 31.7 2.0 mas at position angle 147∘ 6∘ in excellent agreement with our 2019 August results. However, the flux density quoted by Matthews et al. (2015), 7.6 1.5 mJy, is 1.5 higher than our 5.0 mJy and their uniform disk brightness temperature of 2110 440 K is correspondingly higher than our 1300 270 K. The difference between the current results and those of Matthews et al. (2015) is 1.5 . Matthews et al. (2018) presents evidence for variations in the sizes and shapes of several other Mira variables so the differences between our results and those of Reid & Menten (2007) and Matthews et al. (2015) may simply reflect changes in Mira A.
The observations of Matthews et al. (2015) detected Mira B and give a deconvolved Gaussian size at 46 GHz of 18 5 1 6 mas at position angle 172∘ 30∘ with a flux density of 0.97 0.2 mJy. This is in good agreement with our upper limit of 20 mas although the star is at most marginally resolved in both cases. Since Mira B is thought to be a white dwarf, any resolution of this object is very unlikely to be of the star itself but more likely an accretion disk around it.
While we detect no emission away from Mira A and B, Wong et al. (2016) show ALMA observations of a plume of molecular gas in an arc from Mira A up to 3” in the direction away from Mira B but do not associate it with an effect by Mira B. They also report that the SiO density drops sharply past 4 stellar radii.
5.2 R Aquarii
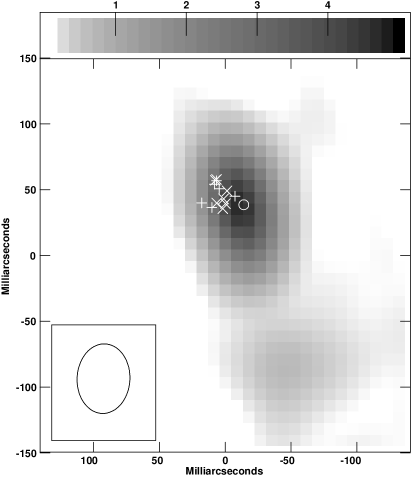
The orbit of the secondary star in R Aqr has been the subject of debate for a number of years. Hollis et al. (1997b) suggest that an extended feature seen in a VLA 7 mm image corresponded to the secondary. However, Schmid et al. (2017) dispute this interpretation and on the basis of high spatial resolution Hα imaging suggest another. A spectroscopic orbit has been determined by Gromadzki & Mikołajewska (2009) who derive an eccentric orbit (=0.25) with a 43.6 year period but cannot determine where on the sky the secondary appears. Detection of the secondary star by Bujarrabal et al. (2018) allowed them to update the orbit of Gromadzki & Mikołajewska (2009) giving an estimate of the location at the epoch of the observations presented here. The region of emission enclosing the stars is shown in Figure 7 with the estimated location of the white dwarf shown as a circle. As for Mira, Figure 6 shows no clear signature of an effect of the secondary on the velocity structure of the ring.
However, ALMA observations by Bujarrabal et al. (2018) show plumes of CO gas which they intreprete as arising from the outflow from the AGB star being focused into its orbital plane by the white dwarf companion maximizing the accretion onto the secondary. They also detect continuum emission between the stars with a spectral index suggesting dust. Such structure would be obscured at 7 mm wavelength in 2019 by the inner jet emission seen in Figure 7.
The continuum emission seen in the ALMA 0.8 mm observations are not expected to be the same as the 7 mm continuum emission as the former is dominated by the photosphere and the dust forming around the star and the latter is from free-free emission from ionized material in the circumstellar envelop.
This system contains a very extended and complex jet to the north–east and south–west which is presumed to arise from the secondary star (Hollis et al., 1997a, b; Schmid et al., 2017). The jet material is quite visible in the Hα images presented in Schmid et al. (2017) which also include the potential secondary. The 7 mm image in Figure 5 is strikingly similar to several of the Hα features south-west of the AGB star shown in Schmid et al. (2017), especially their features C, ASW, BSW and CSW and are approximately indicated in Figure 5. These features in Figure 5, with the partial exception of C, are presumably related to the jet. This correspondance is puzzling given the 5 years between the observations and the very short recombination times of these features estimated by Schmid et al. (2017). This suggests either longer recombination times or a continuing source of ionization.
The continuum feature associated with the SiO masers in Figures 5 and 7 is elongated in the general direction of the jet and is not centered on the maser ring but rather on the companion white dwarf. This suggests that this feature also encloses the secondary and some of its emission is from the jet. The Gaussian brightness temperature of this feature, 6,550 970 K is greatly in excess of that expected for the photosphere of an AGB star further suggesting that much of the emission is from the accretion disk/jet which is nearly aligned on the sky with the AGB star.
The circumstellar masers seen in Figures 5 and 7 show little evidence of being affected by the jet or the secondary star. The VLBI image of the masers in R Aqr shown in Ragland et al. (2008) show masers streaming off in the direction of the north–east jet in 2006 September but those in Cotton et al. (2004, 2006) do not.
The continuum emission see in Figures 5 and 7 is similar in shape and orientation to that reported by Hollis et al. (1997b) from 1996, a half orbital period earlier, but with a different offset from the SiO masers marking the atmosphere of the AGB star. This suggests that in both cases, the emission is dominated by the jet from the accretion disk around the white dwarf and that the image of Hollis et al. (1997b) does show the location of the secondary.
Unfortunately, the poor absolute astrometry resulting from the atmospheric instability in the current data prevent them from being very useful quantitatively in refining the orbit.
The distributions of masers in AGB atmospheres are extremely variable as they track conditions suitable for maser amplification rather than following concentrations of material. Observations several months apart, as shown in the references for VLBI observations usually show very different distributions. The frequent monitoring of the Mira TX Cam (Gonidakis et al., 2013) shows very turbulent behavior.
The nature of the SiO maser distribution in January 2001 from Cotton et al. (2004) was of a very different character than at much later epochs in showing a high degree of symmetry across the ring. In April 2001 the general velocity pattern of the masers was consistent with a general rotation but without much evidence for an equatorial disk. Hollis et al. (2001) claim some evidence for differential rotation in Dec 2000 as well as earlier with a pole of the rotation at a position angle of 150∘. By 2006 (Ragland et al., 2008) the velocity structure was incompatible with the differential rotation of 2000-2001 and the 2019 velocity structure in Figure 6 is also incompatible. The 2000-2001 event may have been a transient feature although the orientation of the apparent pole is difficult to explain by an interaction with either the gravity of, or the jet coming from, the secondary. The jet is closer to the direction of the pole of the putative rotation rather than orthogonal to it and the orbit of Bujarrabal et al. (2018) shows a substantial separation between the two stars in 2001.
6 Conclusions
Observations of 7 mm continuum and SiO masers in three symbotic AGB stars are reported. The continuum data were phase referenced to the masers allowing sensitive imaging and accurate registration. Techniques for photometric calibration and this phase referencing were developed to exploit these data.
No masers were detected in W Aquilae which prevented a sensitive continuum image from being made. Both Mira and R Aquarii have strong masers which allows deep continuum imaging. The image of Mira shows the masers well centered on the photosphere of Mira A and the white dwarf Mira B was well detected. No clear evidence of an interaction between the white dwarf and the envelope of Mira A was found.
The inner portion of the jet in R Aquarii is visible in the continuum image and the radio emission around the AGB star is extended in the direction of the jet. The continuum emission is centered on the location of the white dwarf estimated from the orbit of Bujarrabal et al. (2018) rather than on the AGB star as indicated by the SiO masers. That, plus the high brightness temperature of this feature, indicates that it is dominated by emission from the accretion disk + jets associated with the white dwarf. Bujarrabal et al. (2018) also shows gas apparently flowing from the AGB star onto the secondary. The alignment of the continuum peak of R Aqr with the predicted location from the orbit of the secondary by Bujarrabal et al. (2018) appears to support their orbit.
Acknowledgements.
We thank B. Pimpanuwat/ATOMIUM consortium for the J=5-4 and J=6-5 measurements. This work made use of the AAVSO International Database contributed by observers worldwide.References
- Boboltz et al. (1997) Boboltz, D. A., Diamond, P. J., & Kemball, A. J. 1997, ApJ, 487, L147
- Bujarrabal et al. (2018) Bujarrabal, V., Alcolea, J., Mikołajewska, J., Castro-Carrizo, A., & Ramstedt, S. 2018, A&A, 616, L3
- Condon (1997) Condon, J. J. 1997, PASP, 109, 166
- Cotton (2008) Cotton, W. D. 2008, PASP, 120, 439
- Cotton et al. (2004) Cotton, W. D., Mennesson, B., Diamond, P. J., et al. 2004, A&A, 414, 275
- Cotton et al. (2006) Cotton, W. D., Vlemmings, W., Mennesson, B., et al. 2006, A&A, 456, 339
- Decin et al. (2020) Decin, L., Montargès, M., Richards, A. M. S., et al. 2020, Science, 369, 1497
- Doan et al. (2017) Doan, L., Ramstedt, S., Vlemmings, W. H. T., et al. 2017, A&A, 605, A28
- Gobrecht et al. (2016) Gobrecht, D., Cherchneff, I., Sarangi, A., Plane, J. M. C., & Bromley, S. T. 2016, A&A, 585, A6
- Gómez-Garrido et al. (2020) Gómez-Garrido, M., Bujarrabal, V., Alcolea, J., et al. 2020, A&A, 642, A213
- Gonidakis et al. (2013) Gonidakis, I., Diamond, P. J., & Kemball, A. J. 2013, MNRAS, 433, 3133
- Gray et al. (1998) Gray, M. D., Ivison, R. J., Humphreys, E. M. L., & Yates, J. A. 1998, MNRAS, 295, 970
- Gromadzki & Mikołajewska (2009) Gromadzki, M., & Mikołajewska, J. 2009, A&A, 495, 931
- Haniff et al. (1995) Haniff, C. A., Scholz, M., & Tuthill, P. G. 1995, MNRAS, 276, 640
- Höfner & Freytag (2019) Höfner, S., & Freytag, B. 2019, A&A, 623, A158
- Hollis et al. (2001) Hollis, J. M., Boboltz, D. A., Pedelty, J. A., White, S. M., & Forster, J. R. 2001, ApJ, 559, L37
- Hollis et al. (1997a) Hollis, J. M., Lyon, R. G., Dorband, J. E., & Feibelman, W. A. 1997a, ApJ, 475, 231
- Hollis et al. (1997b) Hollis, J. M., Pedelty, J. A., & Lyon, R. G. 1997b, ApJ, 482, L85
- Homan et al. (2020) Homan, W., Montargès, M., Pimpanuwat, B., et al. 2020, A&A, 644, A61
- Kamiński et al. (2016) Kamiński, T., Wong, K. T., Schmidt, M. R., et al. 2016, A&A, 592, A42
- Karovicova et al. (2013) Karovicova, I., Wittkowski, M., Ohnaka, K., et al. 2013, A&A, 560, A75
- Lèbre et al. (2014) Lèbre, A., Aurière, M., Fabas, N., et al. 2014, A&A, 561, A85
- Maercker et al. (2012) Maercker, M., Mohamed, S., Vlemmings, W. H. T., et al. 2012, Nature, 490, 232
- Matthews et al. (2015) Matthews, L. D., Reid, M. J., & Menten, K. M. 2015, ApJ, 808, 36
- Matthews et al. (2018) Matthews, L. D., Reid, M. J., Menten, K. M., & Akiyama, K. 2018, AJ, 156, 15
- Mennesson et al. (2002) Mennesson, B., Perrin, G., Chagnon, G., et al. 2002, ApJ, 579, 446
- Min et al. (2014) Min, C., Matsumoto, N., Kim, M. K., et al. 2014, PASJ, 66, 38
- Nakashima & Deguchi (2007) Nakashima, J.-i., & Deguchi, S. 2007, ApJ, 669, 446
- Pearson (1999) Pearson, T. J. 1999, in Astronomical Society of the Pacific Conference Series, Vol. 180, Synthesis Imaging in Radio Astronomy II, ed. G. B. Taylor, C. L. Carilli, & R. A. Perley, 335
- Perley & Butler (2017) Perley, R. A., & Butler, B. J. 2017, ApJS, 230, 7
- Perrin et al. (2020) Perrin, G., Ridgway, S. T., Lacour, S., et al. 2020, A&A, 642, A82
- Ragland et al. (2008) Ragland, S., Le Coroller, H., Pluzhnik, E., et al. 2008, ApJ, 679, 746
- Ramstedt et al. (2018) Ramstedt, S., Mohamed, S., Olander, T., et al. 2018, A&A, 616, A61
- Ramstedt et al. (2012) Ramstedt, S., Vlemmings, W., Mohamed, S., Choi, Y. K., & Olofsson, H. 2012, in Cosmic Masers - from OH to H0, ed. R. S. Booth, W. H. T. Vlemmings, & E. M. L. Humphreys, Vol. 287, 260–261
- Ramstedt et al. (2014) Ramstedt, S., Mohamed, S., Vlemmings, W. H. T., et al. 2014, A&A, 570, L14
- Ramstedt et al. (2017) —. 2017, A&A, 605, A126
- Reid & Menten (1990) Reid, M. J., & Menten, K. M. 1990, ApJ, 370, L51
- Reid & Menten (1997) —. 1997, ApJ, 476, 327
- Reid & Menten (2007) —. 2007, ApJ, 671, 2068
- Schmid et al. (2017) Schmid, H. M., Bazzon, A., Milli, J., et al. 2017, A&A, 602, A53
- Tuthill et al. (2000) Tuthill, P. G., Danchi, W. C., Hale, D. S., Monnier, J. D., & Townes, C. H. 2000, ApJ, 534, 907
- van Leeuwen (2007) van Leeuwen, F. 2007, A&A, 474, 653
- Vlemmings et al. (2017) Vlemmings, W., Khouri, T., O’Gorman, E., et al. 2017, Nature Astronomy, 1, 848
- Vlemmings (2018) Vlemmings, W. H. T. 2018, Contributions of the Astronomical Observatory Skalnate Pleso, 48, 187
- Vlemmings et al. (2015) Vlemmings, W. H. T., Ramstedt, S., O’Gorman, E., et al. 2015, A&A, 577, L4
- Wittkowski et al. (2016) Wittkowski, M., Chiavassa, A., Freytag, B., et al. 2016, A&A, 587, A12
- Wong et al. (2016) Wong, K. T., Kamiński, T., Menten, K. M., & Wyrowski, F. 2016, A&A, 590, A127