Seasonal Variations of the Unfolded Atmospheric Neutrino Spectrum with IceCube
Abstract
The IceCube Neutrino Observatory is a detector array at the South Pole with the central aim of studying astrophysical neutrinos. However, the majority of the detected neutrinos originates from cosmic ray interactions in the atmosphere. The rate of these atmospheric neutrinos shows a seasonal variation indicating that the rate changes with the temperature in the stratosphere. These seasonal changes of the atmospheric neutrino energy spectrum will be investigated using the Dortmund Spectrum Estimation Algorithm (DSEA). Based on results obtained from 10% of IceCube’s atmospheric muon neutrino data, taken between 2011 and 2018, the differences of the measured fluxes during the Austral summer and winter will be discussed.
Corresponding authors:
Karolin Hymon1∗, Tim Ruhe1
1 Department of Physics, TU Dortmund University, 44221 Dortmund, Germany
∗ Presenter
1 Introduction
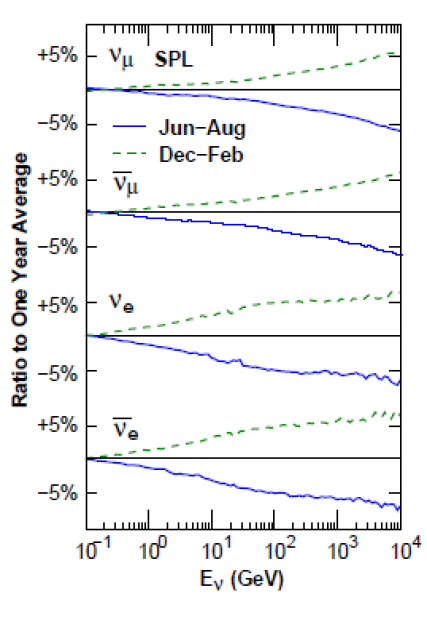
The atmospheric neutrino spectrum imposes, additionally to cosmic air shower physics, the main background in the measurement of astrophysical neutrinos. Since the observed rate of atmospheric neutrinos correlates with the atmospheric temperature [1, 2, 3], a seasonal variation of the energy spectrum is expected to occur at energies above approximately [4]. In this contribution, we present an analysis of the atmospheric muon neutrino spectrum using unfolding techniques to investigate the detection of seasonal variations from 8 years of IceCube data.
IceCube is a cubic-kilometer neutrino detector installed in the ice at the geographic South Pole between depths of and , completed in 2010. Reconstruction of the direction, energy and flavor of the neutrinos relies on the optical detection of Cherenkov radiation emitted by charged particles produced in the interactions of neutrinos in the surrounding ice or the nearby bedrock [5].
The majority of the detected neutrinos originates from meson decays in the muonic component of cosmic ray air showers. Whether these mesons decay directly into muons and neutrinos, or produce secondary mesons, depends on the local air density of the atmosphere [2]. The resulting muon neutrino () and anti-neutrino () flux is given by the integration of the neutrino production yield over the slant depth ,
| (1) |
with the primary cosmic ray flux of nucleon N at neutrino energy [6]; the quantity accounts for decay branching ratios, for the cross sections; the denominator characterizes the competition between kaon and pion decays and the production of secondary mesons.
The latter process is favored at critical energies above at the zenith angle of neutrino production . In this scenario the neutrino spectrum follows a steep power law with a spectral index of approximately [2]. Since the critical energy at a given atmospheric depth is anti-proportional to the air density, it is affected by temperature changes [6]. Hence, the temperature becomes linearly correlated to the critical energy assuming the atmospheric isothermal approximation of the ideal gas law. The critical energies for kaons and pions are and [6].
2 Spectrum Unfolding
The reconstruction of the neutrino energy spectrum relies on the indirect measurement of neutrino-induced muons by the charged-current interaction inside the ice or the bedrock [8]. However, these muons are exposed to stochastic energy losses during their propagation through the detector [9] and in addition, the energy reconstruction is smeared by the limited detector resolution [8]. The neutrino energy spectrum has to be inferred from the reconstructed muon energy. This technique is denoted as an inverse problem in unfolding, which is commonly defined by the Fredholm integral equation of the first kind [10]. In practice, an adequate algorithm is required to solve for the discrete problem set,
| (2) |
where the spectral energy distribution of the neutrinos has to be estimated from energy-dependent detector observables . The response matrix accounts for propagation and detection effects and displays the smearing of the energy estimation.
In this analysis, the neutrino energy spectrum is determined by the Dortmund Spectrum Estimation Algorithm (DSEA) [11, 12, 13, 14]. The inverse problem is treated as a multinomial classification task that is solved by an arbitrary supervised machine learning classifier. The classifier’s predictions are accumulated for each pre-defined energy bin and the estimate is then updated iteratively to overcome potential biases. Supplementary regularization methods within DSEA allow a scaling of the current estimate and thus accelerate the convergence behavior.
The internal regularization parameters, the classifier selection and its internal settings are investigated in a tenfold cross-validation approach using simulated events from the IceCube neutrino-generator (NuGen) [15]. These events are generated with the assumption of an power-law neutrino flux and are weighted to the atmospheric neutrino flux model Honda2006 [16] to compensate for an over-representation of high energy events in the simulation sample. The optimization procedure yields the most accurate spectrum approximation measured by the Wasserstein Distance [17] with a default random forest classifier [18] in combination with exponential step-size decay regularization in seven iterations of DSEA.
2.1 Analysis Scheme
The seasonal spectra are obtained in ten logarithmic energy bins between and . Over- and underflow bins account for events outside of the respective interval. Multiple combinations of energy-dependent quantities are investigated in terms of acceptable coverage and minimal bias in trials of DSEA. The final selection consists of the number of hit DOMs, the number of direct hits, and the truncated neutrino energy: the number of direct hits is defined assuming unscattered photons which arrive within a time residual from to ; the truncated energy is derived from the muon energy loss [9, 19].
To account for statistical fluctuations in the unfolding, the spectral distributions are bootstrapped [20, 21]. Each data set is sampled by replacement and deconvolved with optimized DSEA. The final event spectra are determined by the average over 2000 deconvolutions, so that the standard deviation approximates the statistical uncertainty of the unfolding. Correcting for the effective detection area, livetime, and solid angle, the event spectra are transformed into a differential neutrino flux [8].
2.2 Event Selection
To study the seasonal effects on the atmospheric neutrino flux, the diffuse upgoing event sample which contains upward moving muons, as described in Ref. [22], is divided into separate seasons. The analysis is developed using 10% of the data taken between January 2011 and December 2018. Only events from the Southern Hemisphere in the zenith range from are selected, excluding tropical latitudes between . This results in a total of events within 278 days of livetime, corresponding to approx. events per month.
2.3 Systematic Uncertainties
Since DSEA is trained on simulated events, the unfolded energy spectra are affected by systematic uncertainties in the detector simulation. The impact of these effects is estimated from simulations with varied parameters, similar to the approaches presented in [8, 23]. These generated events are treated as pseudo-data and are sampled according to the atmospheric neutrino flux model Honda2006 [16]. The ratio of the unfolded spectrum to the reference unfolding with the default systematic parameters is the systematic uncertainty of the parameter variation. Each uncertainty is combined in the squared sum for positive and negative deviations to the reference result and the total systematic uncertainty is given by,
| (3) |
with the uncertainty caused by the efficiency of the optical modules , the absorption and scattering coefficients of the ice model and , and the atmospheric neutrino flux model .
Monte Carlo simulations from the same NuGen sample are used for the first three systematic parameters. The DOM efficiency was scaled by [5]. Propagation effects of photons in the ice are described by absorption and scattering coefficients. The simulated events are obtained from the SpiceLea ice model, which accounts for the depth-dependence of both coefficients [24] and anisotropies in the -plane of the detection volume [25]. The dependence of both coefficients on one another are taken into account by a joint reduction of as a lower bound for absorption and scattering. The upper bound is then determined for each parameter individually, increasing each by . The uncertainties induced by the ice model coefficients can be combined by Eq. (3) into a total uncertainty of photon propagation effects.
Since the simulated events are weighted to a flux model for the algorithm optimization and determination of the systematic uncertainties, the flux model imposes an additional uncertainty on the unfolded spectra. To estimate the impact of flux model uncertainties on the unfolded spectrum, the reference simulation is weighted according to the lower and upper flux limits. As illustrated in Ref. [16], the flux uncertainty scales linearly from to assuming an uncertainty of at and at . The uncertainty remains approximately constant at energies between .
To obtain an absolute measurement of seasonal neutrino fluxes, other sources of systematic uncertainties, such as assumptions about the primary cosmic ray spectrum, would have to be considered. However, since the central aim is to determine the seasonal variations with respect to the annual mean of the neutrino flux, the model independence of deconvolution is exploited and the variations are measured relatively to the annual mean. Assuming that the investigated detector systematics remain constant throughout the year, merely the propagation of statistical uncertainties impacts the flux deviation to the yearly average.
3 Results
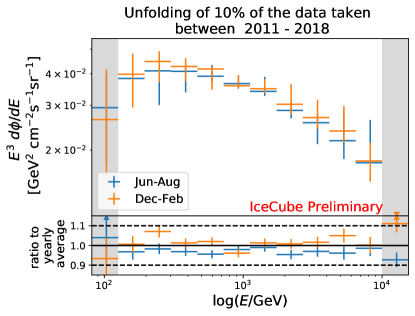
The unfolded energy spectra for Austral summer and winter are displayed in Fig. 2(a). Both spectra agree within the uncertainties. Comparing the seasonal fluxes to the annual mean, a tendency towards an increased flux for the period from December to February is observable. The flux for the period from June to August remains smaller accordingly. A deviation around might be due to artifacts in the training sample. This was investigated in deconvolutions of monthly data sets.
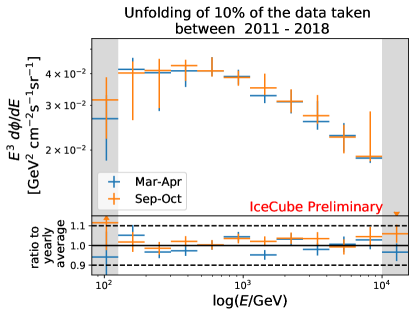
The unfolded spectra for the Austral spring and autumn are displayed in Fig. 2(b) as a test of the unfolding method. Since both seasons should have similar temperature profiles, both spectra are expected to be in agreement. The data sets are constructed from events within two months from March to April and September to October to provide a clear demarcation between seasons. The seasonal energy spectra agree within the uncertainties and with the annual mean unfolded neutrino flux.
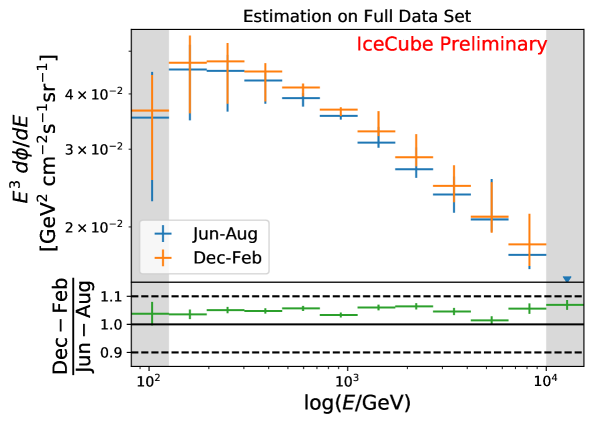
After the discussion of the unfolded spectra obtained from 10% of the data taken from 2011 to 2018, the detection potential of seasonal variations using the complete data set is investigated on Monte Carlo simulations. For this, the simulated neutrino events are sampled according to the seasonal flux model presented in Ref. [4]. The number of events and the livetime of both pseudo-data sets were increased by a factor of ten. The deconvolved spectra are denoted in Fig. 3 with the associated uncertainties. Compared to the tests on 10% of the data taken between 2011 and 2018, the uncertainties decrease significantly and the relationship of the seasonal neutrino fluxes to each other can be clearly observed below. This estimation yields a deviation of approx. 2% to 8% between the Austral summer and winter.
4 Conclusion and Outlook
The presented analysis holds a great potential for detecting seasonal variations of the atmospheric neutrino energy spectrum with IceCube data. Initial tendencies towards an increased flux in the Austral summer are evident on 10% of the present atmospheric muon neutrino data set including events from 2011 to 2018. Due to the relative comparison of seasonal energy spectra, the analysis becomes independent of systematic uncertainties in the detector simulation and other model assumptions. An extension by a factor of ten to the entire data set would decrease the statistical uncertainty by the square root of ten, making seasonal variations to the unfolded annual mean flux more apparent. The sample can be extended to 9 years of data, further decreasing the statistical uncertainty, in particular at higher energies in the -regime.
Further improvements of this analysis are in progress. The significance of the of the measured variations will be determined on 10% of the recorded data. The hypothesis of observing no seasonal variations with respect to the annual mean will be investigated for each energy bin and season. Using the full 9-year data sample will potentially allow measurements of the monthly neutrino spectra with sufficient statistics for the first time.
References
- [1] IceCube Collaboration PoS ICRC2011 (2012) 662.
- [2] IceCube Collaboration PoS ICRC2013 (2014) 0492.
- [3] IceCube Collaboration PoS ICRC2019 (2020) 465.
- [4] M. Honda, M. Sajjad Athar, T. Kajita, K. Kasahara, and S. Midorikawa Phys. Rev. D 92 (2015) 023004.
- [5] IceCube Collaboration, M. G. Aartsen et al. JINST 12 no. 03, (2017) P03012.
- [6] T. K. Gaisser, Cosmic rays and particle physics. Cambridge University Press, 1990.
- [7] J. Picone, A. Hedin, D. Drob, and A. Aikin Journal of Geophysical Research 107 (12, 2002) .
- [8] IceCube Collaboration, M. G. Aartsen et al. Eur. Phys. J. C 75 no. 3, (2015) 116.
- [9] IceCube Collaboration, R. Abbasi et al. Nucl. Instrum. Meth. A 703 (2013) 190–198.
- [10] I. Fredholm Acta Math. 27 (1903) 365.
- [11] M. Bunse https://sfb876.tu-dortmund.de/deconvolution/index.html .
- [12] T. Ruhe, M. Schmitz, T. Voigt, and M. Wornowizki PoS ICRC2013 (2014) 3354.
- [13] T. Ruhe, T. Voigt, M. Wornowizki, M. Börner, W. Rhode, and K. Morik Astronomical Data Analysis Software and Systems XXVI 521 (2019) .
- [14] L. Kardum PoS ICRC2021 (these proceedings) xyz.
- [15] A. Gazizov and M. P. Kowalski Comput. Phys. Commun. 172 (2005) 203.
- [16] M. Honda, T. Kajita, K. Kasahara, S. Midorikawa, and T. Sanuki Phys. Rev. D 75 (2007) 043006.
- [17] A. Ramdas, N. Garcia, and M. Cuturi Entropy 19 (2015) .
- [18] F. Pedregosa, G. Varoquaux, A. Gramfort, V. Michel, B. Thirion, O. Grisel, M. Blondel, P. Prettenhofer, R. Weiss, V. Dubourg, J. Vanderplas, A. Passos, D. Cournapeau, M. Brucher, M. Perrot, and E. Duchesnay Journal of Machine Learning Research 12 (2011) 2825–2830.
- [19] AMANDA Collaboration, J. Ahrens et al. Phys. Rev. D 66 (2002) 012005.
- [20] T. Hastie, J. Friedman, and R. Tibshirani, The Elements of Statistical Learning: Data Mining, Inference, and Prediction. Springer Publishing Company, Incorporated, 2017.
- [21] IceCube Collaboration, M. G. Aartsen et al. Eur. Phys. J. C 77 no. 10, (2017) 692.
- [22] IceCube Collaboration, M. G. Aartsen et al. ApJ 833 (2016) 3.
- [23] ANTARES Collaboration, A. Albert et al. Phys. Lett. B 816 (2021) 136228.
- [24] IceCube Collaboration, M. Aartsen et al. Nucl. Instrum. Meth. A 711 (2013) 73–89.
- [25] IceCube Collaboration PoS ICRC2013 (2014) 0580.
Full Author List: IceCube Collaboration
R. Abbasi17,
M. Ackermann59,
J. Adams18,
J. A. Aguilar12,
M. Ahlers22,
M. Ahrens50,
C. Alispach28,
A. A. Alves Jr.31,
N. M. Amin42,
R. An14,
K. Andeen40,
T. Anderson56,
G. Anton26,
C. Argüelles14,
Y. Ashida38,
S. Axani15,
X. Bai46,
A. Balagopal V.38,
A. Barbano28,
S. W. Barwick30,
B. Bastian59,
V. Basu38,
S. Baur12,
R. Bay8,
J. J. Beatty20, 21,
K.-H. Becker58,
J. Becker Tjus11,
C. Bellenghi27,
S. BenZvi48,
D. Berley19,
E. Bernardini59, 60,
D. Z. Besson34, 61,
G. Binder8, 9,
D. Bindig58,
E. Blaufuss19,
S. Blot59,
M. Boddenberg1,
F. Bontempo31,
J. Borowka1,
S. Böser39,
O. Botner57,
J. Böttcher1,
E. Bourbeau22,
F. Bradascio59,
J. Braun38,
S. Bron28,
J. Brostean-Kaiser59,
S. Browne32,
A. Burgman57,
R. T. Burley2,
R. S. Busse41,
M. A. Campana45,
E. G. Carnie-Bronca2,
C. Chen6,
D. Chirkin38,
K. Choi52,
B. A. Clark24,
K. Clark33,
L. Classen41,
A. Coleman42,
G. H. Collin15,
J. M. Conrad15,
P. Coppin13,
P. Correa13,
D. F. Cowen55, 56,
R. Cross48,
C. Dappen1,
P. Dave6,
C. De Clercq13,
J. J. DeLaunay56,
H. Dembinski42,
K. Deoskar50,
S. De Ridder29,
A. Desai38,
P. Desiati38,
K. D. de Vries13,
G. de Wasseige13,
M. de With10,
T. DeYoung24,
S. Dharani1,
A. Diaz15,
J. C. Díaz-Vélez38,
M. Dittmer41,
H. Dujmovic31,
M. Dunkman56,
M. A. DuVernois38,
E. Dvorak46,
T. Ehrhardt39,
P. Eller27,
R. Engel31, 32,
H. Erpenbeck1,
J. Evans19,
P. A. Evenson42,
K. L. Fan19,
A. R. Fazely7,
S. Fiedlschuster26,
A. T. Fienberg56,
K. Filimonov8,
C. Finley50,
L. Fischer59,
D. Fox55,
A. Franckowiak11, 59,
E. Friedman19,
A. Fritz39,
P. Fürst1,
T. K. Gaisser42,
J. Gallagher37,
E. Ganster1,
A. Garcia14,
S. Garrappa59,
L. Gerhardt9,
A. Ghadimi54,
C. Glaser57,
T. Glauch27,
T. Glüsenkamp26,
A. Goldschmidt9,
J. G. Gonzalez42,
S. Goswami54,
D. Grant24,
T. Grégoire56,
S. Griswold48,
M. Gündüz11,
C. Günther1,
C. Haack27,
A. Hallgren57,
R. Halliday24,
L. Halve1,
F. Halzen38,
M. Ha Minh27,
K. Hanson38,
J. Hardin38,
A. A. Harnisch24,
A. Haungs31,
S. Hauser1,
D. Hebecker10,
K. Helbing58,
F. Henningsen27,
E. C. Hettinger24,
S. Hickford58,
J. Hignight25,
C. Hill16,
G. C. Hill2,
K. D. Hoffman19,
R. Hoffmann58,
T. Hoinka23,
B. Hokanson-Fasig38,
K. Hoshina38, 62,
F. Huang56,
M. Huber27,
T. Huber31,
K. Hultqvist50,
M. Hünnefeld23,
R. Hussain38,
S. In52,
N. Iovine12,
A. Ishihara16,
M. Jansson50,
G. S. Japaridze5,
M. Jeong52,
B. J. P. Jones4,
D. Kang31,
W. Kang52,
X. Kang45,
A. Kappes41,
D. Kappesser39,
T. Karg59,
M. Karl27,
A. Karle38,
U. Katz26,
M. Kauer38,
M. Kellermann1,
J. L. Kelley38,
A. Kheirandish56,
K. Kin16,
T. Kintscher59,
J. Kiryluk51,
S. R. Klein8, 9,
R. Koirala42,
H. Kolanoski10,
T. Kontrimas27,
L. Köpke39,
C. Kopper24,
S. Kopper54,
D. J. Koskinen22,
P. Koundal31,
M. Kovacevich45,
M. Kowalski10, 59,
T. Kozynets22,
E. Kun11,
N. Kurahashi45,
N. Lad59,
C. Lagunas Gualda59,
J. L. Lanfranchi56,
M. J. Larson19,
F. Lauber58,
J. P. Lazar14, 38,
J. W. Lee52,
K. Leonard38,
A. Leszczyńska32,
Y. Li56,
M. Lincetto11,
Q. R. Liu38,
M. Liubarska25,
E. Lohfink39,
C. J. Lozano Mariscal41,
L. Lu38,
F. Lucarelli28,
A. Ludwig24, 35,
W. Luszczak38,
Y. Lyu8, 9,
W. Y. Ma59,
J. Madsen38,
K. B. M. Mahn24,
Y. Makino38,
S. Mancina38,
I. C. Mariş12,
R. Maruyama43,
K. Mase16,
T. McElroy25,
F. McNally36,
J. V. Mead22,
K. Meagher38,
A. Medina21,
M. Meier16,
S. Meighen-Berger27,
J. Micallef24,
D. Mockler12,
T. Montaruli28,
R. W. Moore25,
R. Morse38,
M. Moulai15,
R. Naab59,
R. Nagai16,
U. Naumann58,
J. Necker59,
L. V. Nguyễn24,
H. Niederhausen27,
M. U. Nisa24,
S. C. Nowicki24,
D. R. Nygren9,
A. Obertacke Pollmann58,
M. Oehler31,
A. Olivas19,
E. O’Sullivan57,
H. Pandya42,
D. V. Pankova56,
N. Park33,
G. K. Parker4,
E. N. Paudel42,
L. Paul40,
C. Pérez de los Heros57,
L. Peters1,
J. Peterson38,
S. Philippen1,
D. Pieloth23,
S. Pieper58,
M. Pittermann32,
A. Pizzuto38,
M. Plum40,
Y. Popovych39,
A. Porcelli29,
M. Prado Rodriguez38,
P. B. Price8,
B. Pries24,
G. T. Przybylski9,
C. Raab12,
A. Raissi18,
M. Rameez22,
K. Rawlins3,
I. C. Rea27,
A. Rehman42,
P. Reichherzer11,
R. Reimann1,
G. Renzi12,
E. Resconi27,
S. Reusch59,
W. Rhode23,
M. Richman45,
B. Riedel38,
E. J. Roberts2,
S. Robertson8, 9,
G. Roellinghoff52,
M. Rongen39,
C. Rott49, 52,
T. Ruhe23,
D. Ryckbosch29,
D. Rysewyk Cantu24,
I. Safa14, 38,
J. Saffer32,
S. E. Sanchez Herrera24,
A. Sandrock23,
J. Sandroos39,
M. Santander54,
S. Sarkar44,
S. Sarkar25,
K. Satalecka59,
M. Scharf1,
M. Schaufel1,
H. Schieler31,
S. Schindler26,
P. Schlunder23,
T. Schmidt19,
A. Schneider38,
J. Schneider26,
F. G. Schröder31, 42,
L. Schumacher27,
G. Schwefer1,
S. Sclafani45,
D. Seckel42,
S. Seunarine47,
A. Sharma57,
S. Shefali32,
M. Silva38,
B. Skrzypek14,
B. Smithers4,
R. Snihur38,
J. Soedingrekso23,
D. Soldin42,
C. Spannfellner27,
G. M. Spiczak47,
C. Spiering59, 61,
J. Stachurska59,
M. Stamatikos21,
T. Stanev42,
R. Stein59,
J. Stettner1,
A. Steuer39,
T. Stezelberger9,
T. Stürwald58,
T. Stuttard22,
G. W. Sullivan19,
I. Taboada6,
F. Tenholt11,
S. Ter-Antonyan7,
S. Tilav42,
F. Tischbein1,
K. Tollefson24,
L. Tomankova11,
C. Tönnis53,
S. Toscano12,
D. Tosi38,
A. Trettin59,
M. Tselengidou26,
C. F. Tung6,
A. Turcati27,
R. Turcotte31,
C. F. Turley56,
J. P. Twagirayezu24,
B. Ty38,
M. A. Unland Elorrieta41,
N. Valtonen-Mattila57,
J. Vandenbroucke38,
N. van Eijndhoven13,
D. Vannerom15,
J. van Santen59,
S. Verpoest29,
M. Vraeghe29,
C. Walck50,
T. B. Watson4,
C. Weaver24,
P. Weigel15,
A. Weindl31,
M. J. Weiss56,
J. Weldert39,
C. Wendt38,
J. Werthebach23,
M. Weyrauch32,
N. Whitehorn24, 35,
C. H. Wiebusch1,
D. R. Williams54,
M. Wolf27,
K. Woschnagg8,
G. Wrede26,
J. Wulff11,
X. W. Xu7,
Y. Xu51,
J. P. Yanez25,
S. Yoshida16,
S. Yu24,
T. Yuan38,
Z. Zhang51
1 III. Physikalisches Institut, RWTH Aachen University, D-52056 Aachen, Germany
2 Department of Physics, University of Adelaide, Adelaide, 5005, Australia
3 Dept. of Physics and Astronomy, University of Alaska Anchorage, 3211 Providence Dr., Anchorage, AK 99508, USA
4 Dept. of Physics, University of Texas at Arlington, 502 Yates St., Science Hall Rm 108, Box 19059, Arlington, TX 76019, USA
5 CTSPS, Clark-Atlanta University, Atlanta, GA 30314, USA
6 School of Physics and Center for Relativistic Astrophysics, Georgia Institute of Technology, Atlanta, GA 30332, USA
7 Dept. of Physics, Southern University, Baton Rouge, LA 70813, USA
8 Dept. of Physics, University of California, Berkeley, CA 94720, USA
9 Lawrence Berkeley National Laboratory, Berkeley, CA 94720, USA
10 Institut für Physik, Humboldt-Universität zu Berlin, D-12489 Berlin, Germany
11 Fakultät für Physik & Astronomie, Ruhr-Universität Bochum, D-44780 Bochum, Germany
12 Université Libre de Bruxelles, Science Faculty CP230, B-1050 Brussels, Belgium
13 Vrije Universiteit Brussel (VUB), Dienst ELEM, B-1050 Brussels, Belgium
14 Department of Physics and Laboratory for Particle Physics and Cosmology, Harvard University, Cambridge, MA 02138, USA
15 Dept. of Physics, Massachusetts Institute of Technology, Cambridge, MA 02139, USA
16 Dept. of Physics and Institute for Global Prominent Research, Chiba University, Chiba 263-8522, Japan
17 Department of Physics, Loyola University Chicago, Chicago, IL 60660, USA
18 Dept. of Physics and Astronomy, University of Canterbury, Private Bag 4800, Christchurch, New Zealand
19 Dept. of Physics, University of Maryland, College Park, MD 20742, USA
20 Dept. of Astronomy, Ohio State University, Columbus, OH 43210, USA
21 Dept. of Physics and Center for Cosmology and Astro-Particle Physics, Ohio State University, Columbus, OH 43210, USA
22 Niels Bohr Institute, University of Copenhagen, DK-2100 Copenhagen, Denmark
23 Dept. of Physics, TU Dortmund University, D-44221 Dortmund, Germany
24 Dept. of Physics and Astronomy, Michigan State University, East Lansing, MI 48824, USA
25 Dept. of Physics, University of Alberta, Edmonton, Alberta, Canada T6G 2E1
26 Erlangen Centre for Astroparticle Physics, Friedrich-Alexander-Universität Erlangen-Nürnberg, D-91058 Erlangen, Germany
27 Physik-department, Technische Universität München, D-85748 Garching, Germany
28 Département de physique nucléaire et corpusculaire, Université de Genève, CH-1211 Genève, Switzerland
29 Dept. of Physics and Astronomy, University of Gent, B-9000 Gent, Belgium
30 Dept. of Physics and Astronomy, University of California, Irvine, CA 92697, USA
31 Karlsruhe Institute of Technology, Institute for Astroparticle Physics, D-76021 Karlsruhe, Germany
32 Karlsruhe Institute of Technology, Institute of Experimental Particle Physics, D-76021 Karlsruhe, Germany
33 Dept. of Physics, Engineering Physics, and Astronomy, Queen’s University, Kingston, ON K7L 3N6, Canada
34 Dept. of Physics and Astronomy, University of Kansas, Lawrence, KS 66045, USA
35 Department of Physics and Astronomy, UCLA, Los Angeles, CA 90095, USA
36 Department of Physics, Mercer University, Macon, GA 31207-0001, USA
37 Dept. of Astronomy, University of Wisconsin–Madison, Madison, WI 53706, USA
38 Dept. of Physics and Wisconsin IceCube Particle Astrophysics Center, University of Wisconsin–Madison, Madison, WI 53706, USA
39 Institute of Physics, University of Mainz, Staudinger Weg 7, D-55099 Mainz, Germany
40 Department of Physics, Marquette University, Milwaukee, WI, 53201, USA
41 Institut für Kernphysik, Westfälische Wilhelms-Universität Münster, D-48149 Münster, Germany
42 Bartol Research Institute and Dept. of Physics and Astronomy, University of Delaware, Newark, DE 19716, USA
43 Dept. of Physics, Yale University, New Haven, CT 06520, USA
44 Dept. of Physics, University of Oxford, Parks Road, Oxford OX1 3PU, UK
45 Dept. of Physics, Drexel University, 3141 Chestnut Street, Philadelphia, PA 19104, USA
46 Physics Department, South Dakota School of Mines and Technology, Rapid City, SD 57701, USA
47 Dept. of Physics, University of Wisconsin, River Falls, WI 54022, USA
48 Dept. of Physics and Astronomy, University of Rochester, Rochester, NY 14627, USA
49 Department of Physics and Astronomy, University of Utah, Salt Lake City, UT 84112, USA
50 Oskar Klein Centre and Dept. of Physics, Stockholm University, SE-10691 Stockholm, Sweden
51 Dept. of Physics and Astronomy, Stony Brook University, Stony Brook, NY 11794-3800, USA
52 Dept. of Physics, Sungkyunkwan University, Suwon 16419, Korea
53 Institute of Basic Science, Sungkyunkwan University, Suwon 16419, Korea
54 Dept. of Physics and Astronomy, University of Alabama, Tuscaloosa, AL 35487, USA
55 Dept. of Astronomy and Astrophysics, Pennsylvania State University, University Park, PA 16802, USA
56 Dept. of Physics, Pennsylvania State University, University Park, PA 16802, USA
57 Dept. of Physics and Astronomy, Uppsala University, Box 516, S-75120 Uppsala, Sweden
58 Dept. of Physics, University of Wuppertal, D-42119 Wuppertal, Germany
59 DESY, D-15738 Zeuthen, Germany
60 Università di Padova, I-35131 Padova, Italy
61 National Research Nuclear University, Moscow Engineering Physics Institute (MEPhI), Moscow 115409, Russia
62 Earthquake Research Institute, University of Tokyo, Bunkyo, Tokyo 113-0032, Japan
Acknowledgements
USA – U.S. National Science Foundation-Office of Polar Programs, U.S. National Science Foundation-Physics Division, U.S. National Science Foundation-EPSCoR, Wisconsin Alumni Research Foundation, Center for High Throughput Computing (CHTC) at the University of Wisconsin–Madison, Open Science Grid (OSG), Extreme Science and Engineering Discovery Environment (XSEDE), Frontera computing project at the Texas Advanced Computing Center, U.S. Department of Energy-National Energy Research Scientific Computing Center, Particle astrophysics research computing center at the University of Maryland, Institute for Cyber-Enabled Research at Michigan State University, and Astroparticle physics computational facility at Marquette University; Belgium – Funds for Scientific Research (FRS-FNRS and FWO), FWO Odysseus and Big Science programmes, and Belgian Federal Science Policy Office (Belspo); Germany – Bundesministerium für Bildung und Forschung (BMBF), Deutsche Forschungsgemeinschaft (DFG), Helmholtz Alliance for Astroparticle Physics (HAP), Initiative and Networking Fund of the Helmholtz Association, Deutsches Elektronen Synchrotron (DESY), and High Performance Computing cluster of the RWTH Aachen; Sweden – Swedish Research Council, Swedish Polar Research Secretariat, Swedish National Infrastructure for Computing (SNIC), and Knut and Alice Wallenberg Foundation; Australia – Australian Research Council; Canada – Natural Sciences and Engineering Research Council of Canada, Calcul Québec, Compute Ontario, Canada Foundation for Innovation, WestGrid, and Compute Canada; Denmark – Villum Fonden and Carlsberg Foundation; New Zealand – Marsden Fund; Japan – Japan Society for Promotion of Science (JSPS) and Institute for Global Prominent Research (IGPR) of Chiba University; Korea – National Research Foundation of Korea (NRF); Switzerland – Swiss National Science Foundation (SNSF); United Kingdom – Department of Physics, University of Oxford.