The bluest changing-look QSO SDSS J224113-012108
Abstract
In this manuscript, we report a new changing-look QSO (CLQSO) SDSS J2241 at . Based on the multi-epoch SDSS spectra from 2011 to 2017, the flux ratio of broad H to broad H has been changed from 7 in 2011 to 2.7 in 2017, leading SDSS J2241 with spectral index (Å) in 2017 to be so-far the bluest CLQSO. Based on the SDSS spectrum in 2011, the host galaxy contributions with stellar velocity dispersion can be well determined, leading to the M-sigma relation expected central BH mass . However, through properties of the broad H, the virial BH mass is , about two magnitudes larger than the mass through the M-sigma relation. The different BH masses through different methods indicate SDSS J2241 is one unique CLQSO. Meanwhile, the long-term photometric light curve shows interesting variability properties, not expected by DRW process commonly applied in AGN but probably connected to a central TDE. Furthermore, based on continuum emission properties in 2017 with no dust obscurations, only considering the moving dust clouds cannot be preferred to explain the CLQSO SDSS J2241, because the expected intrinsic reddening corrected continuum emissions were unreasonably higher than the unobscured continuum emissions in 2017.
1 Introduction
Changing-look active galactic nuclei (CLAGN) have been studied for more than four decades, since the first CLAGN NGC 7603 reported in Tohline & Osterbrock (1976) with its broad H becoming much weaker in one year. Until now, there are about 40 CLAGN reported in the literature, according to the basic properties that spectral types of AGN are changing between type-1 AGN (apparent broad Balmer emission lines and/or Balmer decrements near to the theoretical values) and type-2 AGN (no apparent broad Balmer emission lines and/or Balmer decrements much different from the theoretical values). There are so-far dozens of CLAGN reported in the literature.
Cohen et al. (1986) have reported the CLAGN Mrk1086 with its type changed from type-1.9 to type-1 in 4 years, and more recent results on the CLAGN Mrk 1018 can be found in McElroy et al. (2016). Storchi-Bergmann et al. (1993) have reported the CLAGN NGC 1097 with the detected Seyfert 1 nucleus which had previously shown only LINER characteristics. Aretxaga et al. (1999) have reported the CLAGN NGC 7582 with the transition toward a type 1 Seyfert experienced by the classical type 2 Seyfert nucleus. Eracleous & Halpern (2001) have reported the CLAGN NGC 3065 with the new detected broad Balmer emission lines. Denney et al. (2014) have reported the CLAGN Mrk 590 with its type changed from Seyfert 1 in 1970s to Seyfert 1.9 in 2010s. Shappee et al. (2014) have reported the CLAGN NGC 2617 classified as a Seyfert 1.8 galaxy in 2003 but as a Seyfert 1 galaxy in 2013. LaMassa et al. (2015) have reported the CLAGN SDSS J0159 classed as a type-1 AGN in 2000 but as a type-1.9 AGN in 2010. More recently, MacLeod et al. (2016) have reported ten CLAGN with variable and/or changing-look broad emission line features, and Gezari et al. (2017) have reported the CLAGN SDSS J1554 with its type changed from type-2 to Type-1 in 12 years, and Ross et al. (2018) have reported two new changing-look quasar SDSS J1100-0053 through about 20years-long spectroscopic variabilities in different wavelength bands, and Stern et al. (2018) have reported a new changing-look quasar, WISE J1052+1519, found by identifying highly mid-IR variabilities, and Yang et al. (2018) have reported a sample of 21 CLAGN with the appearance or the disappearance of broad Balmer emission lines within a few years.
In order to explain the nature of CLAGN, different models have been proposed, such as the dynamical movement of dust clouds well discussed in Elitzur (2012), the common variations in accretion rates well discussed in Elitzur et al. (2014), the variations in accretion rates due to transient events as discussed in Eracleous et al. (1995); Blanchard et al. (2017), and the magnetic torques in the free-fall region inside the ISCO (innermost stable circular orbit) as discussed in Ross et al. (2018); Stern et al. (2018), etc. There is so-far no clear conclusion on the physical mechanism of type transitions in the CLAGN. For applied models on dust obscurations or on variations of central accretion process, well expected different effects on spectral energy distributions (SEDs) could be applied to determine which model plays the key role in type transition. More interestingly, to detect bluer changing-look AGN at bright state could provide clear clues to rule out the applications of dust obscurations, if intrinsic SEDs after corrections of dust obscurations were unreasonably beyond the observed SEDs at much bright state, such as discussed results in the reported CLAGN SDSS J2241.
Among the reported CLAGN, central BH masses have been estimated in SDSS J0159 and in SDSS J1554. The virial BH mass of SDSS J0159 have been well estimated as in LaMassa et al. (2015) and in Zhang et al. (2019) under the Virialization assumptions to broad emission line regions Peterson et al. (2004), however, the measured stellar velocity dispersion is about SDSS J0159 in Zhang et al. (2019), leading to the much larger virial BH mass than the value through the M-sigma relation (Ferrarese & Merritt, 2000; Gebhardt et al., 2000; Kormendy & Ho, 2013; Savorgnan & Graham, 2015). Meanwhile, as the discussed results in SDSS J1554 in Gezari et al. (2017), the virial BH mass through properties of broad emission lines is about , and the measured stellar velocity dispersion is about leading to the M-sigma relation expected BH mass about well consistent with the virial BH mass. Therefore, as pointed out by Yang et al. (2018), CLAGN can provide perfect cases to study the connection between AGN and their host galaxies, through properties in different states. And CLAGN having different BH masses from different methods could provide further interesting clues on the physical nature of type transition.
In this manuscript, based on multi-epoch SDSS spectra, we report a new and so-far the bluest CLQSO SDSS J224113-012108 (=SDSS J2241) at , of which both the host galaxy properties and the bright nuclei can be well determined during its type transitions,leading to quite different virial BH mass from the mass determined through the M-sigma relation (a detailed review can be found in Kormendy & Ho (2013)), which will provide further clues on physical mechanism of type transitions in CLAGN. The manuscript is organized as follows. In section 2 and Section 3, the main results are shown on the spectroscopic properties and long-term photometric variability properties in SDSS J2241. In Section 4, the main discussions are given. Then, in Section 5, we show our main conclusions. And in the manuscript, we have adopted the cosmological parameters of , and .
2 Spectroscopic Properties in SDSS J2241
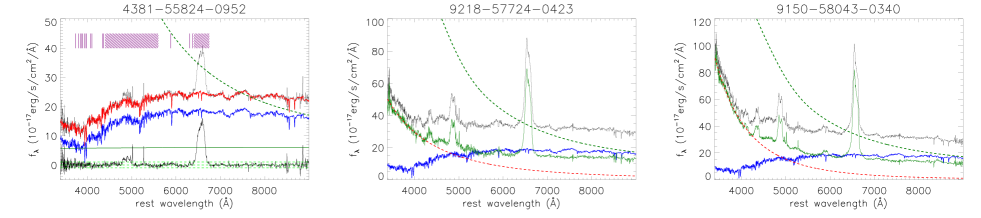
SDSS J2241, classified as a QSO in SDSS, has been observed in SDSS in September 2011, November 2016 and October 2017. Fig. 1 shows the SDSS spectra with plate-mjd-fiberid as 4381-55824-0952, 9218-57724-0423 and 9150-58043-0340. It is clear that there are apparent contributions of host galaxy in the spectrum in 2011, and apparent blue AGN continuum emissions in the spectra in 2016 and 2017.
The commonly accepted SSP (Simple Stellar Population) method has been well applied to determine the host galaxy contributions in the SDSS spectrum in 2011, similar as what we have done in Zhang (2014); Zhang et al. (2016, 2019). The more detailed descriptions on the SSP method can be found in Bruzual & Charlot (2003); Kauffmann et al. (2003); Cid Fernandes et al. (2005). Here, the 39 simple stellar population templates from Bruzual & Charlot (2003) have been exploited, which can be used to well-describe the characteristics of almost all the SDSS galaxies as detailed discussions in Bruzual & Charlot (2003). And, a power law component has been applied to describe the AGN continuum emissions, due to the apparent broad H in the SDSS spectrum in 2011. After the emission lines being masked out, the observed SDSS spectrum can be well described by the broadened SSPs (the broaden velocity as the stellar velocity dispersion) plus the power law component through the Levenberg-Marquardt least-squares minimization technique, leading to (where and as summed squared residuals and degree of freedom, respectively). Here, we have not only masked out all the narrow emissions lines with rest wavelengths between 3700Å and 7000Å with widths of about , mainly including [O ii]Å, narrow Balmer lines, [O iii]Å, [O iii] doublet, [O i] doublet, [N ii] doublet and [S ii] doublet, etc., but also masked out the optical Fe ii lines and the broad H and broad H, which have been shown in the left panel of Fig. 1. The best descriptions to the host galaxy contributions have been shown in the left panel of Fig. 1. The determined stellar velocity dispersion is about , after considering as the mean SDSS instrument broadening velocity. And the determined power law AGN component has in the SDSS spectrum in 2011.
Meanwhile, after subtractions of host galaxy contributions from the SDSS spectra in 2016 and in 2017, the blue parts of the spectra with rest wavelength less than 4000Å can be well described by and in 2016 and in 2017, respectively. Meanwhile, among the reported CLAGN in the literature, SDSS J1100-0053 well discussed in Ross et al. (2018) is also a bright quasar at its bright state, with the blue part of the spectra with rest wavelength less than 4000Å described by . Therefore, among the reported CLAGN, SDSS J2241 is the bluest changing-look QSO at its bright state.
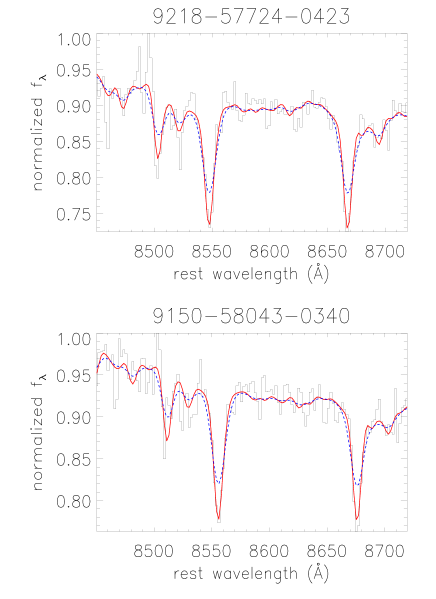
Besides the SSP method determined , the apparent Ca ii triplet around 8500Å well detected in the SDSS spectra in 2016 and in 2017 can provide another method to estimate . Based on the 1273 template stellar spectra with higher resolution about collected from the Indo-U.S. Coude Feed Spectral Library (Valdes et al., 2004), the stellar velocity dispersion is re-measured based on the best descriptions to the Ca ii triplet through the Levenberg-Marquardt least-squares minimization technique, similar as what have been done in Rix & White (1992); Greene & Ho (2006). Here, besides the broadened template stellar spectra, a three-order polynomial function has been applied to modify the continuum shape. The best descriptions have been shown Fig. 2, with the calculated values around 0.8 and 0.6 for the results to the spectra in 2016 and in 2017. After considering the spectral resolution of the template stellar spectra and the SDSS instrument broadening velocity of around the Ca ii triplet, the re-measured stellar velocity dispersions are about and for the results to the spectra in 2016 and in 2017. The re-measured through the Ca ii triplets are well consistent with the determined value through the whole spectrum observed in 2011. Therefore, the mean value of is accepted as the stellar velocity dispersion of SDSS J2241.
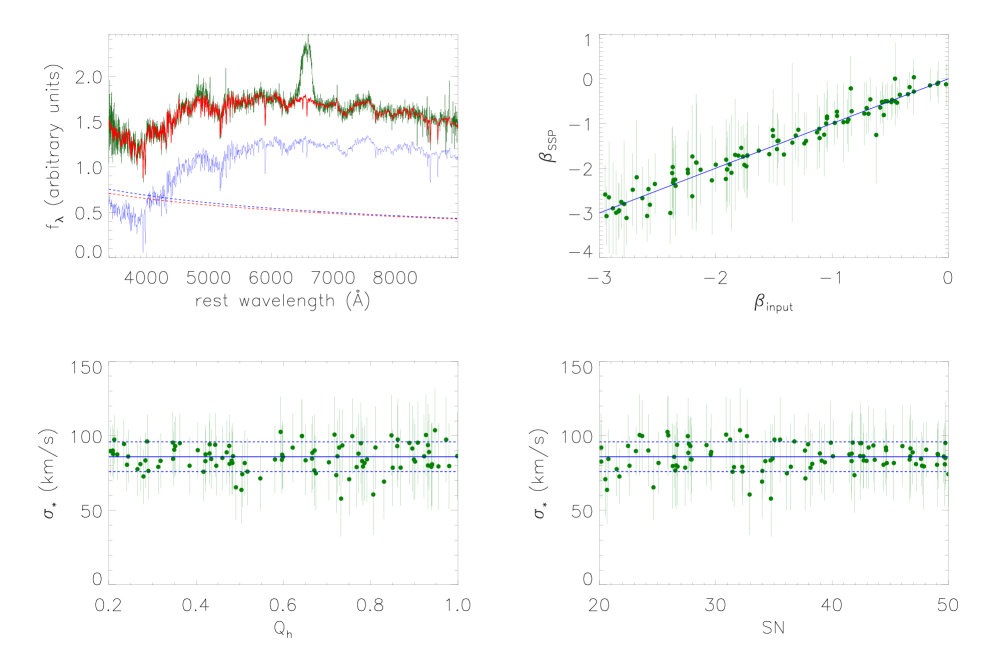
Before proceeding further, as what we have known that both the ratio of the quasar luminosity to the host galaxy luminosity and the overall signal-to-noise () of the spectrum have apparent effects on the measured stellar velocity dispersion of host galaxy of a quasar, the following two methods are applied to well demonstrate that the measured stellar velocity dispersion about 86 is reliable enough in SDSS J2241. On the one hand, properties of Ca ii triplet are mainly considered as follows. Besides the best descriptions to the Ca ii triplet shown in Figure 2, a new component described by the same stellar template with the same strengthen factor but with broadened velocity of 100 is also shown in the Figure 2. The quite difference between the best descriptions and the new component with broadened velocity of 100 strongly indicate that the measured stellar velocity dispersion is well smaller than 100 in SDSS J2241. On the other hand, properties of the whole spectra of SDSS J2241 are mainly considered as follows. Based on the best descriptions to the stellar lights shown in left panel of Figure 1, a series of 100 synthetic spectra without effects of noise can be well constructed by the normalized by plus a power law component ( as a random value from 0.2 to 1, is the value for the results in 2011 shown in the left panel of Figure 1) which is applied to describe intrinsic AGN continuum emissions. Besides considering effects of , different values of from 20 to 50 ( for the spectrum observed in 2011 in SDSS J2241) are considering to add noise to the synthetic spectra. Then the similar SSP procedure is applied to measure the stellar velocity dispersions of the 100 synthetic spectra with considerations of both and . Top left panel of Figure 3 shows one constructed synthetic spectrum (with , and ) and the determined best descriptions to the synthetic spectrum. Top right panel of Figure 3 shows the correlation between the SSP method determined slope of the continuum emissions and the input value of , with mean value of . Bottom panels of Figure 3 shown the dependence of measured stellar velocity dispersions around 86 on the and . It is clear that there are few effects of and on the measured stellar velocity dispersion. Therefore, the measured stellar velocity dispersion in SDSS J2241 is reliable enough. Then, the SSP method determined stellar lights can be well subtracted, in order to well measure properties of emission lines of SDSS J2241.
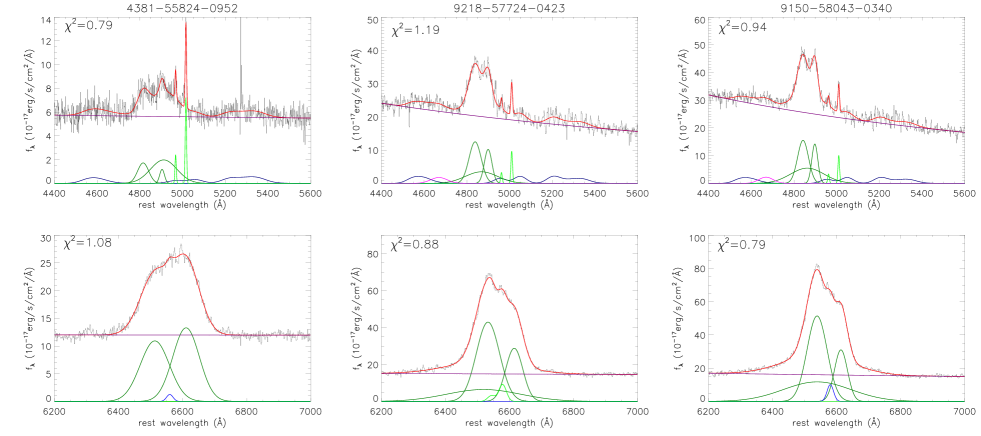
After subtractions of host galaxy contributions, emission lines, especially around the broad H (rest wavelength between 6200Å and 7000Å) and around the broad H (rest wavelength between 4400Å and 5600Å), can be well measured by the following model functions. Around H, due to double-peaked features of broad H and quite weak narrow lines of [ O i] and [S ii] doublets, three broad Gaussian functions are applied to describe the broad H, and only three narrow Gaussian components are applied to describe the narrow H and [N ii] doublet, and a power law component is applied to describe the continuum emissions underneath the broad H. Around H, three Gaussian components are applied to describe the double-peaked broad H, one narrow Gaussian component is applied to describe the narrow H, two Gaussian components are applied to describe the [O iii] doublet, one broad Gaussian component is applied to describe broad He ii, the Fe ii template discussed in Kovacevic et al. (2010) is applied to describe the optical Fe ii lines and a power law component is applied to describe the continuum emissions underneath the broad H. Then, through the Levenberg-Marquardt least-squares minimization technique, the emission lines can be well described by the model functions, which have been shown in Fig. 4. The determined parameters have been listed in Table 1 for the broad Gaussian components in the broad Balmer lines. Before proceeding further, there is one point we should note. There are determined narrow emission lines shown in Fig. 4, however, the determined fluxes of the narrow emission lines are smaller than 5 times of their corresponding flux uncertainties. Therefore, line parameters of the narrow emission lines are not listed in Table 1.
Based on the measured line parameters of the broad Balmer lines, the flux ratios of broad H to broad H are about 6.98, 2.86 and 2.79 in 2011, 2016 and 2017, respectively. The apparent changes of Balmer decrements in six years lead SDSS J2241 to be a new CLAGN. Meanwhile, based on the power law component in the blue part of the spectrum shown in the bottom panel of Fig. 1 with , SDSS J2241 is the bluest CLQSO among the reported CLAGN.
| parameters in 2011 | parameters in 2016 | parameters in 2017 | |||||||
|---|---|---|---|---|---|---|---|---|---|
| Line | flux | flux | flux | ||||||
| H | 6513.72.8 | 45.81.7 | 125973 | 6522.13.4 | 112.84.3 | 233383 | 6544.71.6 | 107.72.5 | 352875 |
| H | 6535.11.3 | 36.10.9 | 3851180 | 6545.31.1 | 30.60.7 | 3740161 | |||
| H | 6611.12.1 | 41.41.5 | 137371 | 6618.41.4 | 25.71.0 | 179990 | 6622.30.9 | 19.90.7 | 157268 |
| H | 4816.64.9 | 28.14.1 | 9152 | 4837.71.1 | 27.11.1 | 82949 | 4848.20.9 | 26.31.2 | 104393 |
| H | 4902.53.1 | 12.74.4 | 3013 | 4878.94.1 | 96.14.4 | 153787 | 4871.95.8 | 94.97.7 | 1643154 |
| H | 4911.311.3 | 65.711.5 | 26057 | 4900.80.9 | 17.30.9 | 42532 | 4904.40.7 | 13.80.8 | 48244 |
Notice: The second, third and fourth columns show the rest central wavelength in unit of Å, the line width (second moment) in unit of Å and the line flux in unit of from the spectrum in 2011. The fifth to seventh columns show the parameters from the spectrum in 2016, and the last columns show the parameters from the spectrum in 2017. The suffix "B1", "B2" and "B3" represent the three Gaussian components sorted by rest central wavelength in the broad Balmer lines.
3 Photometric Properties in SDSS J2241
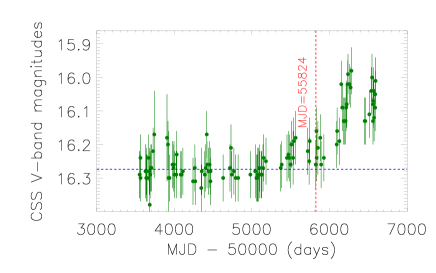
Fig. 5 shows the CSS V-band photometric light curve of SDSS J2241 collected from the Catalina Sky Survey (CSS) (Drake et al., 2009). Apparently, the long-term variabilities are very interesting in more than 8 years from July 2005 to October 2013 (MJD from 53552 to 56593). In the first 4.5 years with MJD from 53552 to 55261, there are no apparent variabilities in SDSS J2241. However since MJD=55261, the nucleus becomes brighter and brighter. Certainly, the long-term variability properties cannot be expected by the DRW (Damped Random Walk) process which has been proved to be a preferred modeling process to describe AGN intrinsic variability (Kelly et al., 2009; Kozlowski et al., 2010; Andrae et al., 2013; Zu et al., 2013).
4 Discussions
4.1 Virial BH mass and BH mass through M-sigma relation
Based on the measured line parameters, the second moments of broad H are about , and in 2011, 2016 and 2017, respectively. And the FWHM (full width at half maximum) of broad H are about , and in 2011, 2016 and 2017, respectively. The line luminosities of broad H () are about , and in 2011, 2016 and 2017, respectively. It is clear that FWHMs being decreased with line luminosity being increased is consistent with the expected results under the Virialization assumption to broad Balmer lines, however varying of does not. Therefore, rather than the , the FWHM is preferred to estimate the virial BH masses in SDSS J2241, through the following equation well discussed in Greene & Ho (2005) after considering the more recent improved R-L relation in Bentz et al. (2013)
| (1) |
Then, the virial BH masses are about , and in 2011, 2016 and 2017, respectively. Then, the mean value is accepted as the virial BH mass of SDSS J2241.
Meanwhile, based on the measured stellar velocity dispersion , the M-sigma relation expected BH mass is about through the M-sigma relation discussed in Kormendy & Ho (2013) and in Zhang et al. (2019). Therefore, the virial BH mass is about two magnitudes larger than the BH mass through the M-sigma relation. The larger virial BH mass could provide further clues on special dynamical properties of BLRs. Furthermore, as the shown results in Fig. 4, there are much different line profiles of broad H and broad H: apparent double peaks in broad H but one peak plus one shoulder in broad H (especially in 2016 and 2017). We can not find natural explanations on the different line profiles, but the different line profiles can indicate there could be non-keplerian components in broad Balmer emission regions. Further efforts should be necessary to check the variability properties of broad emission lines.
4.2 Moving dust clouds?
In the CLQSO SDSS J2241, if moving dust clouds was applied to explain the changes of Balmer decrement from 6.98 in 2011 to 2.79 in 2017, the could be estimated, assuming the theoretical Balmer decrement to be 2.80. Then, intrinsic reddening-corrected continuum emissions could be checked in 2011, and shown as dashed dark-green lines in Fig. 1. It is clear that considering the moving dust clouds to explain the changes of Balmer decrements, the expected intrinsic continuum emissions could be unreasonably larger than the continuum emissions in 2017 with no dust obscurations. Therefore, the moving dust clouds can not be applied in SDSS J2241. Although, we can not totally ruled out the moving dust clouds to explain the CLQSO SDSS J2241, the spectra of redward of broad H have tiny variations of spectral slope against the expected results by varying obscurations.
Actually, besides the well shown properties of variations of continuum emissions in SDSS J2241, there are convincing methods applied to rule out the moving dust clouds in CLAGN, such as the timescale arguments as well discussed in LaMassa et al. (2015); Runnoe et al. (2016); Ross et al. (2018) and the expected profiles of the broad emission lines in Ruan et al. (2016). Then, the two methods are applied in SDSS J2241 as follows.
On the one hand, we consider the timescale arguments as follows. As discussed in LaMassa et al. (2015); Runnoe et al. (2016), etc, it is necessary and interesting to check whether the timescale is short enough for foreground moving dust clouds in a bound orbit around the central BH in front of the continuum emission source and BLRs, where is radius of the foreground moving dust clouds, is the BH mass in units of , and is the true size of the BLRs. Commonly, there are no accurate values of the parameters of , and . However, it is not difficult to estimate a minimum timescale of , after considerations of the estimated size of central BLRs. Here, at the bright state of SDSS J2241 with continuum luminosity at 5100Å about in 2017, the size of central BLRs is estimated as through the improved empirical R-L relation reported in Bentz et al. (2013). Similar as what have been discussed in LaMassa et al. (2015); Runnoe et al. (2016), etc, assuming and , the cross timescale can be estimated as
| (2) |
. The estimated cross timescale sensitively depends on both the central BH mass and the parameters of and . If we accepted that as what have been set in LaMassa et al. (2015); Runnoe et al. (2016) and accepted BH mass about (the virial BH mass), the minimum cross timescale is about 21years. Moreover, if central BH mass through the M-sigma relation is accepted, the minimum cross timescale should be 125years. It is clear that the commonly estimated cross timescale is quite longer than the observed transition time in SDSS J2241. Therefore, the timescale arguments can also be well applied to rule out the moving dust clouds in SDSS J2241.
On the other hand, we discuss the arguments on broad line profiles as follows. As well discussed in Ruan et al. (2016), the applied moving dust clouds have apparent effects on line profiles of broad emission lines, indicating that broad line emissions from the outer lower-velocity emission regions of the broad-line region are attenuated more than emissions from the inner emission regions, leading to broad optical emission lines (such as the broad Balmer lines) are broader in the dim state. However, not similar as the findings in SDSS J2336 shown in Figure 4 in Ruan et al. (2016), the line profiles of broad H are more complicated in SDSS J2241. And as the results shown above, if considering second moment as the line width, the broad H become broader from 2011 to 2017, however, if considering FWHM as the line width, the broad H become narrower 2011 to 2017. Therefore, properties of line profiles of broad emission lines can not provide clear clues to rule out the scenario of moving dust clouds in SDSS J2241.
Based on the discussions, rather than moving dust clouds, accretion rate variations are preferred to explain the changing-look QSO SDSS J2241.
4.3 Accretion rate variations?
TDEs (tidal disruption events) can be considered as one of optimal choices leading to variations of accretion rate in central regions of galaxies. More detailed discussions on TDEs can be found in Rees (1988); Guillochon & Ramirez-Ruiz (2013); Guillochon et al. (2014); Stone et al. (2018). And there are more than 80 TDEs detected and reported (see detailed information in https://tde.space/), strongly supporting TDEs as better indicators to massive BHs and corresponding BH accreting systems. The following points could provide clues on a central TDE candidate in SDSS J2241. First, the smooth photometric variability trend is preferred to be connected with a TDE rather than common AGN variabilities. Second, there are broad He ii lines in 2016 and 2017 but quite weak He ii line in 2011, which is characteristic of TDE spectra. Third, the broad Balmer line profiles have apparent variations from 2011 to 2017, possibly due to structure evolutions of TDE debris. Fourth, virial BH mass is not consistent with the mass through the M-sigma relation, possibly similar as the case in the TDE candidate of SDSS J0159 (Zhang et al., 2019). Certainly, further efforts are necessary to identify whether there is a central TDE in SDSS J2241.
Moreover, Runnoe et al. (2016) have reported a CLAGN SDSS J1101 of which the smooth decay of its long-term photometric variabilities can be well consistent with a slope of (see the results shown in Figure 6 in Runnoe et al. (2016)) which is the value expected by the theoretical TDE model (Guillochon & Ramirez-Ruiz, 2013). However, after considering the longer bright state lasting at least 6years and more massive broad emission line regions which can not constructed by TDEs debris from a solar-like star and the peculiar properties of narrow emission lines in SDSS J1101 with stronger [O iii] luminosity, Runnoe et al. (2016) have concluded that the TDE scenario is not preferred to explain the type transition of SDSS J1101. Similar discussions to rule out a TDE scenario can also be found in Ruan et al. (2016). The considerations above on TDEs scenario in Runnoe et al. (2016); Ruan et al. (2016) should also be well considered in SDSS J2241 by the following three points. First and foremost, it is unfortunate that the collected photometric light curve is not long enough to detect whether the bright state lasts longer as the one shown in SDSS J1101. Besides, if broad emission lines in SDSS J2241 were also considered from emission regions totally constructed by TDEs debris as the ones discussed in SDSS J1101 in Runnoe et al. (2016), the conclusion should be also clear to rule out the TDE scenario applied in the type transition in SDSS J2241. However, once accepted that only part of broad line emissions of SDSS J2241 have contributions from expected TDEs debris (a large part of broad line emissions from central normal BLRs connected with intrinsic AGN, i.e., a probable TDE in AGN), the strong broad line features should be not robust evidence to rule out the TDE scenario in type transition of SDSS J2241. Last but not the least, the [O iii] luminosity of SDSS J2241 can be measured as , at least two magnitudes smaller than the listed values in Ruan et al. (2016). And moreover, not similar as the strong narrow emission lines measured at the dime states in the CLAGN in Ruan et al. (2016); Runnoe et al. (2016), there are no narrow Balmer emission lines clearly detected at the dime state in SDSS J2241 as the results shown in Figure 4. The weak narrow Balmer emission lines in SDSS J2241 are similar as the optical spectroscopic emission line properties of the reported TDEs, which could be treated as clues to support a central TDE in SDSS J2241. In one word, as discussed above, further efforts are necessary to identify whether there is a central TDE in SDSS J2241.
5 Conclusions
Finally, we give our main conclusions as follows. Based on the SDSS spectra observed in 2011, 2016 and 2017, the flux ratio of broad H to broad H is changed from 7 in 2011 to 2.7 in 2017 in the QSO SDSS J2241, leading SDSS J2241 to be a new CLQSO. And moreover, after considering host galaxy contribution, the spectral index with Å can be well determined in 2017, leading SDSS J2241 to be so-far the bluest CLQSO. Meanwhile, based on the determined stellar velocity dispersion about and the properties of broad H, the virial BH mass in SDSS J2241 is about two magnitudes larger than the BH mass through the M-sigma relation, not similar as the clear case in the CLAGN SDSS J1554. Meanwhile, the long-term photometric variability curve shows interesting smooth slowly gradual changing properties, not expected by DRW process commonly applied in common AGN. Moreover, based on the properties of continuum emissions in 2017 with no dust obscurations, only considering the moving dust clouds cannot be preferred to explain the CLQSO SDSS J2241, because the expected intrinsic reddening corrected continuum emissions in 2011 were unreasonably higher than the unobscured continuum emissions in 2017. The accretion rate variations can be preferred, and the probable accretion rate variability could be probably due to a TDE in SDSS J2241.
Acknowledgements
Zhang gratefully acknowledge our referee for reading our manuscript carefully and patiently, and gratefully acknowledge the our referee for giving us constructive comments and suggestions to greatly improve our paper. Zhang gratefully acknowledges the kind support of Starting Research Fund of Nanjing Normal University and from the financial support of NSFC-11973029. This manuscript has made use of the data from the SDSS projects. The SDSS-III web site is http://www.sdss3.org/. SDSS-III is managed by the Astrophysical Research Consortium for the Participating Institutions of the SDSS-III Collaboration.
References
- Andrae et al. (2013) Andrae, R., Kim, D. W., & Bailer-Jones, C. A. L., 2013, A&A, 554, 137
- Aretxaga et al. (1999) Aretxaga, I.; Joguet, B.; Kunth, D.; Melnick, J.; Terlevich, R. J., 1999, ApJL, 519, 123
- Bentz et al. (2013) Bentz, M. C.; Denney, K. D.; Grier, C. J.; et al., 2013, ApJ, 767, 149
- Blanchard et al. (2017) Blanchard, P. K., Nicholl, M., Berger, E., et al. 2017, ApJ, 843, 106
- Bruzual & Charlot (2003) Bruzual, G., & Charlot, S. 2003, MNRAS, 344, 1000
- Cid Fernandes et al. (2005) Cid Fernandes, R., Mateus, A., Sodre, L., Stasinska, G., Gomes, J. M., 2005, MNRAS, 358, 363
- Cohen et al. (1986) Cohen, R. D.; Rudy, R. J.; Puetter, R. C.; Ake, T. B.; Foltz, C. B., 1986, ApJ, 311, 135
- Denney et al. (2014) Denney, K. D.; De Rosa, G.; Croxall, K., 2014, ApJ, 796, 134
- Drake et al. (2009) Drake, A. J.; Djorgovski, S. G.; Mahabal, A., et al., 2009, ApJ, 696, 870
- Elitzur (2012) Elitzur, M. 2012, ApJ, 747, L33
- Elitzur et al. (2014) Elitzur, M., Ho, L. C., Trump, J. R. 2014, MNRAS, 438, 3340
- Eracleous et al. (1995) Eracleous, M., Livio, M., Halpern, J. P., Storchi-Bergmann, T. 1995, ApJ, 438, 610
- Eracleous & Halpern (2001) Eracleous, M.; Halpern, J. P., 2001, ApJ, 554, 240
- Ferrarese & Merritt (2000) Ferrarese, F. & Merritt, D., 2000, ApJL, 539, 9
- Gebhardt et al. (2000) Gebhardt, K., et al., 2000, ApJL, 539, 13
- Gezari et al. (2017) Gezari, S.; Hung, T.; Cenko, S. B.; et al., 2017, ApJ, 835, 144
- Greene & Ho (2005) Greene, J. E., & Ho, L. C., 2005, ApJ, 630, 122
- Greene & Ho (2006) Greene, J. E., & Ho, L. C., 2006, ApJ, 641, 117
- Guillochon & Ramirez-Ruiz (2013) Guillochon, J.; Ramirez-Ruiz, E., 2013, ApJ, 767, 25
- Guillochon et al. (2014) Guillochon, J.; Manukian, H.; Ramirez-Ruiz, E., 2014, ApJ, 783, 23
- Kauffmann et al. (2003) Kauffmann, G., et al. 2003, MNRAS, 346, 1055
- Kelly et al. (2009) Kelly, B. C., Bechtold, J., & Siemiginowska, A., 2009, ApJ, 698, 895
- Kozlowski et al. (2010) Kozlowski, S., et al., 2010, ApJ, 708, 927
- Kovacevic et al. (2010) Kovacevic, J., Popovic, L. C., Dimitrijevic, M. S., 2010, ApJS, 189, 15
- Kormendy & Ho (2013) Kormendy, J. & Ho, L. C., 2013, ARA&A, 51, 511
- LaMassa et al. (2015) LaMassa, S. M., Cales, S., Moran, E. C., et al. 2015, ApJ, 800, 144
- MacLeod et al. (2016) MacLeod, C. L.; Ross, N. P.; Lawrence, A.; et al., 2016, MNRAS,
- McElroy et al. (2016) McElroy, R. E.; Husemann, B.; Croom, S. M.; et al., 2016, A&A Letter, 593, 8
- Peterson et al. (2004) Peterson, B. M.; Ferrarese, L.; Gilbert, K. M.; et al., 2004, ApJ, 613, 682
- Rees (1988) Rees, M. J., 1988, Nature, 333, 523
- Rix & White (1992) Rix, H.-W., & White, S. D. M., 1992, MNRAS, 254, 389
- Ross et al. (2018) Ross, N. P.; Ford, K. E. S.; Graham, M., et al., 2018, MNRAS, 480, 4468
- Ruan et al. (2016) Ruan, J. J.; Anderson, S. F.; Cales, S. L., et al., 2016, ApJ, 826, 188
- Runnoe et al. (2016) Runnoe, J. C.; Cales, S.; Ruan, J. J., et al., 2016, MNRAS, 455, 1691
- Savorgnan & Graham (2015) Savorgnan, G. A. D. & Graham, A. W., 2015, MNRAS, 446, 2330
- Shappee et al. (2014) Shappee, B. J.; Prieto, J. L.; Grupe, D., et al., 2014, ApJ, 788, 48
- Stern et al. (2018) Stern, D.; McKernan, B.; Graham, M. J., et al., 2018, ApJ, 864, 27
- Stone et al. (2018) Stone N. C.; Kesden M.; Chang R. M.; van Velzen S.; General Relativity and Gravitation, 2018, arXiv:1801.10180
- Storchi-Bergmann et al. (1993) Storchi-Bergmann, T.; Baldwin, J. A.; Wilson, A. S., 1993, ApJL, 410, 11
- Tohline & Osterbrock (1976) Tohline, J. E., Osterbrock, D. E. 1976, ApJL, 210, L117
- Valdes et al. (2004) Valdes, F., Gupta, R., Rose, J. A., Singh, H. P., Bell, D. J., 2004, ApJS, 152, 251
- Yang et al. (2018) Yang, Q.; Wu, X.; Fan, X.; et a;., 2018, ApJ, 862, 109
- Zhang (2014) Zhang, X. G., 2014, MNRAS, 438, 557
- Zhang et al. (2016) Zhang, X. G., Feng, L. L., 2016, MNRAS, 457, 3878
- Zhang et al. (2019) Zhang, X. G.; Bao, M.; Yuan, Q. R., 2019, MNRAS Letter, 490, 81
- Zu et al. (2013) Zu, Y., Kochanek, C. S., Kozlowski, S., Udalski, A., 2013, ApJ, 765, 106