Eridanus IV: an Ultra-Faint Dwarf Galaxy Candidate Discovered in the DECam Local Volume Exploration Survey
Abstract
We present the discovery of a candidate ultra-faint Milky Way satellite, Eridanus IV (DELVE J05050931), detected in photometric data from the DECam Local Volume Exploration survey (DELVE). Eridanus IV is a faint (), extended (), and elliptical () system at a heliocentric distance of , with a stellar population that is well-described by an old, metal-poor isochrone (age of and metallicity of dex). These properties are consistent with the known population of ultra-faint Milky Way satellite galaxies. Eridanus IV is also prominently detected using proper motion measurements from Gaia Early Data Release 3, with a systemic proper motion of mas yr-1 measured from its horizontal branch and red giant branch member stars. We find that the spatial distribution of likely member stars hints at the possibility that the system is undergoing tidal disruption.
FERMILAB-PUB-21-319-E
1 Introduction
The cosmological model successfully predicts structure formation across a wide range of mass scales, from the most massive galaxy clusters to the lowest mass dwarf galaxies. At the low-mass, low-luminosity extreme (stellar masses , ; Simon 2019) are the so-called “ultra-faint” dwarf galaxies, which have only been detected in the very local Universe as satellites of the Milky Way and other nearby galaxies. In addition to being ideal systems for testing the hierarchical model of structure formation at the smallest scales, these systems are also pristine laboratories for studying the nature of dark matter (e.g., Nadler et al., 2021), the synthesis of heavy elements (e.g., Ji et al., 2016), and the physics of reionization (e.g., Weisz & Boylan-Kolchin, 2017).
Despite the scientific insights to be gained from studying these faint systems, the known population of Milky Way satellite galaxies was limited to roughly a dozen brighter, “classical” dwarf spheroidal galaxies throughout much of the last century. However, in the last two decades, successive efforts by large, multi-band digital sky surveys (e.g., SDSS, PanSTARRS, DES, and HSC-SSP) have extended observational sensitivity to much fainter systems, expanding the census of known Milky Way satellite galaxies to systems (Drlica-Wagner et al., 2020, and references therein). Moreover, the Gaia satellite has provided precise proper motion measurements of distant stars, enabling detailed kinematic and orbital measurements of satellite galaxies (e.g., Fritz et al., 2018; Erkal & Belokurov, 2020) and the discovery of new ultra-faint systems with algorithms that leverage proper motion information to identify gravitationally-bound stellar systems (e.g., Torrealba et al., 2019; Darragh-Ford et al., 2020).
In this Letter, we report the discovery of a new ultra-faint stellar system in the constellation Eridanus, identified through a matched-filter search of data from the DECam Local Volume Exploration survey (DELVE; Drlica-Wagner et al., 2021). The system’s size and luminosity are consistent with the known population of ultra-faint dwarf galaxies orbiting the Milky Way. Based on the high likelihood that this system is a dwarf galaxy, rather than a star cluster, we adopt the dwarf galaxy naming convention and refer to it as Eridanus IV (Eri IV) after the constellation within which it is found.
2 DELVE Data and Satellite Search
2.1 DELVE Data
DELVE is an ongoing observational campaign using the Dark Energy Camera (DECam; Flaugher et al., 2015) on the 4-meter Blanco telescope to study the satellite systems of the Milky Way, Magellanic Clouds, and four Magellanic-analogs within (Drlica-Wagner et al., 2021). DELVE seeks to complete observational coverage of the high-Galactic-latitude () southern sky in the bands by combining 126 nights of observing with all existing public DECam community data with exposure times seconds. More detailed information about the observational strategy and scientific goals of DELVE can be found in Drlica-Wagner et al. (2021).
We used an updated internal data release from DELVE constructed from - and -band exposures covering in the southern Galactic cap outside the DES footprint. All exposures were processed with the DESDM pipeline (Morganson et al., 2018), which utilizes SourceExtractor and PSFEx (Bertin & Arnouts, 1996; Bertin, 2011) for automatic source detection and photometric measurement. Astrometry was calibrated against Gaia DR2, which provides mas relative astrometric calibration. The DELVE photometry is calibrated for each DECam CCD by matching stars to the ATLAS Refcat2 catalog (Tonry et al., 2018). A multi-band catalog of unique astronomical objects was generated by matching the SourceExtractor catalogs from each CCD image as described in Drlica-Wagner et al. (2021). For each source, we calculated interstellar extinction due to foreground dust by interpolating the maps of Schlegel et al. (1998) with the rescaled normalization from Schlafly & Finkbeiner (2011) and the reddening coefficients from Section 4.2 of DES Collaboration (2018). Hereafter, all quoted magnitudes are corrected for extinction.
We separate stars and galaxies using the SourceExtractor SPREAD_MODEL parameter. When performing our search, we selected a relatively pure sample of stars, , and restricted our stellar sample to mag, which corresponds to the median -band magnitude limit of the DELVE data at S/N=10. To characterize Eri IV, we selected a more complete sample of stars following Section 4.8 of Drlica-Wagner et al. (2021), , which has been found to be complete down to a magnitude of . We use this value as the -band magnitude limit for our characterization analysis, paired with the -band S/N=10 magnitude limit of . We find that the derived properties of Eri IV are insensitive to moderate ( mag) variations in the assumed magnitude limits.
2.2 Matched-Filter Search
We searched for old, metal-poor stellar systems in the DELVE catalog using the simple 111https://github.com/DarkEnergySurvey/simple matched-filter algorithm, which has been applied to data from several DECam survey programs to help discover more than 20 Milky Way satellites (Bechtol et al., 2015; Drlica-Wagner et al., 2015; Mau et al., 2019, 2020; Cerny et al., 2021). In brief, simple uses an isochrone matched-filter approach in color–magnitude space to increase the contrast of halo substructure relative to foreground Milky Way stars at a given distance. Specifically, we split the DELVE catalog into HEALPix pixels (Górski et al., 2005) at nside = 32 ( deg and searched for stars consistent with a PARSEC (Bressan et al., 2012) isochrone of age Gyr and metallicity ( dex). We scanned this isochrone over a range of distance moduli from mag in steps of 0.5 mag. For each step in distance, we selected stars consistent with the isochrone according to , and then smoothed the resulting density field with a Gaussian kernel. Local spatial overdensities were identified by iteratively raising a density threshold until fewer than ten disconnected peaks remained (Bechtol et al., 2015). The resulting candidates with significance were visually inspected.
Eri IV was the most promising new candidate identified by the simple search.222Ongoing searches of the DELVE catalog (including searches leveraging -band data) may uncover additional stellar systems. The presentation of just one system should not be interpreted as a statement of detection completeness for the DELVE data. The corresponding density peak had a Poisson significance of 11.8 relative to the stellar density in an annular background region, and showed evidence of a prominent blue horizontal branch, lending significant credence to the detection. We note that this candidate system resides within the Pan-STARRS1 DR1 (PS1) footprint, but it was not identified in the census conducted by Drlica-Wagner et al. (2020). However, the observational selection function constructed by that work suggests that the detectability of a system with the properties of Eri IV is only using the PS1 data, and thus the previous non-detection is not unexpected (see Section 3).
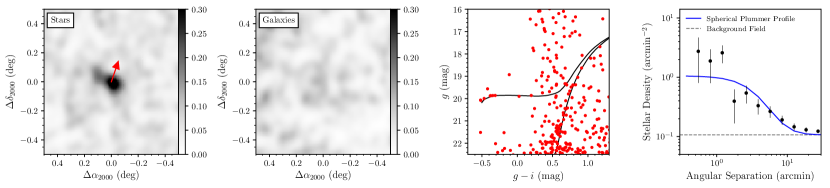
In Figure 1, we present diagnostic plots similar to those inspected during the search process. These include the smoothed stellar and galaxy density around the candidate, along with a color–magnitude diagram, and a (azimuthally-averaged) radial profile centered at the location of the candidate system.
3 Properties of Eridanus IV
3.1 Morphology and Stellar Population
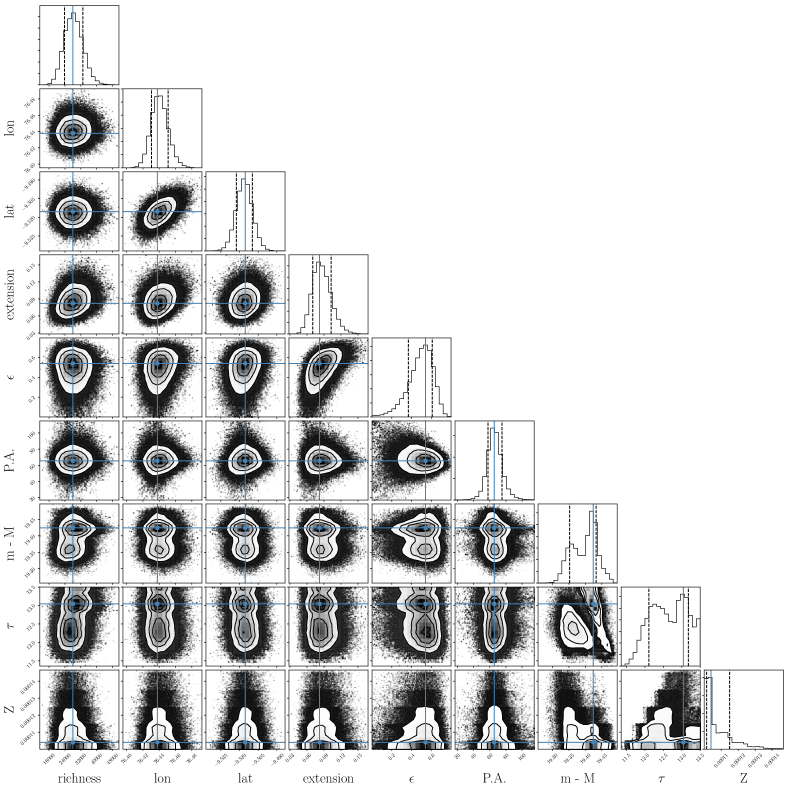
We fit the morphological and stellar population parameters of Eri IV using the unbinned maximum-likelihood formalism implemented in the Ultra-faint Galaxy Likelihood (ugali) software toolkit (Bechtol et al., 2015; Drlica-Wagner et al., 2020).333https://github.com/DarkEnergySurvey/ugali We modeled the 2D spatial distribution of stars with a Plummer profile, and fit the system’s color–magnitude diagram with a set of PARSEC (Bressan et al., 2012) isochrones assuming a Chabrier (2001) initial mass function. We simultaneously constrained the centroid (, ), semi-major axis (), ellipticity (), and position angle (P.A.) of the Plummer profile, and the age (), metallicity (), and distance modulus () of the isochrone by sampling the posterior probability distributions of each parameter using an affine-invariant Markov Chain Monte Carlo (MCMC) ensemble sampler (emcee; Foreman-Mackey et al., 2013). We then derived estimates for the system’s azimuthally averaged angular and physical half-light radii ( and , respectively), absolute visual magnitude (), average surface brightness within the half-light radius (), mean metallicity (), and the total stellar mass of the system ().
We calculated the ugali membership probability for each star based on the Poisson probability that it belongs to Eri IV based upon its spatial position, flux, and photometric uncertainty, given an empirical model of the local stellar field population and of a putative dwarf galaxy. We also report the quantity , which can be interpreted as the number of Eri IV member stars brighter than the DELVE magnitude limits.
The resulting values for each parameter are shown in Table 1. We note that the uncertainties for the system’s age and distance modulus are significantly asymmetric due to a bimodal posterior distribution. We believe that this behavior is likely introduced by foreground stars just brighter than the horizontal branch and do not attribute it to the presence of a second stellar population. We present the MCMC-derived posterior probability distributions for all parameters in Appendix A.
| Parameter | Value | Units |
|---|---|---|
| deg | ||
| deg | ||
| arcmin | ||
| arcmin | ||
| pc | ||
| … | ||
| deg | ||
| aaWe assume a systematic uncertainty of associated with isochrone modeling (Drlica-Wagner et al., 2015). | mag | |
| kpc | ||
| Gyr | ||
| bbThe metallicity posterior peaked at the lower bound of the allowed parameter range ( = 0.0001); we therefore quote an upper limit at the 95% confidence level. | … | |
| … | ||
| 200.6 | … | |
| ccThe uncertainty in was calculated following Martin et al. (2008) and does not include uncertainty in the distance. | mag | |
| 28.2 | mag arcsec-2 | |
| bbThe metallicity posterior peaked at the lower bound of the allowed parameter range ( = 0.0001); we therefore quote an upper limit at the 95% confidence level. | dex | |
| 0.107ddThis value refers to the mean reddening of all sources within one half-light radius. | mag | |
| 209.499 | deg | |
| -27.772 | deg | |
| mas yr-1 | ||
| mas yr-1 | ||
| … |
Note. — The quoted uncertainties were derived from the highest density interval containing the peak and 68% of the marginalized posterior distribution.
3.2 Proper Motion
We utilized astrometric data from Gaia Early Data Release 3 (EDR3; Gaia Collaboration et al., 2021) to compute the systemic proper motion of Eri IV. We first filtered the sample by removing stars with non-zero parallax () and large proper motion (). We applied the following Gaia quality flags: ruwe, astrometric_excess_noise_sig , , duplicated_source=False, astrometric_params_solved (Lindegren et al., 2021; Riello et al., 2021). We removed background AGN/QSOs that are cross-matched to the Gaia catalog using gaiaedr3.agn_cross_id. We constructed a Gaussian mixture model composed of a satellite and Milky Way background component fit to the proper motions and spatial positions of stars after applying a color–magnitude filter (Pace & Li, 2019). We generally followed the methodology of Pace & Li (2019), but instead of fixing the spatial parameters of Eri IV, we assumed Gaussian priors based on the best-fit parameters from the ugali analysis as was done in Cerny et al. (2021).
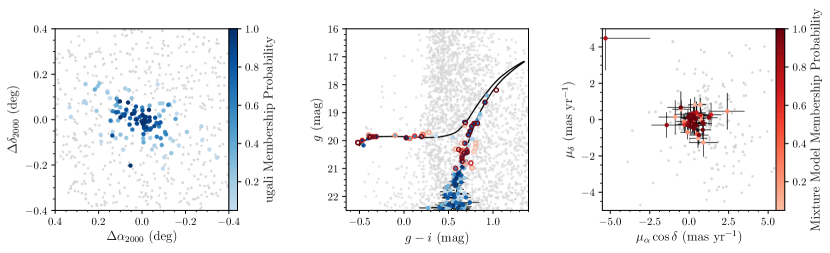
We derived a systemic proper motion of and , and we found that the sum of the mixture model membership probabilities is . In the right panel of Figure 2, we present a proper motion scatterplot of all stars meeting the cuts described above in gray, and overlay the likely members identified by the mixture model in colors representing mixture-model-derived probabilities. In the center panel, we circle these stars in the DELVE color–magnitude diagram. The clear overdensity of stars with consistent proper motions further indicates that Eri IV is a co-moving system.
4 Discussion
4.1 Classification of Eridanus IV
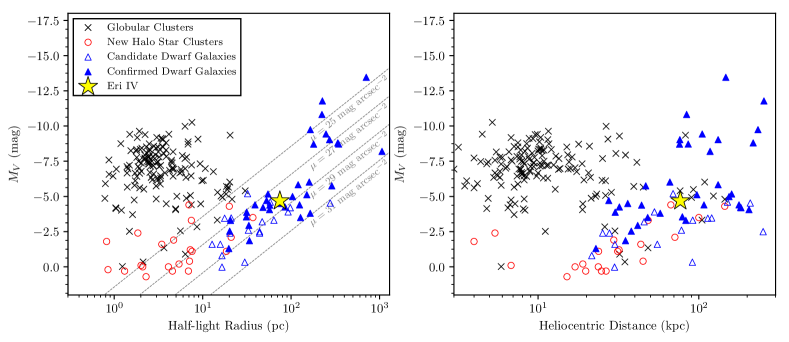
In Figure 3, we show the best-fit parameters of Eri IV in the plane of absolute -band magnitude and physical half-light radius () along with other known Milky Way satellites, including classical globular clusters, faint halo star clusters, and candidate and confirmed dwarf galaxies (see Cerny et al., 2021, and references therein). The position of Eri IV in this space is consistent with the known population of ultra-faint dwarf galaxies, suggesting a dwarf galaxy classification for the system. In particular, the large physical size () and ellipticity () of Eri IV are inconsistent with the population of comparably bright globular clusters (Harris, 1996, 2010 edition).Spectroscopic measurement of a large velocity dispersion for this system could provide evidence that the system is a dark-matter-dominated dwarf galaxy. Furthermore, spectroscopic measurements of a metallicity dispersion could provide independent evidence for the system’s classification, since a large dispersion could imply that Eri IV has undergone multiple generations of star formation, which is more suggestive of a dwarf galaxy nature (e.g, Willman & Strader, 2012).
We also note that the predicted orbital properties of Eri IV based on sky position, distance, proper motion, and a range of possible line-of-sight velocities are slightly more consistent with the known population of dwarf galaxies than globular clusters (see Section 4.3), although the system’s morphological properties provide stronger evidence for its classification.
4.2 RR Lyrae Variable Stars in Eridanus IV
The color–magnitude diagram in Figure 2 shows that the horizontal branch of Eri IV is well-populated, with several stars residing in the instability strip, where Population II variable stars are likely to be found. In particular, based on the empirical relation from Martínez-Vázquez et al. (2019), a dwarf galaxy with mag is expected to contain 3 to 4 RR Lyrae (RRL) stars.
We searched the Gaia DR2 variability catalogs (Clementini et al., 2019; Holl et al., 2018) and found two RRL candidates within (). However, the mean Gaia -band magnitudes of these stars are 0.5 mag brighter than the horizontal branch of Eri IV measured in Gaia. The Gaia variability analysis reports a mean magnitude uncertainty of mag with semi-amplitudes of mag and mag for these RRL candidates using 33 and 29 “clean” epochs of observation. The inconsistency between the mean magnitudes of these stars and the horizontal branch of Eri IV makes it unlikely that these stars are members. We examined the DELVE photometry for each of these RRL stars and confirmed that they are brighter than the horizontal branch of Eri IV by at least 0.3 to 0.5 mag. While the mean magnitudes of these RRL stars are inconsistent with the horizontal branch of Eri IV, the clustering of two distant halo RRL within such a small angular area is also unexpected. It is possible that these stars are incorrectly classified as RRLs. Another possibility is that these stars are being brightened by unresolved binary companions. More complete variability information from Gaia DR3 may provide additional insight into the nature of these stars.
We also searched the PS1 RRL catalog (Sesar et al., 2017) and found one additional candidate RRL star less than from Eri IV’s centroid, but with an estimated distance modulus of 19.14 mag ( mag closer than Eri IV). Inspection of the DELVE photometry for this star reveals that it is consistent with the isochrone locus shown in Figure 2, and was assigned a ugali membership probability of 0.98 and a mixture model membership probability of 0.98444The Gaia EDR3 SOURCE_ID for this star is 3182724869762754048., although we note that the former depends on the mean magnitude of this object, which is the sparsely sampled by DELVE. The Gaia -band mean magnitude of this object, which is reported in EDR3 based on 22 epochs, is also consistent with isochrone locus of Eri IV. Thus, it seems likely that this RRL candidate is a member of Eri IV, despite the inconsistent distance modulus reported by Sesar et al. (2017).
Lastly, we note that both the existing RRL catalogs are incomplete at faint magnitudes (Clementini et al., 2019; Sesar et al., 2017), and thus may not include all RRL members of this system. Given the sparse sampling of the DELVE data at the location of Eri IV, even when augmented by the existing PS1 data, we do not attempt to use it to identify RRL and instead note that follow-up observations are merited to identify and characterize variable stars in this system.
4.3 Orbit
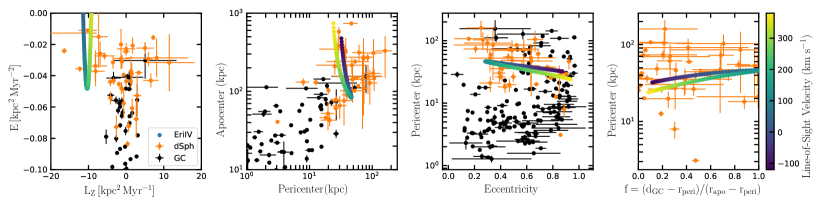
While the line-of-sight velocity of Eri IV is currently unknown, we can explore possible orbits by scanning over a range of line-of-sight velocities. We used the gala package to compute orbits with the MilkyWayPotential Galactic potential (Price-Whelan, 2017), which consists of two Hernquist (1990) spheroids to model the bulge and nucleus, a Miyamoto & Nagai (1975) axisymmetric stellar disk, and a NFW dark matter halo (Navarro et al., 1996). For a given heliocentric line-of-sight velocity, , we computed the integrals of motion, and , and the orbital pericenter (), apocenter (), and eccentricity. For comparison, we computed the same properties for other Milky Way satellite galaxies and globular clusters using the 6D phase space information compiled in Pace et al. (in prep) and Vasiliev & Baumgardt (2021). In Figure 4, we show the orbital properties of Eri IV and the population of other known satellites. For values of , we find that Eri IV is bound to the Milky Way.
Interestingly, the observed Milky Way satellite galaxies are preferentially found near their orbital pericenter whereas basic orbital dynamics predicts that satellites on elliptical orbits should spend more time near their apocenters (Fritz et al., 2018; Li et al., 2021). To compare Eri IV to the known population of satellite galaxies, we examined the ratio, , where is the distance to the Galactic center. The ratio quantifies whether a satellite is close to its pericenter () or apocenter (). As pointed out by Fritz et al. (2018), there is an observed excess of satellites with ; in particular, 16/30 satellites with high-quality proper motion measurements from Gaia DR2 were found to have , which they identify as a possible observational selection effect. In Figure 4, we find that Eri IV is only near its pericenter () if it has a large eccentricity, which corresponds to the velocity extremes of the range we explored ( or ). Thus, Eri IV may be consistent with the prediction that many satellites will be discovered near their orbital apocenters (Fritz et al., 2018).
4.4 Potential Tidal Feature
As seen in the leftmost panel of Figure 1, a clear overdensity of isochrone-selected stars is visible to the northeast of the densest region of Eri IV. This overdensity is also independently visible (albeit less prominent) in members selected solely on the basis of color and Gaia proper motion, supporting its characterization as a real structure. We note that despite the presence of Galactic cirrus, the measured by Schlegel et al. (1998) varies by over the Eri IV field, making it unlikely that this feature is artificially introduced by spatial variations in the foreground dust.
Such extended stellar features can arise via tidal stripping of satellite member stars via interactions with the Milky Way (e.g., Küpper et al., 2012), but should be cautiously interpreted in systems like Eri IV where the total number of observed stars is low. While we defer more detailed spatial modeling and analysis of this candidate tidal feature until deeper photometric data are available, we investigated the possibility that our parameter estimates are biased due to the asymmetric spatial distribution produced by this overdensity. A similar situation was considered by Drlica-Wagner et al. (2015) for the tidally disrupting satellite Tucana III, and we followed their procedure by fitting an azimuthally symmetric () stellar density profile. We find that the azimuthally symmetric fit of Eri IV yields a consistent value of the azimuthally-averaged half-light radius () within the quoted uncertainty. This suggests that the potential tidal feature is not significantly inflating the best-fit half-light radius of Eri IV (and thereby biasing the system’s classification); however, we do observe that the best-fit centroid of Eri IV is slightly offset from the location of highest density (Figure 1).
We note that the proper motion vector of the system is aligned nearly perpendicular to the potential tidal feature and the major axis of Eri IV (Figure 1). Whether or not this configuration favors or disfavors tidal disruption as the cause of the feature depends on the orientation of Eri IV’s orbital plane and phase (e.g., Küpper et al., 2012).
Lastly, we note that our orbit model predicts that Eri IV has a pericenter of , which is more distant than many other tidally disrupting systems (e.g., Palomar 5, Sagittarius, Tucana III). While hints of tidal disruption have been suggested for satellites with larger pericenter distances (e.g., Hercules, Leo V, and Canes Venatici II; Sand et al. 2012; Roderick et al. 2015), some of these claims have been called into question by deeper Hubble Space Telescope observations (Mutlu-Pakdil et al., 2019, 2020). Furthermore, Ji et al. (2021) recently emphasized the important gravitational influence of the LMC when modeling the orbit of the tidally disturbed system Antlia II. If Eri IV is indeed experiencing tidal disruption, it could provide valuable insight into the process of satellite disruption in the outer Milky Way halo. Deeper photometry and radial velocity measurements are critical to confirm this candidate tidal feature and to determine the full orbital characteristics of Eri IV.
4.5 Association with Local Group structures
While a number of recently discovered ultra-faint dwarf galaxies are likely to be presently associated with the Magellanic Clouds (e.g., Erkal & Belokurov, 2020; Patel et al., 2020), this is unlikely for Eri IV based on its current location. Eri IV is located kpc and kpc from the LMC and SMC, respectively, and is not aligned with the Magellanic Stream. Nonetheless, our orbit model does not rule out the possibility of a past association between Eri IV and the LMC, and a more conclusive investigation will require radial velocity information.
Eri IV is situated close in projection to the Sagittarius (Sgr) stream, leading us to investigate a possible association between the two systems. Inspecting the Sgr stream model from Vasiliev et al. (2021), we find that a wrap of the Sgr stream passes to the north of Eri IV at a heliocentric distance of kpc. However, this is not especially well-matched to the distance of Eri IV. Furthermore, we note that the measured proper motion of Eri IV is misaligned with the modeled proper motion of the Sgr stream at this location. Thus, we find no obvious connection between Eri IV and the Sgr stream. Likewise, we find that Eri IV is situated close in projection to the Gjöll stellar stream (e.g., Hansen et al., 2020), but note that Eri IV is 40 kpc more distant than Gjöll’s apocenter and has an inconsistent proper motion.
Lastly, it has been proposed that a substantial fraction of the observed satellite galaxies co-orbit the Milky Way in a thin plane known as the “Vast Polar Structure” (Pawlowski et al. 2012; Fritz et al. 2018). We find that the spatial position of Eri IV places it outside of the plane of this postulated structure.
5 Summary
We have presented the discovery of Eridanus IV, a new ultra-faint dwarf galaxy candidate, and we have characterized its morphology, stellar population, and proper motion using DELVE photometry and Gaia astrometry. We have briefly investigated spatially coincident RR Lyrae variable stars, predicted orbital properties, a possible signature of tidal disruption, and potential associations with other Local Group structures. Further characterization of Eri IV will benefit from additional photometric and spectroscopic data.
The discovery of yet another ultra-faint satellite in a region of the sky that was previously observed by shallower surveys is consistent with the prediction that hundreds of ultra-faint galaxies remain to be discovered with surveys like DELVE, HSC-SSP, and the Rubin Observatory LSST. The discovery and study of these satellites will play an important role in our understanding of the first galaxies, the formation of the Milky Way halo, and the nature of dark matter.
6 Acknowledgments
The DELVE project is partially supported by Fermilab LDRD project L2019-011 and the NASA Fermi Guest Investigator Program Cycle 9 No. 91201. ABP acknowledges support from NSF grant AST-1813881. This research received support from the National Science Foundation (NSF) under grant no. NSF DGE-1656518 through the NSF Graduate Research Fellowship received by SM. BMP is supported by an NSF Astronomy and Astrophysics Postdoctoral Fellowship under award AST-2001663. JLC acknowledges support from NSF grant AST-1816196. JDS acknowledges support from NSF grant AST-1714873. SRM acknowledges support from NSF grant AST-1909497. DMD acknowledges financial support from the Talentia Senior Program (through the incentive ASE-136) from Secretaría General de Universidades, Investigación y Tecnología, de la Junta de Andalucía.
This project used data obtained with the Dark Energy Camera (DECam), which was constructed by the Dark Energy Survey (DES) collaboration. Funding for the DES Projects has been provided by the DOE and NSF (USA), MISE (Spain), STFC (UK), HEFCE (UK), NCSA (UIUC), KICP (U. Chicago), CCAPP (Ohio State), MIFPA (Texas A&M University), CNPQ, FAPERJ, FINEP (Brazil), MINECO (Spain), DFG (Germany), and the collaborating institutions in the Dark Energy Survey, which are Argonne Lab, UC Santa Cruz, University of Cambridge, CIEMAT-Madrid, University of Chicago, University College London, DES-Brazil Consortium, University of Edinburgh, ETH Zürich, Fermilab, University of Illinois, ICE (IEEC-CSIC), IFAE Barcelona, Lawrence Berkeley Lab, LMU München, and the associated Excellence Cluster Universe, University of Michigan, NSF’s National Optical-Infrared Astronomy Research Laboratory, University of Nottingham, Ohio State University, OzDES Membership Consortium University of Pennsylvania, University of Portsmouth, SLAC National Lab, Stanford University, University of Sussex, and Texas A&M University.
This work has made use of data from the European Space Agency (ESA) mission Gaia (https://www.cosmos.esa.int/gaia), processed by the Gaia Data Processing and Analysis Consortium (DPAC, https://www.cosmos.esa.int/web/gaia/dpac/consortium). Funding for the DPAC has been provided by national institutions, in particular the institutions participating in the Gaia Multilateral Agreement.
Based on observations at Cerro Tololo Inter-American Observatory, NSF’s National Optical-Infrared Astronomy Research Laboratory (2019A-0305; PI: Drlica-Wagner), which is operated by the Association of Universities for Research in Astronomy (AURA) under a cooperative agreement with the National Science Foundation.
This manuscript has been authored by Fermi Research Alliance, LLC, under contract No. DE-AC02-07CH11359 with the US Department of Energy, Office of Science, Office of High Energy Physics. The United States Government retains and the publisher, by accepting the article for publication, acknowledges that the United States Government retains a non-exclusive, paid-up, irrevocable, worldwide license to publish or reproduce the published form of this manuscript, or allow others to do so, for United States Government purposes.
Blanco, Gaia.
References
- Bechtol et al. (2015) Bechtol, K., Drlica-Wagner, A., Balbinot, E., et al. 2015, ApJ, 807, 50
- Bertin (2011) Bertin, E. 2011, in Astronomical Society of the Pacific Conference Series, Vol. 442, Astronomical Data Analysis Software and Systems XX, ed. I. N. Evans, A. Accomazzi, D. J. Mink, & A. H. Rots, 435
- Bertin & Arnouts (1996) Bertin, E., & Arnouts, S. 1996, A&AS, 117, 393
- Bressan et al. (2012) Bressan, A., Marigo, P., Girardi, L., et al. 2012, MNRAS, 427, 127
- Cerny et al. (2021) Cerny, W., Pace, A. B., Drlica-Wagner, A., et al. 2021, ApJ, 910, 18
- Chabrier (2001) Chabrier, G. 2001, ApJ, 554, 1274
- Clementini et al. (2019) Clementini, G., Ripepi, V., Molinaro, R., et al. 2019, A&A, 622, A60
- Darragh-Ford et al. (2020) Darragh-Ford, E., Nadler, E. O., McLaughlin, S., & Wechsler, R. H. 2020, arXiv e-prints, arXiv:2012.00099
- DES Collaboration (2018) DES Collaboration. 2018, ApJS, 239, 18
- Drlica-Wagner et al. (2015) Drlica-Wagner, A., Bechtol, K., Rykoff, E. S., et al. 2015, ApJ, 813, 109
- Drlica-Wagner et al. (2020) Drlica-Wagner, A., Bechtol, K., Mau, S., et al. 2020, ApJ, 893, 47
- Drlica-Wagner et al. (2021) Drlica-Wagner, A., Carlin, J. L., Nidever, D. L., et al. 2021, accepted to ApJS, arXiv:2103.07476
- Erkal & Belokurov (2020) Erkal, D., & Belokurov, V. A. 2020, MNRAS, 495, 2554
- Flaugher et al. (2015) Flaugher, B., Diehl, H. T., Honscheid, K., et al. 2015, AJ, 150, 150
- Foreman-Mackey et al. (2013) Foreman-Mackey, D., Hogg, D. W., Lang, D., & Goodman, J. 2013, PASP, 125, 306
- Fritz et al. (2018) Fritz, T. K., Battaglia, G., Pawlowski, M. S., et al. 2018, A&A, 619, A103
- Gaia Collaboration et al. (2021) Gaia Collaboration, Brown, A. G. A., Vallenari, A., et al. 2021, A&A, 649, A1
- Górski et al. (2005) Górski, K. M., Hivon, E., Banday, A. J., et al. 2005, ApJ, 622, 759
- Hansen et al. (2020) Hansen, T. T., Riley, A. H., Strigari, L. E., et al. 2020, ApJ, 901, 23
- Harris (1996) Harris, W. E. 1996, AJ, 112, 1487
- Hernquist (1990) Hernquist, L. 1990, ApJ, 356, 359
- Holl et al. (2018) Holl, B., Audard, M., Nienartowicz, K., et al. 2018, A&A, 618, A30
- Ji et al. (2016) Ji, A. P., Frebel, A., Chiti, A., & Simon, J. D. 2016, Nature, 531, 610
- Ji et al. (2021) Ji, A. P., Koposov, S. E., Li, T. S., et al. 2021, arXiv e-prints, arXiv:2106.12656
- Küpper et al. (2012) Küpper, A. H. W., Lane, R. R., & Heggie, D. C. 2012, MNRAS, 420, 2700
- Li et al. (2021) Li, H., Hammer, F., Babusiaux, C., et al. 2021, arXiv e-prints, arXiv:2104.03974
- Lindegren et al. (2021) Lindegren, L., Klioner, S. A., Hernández, J., et al. 2021, A&A, 649, A2
- Martin et al. (2008) Martin, N. F., de Jong, J. T. A., & Rix, H.-W. 2008, ApJ, 684, 1075
- Martínez-Vázquez et al. (2019) Martínez-Vázquez, C. E., Vivas, A. K., Gurevich, M., et al. 2019, MNRAS, 490, 2183
- Mau et al. (2019) Mau, S., Drlica-Wagner, A., Bechtol, K., et al. 2019, ApJ, 875, 154
- Mau et al. (2020) Mau, S., Cerny, W., Pace, A. B., et al. 2020, ApJ, 890, 136
- Miyamoto & Nagai (1975) Miyamoto, M., & Nagai, R. 1975, PASJ, 27, 533
- Morganson et al. (2018) Morganson, E., Gruendl, R. A., Menanteau, F., et al. 2018, PASP, 130, 074501
- Mutlu-Pakdil et al. (2019) Mutlu-Pakdil, B., Sand, D. J., Walker, M. G., et al. 2019, ApJ, 885, 53
- Mutlu-Pakdil et al. (2020) Mutlu-Pakdil, B., Sand, D. J., Crnojević, D., et al. 2020, ApJ, 902, 106
- Nadler et al. (2021) Nadler, E. O., Drlica-Wagner, A., Bechtol, K., et al. 2021, Phys. Rev. Lett., 126, 091101
- Navarro et al. (1996) Navarro, J. F., Frenk, C. S., & White, S. D. M. 1996, ApJ, 462, 563
- Pace & Li (2019) Pace, A. B., & Li, T. S. 2019, ApJ, 875, 77
- Patel et al. (2020) Patel, E., Kallivayalil, N., Garavito-Camargo, N., et al. 2020, ApJ, 893, 121
- Pawlowski et al. (2012) Pawlowski, M. S., Pflamm-Altenburg, J., & Kroupa, P. 2012, MNRAS, 423, 1109
- Price-Whelan (2017) Price-Whelan, A. M. 2017, The Journal of Open Source Software, 2, doi:10.21105/joss.00388. https://doi.org/10.21105%2Fjoss.00388
- Riello et al. (2021) Riello, M., De Angeli, F., Evans, D. W., et al. 2021, A&A, 649, A3
- Roderick et al. (2015) Roderick, T. A., Jerjen, H., Mackey, A. D., & Da Costa, G. S. 2015, ApJ, 804, 134
- Sand et al. (2012) Sand, D. J., Strader, J., Willman, B., et al. 2012, ApJ, 756, 79
- Schlafly & Finkbeiner (2011) Schlafly, E. F., & Finkbeiner, D. P. 2011, ApJ, 737, 103
- Schlegel et al. (1998) Schlegel, D. J., Finkbeiner, D. P., & Davis, M. 1998, ApJ, 500, 525
- Sesar et al. (2017) Sesar, B., Hernitschek, N., Mitrović, S., et al. 2017, AJ, 153, 204
- Simon (2019) Simon, J. D. 2019, ARA&A, 57, 375
- Tonry et al. (2018) Tonry, J. L., Denneau, L., Flewelling, H., et al. 2018, ApJ, 867, 105
- Torrealba et al. (2019) Torrealba, G., Belokurov, V., Koposov, S. E., et al. 2019, MNRAS, 488, 2743
- Vasiliev & Baumgardt (2021) Vasiliev, E., & Baumgardt, H. 2021, arXiv e-prints, arXiv:2102.09568
- Vasiliev et al. (2021) Vasiliev, E., Belokurov, V., & Erkal, D. 2021, MNRAS, 501, 2279
- Weisz & Boylan-Kolchin (2017) Weisz, D. R., & Boylan-Kolchin, M. 2017, MNRAS, 469, L83
- Willman & Strader (2012) Willman, B., & Strader, J. 2012, AJ, 144, 76
Appendix A Posterior Distributions of Eridanus IV Parameters