Automated free energy calculation from atomistic simulations
Abstract
We devise automated workflows for the calculation of Helmholtz and Gibbs free energies and their temperature and pressure dependence and provide the corresponding computational tools. We employ non-equilibrium thermodynamics for evaluating the free energy of solid and liquid phases at a given temperature and reversible scaling for computing free energies over a wide range of temperatures, including the direct integration of - coexistence lines. By changing the chemistry and the interatomic potential, alchemical and upscaling free energy calculations are possible. Several examples illustrate the accuracy and efficiency of our implementation.
I Introduction
Free energies are crucial for thermodynamic analysis and provide valuable insight into the relative stability of phases and their coexistence.
The calculation of free energies from atomistic simulations is far from trivial, also because free energies cannot be expressed easily as thermodynamic averages that may be obtained in atomistic simulations directly.
Thermodynamic integration [1, 2] is widely employed to compute free energies.
In thermodynamic integration, the system of interest is related to a reference system with known free energy.
A parameter switches the energy of the system of interest to the reference system continuously and smoothly.
For example, the free energy of solids can be computed by transforming from a non-interacting Einstein crystal to a system of interest [3].
For liquids, reference systems such as the ideal gas [4, 5], or pair potentials like Lennard-Jones [6] or Uhlenbeck-Ford [7] are utilised.
Thermodynamic integration is computationally intensive because many separate calculations are required for discrete points along the non-physical path that connects the reference system to the system of interest [2].
Non-equilibrium approaches to thermodynamic integration [8], in which the system of interest is transformed to the reference system as a function of time, lead to significant improvements in computational cost and efficiency.
Non-equilibrium calculations for the computation of Helmholtz free energies have been applied to solids [9] and liquids [10] within the framework of the molecular dynamics code lammps [11].
Employing reversible scaling [12], non-equilibrium calculations are carried out over thermodynamic state variables by relating the switching parameter to temperature.
In this way, the variation of the Helmholtz free energy with temperature can be computed from a single non-equilibrium calculation starting from the Helmholtz energy at a reference temperature.
By scaling temperature and pressure simultaneously, - phase boundaries can be computed within a single simulation [13].
In practical applications of non-equilibrium methods, several simulations need to be combined, and parameters need to be set, which makes the computational procedure cumbersome for non-specialists. Therefore, automated protocols that efficiently carry out non-equilibrium thermodynamic integration and establish a bridge from atomistic simulations to thermodynamics are highly desirable.
A general workflow can be subdivided into four broad steps:
-
1.
evaluation of basic properties such as volume or pressure for the system of interest;
-
2.
setting of reference system parameters to resemble the system of interest as closely as possible;
-
3.
time-dependent switching between the system of interest and the reference system to compute the free energy;
-
4.
temperature sweep to calculate the temperature dependence of the Helmholtz or Gibbs free energy for constant volume, pressure or along pressure-temperature paths (i.e. for phase coexistence).
Several works implement parts of this workflow, but a general, automated approach is not available. This limits the widespread application of non-equilibrium methods for the computation of thermodynamic properties.
Here, we present an entirely automated workflow implementation, requires only minimal input and can be used to calculate both Helmholtz and Gibbs free energies.
The workflow has four main applications: (i) calculation of the Helmholtz and Gibbs free energy at a given temperature, (ii) Helmholtz/Gibbs free energy calculation as a function of temperature at constant volume/pressure, (iii) calculation of the pressure-temperature coexistence line of two phases, and (iv) free energy computation for alchemical changes and upscaling.
The workflow is suitable for single and multi-component systems, but configurational contributions to the free energy are not evaluated.
We demonstrate our automated workflow for calculating the pressure-temperature phase diagram of Ti using an embedded atom method (EAM) interatomic potential [14].
In particular, we use three alternative methods that our workflow implements for the computation of the phase diagram. For multi-component applications, we demonstrate the Helmholtz free energy calculation of a binary CuZr system [15].
Also, we present an algorithm for alchemical changes and upsampling in which the chemistry of the system or the interatomic potential in use is continuously transformed.
We demonstrate upsampling by transforming between a relatively computationally inexpensive EAM potential for Cu [16], and the more expensive, recently developed atomic cluster expansion (ACE) potential [17, 18].
Upsampling speeds up the free energy calculations by a factor of five, without loss of precision.
Furthermore, in the CuZr system, we employ alchemical transformations to integrate from Cu to Zr.
The remainder of the paper is organised as follows: in Section II, we discuss the non-equilibrium calculation of free energy, followed by the temperature dependence of free energy in Section III, and in Section IV, an algorithm for alchemical changes and upsampling is discussed. Finally, we demonstrate the application of the algorithms in Section V, discuss the practical implementation of the algorithms in the form of a Python program in Section VI, and conclude in Section VII.
II Non-equilibrium calculation of free energy differences
We assume that the Helmholtz free energy for an initial Hamiltonian is known and the target is the computation of the free energy for a final Hamiltonian . To this end, the two Hamiltonians are combined into the Hamiltonian with a parameter that continuously switches between the initial and final Hamiltonian,
| (1) |
The reversible work for switching along is given by [2]
| (2) |
If is varied as a function of time, the work done is given by,
| (3) |
where is the dynamic work done along the process, and . The time over which is switched, , is the switching time . The free energy difference is related to the dynamic work as,
| (4) |
with being the average dissipated energy. The energy dissipation depends on the rate at which the Hamiltonian is switched, with for . If the transformation is slow and close to an ideal quasistatic process, the dissipated energy when switching the system from the initial to the final state is the same as for switching from the final to the initial state [19]
| (5) |
and therefore
| (6) |
The magnitude of energy dissipation follows as,
| (7) |
For the computation of the Gibbs free energy difference in the isobaric ensemble only small modifications are necessary. We relate the initial and final Hamiltonians with parameter as before and include the dependence of pressure on , , with
| (8) |
The work done by switching is then obtained as
| (9) |
and for a quasistatic process
| (10) |
III Temperature dependence of the free energy
The temperature dependence of the free energy is computed in two steps. First, the free energy difference between a reference system and the system of interest at constant temperature is obtained. In a second step, the free energy of the system of interest at is taken as the starting point for a temperature sweep for the computation of the free energy in the interval from to . We implement temperature sweeps
-
1.
at constant volume,
-
2.
at constant pressure,
-
3.
along the pressure-temperature two-phase coexistence line.
III.1 Free energy at constant temperature
The starting point is a reference Hamiltonian for which the free energy is known. For the solid we use an Einstein crystal and for the liquid an ideal gas combined with the Uhlenbeck-Ford model [7]. In the Einstein crystal, the atoms are bound to reference positions, which means that the free energy is computed for the given atomic configuration and the configurational entropy is not included. This is different for the liquid reference. In the liquid, atoms are free to move and exchange and the configurational entropy is part of the calculation. The free energy of the reference systems is summarized in Appendix A. The combined Hamiltonian is then written as
| (11) |
and the integration over time is carried out from to . The free energy of the system of interest is obtained by switching at constant temperature and volume,
| (12) |
where is computed using Eq. (6). As the pressure for can be directly obtained, the Gibbs free energy may be calculated as . The evaluation of the free energy at constant temperature from a known reference is implemented in algorithm 1.
III.2 Temperature sweep
Next the free energy obtained in the previous section is taken as the initial free energy at the temperature and volume . We employ reversible scaling[12] to sweep the temperature at constant volume, constant pressure or along a - phase boundary.
Apart from and , by numerical differentiation entropy
| (13) |
and specific heat
| (14) |
are obtained.
III.2.1 Constant volume
For sweeping the temperature at constant volume we use the relation
| (15) |
where is obtained from scaling the Hamiltonian at constant temperature (Eq. (31)). The derivation of this expression is summarized in Appendix B. The temperature sweep is implemented in algorithm 2.
III.2.2 Constant pressure
III.2.3 - coexistence line
For sweeping temperature along the coexistence line first an initial coexistence point between two phases and is established, . Then scaling temperature and adapting pressure to continuously fulfill the Clausius-Clapeyron condition, a series of coexistence points is obtained. The necessary equations are summarized in Appendix B. The workflow is detailed in algorithm 3.
IV Alchemical changes and upsampling
For efficient defect formation free energies or for the computation of phase diagrams, alchemical changes and upsampling are useful. To this end, we provide algorithm 4 which continuously transforms atoms and atomic interactions from an initial system to the final system. Along the transformation path, each atom may change its chemistry as described by the potential energy and mass. The integration is separated into two steps. First, we evaluate the free energy difference between the initial and final system by changing atomic interactions along , but at constant atomic masses. We transform according to Eq. (11) and the integration over time is carried out from to . The free energy difference, , is then obtained from Eq. (6). In the second step, we consider the free energy change originating from the change in atomic masses. This contribution is given by,
| (17) |
as briefly summarized in Appendix B.4.
Given the free energy of the initial system, the free energy of the final system is given by,
| (18) |
If only the interatomic potential is changed along the path and the atomic masses remain constant, only the first step is necessary and the algorithm may be used for efficiently computing the free energy by starting from a less refined model of the same chemistry, similar in spirit to the upsampling in the TU-TILD approach [20].
V Applications
V.1 Convergence with system size and switching time
For analysing the dependence of the free energy on system size and switching time we use bcc Fe with an EAM potential [21]. We choose this particular system to facilitate comparison with Freitas et al. [9]. We calculate the free energy at 1000 K and zero pressure for the bcc structure using algorithm 1 for various system sizes ranging from 128 to 16000 atoms. The switching is carried out over 100 ps. The calculated free energy, , converges as a function of , where is the number of atoms in the system [22]. We can thus evaluate , the free energy at the thermodynamic limit through an asymptotic analysis of . The difference in free energy, , is shown in Fig. 1 (a), after taking into account corrections due to the fixed centre of mass [22]. From the figure, 3000 atoms are sufficient to obtain the free energy within an accuracy of 0.01 meV/atom.
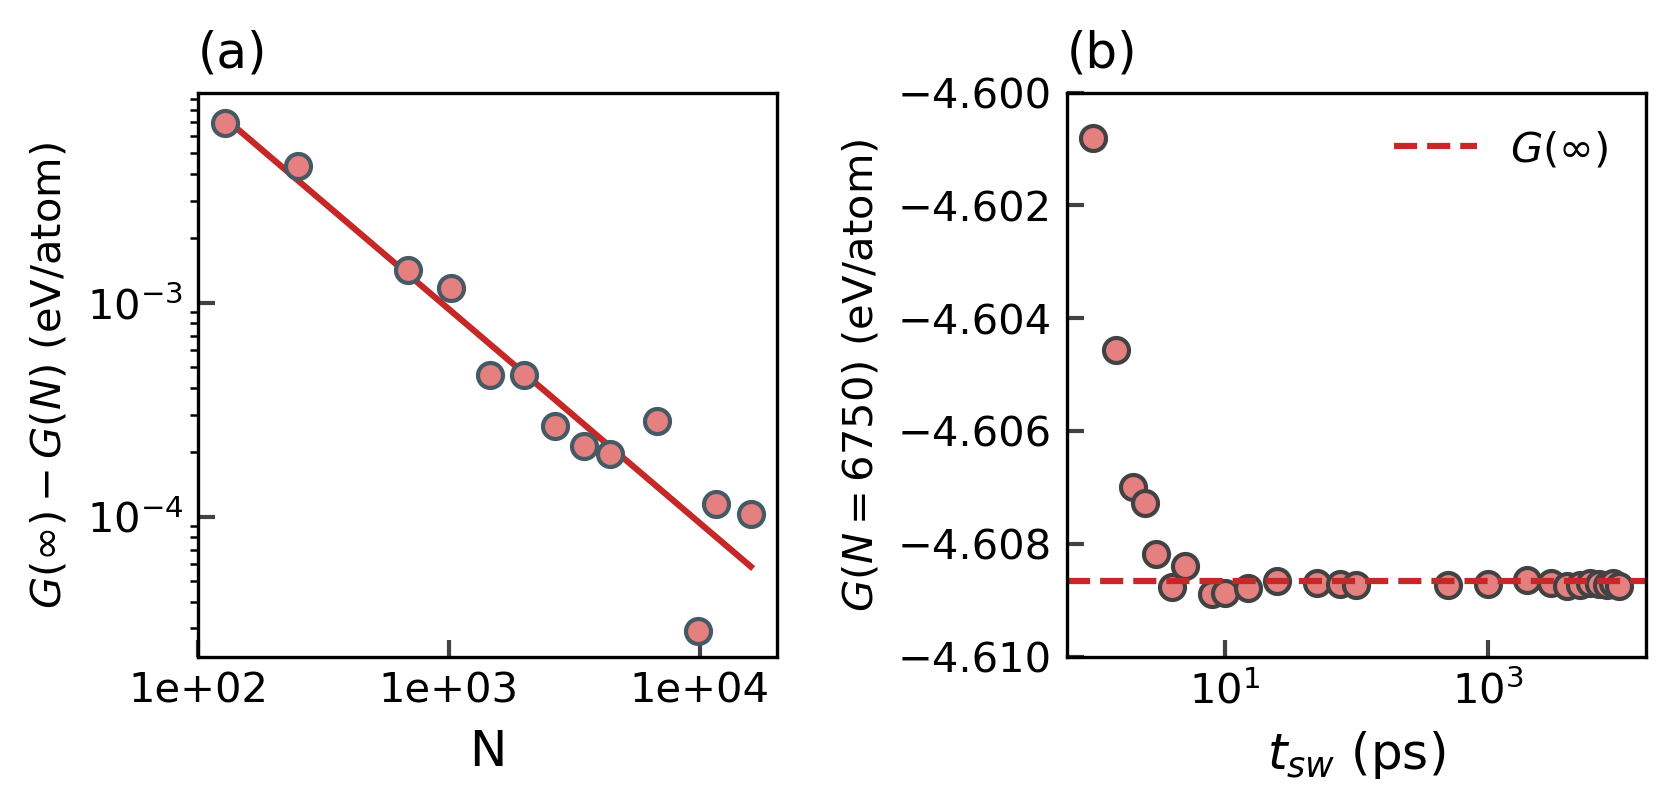
In Fig. 1 (b), we show the free energy with varying switching time from 1 ps to 10 ns. We use a bcc cell with atoms at a temperature of 1000 K and zero pressure. Even for the relatively short switching time of 50 ps, the free energy can be evaluated with a precision of 0.1 meV/atom. At 100 K, we obtain eV/atom over ns, which is in excellent agreement with Freitas et al. [9].
V.2 Pressure-temperature phase diagram for Ti
To illustrate the robustness and efficiency of the algorithms, we calculate the pressure-temperature phase diagram of Ti using an EAM potential [14]. We consider the bcc, hcp and liquid phases in the pressure range of 0-5 GPa and temperature range of 500-3000 K. The simulation cell consists of 4394 atoms for the bcc structure and 8878 atoms for the hcp and liquid phases.
Using the algorithms introduced in this work, we calculate the phase diagram using three different strategies. (i) We localize points of pairwise identical Gibbs free energy by sweeping temperature at constant pressure. This includes three steps:
-
•
Using algorithm 1 for the hcp and bcc phase, we calculate at K and pressures from 0 to 5 GPa in intervals of 0.25 GPa. For the liquid phase, is calculated over the same pressure range, but at a temperature of 1500 K. For all calculations, a switching time of 50 ps was used.
-
•
Starting from calculated in the previous step, we follow algorithm 2 to compute the dependence of the free energy on the temperature. For bcc and liquid phases, we scale the Hamiltonian of the system such that a temperature range up to 3000 K is covered. For hcp, the temperature range until 1500 K is traversed as the structure is unstable at higher temperatures.
-
•
At each pressure, from the crossings of the free energies as a function of temperature, the phase transition temperature is located.
The calculated phase diagram is shown in Fig. 2. The thermodynamic regions at which the bcc, hcp, and liquid phases are the most favourable energetically are red, green, and blue.
(ii) We use algorithm 3 to sweep the - coexistence lines directly. A prerequisite for algorithm 3 is a known coexistence point with . To this end, we use algorithm 2 to calculate initial coexistence points at a low pressure of 0.01 GPa for bcc-hcp ( K) and bcc-liquid ( K). From these points, algorithm 3 is used to scale the temperature up to 2200 K for bcc-liquid coexistence and 1000 K for the bcc-hcp coexistence over a time of 1 ns. The calculated coexistence lines are shown in grey in Fig. 2. The coexistence lines using algorithm 3 show excellent agreement with coexistence points computed in (i).
(iii) We verify that the free energies along the coexistence lines are indeed identical by carrying out calculations using algorithm 1. The calculated coexistence points are shown in grey circles for both the bcc-hcp and the bcc-liquid coexistence lines.
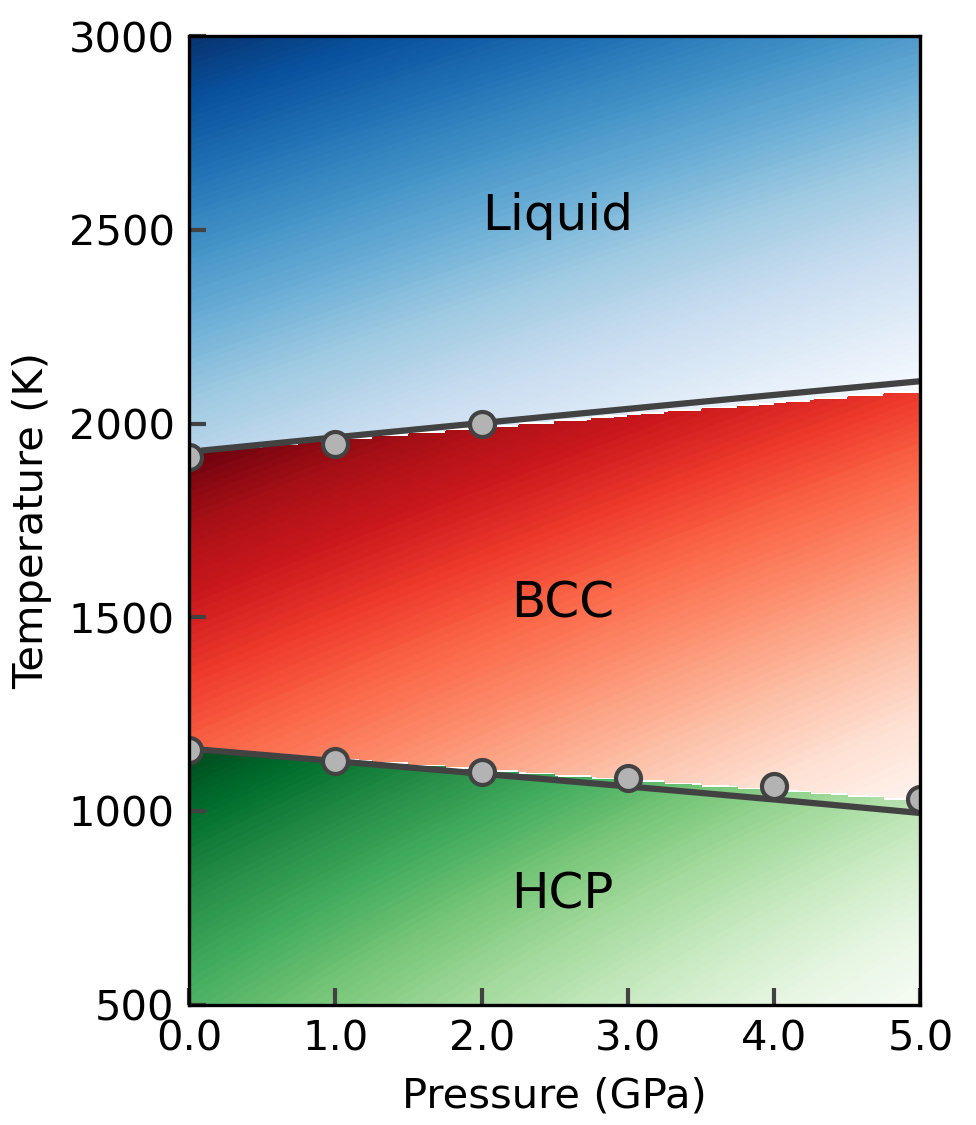
We predict the melting point of the bcc structure at zero pressure at 1913 K, in excellent agreement with the reported value (1918 K [14]. We compute the hcp-bcc phase transition temperature to be 1150 K. Our calculations are in good agreement with direct molecular dynamics simulations (1150 K), and lattice switch Monte Carlo method (1152 K) [14]. The phase, which appears in the experimental phase diagram [23] ( GPa, K), always has a higher free energy than the hcp structure as predicted by the EAM potential. In order to arrive at the complete phase diagram, only minimal user input, such as the required phases, and the corresponding temperature and pressure ranges are required.
V.3 Phase diagram of Si
The selection of an interatomic potential for a particular application requires the validation of the physical properties predicted by the model. For Si, a wide range of interatomic potentials were compared in order to assess their quality and transferability in Ref. 24. In addition, the calculation of phase diagrams can provide further insight into the quality of an interatomic potential. We calculate the pressure-temperature phase diagram of Si using different interatomic potentials. We consider five different potentials: Stillinger-Weber (SW) [25], angular dependent potential (ADP) [26], spectral neighbour analysis potential (SNAP) [27], Tersoff [28], and modified embedded atom method (MEAM) [29]. As an initial step to ascertain the validity of the potential, we calculate the melting temperature at zero pressure. We use 4096 atoms for both solid and liquid simulation cells and use a switching time of 50 ps. For the Tersoff potential, the calculated melting temperature is very low ( K), while for the MEAM potential it is very high ( K), compared to the experimental value of 1687 K. Therefore we do not consider Tersoff and MEAM for further calculations. The melting temperature for the SW potential is 1678 K, for ADP 1850 K and for SNAP 1405 K.
After calculating the melting temperature, we find the coexistence line between cubic diamond and liquid at various pressures. Additionally, we consider the -tin phase, which is a high-pressure polymorph in Si, and we estimate the coexistence line for cubic diamond – -tin and -tin – liquid. The calculated phase diagram is shown in Fig. 3. Note that we did not include the sc-16 phase which is known to be stabilized in the SW phase diagram [30] in contrast to experiments.
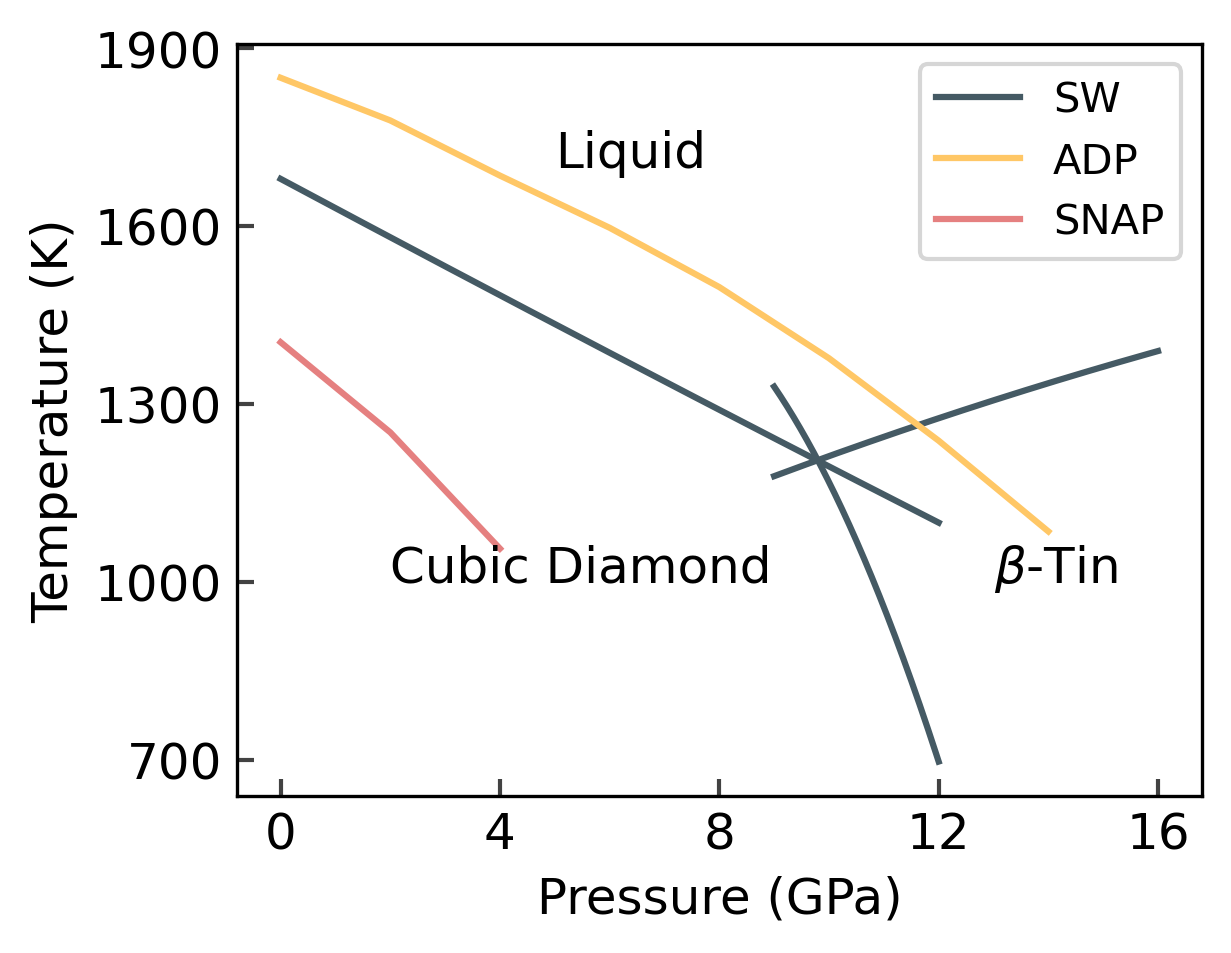
As shown in Fig. 3, the phase diagram predicted by the SW potential is in good agreement with previous results reported for the same potential [30]. Furthermore, our calculations predict the liquid – cubic diamond – -tin triple point at 9.8 GPa and 1205 K, in excellent agreement with previous calculations using the SW potential [30].
The ADP and SNAP potentials cannot predict coexistence of three phases, likely due to the exclusion of high-pressure phases during the development of the interatomic potentials. For ADP the only stable phases are cubic diamond and liquid and the system does not transform to -tin at high pressure. The cubic diamond-liquid coexistence line is overestimated by about 200 K at the range of pressures considered. The SNAP also does not exhibit a phase transformation into the -tin phase. The cubic diamond-liquid coexistence line is underestimated by about 300 K. Thus, our algorithms can be employed for efficient calculation of phase diagrams as predicted by different interatomic potentials, providing valuable information about the transferability of the potential at various thermodynamic conditions.
V.4 Calculation of specific heat
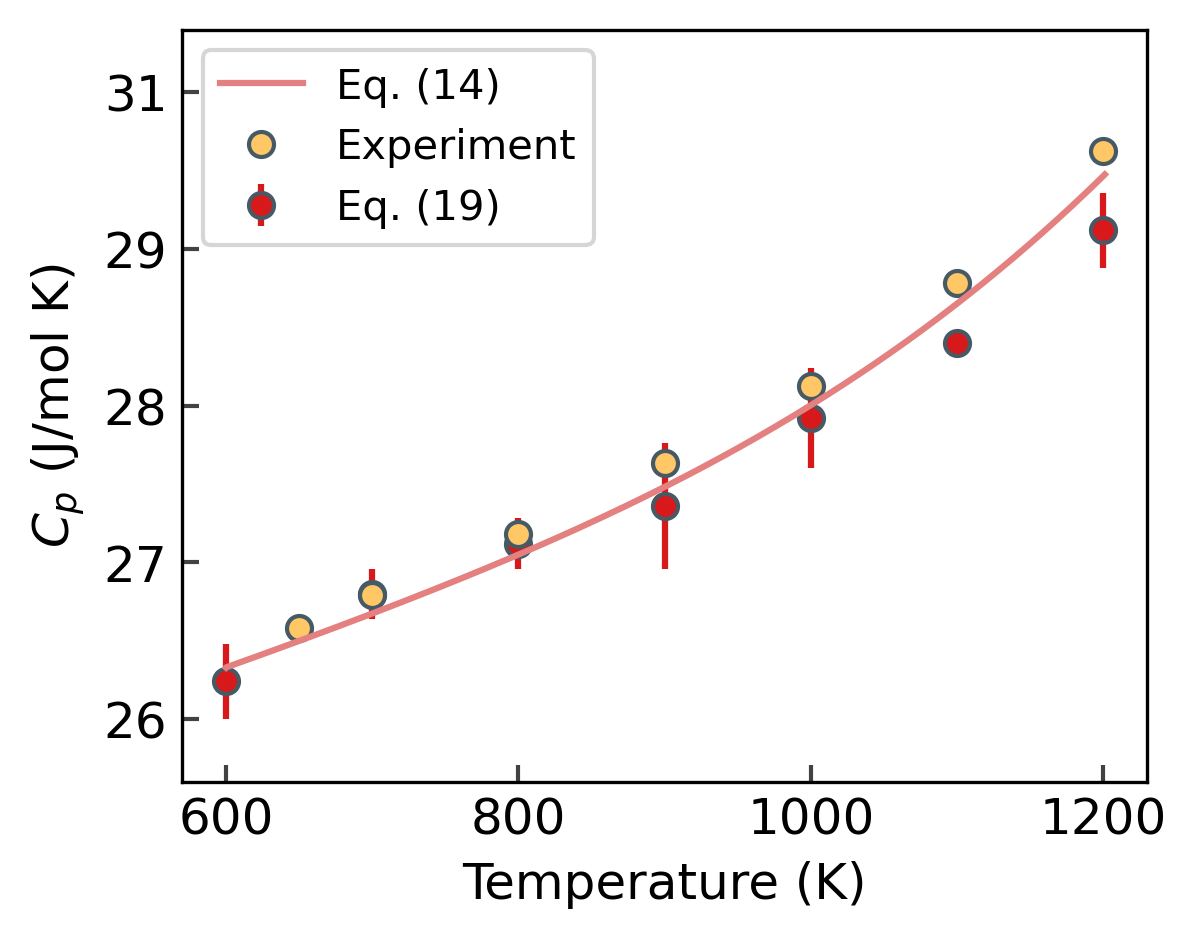
Algorithm 2 provides free energies as a function of temperature. Eq. (13) and Eq. (14) provide an efficient method to compute the specific heat. It is worthwhile to stress that there are no additional calculations required for ; it is directly available from algorithm 2.
Alternatively, can also be calculated from the fluctuations in the isothermal-isobaric ensemble by
| (19) |
where is the internal energy.
To illustrate the calculation of , we use an EAM potential [16] for Cu and compute the free energy as a function of the temperature using algorithm 2. We use a simulation cell with 4000 atoms at zero pressure and a temperature range of 600-1200 K. The switching is carried out over 1 ns. To compare with Eq. (19), we further run MD simulations in the NPT ensemble with a system size of 4000 atoms over the same temperature range at intervals of 100 K. For each temperature, the MD simulation was run for 1 ns, and five independent calculations were run for each temperature to estimate the error.
V.5 Gibbs free energy of the CuZr system
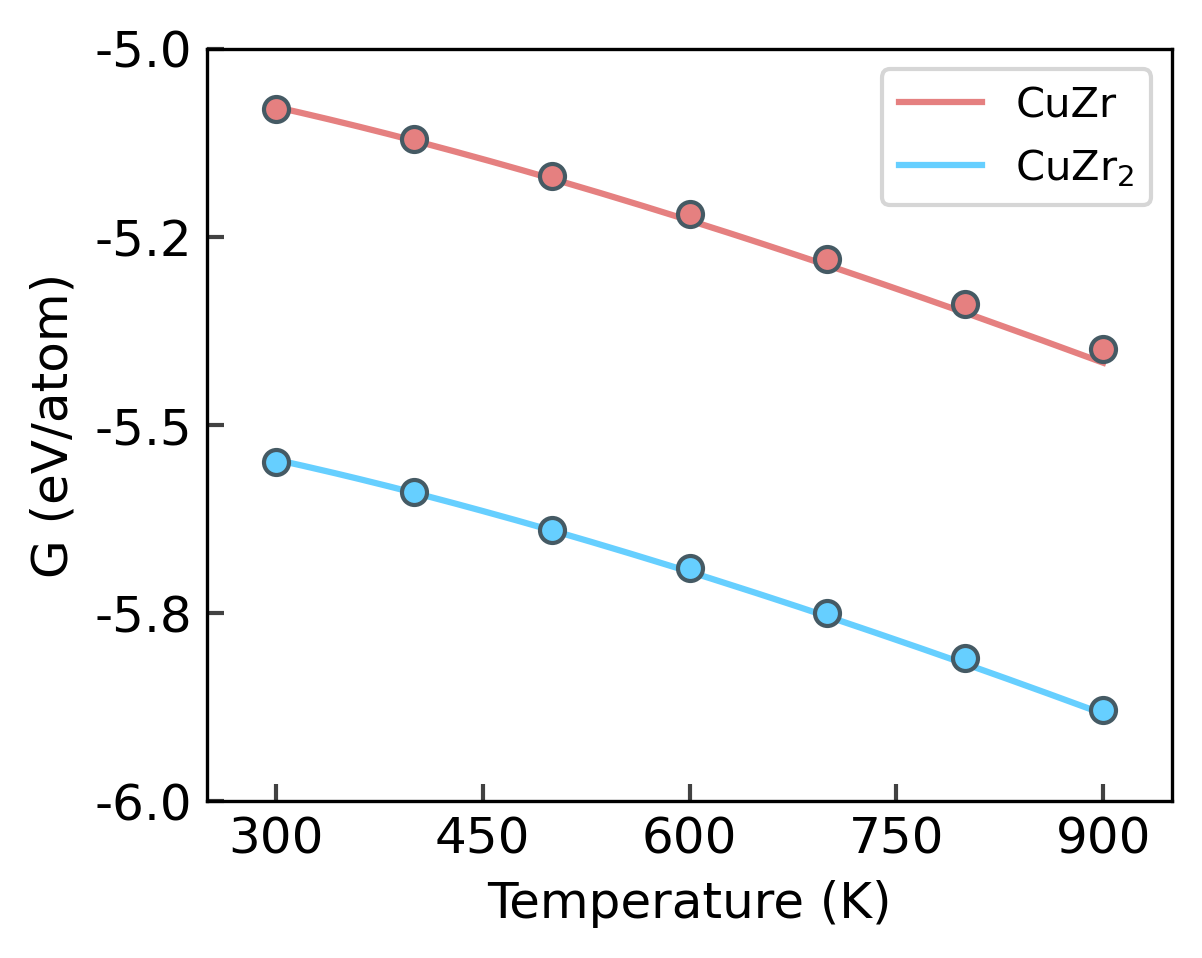
The algorithms presented in this work are applicable to multi-component materials, but exclude the computation of configurational entropy in the solid phase. We use CuZr as an example and calculate the free energy for both CuZr (B2 structure) and ( structure) using an EAM potential [15]. The simulation cells for CuZr and contain 2000 and 1472 atoms, respectively. We calculate the free energy in the temperature range from 300-900 K and zero pressure for both structures using algorithm 2. The calculated free energy is shown in Fig. 5 and compared to the results from Tang and Harrowell [32]. Our calculations agree very well with the reported values. By employing algorithm 2, however, it is possible to obtain the free energy over the whole temperature in a single simulation.
V.6 Alchemical changes and upsampling
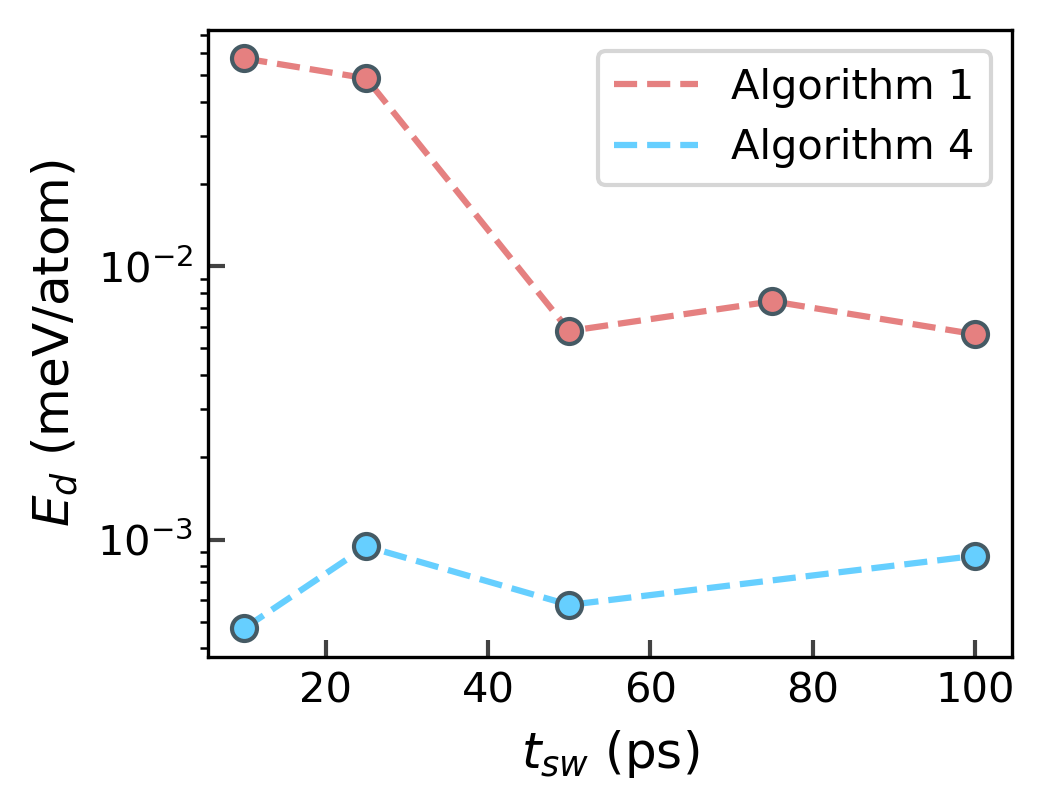
We demonstrate algorithm 4 using two examples. In the first example, we use upsampling in which a system is transformed between two interatomic potentials. Such a scenario is akin to algorithm 1, albeit with a more complex reference system, and is similar to the TU-TILD approach [20]. Here, we switch between a computationally cheap EAM potential and a relatively more expensive ACE potential. To obtain the free energy of Cu using the ACE potential at a temperature of 100 K and zero pressure, we follow two different routes as illustrated in Fig. 6. One approach is to evaluate the free energy directly starting from the reference Einstein crystal using algorithm 1. In the second approach, we compute the free energy of the Cu EAM potential before the ACE potential. Compared to ACE, the EAM potential is about two orders of magnitude faster. From the EAM potential, we use algorithm 4 to transform the system to the ACE potential. From the free energy difference, , during this transformation, we can calculate the free energy of Cu for the ACE potential, by . As shown in Fig. 6, we find that both routes arrive at the same result.
The advantage of using upsampling to estimate the free energy can be understood from Fig. 7. In Fig. 7, we show the energy dissipation, in work done during switching in the two routes discussed above: the energy dissipation during the calculation of for switching time of 10–100 ps is shown in red, the energy dissipation during upsampling is shown in blue. For all switching times considered, is lower for upsampling by at least an order of magnitude. The energy dissipation depends on the similarity of the two systems, and the Cu EAM potential is a more favourable reference state than the Einstein crystal. Thus, by using algorithm 1 to compute the free energy for the computationally inexpensive potential, and by switching it to the more expensive one, it is possible to obtain free energies from switching times as low as 10 ps. For a comparable accuracy, one needs at least 50 ps of switching time for the direct calculation with the more expensive potential.
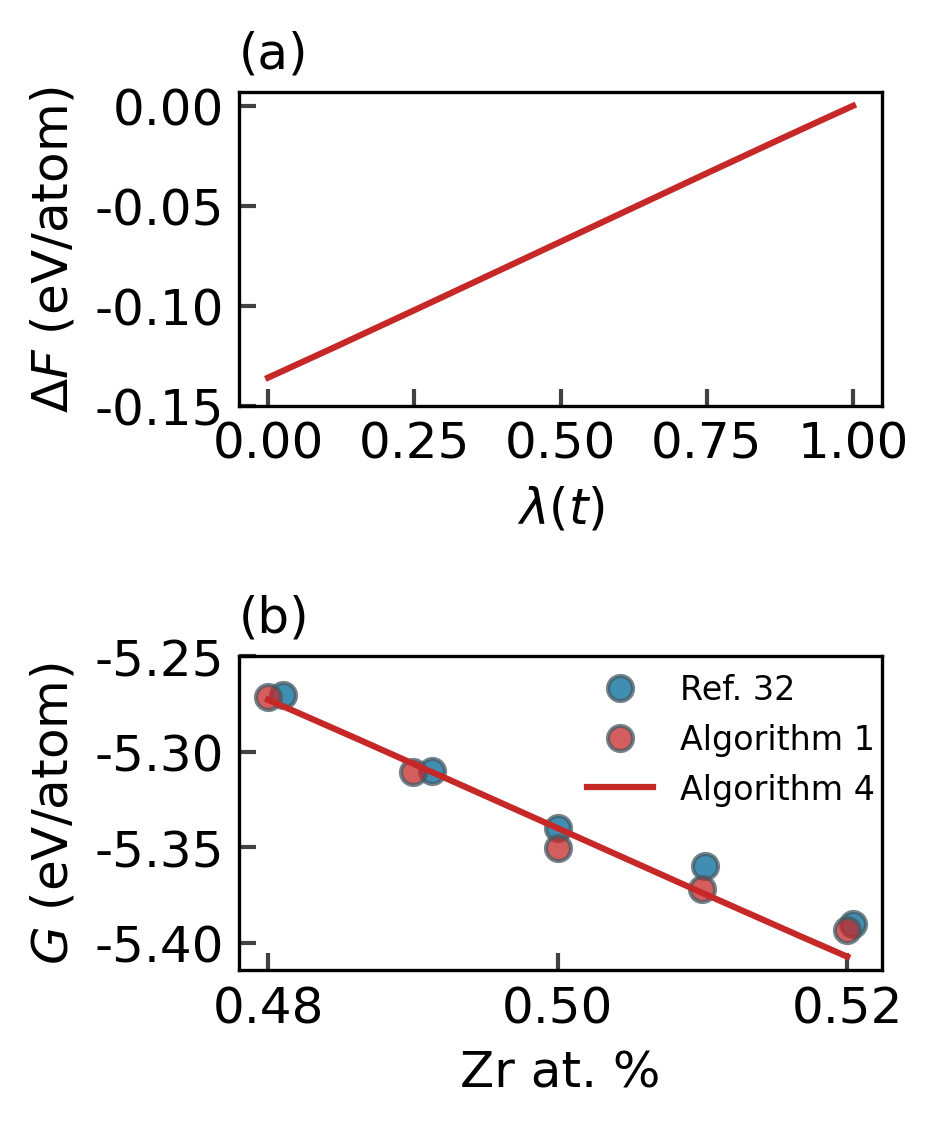
In the second example, we demonstrate the use of algorithm 4 for switching of chemical species. For the binary CuZr alloy in Section V.5, we start in B2 structure at 800 K, which is the experimentally observed stable crystal structure at this temperature. We randomly swap 2% of Zr atoms to Cu and use it as the initial state. We use algorithm 4 to switch to 52 at. % Zr. This particular concentration range was chosen to compare the free energy of the system to that reported by Tang and Harrowell [32] using the same interatomic potential. Along the integration path, the mass of the system is also transformed by adding a free energy contribution due to the change in kinetic energy as described in Appendix B.4. The system consists of 16000 atoms, and the alchemical switching is carried out over 100 ps. Additionally, we evaluate the free energy at different concentrations at the same temperature using algorithm 1.
In Fig. 8 (a), the cumulative reversible work along the integration path is shown, while in 8 (b), the free energy as a function of concentration along the integration path is shown. We find good agreement with the free energy reported by Tang and Harrowell [32] and calculations using Algorithm 1 even at intermediate points along the path (Zr at. % = 48 to 52).
VI Implementation
We provide a Python library, calphy, that includes all algorithms in this work. The library uses lammps [11] through the pylammpsmpi interface [33, 34] to carry out the molecular dynamics simulations. The library also provides a command-line interface, where the necessary input options are provided through a text file. The input file used for the calculation of the free energy of CuZr system in the temperature range of 300-900 K at 0 pressure (Section V.5) is shown in Fig. 9.
#elements element: [’Zr’, ’Cu’] #atomic mass mass: [91.224, 63.546] calculations: #calculation mode: temperature-sweep - mode: ts #required temperature range temperature: [300, 900] #required pressure pressure: [0] #file containing input crystal structure lattice: [ZrCu.data] #state of the system state: [solid] #number of independent simulations nsims: 3 md: #details of the inter-atomic potential pair_style: eam/fs pair_coeff: "* * ZrCu.eam.fs Zr Cu" #timestep for MD simulations timestep: 0.001 #thermostat and barostat damping tdamp: 0.1 pdamp: 0.1 #timesteps for equilibration run te: 25000 #timesteps for switching run ts: 50000
The input file contains basic information about the system, such as the elements used in the calculations and atomic weights, followed by the required calculations and molecular dynamics options in separate blocks.
In this case, we use algorithm 2 to calculate the free energy over the given temperature range.
The algorithm is specified under the mode keyword in the input file in the calculations block.
Further information, such as the temperature and pressure, is also provided in the same block.
The input structure to be used for the calculation is read in the lammps data format.
The input parameters pertaining to the molecular dynamics calculations are switched in the md block, which contains information about the interatomic potential, timestep, thermostat, and barostat damping coefficients, as well as the switching and equilibration time.
A detailed discussion of the input file is provided in the documentation of the library [35].
The switching function , which couples the system of interest and the reference system can have multiple functional forms as discussed in Appendix B.5.
In the case of solid systems, the switching between the system of interest and reference system is implemented using the fix ti/spring command [9] as implemented in lammps.
For liquid systems, the pair_style ufm command [7] within lammps is used to model the interatomic interactions in the Uhlenbeck-Ford model, for which the reference-free energy is calculated using the splines provided in Ref. 7.
In the case of algorithm 2, it is necessary to ensure that the system remains in its initial state (solid or liquid) and does not undergo a phase transformation as the Hamiltonian is scaled.
To this end, Steinhardt’s parameters [36] as implemented in the pyscal code [37] are used to detect the amount of solid or liquid particles in a given system.
As evident from the sample input configuration, calphy provides an automated way for free energy calculations with minimal user input. As classical MD simulations are utilised in calphy, only the vibrational contributions to the free energy are considered.
The calphy library is available in a public repository [38], along with a collection of examples, including those presented in this work.
VII Conclusion
We implement four different algorithms for the automated calculation of free energies. The algorithms can be applied in different scenarios, such as calculating free energies at constant temperature and pressure, calculating the free energy over a given temperature range, and the direct calculation of coexistence lines. We demonstrated the efficiency, accuracy, and user-friendliness of our implementation by calculating the complete pressure-temperature phase diagrams of Ti and Si. The algorithms can be also be employed for multi-component systems. Additionally, we present an algorithm for alchemical changes and upsampling which can efficiently calculate free energies over a given concentration range.
To facilitate the use of these algorithms, we provide a Python library and command-line program calphy. With the help of the framework provided, complex properties such as melting temperature or phase transition temperatures can be easily calculated.
Acknowledgements.
SM, YL and RD acknowledge financial support by the German Research Foundation (DFG) through project number 405621217. JR acknowledges financial support by the German Research Foundation (DFG) through the DFG Heisenberg Programme project 428315600. The authors acknowledge computing time by the Center for Interface-Dominated High Performance Materials (ZGH, Ruhr-Universität Bochum).Appendix A Reference free energy
A.1 Free energy of solids
The Frenkel-Ladd path [3] is commonly used to calculate the Helmholtz free energy in solids from the Einstein crystal. The Hamiltonian of the reference state is given by
| (20) |
where is the mass, the oscillator frequency and is the vector of particle from its equilibrium position. The Helmholtz free energy is given by
| (21) |
The spring constants needs to be estimated such that the vibrational frequencies are as close as possible to the solid of interest. A common approach [9] is to estimate from the mean-square displacement, , of the atoms
| (22) |
In addition, a correction due to the fixed centre of mass [22] needs to be added to the free energy;
| (23) |
A.2 Free energy of liquids
The choice of a reference system for a liquid is more complicated than for a solid. A typical reference system is the ideal gas. However, a direct switching path between a liquid and ideal gas can cross the liquid-vapour coexistence line, leading to hysteresis [39].
The Uhlenbeck-Ford (UF) [7] model can be used as a reference system [10]. The UF model is a purely repulsive pair potential with a single parameter. The interaction decays quickly and smoothly providing an advantage over the Lennard Jones potential in terms of truncation or long-range corrections. Furthermore, the UF model only has a stable liquid phase, preventing hysteresis associated with phase transformations. The UF model is given by
| (24) |
where is the inter-particle distance, the length scale and a non-negative scaling factor that controls the strength of the interaction. The free energy of the UF model is represented as,
| (25) |
The excess free energy of the UF model is expanded as
| (26) |
with and the number density . The reduced virial coefficients and can be computed exactly. An accurate numerical representation of the free energy using splines is available in literature [7]. The free energy of the ideal gas is given by
| (27) |
The concentration of species is denoted , is the de Broglie thermal wavelength
| (28) |
where is the Planck’s constant.
Appendix B Reversible scaling
Here, we summarise key formulae from Ref. 12. In reversible scaling, the Hamiltonian is linearly scaled to . The partition sum remains unchanged when and are scaled such that is constant. Or, in other words, the change of the Hamiltonian with has the same effect on the partition function as the scaling of the temperature to while keeping unchanged. If one further takes into account the temperature scaling in the kinetic energy and the definition of the Helmholtz free energy from the partition function as , one arrives at
| (29) |
where is the free energy of the scaled Hamiltonian. Therefore, from computing the Helmholtz free energy can be directly obtained, and scaling along provides the temperature dependence of . For the change of with on has
| (30) |
and
| (31) |
with and .
For the Gibbs energy at a given pressure , a scaling to changes the partition function in the isobaric ensemble in the same way as a scaling of temperature and pressure to and , therefore
| (32) |
This identity may be exploited to evaluate the Gibbs free energy along different pressure paths by assuming that the pressure changes with , . Then
| (33) |
and
| (34) |
Three different pressure paths will be illustrated in the following.
B.1 Constant pressure
For computing the temperature dependence of the Gibbs free energy at constant pressure, in Eq. (32) we change to on both sides so that it becomes
| (35) |
Therefore, for constant pressure simulations the pressure in the scaled Gibbs free energy needs to increase linearly with . Eq. (33) reads
| (36) |
and
| (37) |
B.2 Pressure as a function of temperature
We would like to compute the Gibbs free energy along a given - path. As the variation of the temperature is achieved through scaling with from a reference temperature , we use to indicate the varying temperature. Then from Eq. (32) we have
| (38) |
with the scaled pressure
| (39) |
and Eq. (33) reads
| (40) |
with
| (41) |
B.3 - coexistence
The - scaling may be used for tracking the coexistence boundary between two phases [13]. We take as the line along which the Gibbs energy of two phases and are identical,
| (42) |
This means that
| (43) |
As we track the coexistence, a change of must maintain the condition
| (44) |
which from Eq. (40) implies
| (45) |
and provides a condition for the - coexistence path,
| (46) |
which is the Clausius-Clapeyron equation. From this, the pressure change along the coexistence line is obtained,
| (47) |
To make contact to non-equilibrium thermodynamics, the scaling parameter is varied with time and thermodynamic expectation values are replaced by instantaneous values,
| (48) |
and the pressure difference is estimated as
| (49) |
This defines the coexistence line in the scaled system. The coexistence pressure in the unscaled system at temperature may be obtained from Eq. (39) at by using and as
| (50) |
B.4 Kinetic energy contribution to the free energy
For the purpose of switching the chemistry along an integration path in algorithm 4, the mass of the required atoms also needs to change along the path. We assume that the mass does not change along the path, and add the kinetic energy contribution to the free energy.
The Hamiltonian of a system of particles is:
| (51) |
where and are the momenta and position of particle and is the potential energy. The corresponding Helmholtz free energy is,
| (52) |
is the de Broglie wavelength given by Eq. (28)
Upon a change of mass from to from the initial to final state, the corresponding de Broglie wavelength also changes, which leads to,
| (53) |
B.5 Switching function
The choice of the functional form of the switching function in algorithm 1 affects the energy dissipation during the switching process [40]. For algorithm 1 in solids, the fix ti/spring command in lammps [9] allows for two functional forms: (i) a linear function and (ii) a function of the form:
| (54) |
where is . This function has vanishing slopes at the ends of the switching process, and is shown to reduce the energy dissipation [40]. Similar to solids, we implement both functional forms for liquids, and provide the option to choose either of the functions. For the other algorithms, we employ a linear function for .
References
- Kirkwood [1935] J. G. Kirkwood, Statistical Mechanics of Fluid Mixtures, J. Chem. Phys. 3, 300 (1935).
- Frenkel and Smit [2001] D. Frenkel and B. Smit, Understanding Molecular Simulation, 2nd ed. (Academic Press, Inc., USA, 2001).
- Frenkel and Ladd [1984] D. Frenkel and A. J. C. Ladd, New Monte Carlo method to compute the free energy of arbitrary solids. Application to the fcc and hcp phases of hard spheres, J. Chem. Phys. 81, 3188 (1984).
- Hermans et al. [1988] J. Hermans, A. Pathiaseril, and A. Anderson, Excess free energy of liquids from molecular dynamics simulations. Application to water models, J. Am. Chem. Soc. 110, 5982 (1988).
- Mei and Davenport [1992] J. Mei and J. W. Davenport, Free-energy calculations and the melting point of Al, Phys. Rev. B 46, 21 (1992).
- Harvey et al. [2011] J.-P. Harvey, A. E. Gheribi, and P. Chartrand, Accurate determination of the Gibbs energy of Cu–Zr melts using the thermodynamic integration method in Monte Carlo simulations, J. Chem. Phys. 135, 084502 (2011).
- Paula Leite et al. [2016] R. Paula Leite, R. Freitas, R. Azevedo, and M. de Koning, The Uhlenbeck-Ford model: Exact virial coefficients and application as a reference system in fluid-phase free-energy calculations, J. Chem. Phys. 145, 194101 (2016).
- Watanabe and Reinhardt [1990] M. Watanabe and W. Reinhardt, Direct dynamical calculation of entropy and free energy by adiabatic switching, Phys. Rev. Lett. 65, 3301 (1990).
- Freitas et al. [2016] R. Freitas, M. Asta, and M. de Koning, Nonequilibrium free-energy calculation of solids using LAMMPS, Comput. Mater. Sci 112, 333 (2016).
- Paula Leite and de Koning [2019] R. Paula Leite and M. de Koning, Nonequilibrium free-energy calculations of fluids using LAMMPS, Comput. Mater. Sci 159, 316 (2019).
- Plimpton [1995] S. Plimpton, Fast Parallel Algorithms for Short-Range Molecular Dynamics, J. Comput. Phys. 117, 1 (1995).
- de Koning et al. [1999] M. de Koning, A. Antonelli, and S. Yip, Optimized Free-Energy Evaluation Using a Single Reversible-Scaling Simulation, Phys. Rev. Lett. 83, 3973 (1999).
- de Koning et al. [2001] M. de Koning, A. Antonelli, and S. Yip, Single-simulation determination of phase boundaries: A dynamic Clausius–Clapeyron integration method, J. Chem. Phys. 115, 11025 (2001).
- Mendelev et al. [2016] M. I. Mendelev, T. L. Underwood, and G. J. Ackland, Development of an interatomic potential for the simulation of defects, plasticity, and phase transformations in titanium, J. Chem. Phys. 145, 154102 (2016).
- Mendelev et al. [2009] M. Mendelev, M. Kramer, R. Ott, D. Sordelet, D. Yagodin, and P. Popel, Development of suitable interatomic potentials for simulation of liquid and amorphous cu–zr alloys, Philos. Mag. 89, 967 (2009).
- Mishin et al. [2001] Y. Mishin, M. J. Mehl, D. A. Papaconstantopoulos, A. F. Voter, and J. D. Kress, Structural stability and lattice defects in copper: Ab initio , tight-binding, and embedded-atom calculations, Phys. Rev. B 63, 224106 (2001).
- Lysogorskiy et al. [2021] Y. Lysogorskiy, C. van der Oord, A. Bochkarev, S. Menon, M. Rinaldi, T. Hammerschmidt, M. Mrovec, A. Thompson, G. Csányi, C. Ortner, and R. Drautz, Performant implementation of the atomic cluster expansion (PACE) and application to copper and silicon, Npj Comput. Mater. 7, 1 (2021).
- Drautz [2019] R. Drautz, Atomic cluster expansion for accurate and transferable interatomic potentials, Phys. Rev. B 99, 014104 (2019).
- de Koning [2005] M. de Koning, Optimizing the driving function for nonequilibrium free-energy calculations in the linear regime: A variational approach, J. Chem. Phys. 122, 104106 (2005).
- Duff et al. [2015] A. I. Duff, T. Davey, D. Korbmacher, A. Glensk, B. Grabowski, J. Neugebauer, and M. W. Finnis, Improved method of calculating ab initio high-temperature thermodynamic properties with application to zrc, Phys. Rev. B 91, 214311 (2015).
- Meyer and Entel [1998] R. Meyer and P. Entel, Martensite-austenite transition and phonon dispersion curves of studied by molecular-dynamics simulations, Phys. Rev. B 57, 5140 (1998).
- Polson et al. [2000] J. M. Polson, E. Trizac, S. Pronk, and D. Frenkel, Finite-size corrections to the free energies of crystalline solids, J. Chem. Phys. 112, 5339 (2000).
- Gu et al. [1994] G. Gu, Y. K. Vohra, and K. E. Brister, Phase transformation in titanium induced by laser heating at high pressure, SCR Metall. Mater. 31, 167 (1994).
- Lysogorskiy et al. [2019] Y. Lysogorskiy, T. Hammerschmidt, J. Janssen, J. Neugebauer, and R. Drautz, Transferability of interatomic potentials for molybdenum and silicon, Model. Simul. Mat. Sci. Eng. 27, 025007 (2019).
- Stillinger and Weber [1984] F. H. Stillinger and T. A. Weber, Packing structures and transitions in liquids and solids, Science 225, 983 (1984).
- Starikov et al. [2020] S. Starikov, I. Gordeev, Y. Lysogorskiy, L. Kolotova, and S. Makarov, Optimized interatomic potential for study of structure and phase transitions in si-au and si-al systems, Comput. Mater. Sci 184, 109891 (2020).
- Zuo et al. [2020] Y. Zuo, C. Chen, X. Li, Z. Deng, Y. Chen, J. Behler, G. Csányi, A. V. Shapeev, A. P. Thompson, M. A. Wood, and S. P. Ong, Performance and cost assessment of machine learning interatomic potentials, J. Phys. Chem. A 124, 731 (2020).
- Tersoff [1988] J. Tersoff, Empirical interatomic potential for silicon with improved elastic properties, Phys. Rev. B 38, 9902 (1988).
- Lee [2007] B.-J. Lee, A modified embedded atom method interatomic potential for silicon, Calphad 31, 95 (2007).
- Romano et al. [2014] F. Romano, J. Russo, and H. Tanaka, Novel stable crystalline phase for the stillinger-weber potential, Phys. Rev. B 90, 10.1103/physrevb.90.014204 (2014).
- White and Collocott [1984] G. K. White and S. J. Collocott, Heat capacity of reference materials: Cu and w, J. Phys. Chem. Ref. Data 13, 1251 (1984).
- Tang and Harrowell [2012] C. Tang and P. Harrowell, Predicting the solid state phase diagram for glass-forming alloys of copper and zirconium, Journal of Physics: Condensed Matter 24, 245102 (2012).
- Janssen et al. [2019] J. Janssen, S. Surendralal, Y. Lysogorskiy, M. Todorova, T. Hickel, R. Drautz, and J. Neugebauer, pyiron: An integrated development environment for computational materials science, Comput. Mater. Sci 163, 24 (2019).
- Janssen and Menon [2021] J. Janssen and S. Menon, pyiron/pylammpsmpi: Open source release (2021).
- [35] Documentation for calphy, https://calphy.readthedocs.io/.
- Steinhardt et al. [1983] P. J. Steinhardt, D. R. Nelson, and M. Ronchetti, Bond-orientational order in liquids and glasses, Phys. Rev. B 28, 784 (1983).
- Menon et al. [2019] S. Menon, G. D. Leines, and J. Rogal, pyscal: A python module for structural analysis of atomic environments, J. Open Source Softw. 4, 1824 (2019).
- [38] calphy, https://github.com/ICAMS/calphy.
- Abramo et al. [2015] M. C. Abramo, C. Caccamo, D. Costa, P. V. Giaquinta, G. Malescio, G. Munaò, and S. Prestipino, On the determination of phase boundaries via thermodynamicintegration across coexistence regions, J. Chem. Phys. 142, 214502 (2015).
- de Koning and Antonelli [1996] M. de Koning and A. Antonelli, Einstein crystal as a reference system in free energy estimation using adiabatic switching, Phys. Rev. E 53, 465 (1996).