Resolved nuclear kinematics link the formation and growth of nuclear star clusters with the evolution of their early and late-type hosts
Abstract
We present parsec-scale kinematics of eleven nearby galactic nuclei, derived from adaptive-optics assisted integral-field spectroscopy at (near-infrared) CO band-head wavelengths. We focus our analysis on the balance between ordered rotation and random motions, which can provide insights into the dominant formation mechanism of nuclear star clusters (NSCs). We divide our target sample into late- and early-type galaxies, and discuss the nuclear kinematics of the two sub-samples, aiming at probing any link between NSC formation and host galaxy evolution. The results suggest that the dominant formation mechanism of NSCs is indeed affected by the different evolutionary paths of their hosts across the Hubble sequence. More specifically, nuclear regions in late-type galaxies are on average more rotation dominated, and the formation of nuclear stellar structures is potentially linked to the presence of gas funnelled to the center. Early-type galaxies, in contrast, tend to display slower-rotating NSCs with lower ellipticity. However, some exceptions suggest that in specific cases, early-type hosts can form NSCs in a way similar to spirals.
1 Introduction
Nuclear star clusters (NSCs) are very compact and bright objects, with average sizes of about 3 pc (see the review by Neumayer et al., 2020). Their sizes, similar to globular clusters (GCs), combined with their higher masses, make them the densest known stellar systems. Observations of NSCs have proven very challenging since their first detection (Redman & Shirley, 1937; Babcock, 1939; Mayall & Aller, 1942). In addition to their small size, they are embedded in the bright central region of their host, and require high spatial resolution to be disentangled as a different morphological component (e.g., Light et al., 1974). While later studies showed that many nearby galaxies of different Hubble types host NSCs (e.g., Caldwell, 1983; Kormendy & Djorgovski, 1989; van den Bergh, 1995; Matthews & Gallagher, 1997), only with the resolution of the Hubble Space Telescope (HST) it was possible to find out that NSCs are actually present in most spiral and early-type galaxies (Carollo et al., 1998; Böker et al., 2002; Côté et al., 2006). We now know that most galaxies of all types between and M☉ host NSCs, which are also found in a majority of more massive spiral galaxies (Neumayer et al., 2020).
Once nucleation was revealed to be a common phenomenon in all kinds of galaxies, the formation of NSCs assumed a greater importance in the context of galaxy evolution. One possible formation scenario consists of the orbital decay of stellar clusters towards the galactic center, due to dynamical friction, and their subsequent merging. This was first proposed by Tremaine et al. (1975) and later supported by analytical and numerical studies (e.g., Capuzzo-Dolcetta, 1993; Oh & Lin, 2000; Lotz et al., 2001). On the other hand, in-situ star formation after gas infall to the center was proposed as an alternative (e.g., Mihos & Hernquist, 1994; Silk et al., 1987; Milosavljević, 2004; Bekki, 2015). By and large, NSC formation remains still unclear in spite of the following efforts.
Scaling relations between NSCs and the underlying galaxy, such as the NSC-to-galaxy mass relation, have clearly pointed to a tight connection of their formation and growth with the evolution of their host (e.g., Graham & Guzmán, 2003; Ferrarese et al., 2006). The nucleation fraction is highest for host stellar masses of about M☉, suggesting that the NSC formation mechanisms are most effective in this mass range (e.g., Sánchez-Janssen et al., 2019). This is true for both early and late-type galaxies, while the decline in nucleation for larger masses is sharp for ellipticals but not clear for massive late types (Neumayer et al., 2020). On the other hand, more massive galaxies ( M☉) seem to host denser nuclear stellar systems (Pechetti et al., 2020). Environmental effects may also play a role for early-type galaxies, which appear to be more frequently nucleated towards the central regions of galaxy clusters (e.g., Ferguson & Sandage, 1989; Lim et al., 2018).
Since different morphological types of galaxies are related to different evolution histories, it is natural to wonder whether they also form their NSCs in a different way. Stellar populations can give us important insight on this issue. In late-type galaxies, usually characterised by recent star formation, we observe a mix of nuclear stellar populations with the ubiquity of very young stars (e.g., Bothun et al., 1985; Rossa et al., 2006; Seth et al., 2006; Walcher et al., 2006; Kacharov et al., 2018). In early-type galaxies it is less clear how common young stars are. Their star formation was often quenched earlier, and their NSCs are often younger than their hosts but do not show signs of on-going star formation (e.g., Paudel et al., 2011; Spengler et al., 2017; Kacharov et al., 2018). Compared to their early-type hosts, they are more metal rich for host masses above M☉, but they are often more metal poor in the low-mass regime (e.g., Neumayer et al., 2020). No similar trend has been observed for late types, but here the picture is complicated by the absence of spectroscopic data in the low-mass regime.
Different observational results have been interpreted as arguments in favour of one or another formation scenario. The spatial distribution and the frequency of GCs in nucleated galaxies, as well as the low metallicity of NSCs of low-mass early types, point to the cluster migration scenario (e.g., Lotz et al., 2001; Capuzzo-Dolcetta & Mastrobuono-Battisti, 2009; Lim et al., 2018; Fahrion et al., 2020). On the other hand, the presence of very young populations, extended star formation histories and gradual chemical enrichment in NSCs hosted by late types, strongly support their in-situ formation (e.g., Seth et al., 2006; Walcher et al., 2006; Feldmeier-Krause et al., 2015; Kacharov et al., 2018). In addition, the inflow of molecular gas into the central parsecs from larger-scale structures such as bars, disks or rings was mapped in late-type spirals and proposed as the driving mechanism for nuclear starbursts (Schinnerer et al., 2003, 2006). However, the properties of NSCs in early and late-type galaxies are quite heterogeneous and there is no agreement yet on one dominant formation mechanism. Recent studies point to different origins for the NSCs in different galaxies, while more than one scenario could have played a role in the central region of one galaxy (e.g., Lyubenova et al., 2013; Guillard et al., 2016; Kacharov et al., 2018).
Stellar kinematics, which contain the footprint of the dynamical history of galactic structures, can provide additional constraints for the origin of NSCs. Kinematic maps provided by integral-field spectroscopy (IFS) have revealed that most NSCs rotate, albeit at different levels (Seth et al., 2008; Seth, 2010; Seth et al., 2010; Lyubenova et al., 2013; Nguyen et al., 2018; Lyubenova & Tsatsi, 2019; Fahrion et al., 2019). On the one hand, in-situ star formation from gas with high levels of angular momentum is often invoked to explain strong NSC rotation. On the other hand, more random motions and complex kinematic structures are usually associated with star-cluster inspiral (e.g., Seth et al., 2008; Seth, 2010; Seth et al., 2010; Hartmann et al., 2011; Nguyen et al., 2018). However, recent simulations have supported the idea that observed levels of rotation can be achieved even by star-cluster merging only (Tsatsi et al., 2017; Lyubenova & Tsatsi, 2019).
In this paper we provide a kinematic analysis of the nuclear regions of eleven galaxies across the Hubble sequence, and use it to assess whether a specific scenario is likely responsible for the NSC formation in early and late-type galaxies. The paper is organized as follows. In Sect. 2 we describe the galaxy sample. Section 3 gives the relevant information about the data set. In Sect. 4 we describe the methods used to perform the kinematic analysis. The results of this are presented in Sect. 5 and discussed in Sect. 6. We sum up our conclusions in Sect. 7. A more detailed description of the individual host galaxies and their nuclear kinematics, as well as a short discussion on the formation of their NSCs, are included in Appendix A.
2 The sample
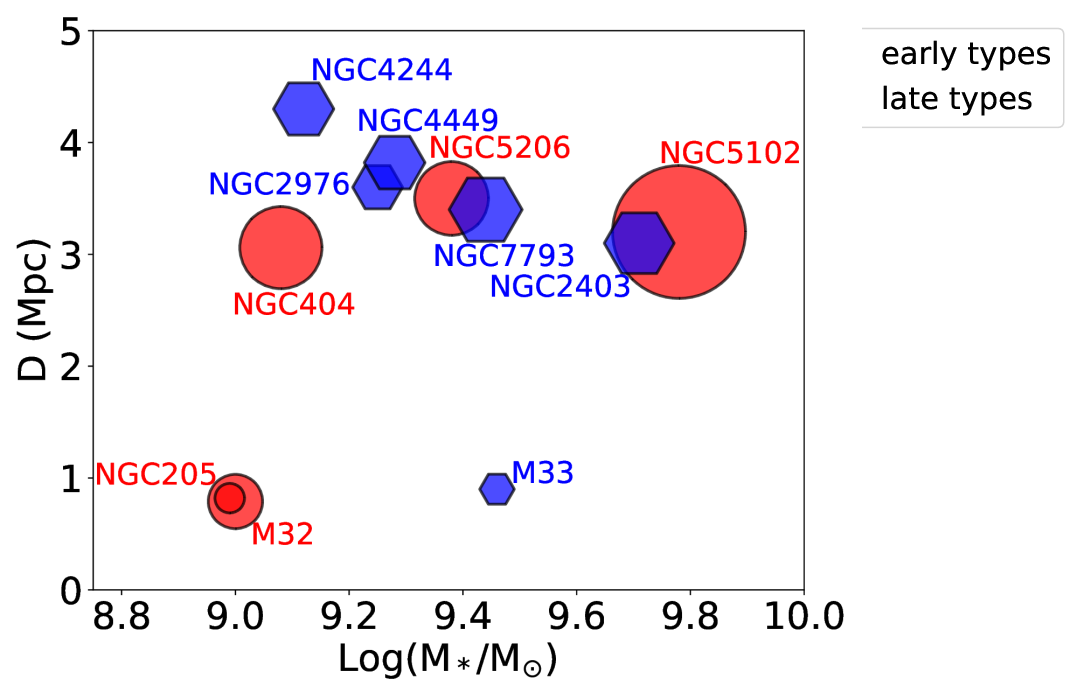
In this paper, we study the nuclear regions of eleven galaxies with previous NSC detection. The sample was selected to be sufficiently nearby (within a distance of 5 Mpc, see Fig. 1), to enable parsec-scale resolution, and to contain early and late Hubble types in roughly equal numbers. Host stellar masses range from 1 to M☉, as illustrated in Fig. 1. Additional relevant properties of the individual host galaxies and their NSCs are indicated in Table 1. The photometric properties of the NSCs ( and , respectively the effective radius and the Sérsic index) are important for our analysis (see Sect. 4.5), and we selected literature data in filters as close as possible in wavelength to our near-infrared (NIR) spectroscopic observations.
Hints of past interactions, such as warps, shells, tidal tails, and complex kinematic and morphological structures, are common across the sample (see Appendix. A). These galaxies generally contain gas, albeit at different levels of significance. This is true even for the early types, with the exception of M 32, which probably has been completely stripped of all gas by past strong interactions. Some early types, such as NGC 404, show extended and complex atomic-gas structures. As expected, our late-type spirals show intense on-going star formation and some of them show signs of gas inflow towards the center (e.g. galactic fountains in M 33 and NGC 2403). Additional details on the individual galaxies are given in Appendix. A.
| Galaxy name | Alternative name | Hubble type (1) | (Mpc) | ∗ ( M☉) | (pc) | |
|---|---|---|---|---|---|---|
| M 32 | NGC 221 | E | 0.79 (2) | 1.00 (2) | 4.4 (2) | 2.7 (2) |
| M 33 | NGC 598 | Scd | 0.9 (3) | 2.9 (6) | 1.8 (3) | 3.8 (3) |
| NGC 205 | M 110 | E | 0.82 (2) | 0.97 (2) | 1.3 (2) | 1.6 (2) |
| NGC 404 | UGC 718 | S0 | 3.06 (4) | 1.2 (4) | 10.1 (4) | 2.6 (4) |
| NGC 2403 | UGC 3918 | Scd | 3.1 (3) | 5.1 (7) | 7.3 (3) | 2.1 (3) |
| NGC 2976 | UGC 5221 | Sc | 3.6 (3) | 1.8 (7) | 3.7 (3) | 5.3 (3) |
| NGC 4244 | UGC 7322 | Scd | 4.3 (3) | 1.3 (8) | (3) | (3) |
| NGC 4449 | UGC 7592 | Irr | 3.82 (5) | 1.9 (8) | 5.5 (9) | |
| NGC 5102 | ESO 382-50 | S0 | 3.2 (2) | 6.0 (2) | 26.3 (2) | (2) |
| NGC 5206 | ESO 220-18 | S0 | 3.5 (2) | 2.4 (2) | 8.1 (2) | (2) |
| NGC 7793 | ESO 349-12 | Sd | 3.4 (3) | 2.8 (7) | 7.9 (3) | 3.3 (3) |
-
•
Notes. (1) from NASA/IPAC Extragalactic Database (NED). NGC 205 and NGC 5206 are classified as dwarf ellipticals (dE) in other references (e.g., Caldwell, 1983; Zinnecker & Cannon, 1986). (2) Nguyen et al. (2018). and were obtained fitting HST images in the following filters: F814W for M 32, NGC 205 and NGC 5206, F547M for NGC 5102. For NGC 5206 and NGC 5102, whose NSCs were fitted with two Sérsic components, we adopted the integrated . Since is not available for the integrated NSC, we indicate both indices; (3) Carson et al. (2015). and were obtained fitting HST images obtained with the F153M filter. We show, for NGC 4244, the and of the two Sérsic components used to fit the NSC. (4) Seth et al. (2010). NGC 404’s total mass was estimated using the bulge-to-total luminosity and the bulge mass (Table 1 in Seth et al. 2010), and assuming a constant mass-to-light ratio. (5) Annibali et al. (2008). (6) McConnachie (2012). (7) de Blok et al. (2008). (8) Sheth et al. (2010). (9) Georgiev & Böker (2014).
3 Observations and data reduction
In this work we used IFS data in the band, corrected by adaptive optics (AO), of the inner arcsec of the eleven galaxies in our sample. We took advantage of facilities in both hemispheres that provide similar capabilities, namely Gemini North in Hawaii, and the Very Large Telescope (VLT) in Chile. Here we provide a summary of the two data sets, and how they were processed prior to the kinematic analysis.
3.1 NIFS data
We reanalyzed in a consistent way previously-published data from the Near-infrared Integral Field Spectrograph (NIFS) (McGregor et al., 2003) for M 32 (Seth, 2010), NGC 205 (Nguyen et al., 2018), NGC 404 (Seth et al., 2010), and NGC 4244 (Seth et al., 2008). In addition, we present new NIFS data for M 33, NGC 2403, NGC 2976 and NGC 4449. NIFS has a field of view (FoV) of 3 arcsec 3 arcsec and a spectral range between 0.95 and 2.4 m. It is mounted on the Gemini North eight-meter telescope and offers an AO mode thanks to the ALTAIR (ALTtitude conjugate Adaptive optics for the InfraRed) facility (Boccas et al., 2006). Laser-guide-star (LGS) AO was used for all galaxies except M 32, for which a natural guide star (NGS) was used.
Data reduction was performed using pipelines based on the Gemini version 1.9 IRAF packages, as described in Seth et al. (2008, 2010). The final cubes were created from several dithered cubes, that were previously telluric corrected and sky subtracted, using dedicated exposures collected just before or after observing the science object. For the merging of the dithered cubes into the final one, spaxels were rebinned to a size of 0.05 arcsec 0.05 arcsec. Detailed description of the observations and the data-reduction procedure can be found in Seth et al. (2008, 2010), Seth (2010), and Nguyen et al. (2018).
The point-spread function (PSF) is described, for the previously-published data, in the respective papers, cited at the beginning of this subsection. A two-step approach was used to fit the PSF. A first estimate came from images created from the telluric calibrator. Then, a convolution of a high-resolution HST image with this PSF allowed to refine the fit, by the comparison of these convolved images with the continuum images from NIFS observations. The best PSF choice was a double component in most cases, an inner Gaussian and an outer Moffat, while it was a simple Gaussian for NGC 4244 (see individual references for the details). We fitted in this work the PSF of M 33, NGC 2403 and NGC 2976, following the same approach but using a double Gaussian, that gave the best fit. The HST images used for the PSF fits were taken with the following two filters: F1042M for M 32 and M 33, and F814W for NGC 205, NGC 404, NGC 2403, NGC 2976 and NGC 4244. Parameters and references of all fits are indicated in Appendix D. We do not have any PSF measurement for NGC 4449. The complexity of its central region made it impossible to derive a PSF for our data cubes from optical images.
With a spectral resolution of , NIFS has an approximately Gaussian line-spread function (LSF), with an average full-width at half maximum (FWHM) of 4.36 Å (Seth et al., 2010). However, variations in the FWHM of % were found across the FoV. For this reason, the LSF was measured in each spaxel with the help of sky lines (as done e.g. by Seth et al. 2010), in order to achieve more accurate kinematic measurements (see Sect. 4.2).
The data cube of NGC 205 used in this work was star subtracted by Nguyen et al. (2018) to minimize the impact of individual bright stars on the integrated kinematics. Their light was subtracted from the data cubes using PampelMuse (Kamann, 2018), as explained in detail in Nguyen et al. (2018; 2019). Following the same procedure, we obtained a star-subtracted cube also for M 33. While M 32 is located at a similar distance to NGC 205 and M 33, its very dense and bright NSC is crowded with individual stars as observed by NIFS. This made it impossible to use the same approach to subtract these individual stars.
3.2 SINFONI data
Observations of NGC 5102 and NGC 5206, performed with the Spectrograph for INtegral Field Observations in the Near Infrared (SINFONI) (Eisenhauer et al., 2003), were presented by Nguyen et al. (2018). We reanalysed this data in a consistent way and we added to the analysis new SINFONI observations for NGC 7793. SINFONI was mounted on the Unit Telescope (UT) 4 of the VLT and decommissioned in 2019. It offered AO-assisted observations (Bonnet et al., 2004) and the NGS mode was used for the corrections of our data cubes. SINFONI also has a FoV of 3 arcsec 3 arcsec, with a spaxel size of 0.05 arcsec 0.1 arcsec, covering a wavelength range from 1.1 to 2.45 m. Data reduction was performed using the ESO SINFONI pipeline, as explained in Neumayer et al. (2007) and Nguyen et al. (2018). The final cubes were obtained from a combination of several dithered exposures, after each one of them was corrected for the sky and telluric contaminations. Before being combined, SINFONI cubes were also corrected for additive residuals from the sky subtraction and velocity offsets between the individual data cubes, as explained in Nguyen et al. (2018).
The PSF was evaluated, with the same two-step procedure as for NIFS data (Sect. 3.1) but using two Gaussians for the fit, for NGC 5102 and NGC 5206 by Nguyen et al. (2018). F560W and F814W HST images were used respectively for the two galaxies. We derived the PSF for NGC 7793 following the same approach using an F153M-band HST image. PSF parameters are shown in Appendix D. SINFONI has a spectral resolution of . Since its LSF does not fit a Gaussian function, its actual shape was measured by Nguyen et al. (2018) for NGC 5102 and NGC 5206, and in this work for NGC 7793. The same approach was used for the three galaxies, using OH sky lines, that can be approximated to delta functions. Therefore, the shape of these lines after reaching the detector is a good approximation of the LSF. In fact, the shape of one of these lines when observed with SINFONI appears to be more centrally peaked than a Gaussian and shows broader wings. In addition, since the SINFONI LSF varies across columns in the detector, this procedure was followed for each row in the sky frames. A median spectral resolution of 6.32 Å was measured for NGC 7793.
4 Methods for the kinematic-analysis
We extract the nuclear stellar kinematics from NIFS and SINFONI data following a similar approach to Seth et al. (2008, 2010), Seth (2010), and Nguyen et al. (2018). They previously presented stellar-kinematic maps of the six published data cubes (see Sect. 3). For the sake of completeness and uniformity, we refitted the full sample using the set up described in this section. We used the range between 2.285 and 2.390 m, which includes the CO band-head absorption. This is the strongest absorption feature in galaxy spectra between 1 and 3 m. It is sharp and deep enough to be very sensitive to stellar kinematics. In this region of the spectrum the effects of dust are minimized and there is no emission from the sky (e.g., Silge & Gebhardt, 2003).
4.1 Voronoi binning
We performed a Voronoi tessellation to spatially bin the reduced and combined NIFS and SINFONI cubes, making use of the VorBin Python package111 https://pypi.org/project/vorbin/. The Voronoi-binning method was described in Cappellari & Copin (2003) and consists of a two-dimensional adaptive spatial binning to a minimum signal-to-noise ratio (S/N) around a target value. For NIFS data cubes, a variance cube was propagated through the data reduction process. The S/N of each spaxel was calculated as the ratio between the mean measured flux (S) and the square root of the mean variance spectrum (N) in the selected wavelength range ( m). For SINFONI data, with no available variance spectra, we used the mean measured flux (S) and the standard deviation (N) along the spectral direction, this time in the wavelength range between m, with no significant absorption features. Prior to the Voronoi binning, we set a spaxel S/N threshold of 1 (in the wavelength range used for the analysis), so that all spectra with noise larger than the signal were not binned and discarded from the analysis.
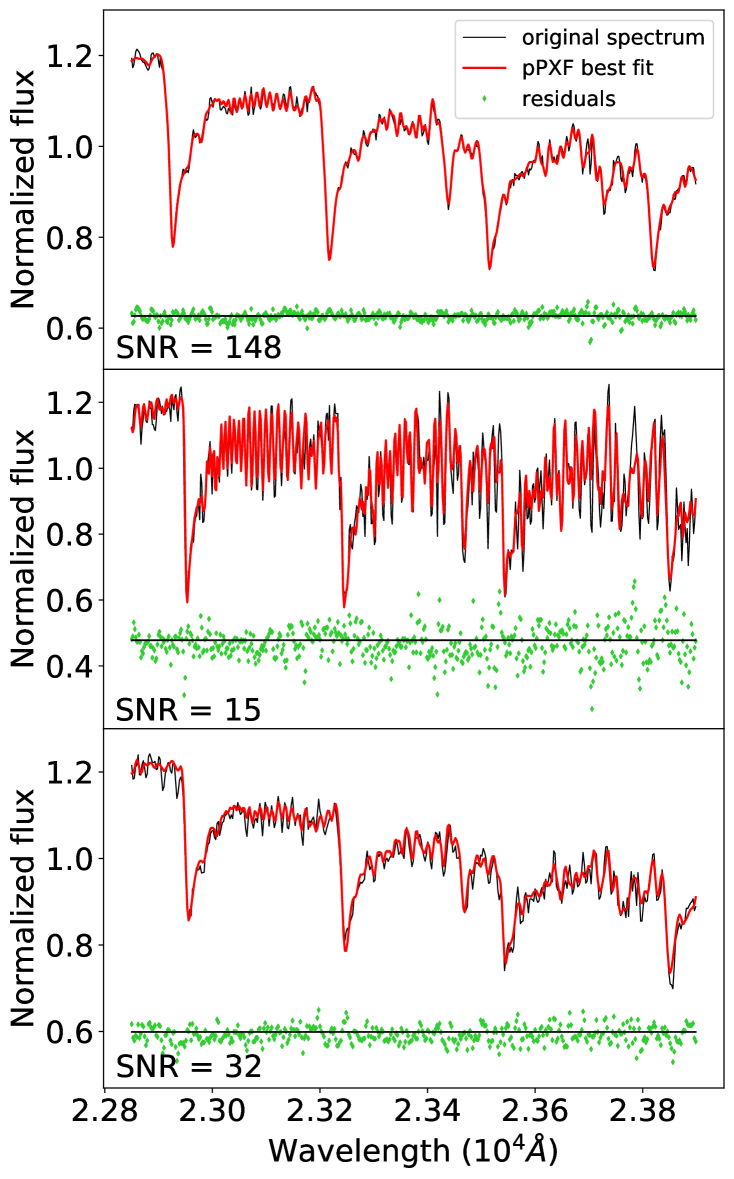
We initially binned all galaxies to a target S/N of 25 in our wavelength range. Aiming at a compromise between a spatial resolution good enough to see structures and an acceptable quality of the spectra, we rebinned the nuclei with lower surface brightness (NGC 2403, NGC 2976, NGC 4244 and NGC 4449) to a target S/N of 15. We checked that decreasing the S/N did not have a negative impact on the spectral fitting and on the obtained kinematic parameters. Uncertainties (Sect. 4.4) were for S/N = 15 similar or lower than for S/N = 25, in particular in the (central) region of the FoV where the Voronoi bins were smaller. Using this lower S/N allows us to recover rotation in some regions where it was blurred by larger bins. We still preferred to use S/N = 25 for the rest of galaxies, being more conservative when it comes to the goodness of the spectra especially in the outer regions, but reaching already a good compromise with spatial resolution. We show in Fig. 2 three examples of Voronoi-binned spectra with different S/N.
4.2 pPXF
We derived the kinematics of the eleven nuclei in our sample, using the Python implementation of the Penalized Pixel-Fitting (pPXF) method222 https://pypi.org/project/ppxf/ (Cappellari & Emsellem, 2004; Cappellari, 2017). This method selects and combines templates from a stellar library and convolves them with a line-of-sight velocity distribution (LOSVD) as a Gauss-Hermite series, to fit the observed spectra. We included in the fit the first four Gauss-Hermite moments and used an additive polynomial of fourth order. The “bias” pPXF parameter penalizes the higher moments of the LOSVD, when they are poorly constrained by the data. In that case, the LOSVD tends to a Gaussian and the higher moments are biased toward zero. We used the default pPXF bias , where is the number of spectral pixels left after masking the bad ones. This number, and then the bias-parameter value, slightly vary depending on the specific spectrum. The templates were convolved, to match the resolution of the observations, with the LSF measured for the specific Voronoi bin (see Sect. 3). This method provides us maps of mean velocity , velocity dispersion , skewness and kurtosis . We show in Fig. 2 three different examples of pPXF fits. They include spectra from both instruments and with different S/N.
4.3 Stellar Library
We initially fitted all galaxies with two different spectral libraries: the second data release (DR2) of the X-Shooter Library (XSL) (Gonneau et al., 2020) and the high-resolution spectra of cool stars from Wallace & Hinkle (1996) (hereafter W&H). The XSL was designed to cover most of the Hertzsprung-Russell diagram and includes in total 813 spectra of 666 stars. It covers a large range of spectral types and chemical compositions. Repeated observations were performed for luminous cool stars that were expected to vary in time. The spectra cover three contiguous wavelength segments between nm and m, at a spectral resolution . The W&H library, instead, provides eight suitable spectra of supergiant, giant, and main-sequence G to M-type stars, of different luminosity classes, at . This latter set of stars was used for the kinematic analysis by Seth (2010), Seth et al. (2010) and Nguyen et al. (2018).
The results obtained with the two spectral libraries were consistent between each other within the error estimates (Sect. 4.4). Therefore, the choice of the templates had to be based on the balance between spectral resolution, much higher in W&H, and number of stars, much higher for the XSL. With slightly lower uncertainties in the results, we finally decided to adopt results from the XSL, based on the following considerations. According to Silge & Gebhardt (2003), the importance of using a library with a large number of stars resides in the available large variety of CO-band equivalent widths. Stars in the XSL were selected to map the widest possible ranges of stellar parameters such as effective temperature and surface gravity, closely related to the equivalent widths (Gonneau et al., 2020). Although W&H templates span a large range of equivalent widths in the CO bands (See Table 5 in Wallace & Hinkle 1996), the range covered by XSL is much more extended and better sampled.
All spectra in the DR2 of the XSL were corrected for instrument transmission, telluric absorption, radial velocities and were provided in the rest frame (in air wavelengths) (Gonneau et al., 2020). From the entire XSL we picked only the spectra whose flux was corrected for slit losses (due to the narrow slit), since a non-corrected slope of the spectra might affect the full spectral fitting. We decided to include the repeated observations of variable stars, since they represent stars in different variability snapshots. We discarded the spectra with potential issues related to wavy continuum, artefacts or poor S/N in the band, or superposition of other objects in the line of sight (LOS) (as from Table B.1 in Gonneau et al. 2020). We finally gathered a set of 689 templates.
4.4 Uncertainties from Monte Carlo simulations
We estimated uncertainties for each of our kinematic parameters, by means of Monte Carlo (MC) simulations, as suggested by Cappellari & Emsellem (2004). We performed 1000 realizations for each one of the Voronoi bins. In each realization, we perturbed the observed spectra with wavelength-dependent random noise from a Gaussian distribution, since in real spectra noise is not constant in the spectral direction. The standard deviation of the Gaussian was set from the variance spectra for NIFS observations, and from the residual spectrum (see Fig. 2) for SINFONI data cubes (with no available variance spectra). We ran pPXF for each one of the 1000 perturbed spectra per Voronoi bin, now setting the bias parameter to 0.1. This allows for a more conservative estimate of errors as suggested by Cappellari & Emsellem (2004). Seth et al. (2014) and Nguyen et al. (2018) verified the robustness of errors obtained with this approach. Typical values of our uncertainties can be seen in all figures in Appendix A.
4.5 Ordered rotation vs Random motions
The ratio of ordered versus random motions in galaxies reveals whether these systems are supported by pressure or by rotation and can provide insights about their formation and evolution. The anisotropy diagram, as function of the observed ellipticity (), was first introduced by Illingworth (1977) and Binney (1978), to study whether there was a correlation between rotation and the apparent flattening of galaxies. The same diagram was later constructed for the 48 early-type galaxies in the SAURON sample (Cappellari et al., 2007). In addition, a new parameter was defined by Emsellem et al. (2007). It has a similar behaviour as but is also sensitive to the spatial distribution of the velocity, and is a proxy of the projected specific angular momentum. Emsellem et al. (2007) introduced a new classification of early-type galaxies, into fast and slow rotators, based on . These same and/or quantities were later measured for the larger samples of ATLAS3D (Emsellem et al., 2011), of SAMI (van de Sande et al., 2017a) and MaNGA galaxies (Greene et al., 2018; Graham et al., 2018). It was shown by the CALIFA collaboration how galaxies of different morphological types populate different regions of the and versus diagrams (Falcón-Barroso et al., 2019). A review was given by Cappellari (2016).
These diagrams have been also used to provide an idea of whether NSCs are dominated by rotation or random motions (Lyubenova & Tsatsi, 2019; Neumayer et al., 2020). In this work, we use them to investigate whether NSCs hosted by galaxies of different Hubble types lie in different regions of these diagrams in the same way as their host galaxies do. gives a more intuitive way of quantifying the rotational support of a galaxy or a NSC, because it derives directly from the tensor virial equations (Binney, 1978, 2005). However gives relatively strong weights to the central part where the flux is usually at its peak. On the other hand , via its radial weighing (see Eq. 2), can distinguish central rotation from more extended one, as well as being less dependent on inclination (Emsellem et al., 2007; Cappellari et al., 2007). For this reason we include both parameters in our analysis. We calculated , and , as luminosity-weighted averages over the area within the half-light () elliptical isophote of the NSC, using the following definitions from Cappellari et al. (2007) and Emsellem et al. (2007):
| (1) |
| (2) |
| (3) |
We applied these equations on a spaxel by spaxel basis, on a total number of spaxels within the elliptical isophote. and are respectively the velocity and the velocity dispersion of the i-th spaxel (athough calculated for the corresponding Voronoi bin, Sect. 4.2). is the i-th spaxel integrated flux in the original data cube. are the coordinates of the spaxels, with the origin in the nuclear-kinematic centre and rotated to be aligned respectively with the major and minor axis of the elliptical isophote. are the distances of spaxels from the center. We include in the calculation only spaxels within the ellipse, i.e. the elliptical isophote with an area equal to the circle (). In general, the and parameters are only rigorously meaningful for isolated systems and not sub-components of galaxies. In the following, we will assume that NSCs are sufficiently dense, hence contrasted above the background and fully dominating the local gravitational potential and light, that they can be modelled as isolated systems with good approximation (e.g. Hartmann et al., 2011). This will be further examined in Sect. 5.2.4.
We used the in Table 1, except for NGC 5102. This nucleus was fitted by Nguyen et al. (2018) with two Sérsic components with effective radii of 0.1 and 2.0 arcsec. Our NGC 5102’s kinematic maps do not cover the full region out to the integrated of 1.6 arcsec. We chose instead an elliptical isophote of area equal to a circle of a radius of 0.6 arcsec (Fig. 11). We aimed at finding a compromise between a significant coverage of the FoV and not too large and uncertainties. The selected radius allows us to include Voronoi bins with uncertainties lower than 17 and 20 km s-1, respectively for and , in 90% of the included spaxel. For NGC 4244 we gave in Table 1 the of the two Sérsic components used to fit the NSC. For the calculations, we used the arithmetic mean of the two values ( = 5.43 pc).
Uncertainties for , and were calculated via MC simulations. We performed here 500 realizations adding random Gaussian noise to the parameters in Eq. 1, 2 and 3. Each and was perturbed with a noise of the level of their corresponding uncertainties (see Sect. 4.4 and Fig. from 8 to 18). For , we took the mean standard deviation of each spectrum (as used in Sect. 4.4). For , and , we introduced some noise in the parameters used for their rotation and centering. For the position angle of the ellipse, we took the uncertainties from the isophote fitting, while for the position of the kinematic centre we estimated an error of 1 spaxel.
5 Results
5.1 Kinematic maps
For each nucleus in our sample, individual maps of the first four moments of the LOSVD and their uncertainties are shown and discussed in Appendix A. Our kinematic results are in excellent agreement with the previously-published maps obtained with the same data sets of M 32 (Seth, 2010), NGC 404 (Seth et al., 2010), NGC 4244 (Seth et al., 2008), NGC 205, NGC 5102 and NGC 5206 (Nguyen et al., 2018). Rotation is observed in all nuclei in our sample, independently of whether the host galaxy is an early or a late type. Sometimes this rotation is strong as in M 32, NGC 4244 and NGC 5102, with a maximum velocity between 30 and 60 km s-1, while in others it is not as significant (e.g. NGC 205 and NGC 4449 do not reach 10 km s-1). Some early-type galaxies display complex kinematic structures in their nuclear regions. This is the case of NGC 404, whose NSC is made up of two components: the most extended shows clear rotation, while the inner component counter-rotates (see Appendix A for more details). In NGC 205, we observe an offset between the rotation axis and the minor axis of the nucleus, perhaps suggesting the presence of a merger component.
Regarding the velocity dispersion in the very central region, we observe different behaviours that are clearly related to the mass of the central BH. M 32 and NGC 5102, with SMBHs of about M☉ (e.g., Seth, 2010; Nguyen et al., 2018), show a strong peak in their centers. In most of our nuclei, with a BH mass of about M☉(see Appendix A), we observe higher values in the central region but without a defined peak. Finally, we have a central drop for low BH masses ( M☉) or no BH detections (in M 33, NGC 205, and NGC 2976). A similar correlation of the central velocity dispersion with the BH mass was suggested, e.g., by dynamical modelling of GCs and ultra-compact dwarf galaxies (UCDs) (Voggel et al., 2018; Aros et al., 2020). On the other hand, galaxies with a SMBH do not show necessarily a central peak of velocity dispersion. The observed LOS depends as well on BH-unrelated factors, such as the galaxy mass and light distributions, the spatial resolution and the radial anisotropy (see also, e.g., McConnell et al. 2012).
Due to the penalisation against poorly-constrained non-zero values of and , introduced by pPXF (Sect. 4.2), a good determination of these higher moments requires a higher S/N than for and . We obtain good and maps only for some nuclei in our sample. Interestingly, we see a anticorrelation in some of the galaxies (M 32, M 33, NGC 404, NGC 4244, NGC 5102). This anticorrelation is usually observed in disk-like rotating structures, when superimposed in the LOS on slower or non-rotating components (van der Marel & Franx, 1993; Bender et al., 1994; Krajnović et al., 2008; Guérou et al., 2016; Pinna et al., 2019). For the rest of this discussion we focus on the more robust and measurements.
5.2 and diagrams and their interpretation
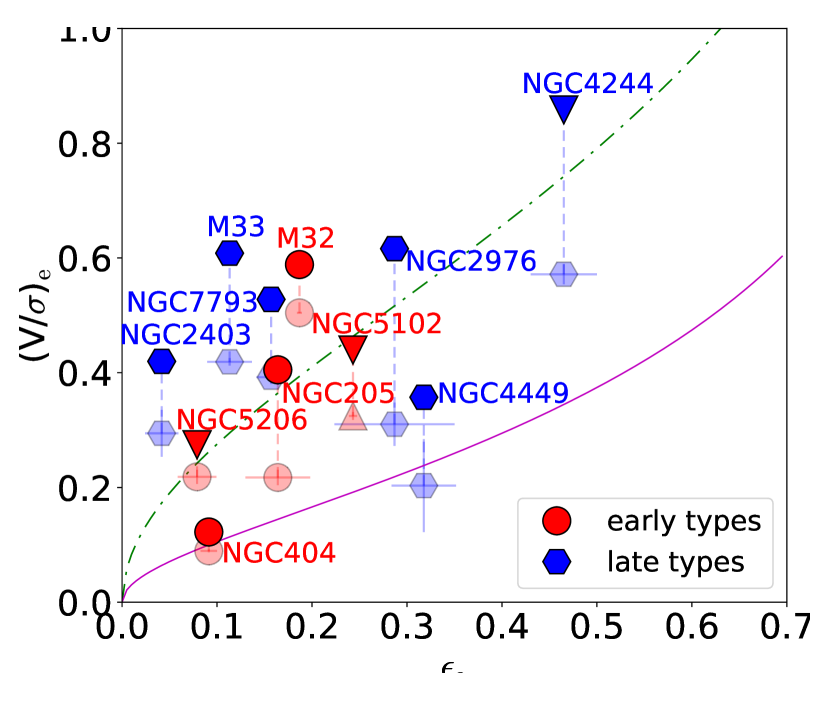
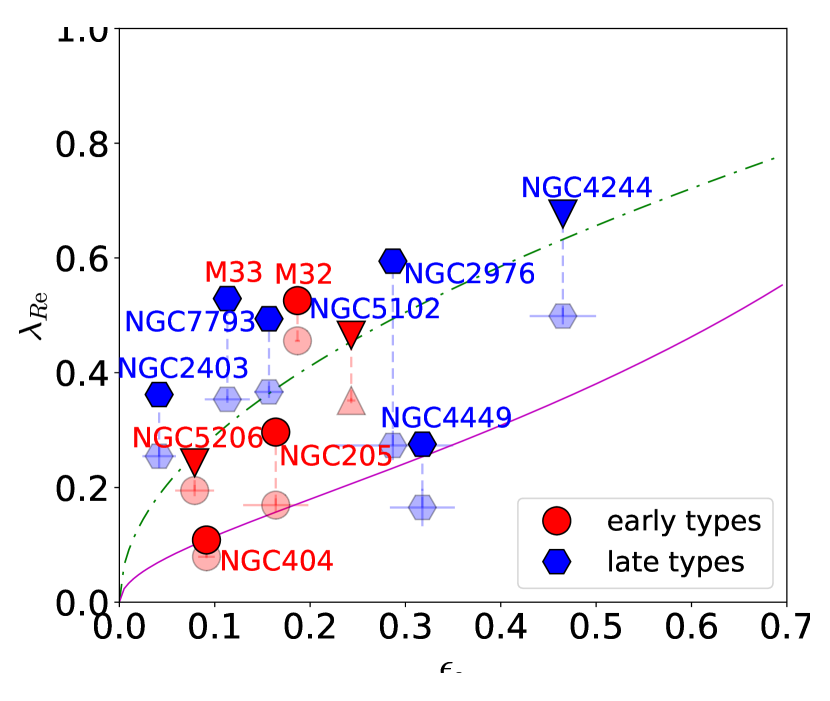
The radial distribution of is shown in Appendix B for each one of the eleven nuclei in our sample. Measurements of , and for our full sample are gathered in Table 2 (Appendix C). and are plotted as function of , respectively, in Fig. 3 and 4. Nuclei of early-type hosts are indicated in red and the ones in late types in blue. We show in Fig. 3 and 4 different lines, which were introduced for galaxies, as a reference to guide the reader’s eye. The magenta solid line is an approximation for edge-on galaxies with , where is the velocity anisotropy parameter (Binney & Tremaine 1987, Sect. 4.3) and is the intrinsic ellipticity. This line is in general the lower envelope of observed fast-rotating galaxies and was introduced by Cappellari et al. (2007). Lower inclinations move the magenta solid line towards the left side, as indicated by the grey dotted lines. Each grey dashed line corresponds to a value of and goes, decreasing inclination, from the magenta solid line towards the origin. The green dash-dotted line corresponds to “edge-on isotropic oblate rotators” (). It was introduced by Binney (1978) and updated for integral-field data in Binney (2005). Other roughly parallel lines towards higher would correspond to edge-on oblate galaxies with increasing velocity anisotropy .
As expected from the tight relation between and (Emsellem et al., 2007, 2011), the sample is distributed in a very similar way in Fig. 3 and 4. Five of the six nuclei hosted by late-type galaxies are distributed in the upper regions of the diagrams (above 0.25). Our five nuclei of early types are distributed all over the ranges of and , with three out of five points below 0.25. Therefore, on average, early-type galaxies in our sample show lower nuclear and than late types. Nuclei in early-type galaxies display also a lower average than late types, with values below 0.3 for the full subsample while the highest nuclear ellipticities correspond to late types.

However, this average trends have to be considered with caution. Firstly, the contrast of nuclei with respect to the underlying light components may be lower in early-type galaxies than in late types, having a larger bias on and values (see Sect. 5.2.4). This is the case for NGC 404, the lowest point in the diagrams and the one with the largest contamination from the host galaxy. This nucleus is moreover characterized by other peculiarities. The low and (measured within ) result from the LOS integration of two counter-rotating structures (see Sect. 5.1 and Appendix A). This nucleus (and the host) has also a low inclination, with a potential impact on the measured , and (Sect. 5.2.1). If we considered this point as an outlier, early and late-type galaxies would have a similar and distribution.
The three early-type nuclei in the bottom-left corner of the diagrams are characterised by slow observed rotation. Not only NGC 404 but also NGC 205 display complex kinematic structures. The nuclei of NGC 205 and NGC 5206, with similar and , show both slow rotation and low ellipticity. While also in the nucleus of NGC 205, we show evidence of different kinematic components, this is not found in NGC 5206 (Appendix A). Finally, there is one last point in the lower region of Fig. 3 and 4. NGC 4449, a late-type galaxy with low S/N in our nuclear observations and large error bars in the measured kinematic parameters, display and values similar to NGC 205 and NGC 5206. However, if we considered this point as an outlier, the trend with late-type galaxies covering the upper region of the diagrams, and early types being located all over the plane, would be much more clear.
Finally, two of the early-type nuclei lie in the region dominated by late types. They are hosted by M 32 and NGC 5102 and both show a strong disk-like rotation (and a peak in the center). Moreover, NGC 5102’s plotted values of and should be considered lower limits, as discussed later in 5.2.2. We consider M 32 and NGC 5102 two peculiar cases, as it is known from previous studies that they were spirals in the past (see Appendix A). Their NSCs probably bring the kinematic footprint of their former late-type host and therefore show similar properties to nuclei of late-type galaxies. This will be discussed better in Sect. 6.1.
We now discuss some of the impacts that complicate the interpretation of our and diagrams.
5.2.1 Inclination
The impact of inclination on the measured values of (therefore of and ) and , already tested by Emsellem et al. (2007) and Emsellem et al. (2011), is illustrated by the grey dotted and dashed lines in Fig. 3 and 4, referred to galaxies with . They show that is more affected by inclination in the upper half of the diagrams, while and are more affected in the leftmost region. However, each grey dotted line spans a large range of and (and ), indicating that inclination alone cannot explain the distribution of the global sample in the upper and lower regions of the diagrams.
Assuming that both NGC 4244 and its nucleus are seen edge on (Hartmann et al., 2011), inclination might be the main driven for the fact that this nucleus is located in the top-right regions of Fig. 3 and 4. NGC 404, the least-inclined galaxy in our sample (, del Río et al. 2004), hosts a nucleus that is located in the bottom-left corner. Apart from the two extreme cases, the rest of the hosts have intermediate-to-high inclinations with no clear correlation with the values of and . Nuclei in the bottom region (e.g. the one in NGC 205, with inclination , Nguyen et al. 2018) are not necessarily the ones with the lowest inclinations. The fact that the nucleus hosted by NGC 5206 ( inclined, Nguyen et al. 2018) is located in Fig. 3 close to the same dashed line as the one in NGC 5102 ( inclined, Nguyen et al. 2018), may suggest that the two galaxies might have similar intrinsic levels of rotations but observed at different inclinations. However, this does not happen in Fig. 4, where these two galaxies lie close to (dashed) lines with different intrinsic ellipticities.
Some blue hexagons, mostly in the upper half of the diagrams, correspond to relatively low host inclinations. An example is M 33’s nucleus, whose trajectory in the diagram if projected from its inclination (, assumed to be the same as the host galaxy) to the edge-on view was shown by Hartmann et al. (2011) in their Fig. 5. The nuclei of M 33 and NGC 2403, very similar galaxies (see Appendix A), lie relatively close to each other in the diagrams and their offset might be explained at least partially by their different inclination (independently of NGC 2403’s inclination, its nucleus shows almost round isophotes in Fig. 14).
5.2.2 Integration aperture
The integration aperture has also an impact on measured values of , and (e.g., Emsellem et al., 2007, 2011). In galaxies, a larger integration radius corresponds in general to a larger . However, this depends on the specific structure of galaxies, and later-type galaxies with an underestimated may lie in the same region of the diagram as galaxies with a larger bulge but with an overestimated (Harborne et al., 2019). Similarly, more disky NSCs with an underestimated might lie in the same region as more spherical or slower-rotating NSCs with an overestimated . At the same time, an overestimate of would lower the contrast of the NSC with respect to the underlying galaxy, affecting the self-consistency of the measurements (Sect. 5.2.4).
For NGC 5102 we used an aperture smaller than the ellipse, because the latter was not entirely covered by our data and due to the larger errors in the outer region of our FoV (Sect. 4.5). Therefore, we expect a bias towards lower values in our measurements of and . Aperture corrections were proposed by van de Sande et al. (2017b) to quantify this kind of bias for the SAMI and ATLAS3D galaxy surveys. However, as these corrections are PSF dependent and have only been applied to galaxies, they are likely inappropriate for NSCs. Thus we chose to conservatively treat the non-aperture corrected values of NGC5102 as lower limits and to indicate them with upwards triangles in Fig. 3, 4, 6 and 7.

5.2.3 PSF effects
Kinematic measurements are known to be affected by the PSF when this is of the order of the characteristic size of the galaxy (Greene et al., 2018; Graham et al., 2018; van de Sande et al., 2017a; Harborne et al., 2019, 2020). Beam smearing and atmospheric seeing result in observed lower rotation velocity and higher velocity dispersions in the central region of the FoV. Therefore, measurements of and are in general biased towards lower values. The impact of seeing is larger at scales comparable to the PSF and for galaxies with a higher amount of rotation (Harborne et al., 2019; van de Sande et al., 2017a; Graham et al., 2018).
Harborne et al. (2020) proposed analytic corrections to estimate the impact of the PSF in observational measurements of and in galaxies (Appendix D). While detailed modelling should be done in order to assess whether these corrections apply to the specific regime of galactic nuclei, and they might not be fully appropriate for a quantitative analysis, they provide a qualitative idea of the PSF effect. We have used them to estimate how important this impact is in our measurements. We include the details of the calculations and the results in Appendix D. The PSF corrections shift all nuclei upwards in the and plots (Fig. 20 and 21 in Appendix D). This effect is stronger for nuclei hosted by late-type galaxies (an increase of 60%) than for those in early types (40%, see also Table 2 in Appendix C). NGC 205 is an exception, with the largest PSF impact among early-type galaxies, mainly due to the small size of his NSC relatively to the PSF size. Nevertheless, the points remain similar in relative position to each other, and thus this correction does not significantly affect our conclusions.
5.2.4 The impact of the underlying galaxy
Our method is based on a LOS-integrated analysis of kinematics. Since NSCs are embedded in their host galaxy, kinematic measurements in the nuclear region are affected by all other components in the LOS. In this paper, we assume that the light from the NSC fully dominates the region within its and therefore the bias of our measurements due to the underlying galaxy is not significant.
We first tested this by deriving both the local (surface-brightness) and integrated (within an aperture) radial flux profiles of the NSCs relative to the background galaxy. For such an experiment, we used the surface brightness decomposition as available via Seth et al. (2010), Carson et al. (2015) and Nguyen et al. (2018), (as from the rightmost column in Table 1). In Fig. 5, we show the ratio of the local and integrated fluxes between the NSC and the background, for all galaxies in our sample except NGC 4449, with no surface brightness profiles available in the literature. Within 1 , those ratios are almost all above a value of 10, while only NGC 404 shows a ratio around 3 at that radius. This confirms that the NSCs fully dominate both the local and integrated flux budget within the 1 apertures.
The level of contamination on the measured values of and depends on many parameters, including the gradient of the potential assumed for the background, the mass ratio between the two components, the compactness of the NSC, the mass-to-light ratio (as both the potential and the luminosity weighing play a role), and obviously the dynamical status of each component (their relative and values which spatially vary). We performed a simplified calculation taking into account the weighing of each component in the derivation of (or ) but assuming a rather constant luminosity for the background. This shows that when these ratios stay above a value of 10, the contamination from the host potential and light is relatively little, at the level of 10 to 15% (assuming mass follows light within ). For NGC 404, the contamination may be higher and we estimate, again using the same simple assumptions, that it amounts to a maximum of 40%.
To check such a naive calculation, we further produced mock kinematic models of the central region of three targets in our sample, namely NGC 404, M 32 and NGC 7793, representing the two worst as well as one of the best cases, respectively, in terms of the NSC contrast. We thus directly examined the impact of embedding the NSC into the potential well of an host galaxy, by comparing the resulting measures of and in the ideal case of an “isolated” self-gravitating NSC, and of the same NSC within its late-type host.
We first modelled the mass distribution of the three galaxies via Multi-Gaussian Expansions (Emsellem et al., 1994; Cappellari, 2002, hereafter, MGE). For NGC 404, we made use of the model published by Nguyen et al. (2017). For M 32, we used the MGE model by Verolme et al. (2002) and for NGC 7793 we built a model based on an image from the 2MASS Large Galaxy Atlas (Jarrett et al., 2003). We then predicted the projected nuclear kinematics (V, ) assuming axisymmetry and a fixed inclination and computed the respective integrated (and ) radial profiles. As expected, when adding the underlying galaxy background potential (and light) to the NSC, measurements tend to higher or lower values depending on the dynamical state of these background stars. Again, the impact naturally depends on both the local fraction of light corresponding to the NSC and on its integrated weight within the selected aperture.
As expected, the effect is negligible for and values within radii where the NSC fully dominates with contrast ratios above 10, while it becomes significant for ratios below 5. For both NGC 7793 and M 32, the contamination () is less than while for NGC 404 it is just below 20%. An interesting twist pertaining to the case of NGC 404 is that the nuclear region includes clear stellar counter-rotation, which, together with its low inclination, tend to make its observed value quite low. The photometric decomposition used in the above-mentioned modelling assumes that the NSC is a mixture of co- and counter-rotating stars, and has a very strong azimuthal anisotropy (lowering its mean stellar velocity). If we were to assume that the NSC is made only of the most central counter-rotating stars, it would maximise its mean velocity while increasing then the relative anisotropy difference between the NSC and the host, and would in turn very significantly emphasise the contamination.
5.3 Previous samples in the literature
We added previously-observed NSCs, GCs and UCDs, with available kinematics in the literature, to the and diagrams. In Fig. 6 and 7, we compare our results with a sample of six nuclei from Lyubenova & Tsatsi (2019), indicated with red open circles, and with measurements from Feldmeier et al. (2014) for the NSC in our Galaxy, indicated as a blue open upward triangle. We also included in the diagrams a sample of GCs in the MW from Kamann et al. (2018) (indicated as orange open plus symbols), the nucleus of the Sagittarius dwarf galaxy, M 54, from Alfaro-Cuello et al. (2020) (brown open star), and two UCDs, M 59-UCD 3 from Ahn et al. (2018) and M 60-UCD 1 from Seth et al. (2014) (brown open ”X” symbols).
5.3.1 Other galactic nuclei
We compare here our sample with the six nuclei whose kinematics was studied by Lyubenova & Tsatsi (2019). They are hosted by early-type galaxies in the Fornax cluster and thus they live in a higher-density environment and they are more than five times more distant than our sample (about Mpc from us). While this leads to a more limited physical resolution than in our sample, we have a similar number of Voronoi bins, within the , to some of our galaxies. The galaxies in this sample have also, on average, larger masses than ours. Lyubenova & Tsatsi (2019) extracted the nuclear kinematics, from AO-assisted SINFONI data, using a very similar approach to ours. On the other hand, they estimated from isophotal fitting within .
Similar to the early-type galaxies in our sample, most of the nuclei in their sample are round and do not rotate strongly, as shown in Fig. 6 and 7. Four out of six have , and and are actually located in the diagrams close to the lowest points in our sample (especially to NGC 404). These points strengthen the trend with nuclei in early-type galaxies being located in a lower region of the diagrams with respect to the ones hosted by late types. However, caution is needed regarding this trend since early-type galaxies from Lyubenova & Tsatsi (2019) are different objects from galaxies in our sample. As mentioned, they are more massive and live in a much denser environment, which implies accelerated mass assembly and early quenching (e.g., Fujita & Nagashima, 1999). On the other hand, just as with our sample, there are two exceptions of strongly-rotating nuclei hosted by early-type galaxies, FCC 47 and FCC 170. These nuclei have peculiar properties that might be the cause for their location in the diagrams. Their origin is discussed in Sect. 6.

We calculated and for the NSC in the MW, using values of and from Feldmeier et al. (2014). Their radial coverage was slightly smaller than , therefore this point should be considered as a lower limit and is indicated as an upwards triangle in Fig. 6 and 7. The ellipticity (0.29) was taken from Schödel et al. (2014). The NSC in the MW lies in the upper region of the diagrams, providing additional evidence that late-type nuclei are, on average, more rotation dominated than early-type nuclei. While the MW is more massive than galaxies in our sample, with a stellar mass of M☉ (Licquia & Newman, 2015), and hosts a SMBH of M☉ (Gillessen et al., 2017), the mass of its NSC is similar to the most massive NSCs in our sample (hosted by M 32 and NGC 5102, see Appendix A). With a quite typical pc, the MW NSC has a relatively high mass of M☉ (Schödel et al., 2014; Feldmeier et al., 2014; Feldmeier-Krause et al., 2017b). In Fig. 6 and 7, it is located relatively close to massive nuclei in our sample. We discuss in Sect. 6 on the potential formation scenario of the NSC in our Galaxy.
5.3.2 Globular clusters and ultra-compact dwarfs
GCs are connected to NSCs in different ways, although they are systems with different intrinsic properties and they reside in different regions of the potential well of galaxies. The relationship between NSCs and GCs is rather complex: they could either form in a similar way, NSCs could form from GC accretion, and some GCs are stripped galaxy nuclei. To facilitate a comparison, we included in our discussion a sample of 21 MW GCs with published and (Kamann et al. 2018, ellipticities from Harris 1996). The full GC sample in Fig. 6 and 7 lies in the region where most nuclei hosted by early-type galaxies are concentrated, perhaps suggesting a potential evolutionary connection with these NSCs (see Sect. 6).
We have added to our diagrams M 54, an object straddled between NSCs and GCs and with available kinematics. It is the second most massive GC of the MW, and the stripped nucleus of the disrupted Sagittarius dwarf spheroidal galaxy (Bellazzini et al., 2008; Mucciarelli et al., 2017; Alfaro-Cuello et al., 2019, see discussion in Sect. 6.5). We calculated and for M 54 from the kinematics published by Alfaro-Cuello et al. (2020), approximating a constant flux per spatial bin within the effective radius. This point is located, in Fig. 6 and 7, in the region dominated by NSCs in early-type galaxies and by the faster-rotating GCs.
Finally, we included in our analysis the two UCDs M 59-UCD 3 and M 60-UCD 1, for which the kinematics is available respectively from Ahn et al. (2018) and Seth et al. (2014). We added these two points to Fig. 6 and 7, integrating within the effective radius of the inner morphological components of these UCDs, which are thought to be the NSCs of the progenitor galaxies. These points are actually located, in our diagrams, on the top of the early-type dominated region, where the fastest rotating GCs are found.
6 Discussion
While some amount of rotation was observed in all nuclei in our sample, they are distributed in different regions of the and diagrams. Overall, our results suggest that most NSCs in late-type galaxies are rapidly rotating, while those in early-type galaxies have on average less rotation. In this section we discuss how these observations translate to constraints on NSC formation. We first consider the interpretation of galaxy kinematics in the context of their formation to see if analogous formation mechanisms may be at work in NSCs. Emsellem et al. (2007) suggested that gas and mergers play a key role in the formation and evolution of respectively fast and slow-rotating early-type galaxies. Greene et al. (2018) found that an important fraction of high-mass early-type galaxies have high angular momentum, and they differ from slow rotators in their (larger) amount of ionized gas. The importance of gas, either provided via simple accretion or wet mergers, to keep and/or increase the angular momentum of a galaxy, was also shown in simulations (e.g., Lagos et al., 2018; Walo-Martín et al., 2020).
If we qualitatively extrapolate this interpretation to galactic nuclei, their location in the and diagrams might be determined by the balance between the two most invoked NSC formation mechanisms, in-situ formation from gas inflow and inspiralling of star clusters. While they might have both played a role in the formation of the same NSC, we use our sample to test a scenario where a more dominant contribution of in-situ star formation, with respect to star-cluster infall, would correspond to larger values of and . However, we have to be cautious to avoid too simplistic interpretations. The full picture needs to include other possibilities such as the accretion of gas-rich clusters (Guillard et al., 2016) or the accretion of clusters with high angular momentum as the ones in Lahén et al. (2020).
Appendix A contains, for each individual nucleus in our sample, the detailed description of the kinematics as from our results, as well as a review of previous studies regarding both the NSCs and host galaxies. In this broader context, a short discussion on the potential formation scenario for each NSC is also provided. We therefore summarize and further discuss here the information contained in Appendix A.
6.1 The formation of higher-angular-momentum NSCs
In our sample, galactic nuclei in late-type galaxies show on average higher values of , and . This is in agreement with in-situ formation playing a leading role in the formation of these NSCs, hosted by a type of galaxies that is in general characterized by on-going star formation.
As recently suggested for early-type galaxies by Fahrion et al. (2021), gas accretion and subsequent in-situ formation might be needed for the growth of massive NSCs ( M☉). However, this may happen in all types of galaxies (see also Neumayer et al. 2020). The four most massive NSCs in our sample, with masses larger than M☉ (see Appendix A), are hosted by M 32, NGC 5102, NGC 4244, and NGC 7793. We note that all of them are represented by points located in the upper region of the diagrams in Fig. 3 and 4. This is consistent with a dominant contribution from highly-rotating and/or dynamically cooler stars formed in situ after gas inflow. In previous studies, this formation channel was in fact proposed as potentially dominant in the NSCs hosted by M 32 and NGC 5102 (e.g., Seth, 2010; Nguyen et al., 2018), but necessary to explain observations also in NGC 4244 and NGC 7793 (e.g., Hartmann et al. 2011; Kacharov et al. 2018, see also Appendix A for the individual cases). In-situ formation might be therefore the dominant mechanism in late-type NSCs and massive, rapidly-rotating NSCs in early-type galaxies.
6.2 The formation of lower-angular-momentum NSCs
In the bottom-left region of Fig. 3 and 4 we have three of our nuclei, hosted by early-type galaxies. The nucleus of NGC 404, represented by the lowest point in the diagrams, shows two counter-rotating structures, while the one in NGC 205 displays an offset between the rotation axis and the minor axis. In both cases, the complex kinematics suggest a formation in different episodes with one or more mergers playing a major role. As mentioned in Appendix A, these mergers would have allowed the accretion of star clusters and/or triggered star formation bursts. On the other hand, no kinematic-decoupled components are detected in the nucleus of NGC 5206. However, we know from the photometric decomposition (Nguyen et al., 2018) that this NSC is also made up of different components: an inner one and a more extended one. This NSC shows a significant contribution from a continuous in-situ star formation (Kacharov et al. 2018, see also Appendix A).
In summary, while some amount of nuclear in-situ star formation might be ubiquitous for all kinds of galaxies, this mechanism seems to dominate in NSCs of late-type galaxies. On the other hand, the picture is not as clear for early-type galaxies. The latter are characterized by more complex structures and a large variety of different cases.
6.3 The formation of NSCs in the context of their host galaxies
In our sample, the ubiquity of rotation, together with the signs of past interactions, is very often in conjunction with peculiar gas structures. As from Appendix A, the presence of some amount of gas was previously shown in all our host galaxies except M 32, probably because of its dramatic past stripping processes related to its interaction with M 31 (e.g., Dierickx et al., 2014). This suggests that gas accretion might play a key role in the formation and growth of NSCs, leading either to nuclear in-situ star formation or to clustered star formation in the galactic disk (outside the nucleus) followed by a migration towards the center.
Very often, the gas structures observed in our sample were associated with past interactions. The latter might be fundamental for nucleation, as they can provide not only external gas but also star clusters from the accreted satellites. In addition, they can trigger in-situ star formation. Evidence for gas inflow towards the galactic center, in the shape of filaments, bars or galactic fountains, was previously provided for four out of six late-type galaxies in our sample (M 33, NGC 2403, NGC 2976, NGC 4449, see Appendix A and references therein). In addition, signs of very recent or ongoing in-situ star formation suggest that this plays in general a major role in assembling NSCs of late-type galaxies.
The strong rotation in M 32’s and NGC 5102’s nuclei, the two points associated to early-type galaxies that are located in the upper region of the and diagrams, may be related to the peculiar past of their hosts as spiral galaxies. M 32 is considered the stripped remnant of a more massive spiral (e.g., Dierickx et al., 2014; D’Souza & Bell, 2018). NGC 5102, the most massive galaxy in our sample, is a peculiar lenticular sharing properties with late-type galaxies, such as its extended atomic gas component. It would have consumed most of its gas during past intense star formation and merger episodes, becoming a lenticular (e.g., Davidge, 2008). These two NSCs probably kept the kinematic properties of their disky progenitors and/or they were formed via in-situ star formation triggered by the interactions which led to their galaxy-type transition (see Appendix A for more details and references). To sum up, all nuclei in the upper region of Fig. 3 and 4 (all hosted by late-type galaxies plus two early types) have shown in previous works signs of gas inflow and/or in-situ star formation. This is in agreement with a major role of in-situ formation in those nuclei that are segregated in the upper region of the and diagrams.
On the other hand, intense merger histories may lead to lower values of and , when associated to complex nuclear structures. The complexity found in the nucleus of NGC 404, the lowest point in the diagrams, extends to the large scales of the host galaxy, and is consistent with the merger NSC origin suggested by our results (Appendix A). This lenticular galaxy displays a peculiar gas structure made up of different kinematically decoupled components, while the complex stellar populations also result from the combination of different contributions (e.g., del Río et al., 2004; Bouchard et al., 2010). Similarly, the complex stellar and gas large-scale properties of NGC 205 show signs of the past interactions, mainly with M 31 (e.g., Davidge, 2003a), that would have led to the observed nuclear properties (see Appendix A for more details and references). Although the nucleus of NGC 5206 does not show such complex (kinematic) properties, previous studies have shown potential hints of past interactions (e.g., Laurikainen et al., 2010). These might have led to the formation of the NSC and its relatively low values of and .
6.4 The formation of previously-studied NSCs
We add now to this discussion the NSCs from previous publications that were presented in Sect. 5.3.1. Lyubenova & Tsatsi (2019) compared their kinematic results with -body simulations from Antonini et al. (2012), Perets & Mastrobuono-Battisti (2014), and Tsatsi et al. (2017). They showed that in general observed rotation can be recovered with multiple mergers of GCs, in a galactic center with an initially non-rotating bulge. Most of the results from Lyubenova & Tsatsi (2019) were in agreement with models of GCs infalling isotropically from random directions. These results correspond to the open red circles in the bottom-left region of Fig. 6 and 7.
However, in-situ star formation from infalling gas could also be the source of rotation in FCC 47 and FCC 170, with much higher values of and . While Lyubenova & Tsatsi (2019) showed that the high nuclear angular momentum of FCC 47 could be explained with the infall of GCs from similar orbital directions to each other (as they would do if they formed in the galactic disk), a more complex origin was proposed by Fahrion et al. (2019). They invoked additional in-situ star formation, with mergers playing a significant role, to explain the high rotation, metallicity and mass ( M☉) of this kinematically decoupled NSC. On the other hand, the position of FCC 170 in the diagram was not consistent with any of the GC-merger simulations including a bulge presented by Lyubenova & Tsatsi (2019), who suggested that alternative mechanisms involving gas led to the formation and growth of this NSC. Therefore, in-situ formation would have been important in the four nuclei in early-type galaxies that are located in the upper region of Fig. 6 and 7 (M 32, NGC 5102, FCC 47 and FCC 170).
The MW hosts the best studied NSC, whose origin is nevertheless still partly unclear due to its complex nature. On the one hand, it co-rotates with the Galactic disk but with a kinematic misalignment, while an additional inner component rotates perpendicular to the major axis. This structure suggests different episodes of star-cluster accretion (Feldmeier et al., 2014; Feldmeier-Krause et al., 2017b). On the other hand, the stellar populations disfavour a pure star-cluster infall scenario. For example, the wide range of metallicities is consistent with a formation in different episodes and probably via different mechanisms. The more metal-poor stars might have belonged originally to GCs that migrated to the Galactic center (Feldmeier-Krause et al., 2017a, 2020).
Furthermore, a kinematically-distinct metal-poor substructure has been recently identified in the central pc, probably as well a remnant of a massive star cluster or an accreted dwarf (Do et al., 2020; Arca Sedda et al., 2020). However, the dominant populations, with their super-solar metallicity much higher than MW GCs, as well as a few very young stars uniformly concentrated in the center, were instead formed in situ (Feldmeier-Krause et al., 2015). A complex formation scenario, but with in-situ star formation contributing most of the mass and the strong rotation, might explain the location of the MW in the uppermost region of the and diagrams.
The NSCs hosted by FCC 47 and the MW, both massive (more than M☉, see Sect. 5.3.1 for the MW), are represented by points close to the massive NSCs in our sample, in Fig. 6 and 7. Following the discussion in Sect. 6.1 and in agreement with the mentioned previous studies, this supports a scenario in which a dominant role of gas inflow and in-situ star formation, contributing to higher values of and , is required for the growth of massive NSCs.
6.5 Insights from globular clusters and ultra-compact dwarfs
The bottom-left region of Fig. 6 and 7 is populated by nuclei of early-type galaxies, but also by the GCs of Kamann et al. (2018). These GCs do not extend to as high ellipticities, or values as the other NSCs, indicating that on average NSCs are more rotation dominated than the GC counterparts. On average, NSCs have larger masses than GCs, but low-mass NSCs have similar masses and metallicities to GCs at the high-mass end (Fahrion et al., 2021). If larger masses are related to stronger rotation (as suggested in Sect. 6.1 and 6.4), massive GCs will have similar kinematic properties to less massive NSCs as we see in Fig. 6 and 7.
Kamann et al. (2018) suggested that GCs are born with significant angular momentum, inherited from the progenitor gas, which is however dissipated over time. This is consistent with a recent study by Lahén et al. (2020), on the kinematics of simulated young massive star clusters, formed during a merger-induced starburst. They showed how some recently formed massive clusters lie in the upper region of the and diagrams, where our late-type nuclei are located. Pfeffer et al. (2020) agreed that the observed properties of GCs can be the result of the evolution of (massive) star clusters, formed in the early Universe initially with similar properties as present-day young clusters (see also Portegies Zwart et al. 2010). Hence, not only NSCs can form from the infall of GCs to the galactic center, but also the seeds for the formation of both NSCs and GCs might have had very similar properties.
In addition, as suggested e.g. by Böker (2008), (some) GCs might be the nuclear remnants of dwarf satellites accreted by massive galaxies. This is another channel of the tight evolutionary connection between (some) NSCs and GCs. Some MW GCs, in fact, are thought to be stripped nuclei. This is the case, e.g., of Cen (Hilker & Richtler, 2000; Noyola et al., 2008; Pfeffer et al., 2021) and M 54 (Ibata et al., 2009; Alfaro-Cuello et al., 2019, 2020; Pfeffer et al., 2021), the two most massive GCs in the MW. They were not included in the sample by Kamann et al. (2018).
M 54, with available kinematics from Alfaro-Cuello et al. (2020), was added in Fig. 6 and 7. M 54 is the stripped nucleus of the disrupted Sagittarius dwarf spheroidal galaxy, as supported by its complex stellar populations (Bellazzini et al., 2008; Mucciarelli et al., 2017; Alfaro-Cuello et al., 2019). It lies as well in the bottom-left region of the diagrams. As shown by Alfaro-Cuello et al. (2019, 2020), its integrated kinematics is the result of the combination of three main stellar populations: an old and metal-poor component with a very low amount of rotation, an intermediate-age metal-rich component with some rotation, and a young, faster-rotating, metal-rich population. While properties of the young component pointed to an in-situ origin, GC accretion was proposed for the old populations. M 54 is one more example, in the bottom region of the or diagrams, of a complex nuclear structure made up of components with different origin, probably the results of past interactions.
We also include two stripped nuclei into our discussion, M 59-UCD 3 and M 60-UCD 1. Their central over-massive SMBHs suggest that these UCDs are the stripped nuclei of much more massive progenitors ( M☉) (Seth et al., 2014; Ahn et al., 2018). The latter hosted NSCs, that are now observed as the inner morphological components of these UCDs (see also Pfeffer & Baumgardt 2013). Nevertheless, nothing can be said about the morphological type of these progenitors. These stripped nuclei are located, in Fig. 6 and 7, in the bottom-left region characterized by GCs and nuclei in early-type galaxies, very close to NGC 205’s nucleus. Both show strong rotation and high velocity dispersion (with a central peak associated with the SMBH). M 59-UCD 3 displays a complex structure with multiple stellar populations (Ahn et al., 2018), similarly to other early-type galaxies in our sample (Sect. 6.3). M 60-UCD 1 seems to be populated mainly by uniformly old stars and suggests that it was stripped a long time ago preventing any recent in-situ growth (Seth et al., 2014). However, the amount of rotation observed in the inner region of these peculiar objects ( km s-1, Seth et al. 2014; Ahn et al. 2018) is much larger than the one observed in most early-type nuclei in our sample. It is instead comparable to the ones located in the upper region of the or diagrams.
7 Conclusions
We used a unique data set, from AO-assisted IFS in the CO band head, of the nuclear regions of eleven early and late-type galaxies. From these data cubes, we extracted and analysed their resolved kinematics, at a parsec or subparsec scale. We provided the high-resolution maps of the first four moments of the LOSVD and their uncertainties, indicating that some level of rotation is ubiquitous in NSCs. The maps extracted from the highest-S/N data cubes, show some kinematic complexity.
We analysed the balance of ordered rotation and random motions in our targets, making use of the and diagrams. Nuclei hosted by late-type galaxies, are located in the upper, rotation-dominated region of the diagrams. On the other hand, early-type nuclei display a larger variety of cases corresponding to different locations in the diagrams. They show, on average, lower amount of rotation and lower ellipticity, very often associated to complex kinematic structures. However, some peculiar early-type galaxies host massive, strongly-rotating nuclei located in the region of the diagrams dominated by late types. Therefore, nuclei hosted by late-type galaxies and massive nuclei in early types populate the upper region of the and diagrams.
If rotation is associated with in-situ formation from gas accretion (or the infall of coplanar star clusters), and pressure support to the merging of star clusters (in general from random directions), the continuous distribution of our points in the and diagrams supports complex formation pictures driven by a mix of these scenarios. Since the highest values of and correspond to nuclei in late-type galaxies and massive nuclei in early types, we suggest that in-situ formation is the dominant NSC formation mechanism in late-type galaxies, but also required for the growth of massive NSCs in galaxies of all types. This picture is supported by additional samples from previous studies.
The discussion of the properties of the individual nuclei in the context of their hosts supports our conclusions and suggests that in general galaxy interactions, often triggering gas inflow and star-formation bursts, but also contributing complex structures, play a fundamental role in the NSC formation. The variety of nuclear kinematic properties in early-type galaxies is probably closely connected to the specific evolution history of their hosts, which can therefore form their NSCs in quite different ways.
Our work provides a first glimpse into the internal kinematics of a sample of NSCs, suggests that rotation is ubiquitous and provides information on the balance between the two most invoked formation scenarios proposed for NSCs. However, the variety of specific cases, complex structures and peculiar galaxy-evolution histories make it challenging to reconstruct the NSC formation only by kinematic results. Spatially resolved stellar-population properties, including star-formation histories, would be necessary to understand better the complexity of these NSCs. Moreover, connecting the kinematics to detailed information on the formation mechanism is limited by seeing, projection effects and the contributions of the underlying galaxies. Detailed modeling of these data including these effects more fully has the potential to yield better understanding of NSC formation mechanisms.
References
- Adams et al. (2012) Adams, J. J., Gebhardt, K., Blanc, G. A., et al. 2012, ApJ, 745, 92, doi: 10.1088/0004-637X/745/1/92
- Ahn et al. (2018) Ahn, C. P., Seth, A. C., Cappellari, M., et al. 2018, ApJ, 858, 102, doi: 10.3847/1538-4357/aabc57
- Alfaro-Cuello et al. (2019) Alfaro-Cuello, M., Kacharov, N., Neumayer, N., et al. 2019, ApJ, 886, 57, doi: 10.3847/1538-4357/ab1b2c
- Alfaro-Cuello et al. (2020) —. 2020, ApJ, 892, 20, doi: 10.3847/1538-4357/ab77bb
- Annibali et al. (2008) Annibali, F., Aloisi, A., Mack, J., et al. 2008, AJ, 135, 1900, doi: 10.1088/0004-6256/135/5/1900
- Antonini et al. (2012) Antonini, F., Capuzzo-Dolcetta, R., Mastrobuono-Battisti, A., & Merritt, D. 2012, ApJ, 750, 111, doi: 10.1088/0004-637X/750/2/111
- Appleton et al. (1981) Appleton, P. N., Davies, R. D., & Stephenson, R. J. 1981, MNRAS, 195, 327, doi: 10.1093/mnras/195.2.327
- Arca Sedda et al. (2020) Arca Sedda, M., Gualandris, A., Do, T., et al. 2020, ApJ, 901, L29, doi: 10.3847/2041-8213/abb245
- Aros et al. (2020) Aros, F. I., Sippel, A. C., Mastrobuono-Battisti, A., et al. 2020, MNRAS, doi: 10.1093/mnras/staa2821
- Astropy Collaboration et al. (2013) Astropy Collaboration, Robitaille, T. P., Tollerud, E. J., et al. 2013, A&A, 558, A33, doi: 10.1051/0004-6361/201322068
- Astropy Collaboration et al. (2018) Astropy Collaboration, Price-Whelan, A. M., Sipőcz, B. M., et al. 2018, AJ, 156, 123, doi: 10.3847/1538-3881/aabc4f
- Baade (1944) Baade, W. 1944, ApJ, 100, 137, doi: 10.1086/144650
- Babcock (1939) Babcock, H. W. 1939, Lick Observatory Bulletin, 498, 41, doi: 10.5479/ADS/bib/1939LicOB.19.41B
- Bajaja et al. (1994) Bajaja, E., Huchtmeier, W. K., & Klein, U. 1994, A&A, 285, 385
- Barker et al. (2012) Barker, M. K., Ferguson, A. M. N., Irwin, M. J., Arimoto, N., & Jablonka, P. 2012, MNRAS, 419, 1489, doi: 10.1111/j.1365-2966.2011.19814.x
- Beasley et al. (2015) Beasley, M. A., San Roman, I., Gallart, C., Sarajedini, A., & Aparicio, A. 2015, MNRAS, 451, 3400, doi: 10.1093/mnras/stv943
- Bekki (2015) Bekki, K. 2015, ApJ, 812, L14, doi: 10.1088/2041-8205/812/1/L14
- Bekki et al. (2001) Bekki, K., Couch, W. J., Drinkwater, M. J., & Gregg, M. D. 2001, ApJ, 557, L39, doi: 10.1086/323075
- Bellazzini et al. (2008) Bellazzini, M., Ibata, R. A., Chapman, S. C., et al. 2008, AJ, 136, 1147, doi: 10.1088/0004-6256/136/3/1147
- Bender et al. (1994) Bender, R., Saglia, R. P., & Gerhard, O. E. 1994, MNRAS, 269, 785, doi: 10.1093/mnras/269.3.785
- Bendo et al. (2007) Bendo, G. J., Calzetti, D., Engelbracht, C. W., et al. 2007, MNRAS, 380, 1313, doi: 10.1111/j.1365-2966.2007.12204.x
- Bica et al. (1990) Bica, E., Alloin, D., & Schmidt, A. A. 1990, A&A, 228, 23
- Binney (1978) Binney, J. 1978, MNRAS, 183, 501, doi: 10.1093/mnras/183.3.501
- Binney (2005) —. 2005, MNRAS, 363, 937, doi: 10.1111/j.1365-2966.2005.09495.x
- Binney & Tremaine (1987) Binney, J., & Tremaine, S. 1987, Galactic dynamics
- Boccas et al. (2006) Boccas, M., Rigaut, F., Bec, M., et al. 2006, in Society of Photo-Optical Instrumentation Engineers (SPIE) Conference Series, Vol. 6272, Society of Photo-Optical Instrumentation Engineers (SPIE) Conference Series, ed. B. L. Ellerbroek & D. Bonaccini Calia, 62723L
- Boehle et al. (2018) Boehle, A., Larkin, J. E., Armus, L., & Wright, S. A. 2018, ApJ, 866, 79, doi: 10.3847/1538-4357/aadf8d
- Böker (2008) Böker, T. 2008, ApJ, 672, L111, doi: 10.1086/527033
- Böker et al. (2002) Böker, T., Laine, S., van der Marel, R. P., et al. 2002, AJ, 123, 1389, doi: 10.1086/339025
- Böker et al. (2001) Böker, T., van der Marel, R. P., Mazzuca, L., et al. 2001, AJ, 121, 1473, doi: 10.1086/319415
- Böker et al. (1999) Böker, T., Calzetti, D., Sparks, W., et al. 1999, ApJS, 124, 95, doi: 10.1086/313253
- Bonnet et al. (2004) Bonnet, H., Abuter, R., Baker, A., et al. 2004, The Messenger, 117, 17
- Bothun et al. (1985) Bothun, G. D., Mould, J. R., Wirth, A., & Caldwell, N. 1985, AJ, 90, 697, doi: 10.1086/113778
- Bouchard et al. (2010) Bouchard, A., Prugniel, P., Koleva, M., & Sharina, M. 2010, A&A, 513, A54, doi: 10.1051/0004-6361/200913137
- Bradley et al. (2020) Bradley, L., Sipőcz, B., Robitaille, T., et al. 2020, astropy/photutils: 1.0.0, 1.0.0, Zenodo, doi: 10.5281/zenodo.4044744. https://doi.org/10.5281/zenodo.4044744
- Bronkalla & Notni (1990) Bronkalla, W., & Notni, P. 1990, in Astronomische Gesellschaft Abstract Series, Vol. 5, Astronomische Gesellschaft Abstract Series, 85
- Bronkalla et al. (1992) Bronkalla, W., Notni, P., & Mutter, A. A. R. 1992, Astronomische Nachrichten, 313, 1, doi: 10.1002/asna.2113130102
- Butler & Martínez-Delgado (2005) Butler, D. J., & Martínez-Delgado, D. 2005, AJ, 129, 2217, doi: 10.1086/429524
- Caldwell (1983) Caldwell, N. 1983, AJ, 88, 804, doi: 10.1086/113367
- Caldwell & Bothun (1987) Caldwell, N., & Bothun, G. D. 1987, AJ, 94, 1126, doi: 10.1086/114550
- Cappellari (2002) Cappellari, M. 2002, MNRAS, 333, 400, doi: 10.1046/j.1365-8711.2002.05412.x
- Cappellari (2016) —. 2016, ARA&A, 54, 597, doi: 10.1146/annurev-astro-082214-122432
- Cappellari (2017) —. 2017, MNRAS, 466, 798, doi: 10.1093/mnras/stw3020
- Cappellari et al. (1999) Cappellari, M., Bertola, F., Burstein, D., et al. 1999, ApJ, 515, L17, doi: 10.1086/311966
- Cappellari & Copin (2003) Cappellari, M., & Copin, Y. 2003, MNRAS, 342, 345, doi: 10.1046/j.1365-8711.2003.06541.x
- Cappellari & Emsellem (2004) Cappellari, M., & Emsellem, E. 2004, PASP, 116, 138, doi: 10.1086/381875
- Cappellari et al. (2007) Cappellari, M., Emsellem, E., Bacon, R., et al. 2007, MNRAS, 379, 418, doi: 10.1111/j.1365-2966.2007.11963.x
- Capuzzo-Dolcetta (1993) Capuzzo-Dolcetta, R. 1993, ApJ, 415, 616, doi: 10.1086/173189
- Capuzzo-Dolcetta & Mastrobuono-Battisti (2009) Capuzzo-Dolcetta, R., & Mastrobuono-Battisti, A. 2009, A&A, 507, 183, doi: 10.1051/0004-6361/200912255
- Carignan & Puche (1990) Carignan, C., & Puche, D. 1990, AJ, 100, 394, doi: 10.1086/115523
- Carlin et al. (2016) Carlin, J. L., Sand, D. J., Price, P., et al. 2016, ApJ, 828, L5, doi: 10.3847/2041-8205/828/1/L5
- Carollo et al. (1998) Carollo, C. M., Stiavelli, M., & Mack, J. 1998, AJ, 116, 68, doi: 10.1086/300407
- Carozzi-Meyssonnier (1980) Carozzi-Meyssonnier, N. 1980, A&A, 92, 189
- Carson et al. (2015) Carson, D. J., Barth, A. J., Seth, A. C., et al. 2015, AJ, 149, 170, doi: 10.1088/0004-6256/149/5/170
- Cepa & Beckman (1988) Cepa, J., & Beckman, J. E. 1988, A&A, 200, 21
- Chynoweth et al. (2008) Chynoweth, K. M., Langston, G. I., Yun, M. S., et al. 2008, AJ, 135, 1983, doi: 10.1088/0004-6256/135/6/1983
- Cid Fernandes et al. (2005) Cid Fernandes, R., González Delgado, R. M., Storchi-Bergmann, T., Martins, L. P., & Schmitt, H. 2005, MNRAS, 356, 270, doi: 10.1111/j.1365-2966.2004.08452.x
- Cignoni et al. (2018) Cignoni, M., Sacchi, E., Aloisi, A., et al. 2018, ApJ, 856, 62, doi: 10.3847/1538-4357/aab041
- Coelho et al. (2009) Coelho, P., Mendes de Oliveira, C., & Cid Fernandes, R. 2009, MNRAS, 396, 624, doi: 10.1111/j.1365-2966.2009.14722.x
- Comerón et al. (2011) Comerón, S., Knapen, J. H., Sheth, K., et al. 2011, ApJ, 729, 18, doi: 10.1088/0004-637X/729/1/18
- Corbelli & Schneider (1997) Corbelli, E., & Schneider, S. E. 1997, ApJ, 479, 244, doi: 10.1086/303849
- Corbelli et al. (1989) Corbelli, E., Schneider, S. E., & Salpeter, E. E. 1989, AJ, 97, 390, doi: 10.1086/114989
- Corbelli et al. (2014) Corbelli, E., Thilker, D., Zibetti, S., Giovanardi, C., & Salucci, P. 2014, A&A, 572, A23, doi: 10.1051/0004-6361/201424033
- Côté et al. (2006) Côté, P., Piatek, S., Ferrarese, L., et al. 2006, ApJS, 165, 57, doi: 10.1086/504042
- Cote et al. (1997) Cote, S., Freeman, K. C., Carignan, C., & Quinn, P. J. 1997, AJ, 114, 1313, doi: 10.1086/118565
- Daigle et al. (2006) Daigle, O., Carignan, C., Amram, P., et al. 2006, MNRAS, 367, 469, doi: 10.1111/j.1365-2966.2006.10002.x
- Davidge (1998) Davidge, T. J. 1998, ApJ, 497, 650, doi: 10.1086/305495
- Davidge (2000) —. 2000, AJ, 119, 748, doi: 10.1086/301206
- Davidge (2003a) —. 2003a, ApJ, 597, 289, doi: 10.1086/378271
- Davidge (2003b) —. 2003b, AJ, 125, 3046, doi: 10.1086/375303
- Davidge (2005) —. 2005, AJ, 130, 2087, doi: 10.1086/491706
- Davidge (2008) —. 2008, AJ, 135, 1636, doi: 10.1088/0004-6256/135/4/1636
- Davidge (2015) —. 2015, ApJ, 799, 97, doi: 10.1088/0004-637X/799/1/97
- Davidge et al. (2008) Davidge, T. J., Beck, T. L., & McGregor, P. J. 2008, ApJ, 677, 238, doi: 10.1086/528931
- Davidge & Courteau (2002) Davidge, T. J., & Courteau, S. 2002, AJ, 123, 1438, doi: 10.1086/338901
- Davis et al. (2020) Davis, T. A., Nguyen, D. D., Seth, A. C., et al. 2020, MNRAS, 496, 4061, doi: 10.1093/mnras/staa1567
- Davoust & de Vaucouleurs (1980) Davoust, E., & de Vaucouleurs, G. 1980, ApJ, 242, 30, doi: 10.1086/158441
- de Blok et al. (2008) de Blok, W. J. G., Walter, F., Brinks, E., et al. 2008, AJ, 136, 2648, doi: 10.1088/0004-6256/136/6/2648
- de Blok et al. (2014) de Blok, W. J. G., Keating, K. M., Pisano, D. J., et al. 2014, A&A, 569, A68, doi: 10.1051/0004-6361/201423880
- de Jong et al. (2007) de Jong, R. S., Seth, A. C., Radburn-Smith, D. J., et al. 2007, ApJ, 667, L49, doi: 10.1086/522035
- De Lorenzi et al. (2013) De Lorenzi, F., Hartmann, M., Debattista, V. P., Seth, A. C., & Gerhard, O. 2013, MNRAS, 429, 2974, doi: 10.1093/mnras/sts545
- De Rijcke et al. (2006) De Rijcke, S., Prugniel, P., Simien, F., & Dejonghe, H. 2006, MNRAS, 369, 1321, doi: 10.1111/j.1365-2966.2006.10377.x
- de Swardt et al. (2010) de Swardt, B., Kraan-Korteweg, R. C., & Jerjen, H. 2010, MNRAS, 407, 955, doi: 10.1111/j.1365-2966.2010.16986.x
- de Vaucouleurs & Davoust (1980) de Vaucouleurs, G., & Davoust, E. 1980, ApJ, 239, 783, doi: 10.1086/158164
- del Río et al. (2004) del Río, M. S., Brinks, E., & Cepa, J. 2004, AJ, 128, 89, doi: 10.1086/421358
- Diaz et al. (1982) Diaz, A. I., Pagel, B. E. J., Edmunds, M. G., & Phillips, M. M. 1982, MNRAS, 201, 49P, doi: 10.1093/mnras/201.1.49P
- Dicaire et al. (2008) Dicaire, I., Carignan, C., Amram, P., et al. 2008, AJ, 135, 2038, doi: 10.1088/0004-6256/135/6/2038
- Dierickx et al. (2014) Dierickx, M., Blecha, L., & Loeb, A. 2014, ApJ, 788, L38, doi: 10.1088/2041-8205/788/2/L38
- Do et al. (2020) Do, T., David Martinez, G., Kerzendorf, W., et al. 2020, ApJ, 901, L28, doi: 10.3847/2041-8213/abb246
- Dressler & Richstone (1988) Dressler, A., & Richstone, D. O. 1988, ApJ, 324, 701, doi: 10.1086/165930
- Drissen et al. (1999) Drissen, L., Roy, J.-R., Moffat, A. F. J., & Shara, M. M. 1999, AJ, 117, 1249, doi: 10.1086/300766
- Drzazga et al. (2016) Drzazga, R. T., Chyży, K. T., Heald, G. H., Elstner, D., & Gallagher, J. S. 2016, A&A, 589, A12, doi: 10.1051/0004-6361/201527236
- D’Souza & Bell (2018) D’Souza, R., & Bell, E. F. 2018, Nature Astronomy, 2, 737, doi: 10.1038/s41550-018-0533-x
- Dumont et al. (2020) Dumont, A., Seth, A. C., Strader, J., et al. 2020, ApJ, 888, 19, doi: 10.3847/1538-4357/ab5798
- Eisenhauer et al. (2003) Eisenhauer, F., Abuter, R., Bickert, K., et al. 2003, in Society of Photo-Optical Instrumentation Engineers (SPIE) Conference Series, Vol. 4841, Instrument Design and Performance for Optical/Infrared Ground-based Telescopes, ed. M. Iye & A. F. M. Moorwood, 1548–1561
- Emsellem et al. (1994) Emsellem, E., Monnet, G., & Bacon, R. 1994, A&A, 285, 723
- Emsellem et al. (2007) Emsellem, E., Cappellari, M., Krajnović, D., et al. 2007, MNRAS, 379, 401, doi: 10.1111/j.1365-2966.2007.11752.x
- Emsellem et al. (2011) —. 2011, MNRAS, 414, 888, doi: 10.1111/j.1365-2966.2011.18496.x
- Fahrion et al. (2019) Fahrion, K., Lyubenova, M., van de Ven, G., et al. 2019, A&A, 628, A92, doi: 10.1051/0004-6361/201935832
- Fahrion et al. (2020) Fahrion, K., Müller, O., Rejkuba, M., et al. 2020, A&A, 634, A53, doi: 10.1051/0004-6361/201937120
- Fahrion et al. (2021) Fahrion, K., Lyubenova, M., van de Ven, G., et al. 2021, A&A, 650, A137, doi: 10.1051/0004-6361/202140644
- Falcón-Barroso et al. (2019) Falcón-Barroso, J., van de Ven, G., Lyubenova, M., et al. 2019, A&A, 632, A59, doi: 10.1051/0004-6361/201936413
- Feldmeier et al. (2014) Feldmeier, A., Neumayer, N., Seth, A., et al. 2014, A&A, 570, A2, doi: 10.1051/0004-6361/201423777
- Feldmeier-Krause et al. (2017a) Feldmeier-Krause, A., Kerzendorf, W., Neumayer, N., et al. 2017a, MNRAS, 464, 194, doi: 10.1093/mnras/stw2339
- Feldmeier-Krause et al. (2017b) Feldmeier-Krause, A., Zhu, L., Neumayer, N., et al. 2017b, MNRAS, 466, 4040, doi: 10.1093/mnras/stw3377
- Feldmeier-Krause et al. (2015) Feldmeier-Krause, A., Neumayer, N., Schödel, R., et al. 2015, A&A, 584, A2, doi: 10.1051/0004-6361/201526336
- Feldmeier-Krause et al. (2020) Feldmeier-Krause, A., Kerzendorf, W., Do, T., et al. 2020, MNRAS, 494, 396, doi: 10.1093/mnras/staa703
- Ferguson & Sandage (1989) Ferguson, H. C., & Sandage, A. 1989, ApJ, 346, L53, doi: 10.1086/185577
- Ferrarese et al. (2006) Ferrarese, L., Côté, P., Dalla Bontà, E., et al. 2006, ApJ, 644, L21, doi: 10.1086/505388
- Fraternali et al. (2002a) Fraternali, F., Cappi, M., Sancisi, R., & Oosterloo, T. 2002a, ApJ, 578, 109, doi: 10.1086/342396
- Fraternali et al. (2001) Fraternali, F., Oosterloo, T., Sancisi, R., & van Moorsel, G. 2001, ApJ, 562, L47, doi: 10.1086/338102
- Fraternali et al. (2002b) Fraternali, F., van Moorsel, G., Sancisi, R., & Oosterloo, T. 2002b, AJ, 123, 3124, doi: 10.1086/340358
- Freudling et al. (2013) Freudling, W., Romaniello, M., Bramich, D. M., et al. 2013, A&A, 559, A96, doi: 10.1051/0004-6361/201322494
- Fujita & Nagashima (1999) Fujita, Y., & Nagashima, M. 1999, ApJ, 516, 619, doi: 10.1086/307139
- Garcia (1993) Garcia, A. M. 1993, A&AS, 100, 47
- Garnett et al. (1997) Garnett, D. R., Shields, G. A., Skillman, E. D., Sagan, S. P., & Dufour, R. J. 1997, ApJ, 489, 63, doi: 10.1086/304775
- Gebhardt et al. (2001) Gebhardt, K., Lauer, T. R., Kormendy, J., et al. 2001, AJ, 122, 2469, doi: 10.1086/323481
- Gelatt et al. (2001) Gelatt, A. E., Hunter, D. A., & Gallagher, J. S. 2001, PASP, 113, 142, doi: 10.1086/318613
- Georgiev & Böker (2014) Georgiev, I. Y., & Böker, T. 2014, MNRAS, 441, 3570, doi: 10.1093/mnras/stu797
- Georgiev et al. (2016) Georgiev, I. Y., Böker, T., Leigh, N., Lützgendorf, N., & Neumayer, N. 2016, MNRAS, 457, 2122, doi: 10.1093/mnras/stw093
- Gillessen et al. (2017) Gillessen, S., Plewa, P. M., Eisenhauer, F., et al. 2017, ApJ, 837, 30, doi: 10.3847/1538-4357/aa5c41
- Gonneau et al. (2020) Gonneau, A., Lyubenova, M., Lançon, A., et al. 2020, A&A, 634, A133, doi: 10.1051/0004-6361/201936825
- Gordon et al. (1999) Gordon, K. D., Hanson, M. M., Clayton, G. C., Rieke, G. H., & Misselt, K. A. 1999, ApJ, 519, 165, doi: 10.1086/307350
- Graham (2002) Graham, A. W. 2002, ApJ, 568, L13, doi: 10.1086/340274
- Graham & Guzmán (2003) Graham, A. W., & Guzmán, R. 2003, AJ, 125, 2936, doi: 10.1086/374992
- Graham et al. (2018) Graham, M. T., Cappellari, M., Li, H., et al. 2018, MNRAS, 477, 4711, doi: 10.1093/mnras/sty504
- Greene et al. (2018) Greene, J. E., Leauthaud, A., Emsellem, E., et al. 2018, ApJ, 852, 36, doi: 10.3847/1538-4357/aa9bde
- Grier et al. (2011) Grier, C. J., Mathur, S., Ghosh, H., & Ferrarese, L. 2011, ApJ, 731, 60, doi: 10.1088/0004-637X/731/1/60
- Guélin & Weliachew (1969) Guélin, M., & Weliachew, L. 1969, A&A, 1, 10
- Guérou et al. (2016) Guérou, A., Emsellem, E., Krajnović, D., et al. 2016, A&A, 591, A143, doi: 10.1051/0004-6361/201628743
- Guillard et al. (2016) Guillard, N., Emsellem, E., & Renaud, F. 2016, MNRAS, 461, 3620, doi: 10.1093/mnras/stw1570
- Harborne et al. (2019) Harborne, K. E., Power, C., Robotham, A. S. G., Cortese, L., & Taranu, D. S. 2019, MNRAS, 483, 249, doi: 10.1093/mnras/sty3120
- Harborne et al. (2020) Harborne, K. E., van de Sande, J., Cortese, L., et al. 2020, MNRAS, 497, 2018, doi: 10.1093/mnras/staa1847
- Harris (1996) Harris, W. E. 1996, AJ, 112, 1487, doi: 10.1086/118116
- Hartmann et al. (2011) Hartmann, M., Debattista, V. P., Seth, A., Cappellari, M., & Quinn, T. R. 2011, MNRAS, 418, 2697, doi: 10.1111/j.1365-2966.2011.19659.x
- Hilker & Richtler (2000) Hilker, M., & Richtler, T. 2000, A&A, 362, 895. https://arxiv.org/abs/astro-ph/0008500
- Ho et al. (1997) Ho, L. C., Filippenko, A. V., & Sargent, W. L. W. 1997, ApJS, 112, 315, doi: 10.1086/313041
- Ho et al. (2009) Ho, L. C., Greene, J. E., Filippenko, A. V., & Sargent, W. L. W. 2009, ApJS, 183, 1, doi: 10.1088/0067-0049/183/1/1
- Hoffman et al. (2009) Hoffman, L., Cox, T. J., Dutta, S., & Hernquist, L. 2009, ApJ, 705, 920, doi: 10.1088/0004-637X/705/1/920
- Hunter (1997) Hunter, D. 1997, PASP, 109, 937, doi: 10.1086/133965
- Hunter & Gallagher (1997) Hunter, D. A., & Gallagher, John S., I. 1997, ApJ, 475, 65, doi: 10.1086/303520
- Hunter et al. (1998) Hunter, D. A., Wilcots, E. M., van Woerden, H., Gallagher, J. S., & Kohle, S. 1998, ApJ, 495, L47, doi: 10.1086/311213
- Ibata et al. (2009) Ibata, R., Bellazzini, M., Chapman, S. C., et al. 2009, ApJ, 699, L169, doi: 10.1088/0004-637X/699/2/L169
- Illingworth (1977) Illingworth, G. 1977, ApJ, 218, L43, doi: 10.1086/182572
- Jarrett et al. (2003) Jarrett, T. H., Chester, T., Cutri, R., Schneider, S. E., & Huchra, J. P. 2003, AJ, 125, 525, doi: 10.1086/345794
- Joseph et al. (2001) Joseph, C. L., Merritt, D., Olling, R., et al. 2001, ApJ, 550, 668, doi: 10.1086/319781
- Kacharov et al. (2018) Kacharov, N., Neumayer, N., Seth, A. C., et al. 2018, MNRAS, 480, 1973, doi: 10.1093/mnras/sty1985
- Kamann (2018) Kamann, S. 2018, PampelMuse: Crowded-field 3D spectroscopy. http://ascl.net/1805.021
- Kamann et al. (2018) Kamann, S., Husser, T. O., Dreizler, S., et al. 2018, MNRAS, 473, 5591, doi: 10.1093/mnras/stx2719
- Karachentsev et al. (2013) Karachentsev, I. D., Makarov, D. I., & Kaisina, E. I. 2013, AJ, 145, 101, doi: 10.1088/0004-6256/145/4/101
- Karachentsev et al. (2002) Karachentsev, I. D., Dolphin, A. E., Geisler, D., et al. 2002, A&A, 383, 125, doi: 10.1051/0004-6361:20011741
- Karachentsev et al. (2003) Karachentsev, I. D., Grebel, E. K., Sharina, M. E., et al. 2003, A&A, 404, 93, doi: 10.1051/0004-6361:20030170
- Kennicutt et al. (2008) Kennicutt, Robert C., J., Lee, J. C., Funes, J. G., et al. 2008, ApJS, 178, 247, doi: 10.1086/590058
- Kormendy & Djorgovski (1989) Kormendy, J., & Djorgovski, S. 1989, ARA&A, 27, 235, doi: 10.1146/annurev.aa.27.090189.001315
- Kormendy et al. (2010) Kormendy, J., Drory, N., Bender, R., & Cornell, M. E. 2010, ApJ, 723, 54, doi: 10.1088/0004-637X/723/1/54
- Kormendy & McClure (1993) Kormendy, J., & McClure, R. D. 1993, AJ, 105, 1793, doi: 10.1086/116555
- Kraft et al. (2005) Kraft, R. P., Nolan, L. A., Ponman, T. J., Jones, C., & Raychaudhury, S. 2005, ApJ, 625, 785, doi: 10.1086/429982
- Krajnović et al. (2008) Krajnović, D., Bacon, R., Cappellari, M., et al. 2008, MNRAS, 390, 93, doi: 10.1111/j.1365-2966.2008.13712.x
- Kumari et al. (2017) Kumari, N., James, B. L., & Irwin, M. J. 2017, MNRAS, 470, 4618, doi: 10.1093/mnras/stx1414
- Lagos et al. (2018) Lagos, C. d. P., Stevens, A. R. H., Bower, R. G., et al. 2018, MNRAS, 473, 4956, doi: 10.1093/mnras/stx2667
- Lahén et al. (2020) Lahén, N., Naab, T., Johansson, P. H., et al. 2020, ApJ, 904, 71, doi: 10.3847/1538-4357/abc001
- Lauer et al. (1998) Lauer, T. R., Faber, S. M., Ajhar, E. A., Grillmair, C. J., & Scowen, P. A. 1998, AJ, 116, 2263, doi: 10.1086/300617
- Laurikainen et al. (2010) Laurikainen, E., Salo, H., Buta, R., Knapen, J. H., & Comerón, S. 2010, MNRAS, 405, 1089, doi: 10.1111/j.1365-2966.2010.16521.x
- Licquia & Newman (2015) Licquia, T. C., & Newman, J. A. 2015, ApJ, 806, 96, doi: 10.1088/0004-637X/806/1/96
- Light et al. (1974) Light, E. S., Danielson, R. E., & Schwarzschild, M. 1974, ApJ, 194, 257, doi: 10.1086/153241
- Lim et al. (2018) Lim, S., Peng, E. W., Côté, P., et al. 2018, ApJ, 862, 82, doi: 10.3847/1538-4357/aacb81
- Long et al. (2002) Long, K. S., Charles, P. A., & Dubus, G. 2002, ApJ, 569, 204, doi: 10.1086/339172
- Long et al. (1981) Long, K. S., Dodorico, S., Charles, P. A., & Dopita, M. A. 1981, ApJ, 246, L61, doi: 10.1086/183553
- Lotz et al. (2001) Lotz, J. M., Telford, R., Ferguson, H. C., et al. 2001, ApJ, 552, 572, doi: 10.1086/320545
- Lyubenova & Tsatsi (2019) Lyubenova, M., & Tsatsi, A. 2019, A&A, 629, A44, doi: 10.1051/0004-6361/201833954
- Lyubenova et al. (2013) Lyubenova, M., van den Bosch, R. C. E., Côté, P., et al. 2013, MNRAS, 431, 3364, doi: 10.1093/mnras/stt414
- Martínez-Delgado et al. (2012) Martínez-Delgado, D., Romanowsky, A. J., Gabany, R. J., et al. 2012, ApJ, 748, L24, doi: 10.1088/2041-8205/748/2/L24
- Mateo (1998) Mateo, M. L. 1998, ARA&A, 36, 435, doi: 10.1146/annurev.astro.36.1.435
- Matthews & Gallagher (1997) Matthews, L. D., & Gallagher, John S., I. 1997, AJ, 114, 1899, doi: 10.1086/118613
- Mayall & Aller (1942) Mayall, N. U., & Aller, L. H. 1942, ApJ, 95, 5, doi: 10.1086/144369
- McConnachie (2012) McConnachie, A. W. 2012, AJ, 144, 4, doi: 10.1088/0004-6256/144/1/4
- McConnachie et al. (2006) McConnachie, A. W., Chapman, S. C., Ibata, R. A., et al. 2006, ApJ, 647, L25, doi: 10.1086/507299
- McConnachie et al. (2004) McConnachie, A. W., Irwin, M. J., Lewis, G. F., et al. 2004, MNRAS, 351, L94, doi: 10.1111/j.1365-2966.2004.08076.x
- McConnell et al. (2012) McConnell, N. J., Ma, C.-P., Murphy, J. D., et al. 2012, ApJ, 756, 179, doi: 10.1088/0004-637X/756/2/179
- McGregor et al. (2003) McGregor, P. J., Hart, J., Conroy, P. G., et al. 2003, in Society of Photo-Optical Instrumentation Engineers (SPIE) Conference Series, Vol. 4841, Instrument Design and Performance for Optical/Infrared Ground-based Telescopes, ed. M. Iye & A. F. M. Moorwood, 1581–1591
- Menéndez-Delmestre et al. (2007) Menéndez-Delmestre, K., Sheth, K., Schinnerer, E., Jarrett, T. H., & Scoville, N. Z. 2007, ApJ, 657, 790, doi: 10.1086/511025
- Merritt et al. (2001) Merritt, D., Ferrarese, L., & Joseph, C. L. 2001, Science, 293, 1116, doi: 10.1126/science.1063896
- Mihos & Hernquist (1994) Mihos, J. C., & Hernquist, L. 1994, ApJ, 437, L47, doi: 10.1086/187679
- Milosavljević (2004) Milosavljević, M. 2004, ApJ, 605, L13, doi: 10.1086/420696
- Miner et al. (2011) Miner, J., Rose, J. A., & Cecil, G. 2011, ApJ, 727, L15, doi: 10.1088/2041-8205/727/1/L15
- Mitzkus et al. (2017) Mitzkus, M., Cappellari, M., & Walcher, C. J. 2017, MNRAS, 464, 4789, doi: 10.1093/mnras/stw2677
- Monachesi et al. (2012) Monachesi, A., Trager, S. C., Lauer, T. R., et al. 2012, ApJ, 745, 97, doi: 10.1088/0004-637X/745/1/97
- Monaco et al. (2009) Monaco, L., Saviane, I., Perina, S., et al. 2009, A&A, 502, L9, doi: 10.1051/0004-6361/200912412
- Mostoghiu et al. (2018) Mostoghiu, R., Di Cintio, A., Knebe, A., et al. 2018, MNRAS, 480, 4455, doi: 10.1093/mnras/sty2161
- Mould et al. (1984) Mould, J., Kristian, J., & Da Costa, G. S. 1984, ApJ, 278, 575, doi: 10.1086/161824
- Mucciarelli et al. (2017) Mucciarelli, A., Bellazzini, M., Ibata, R., et al. 2017, A&A, 605, A46, doi: 10.1051/0004-6361/201730707
- Neumayer et al. (2007) Neumayer, N., Cappellari, M., Reunanen, J., et al. 2007, ApJ, 671, 1329, doi: 10.1086/523039
- Neumayer et al. (2020) Neumayer, N., Seth, A., & Böker, T. 2020, A&A Rev., 28, 4, doi: 10.1007/s00159-020-00125-0
- Nguyen et al. (2017) Nguyen, D. D., Seth, A. C., den Brok, M., et al. 2017, ApJ, 836, 237, doi: 10.3847/1538-4357/aa5cb4
- Nguyen et al. (2018) Nguyen, D. D., Seth, A. C., Neumayer, N., et al. 2018, ApJ, 858, 118, doi: 10.3847/1538-4357/aabe28
- Nguyen et al. (2019) Nguyen, D. D., Seth, A. C., Neumayer, N., et al. 2019, ApJ, 872, 104, doi: 10.3847/1538-4357/aafe7a
- Noyola et al. (2008) Noyola, E., Gebhardt, K., & Bergmann, M. 2008, ApJ, 676, 1008, doi: 10.1086/529002
- Oh & Lin (2000) Oh, K. S., & Lin, D. N. C. 2000, ApJ, 543, 620, doi: 10.1086/317118
- Olling (1996) Olling, R. P. 1996, AJ, 112, 457, doi: 10.1086/118028
- Paudel et al. (2011) Paudel, S., Lisker, T., & Kuntschner, H. 2011, MNRAS, 413, 1764, doi: 10.1111/j.1365-2966.2011.18256.x
- Pechetti et al. (2020) Pechetti, R., Seth, A., Neumayer, N., et al. 2020, ApJ, 900, 32, doi: 10.3847/1538-4357/abaaa7
- Perets & Mastrobuono-Battisti (2014) Perets, H. B., & Mastrobuono-Battisti, A. 2014, ApJ, 784, L44, doi: 10.1088/2041-8205/784/2/L44
- Pfeffer & Baumgardt (2013) Pfeffer, J., & Baumgardt, H. 2013, MNRAS, 433, 1997, doi: 10.1093/mnras/stt867
- Pfeffer et al. (2021) Pfeffer, J., Lardo, C., Bastian, N., Saracino, S., & Kamann, S. 2021, MNRAS, 500, 2514, doi: 10.1093/mnras/staa3407
- Pfeffer et al. (2020) Pfeffer, J. L., Trujillo-Gomez, S., Kruijssen, J. M. D., et al. 2020, MNRAS, 499, 4863, doi: 10.1093/mnras/staa3109
- Pinna et al. (2019) Pinna, F., Falcón-Barroso, J., Martig, M., et al. 2019, A&A, 623, A19, doi: 10.1051/0004-6361/201833193
- Portegies Zwart et al. (2010) Portegies Zwart, S. F., McMillan, S. L. W., & Gieles, M. 2010, ARA&A, 48, 431, doi: 10.1146/annurev-astro-081309-130834
- Putman et al. (2009) Putman, M. E., Peek, J. E. G., Muratov, A., et al. 2009, ApJ, 703, 1486, doi: 10.1088/0004-637X/703/2/1486
- Radburn-Smith et al. (2012) Radburn-Smith, D. J., Roškar, R., Debattista, V. P., et al. 2012, ApJ, 753, 138, doi: 10.1088/0004-637X/753/2/138
- Redman & Shirley (1937) Redman, R. O., & Shirley, E. G. 1937, MNRAS, 97, 416, doi: 10.1093/mnras/97.6.416
- Robles-Valdez et al. (2013) Robles-Valdez, F., Carigi, L., & Peimbert, M. 2013, MNRAS, 429, 2351, doi: 10.1093/mnras/sts506
- Rose et al. (2005) Rose, J. A., Arimoto, N., Caldwell, N., et al. 2005, AJ, 129, 712, doi: 10.1086/427136
- Rossa et al. (2006) Rossa, J., van der Marel, R. P., Böker, T., et al. 2006, AJ, 132, 1074, doi: 10.1086/505968
- Sacchi et al. (2019) Sacchi, E., Cignoni, M., Aloisi, A., et al. 2019, ApJ, 878, 1, doi: 10.3847/1538-4357/ab1de1
- Sánchez-Janssen et al. (2019) Sánchez-Janssen, R., Côté, P., Ferrarese, L., et al. 2019, ApJ, 878, 18, doi: 10.3847/1538-4357/aaf4fd
- Schiavon et al. (2004) Schiavon, R. P., Caldwell, N., & Rose, J. A. 2004, AJ, 127, 1513, doi: 10.1086/381950
- Schinnerer et al. (2006) Schinnerer, E., Böker, T., Emsellem, E., & Lisenfeld, U. 2006, ApJ, 649, 181, doi: 10.1086/506265
- Schinnerer et al. (2003) Schinnerer, E., Böker, T., & Meier, D. S. 2003, ApJ, 591, L115, doi: 10.1086/377118
- Schödel et al. (2014) Schödel, R., Feldmeier, A., Kunneriath, D., et al. 2014, A&A, 566, A47, doi: 10.1051/0004-6361/201423481
- Semczuk et al. (2018) Semczuk, M., Łokas, E. L., Salomon, J.-B., Athanassoula, E., & D’Onghia, E. 2018, ApJ, 864, 34, doi: 10.3847/1538-4357/aad4ae
- Seth et al. (2007) Seth, A., de Jong, R., Dalcanton, J., & GHOSTS Team. 2007, in IAU Symposium, Vol. 241, Stellar Populations as Building Blocks of Galaxies, ed. A. Vazdekis & R. Peletier, 523–524
- Seth (2010) Seth, A. C. 2010, ApJ, 725, 670, doi: 10.1088/0004-637X/725/1/670
- Seth et al. (2008) Seth, A. C., Blum, R. D., Bastian, N., Caldwell, N., & Debattista, V. P. 2008, ApJ, 687, 997, doi: 10.1086/591935
- Seth et al. (2005a) Seth, A. C., Dalcanton, J. J., & de Jong, R. S. 2005a, AJ, 129, 1331, doi: 10.1086/427859
- Seth et al. (2005b) —. 2005b, AJ, 130, 1574, doi: 10.1086/444620
- Seth et al. (2006) Seth, A. C., Dalcanton, J. J., Hodge, P. W., & Debattista, V. P. 2006, AJ, 132, 2539, doi: 10.1086/508994
- Seth et al. (2010) Seth, A. C., Cappellari, M., Neumayer, N., et al. 2010, ApJ, 714, 713, doi: 10.1088/0004-637X/714/1/713
- Seth et al. (2014) Seth, A. C., van den Bosch, R., Mieske, S., et al. 2014, Nature, 513, 398, doi: 10.1038/nature13762
- Shapley (1943) Shapley, H. 1943, Galaxies, 50
- Sheth et al. (2010) Sheth, K., Regan, M., Hinz, J. L., et al. 2010, PASP, 122, 1397, doi: 10.1086/657638
- Shields & Filippenko (1992) Shields, J. C., & Filippenko, A. V. 1992, in Astronomical Society of the Pacific Conference Series, Vol. 31, Relationships Between Active Galactic Nuclei and Starburst Galaxies, ed. A. V. Filippenko, 267
- Shostak (1973) Shostak, G. S. 1973, A&A, 24, 411
- Silge & Gebhardt (2003) Silge, J. D., & Gebhardt, K. 2003, AJ, 125, 2809, doi: 10.1086/375324
- Silk et al. (1987) Silk, J., Wyse, R. F. G., & Shields, G. A. 1987, ApJ, 322, L59, doi: 10.1086/185037
- Simien & Prugniel (2002) Simien, F., & Prugniel, P. 2002, A&A, 384, 371, doi: 10.1051/0004-6361:20020071
- Smith et al. (1984) Smith, G., Elmegreen, B. G., & Elmegreen, D. M. 1984, MNRAS, 210, 399, doi: 10.1093/mnras/210.2.399
- Spekkens & Sellwood (2007) Spekkens, K., & Sellwood, J. A. 2007, ApJ, 664, 204, doi: 10.1086/518471
- Spengler et al. (2017) Spengler, C., Côté, P., Roediger, J., et al. 2017, ApJ, 849, 55, doi: 10.3847/1538-4357/aa8a78
- Tacconi et al. (1990) Tacconi, L. J., van der Hulst, J. M., & Wesselius, P. R. 1990, in NASA Conference Publication, Vol. 3084, NASA Conference Publication, ed. D. J. Hollenbach & J. Thronson, Harley A., 279
- Tachihara et al. (2018) Tachihara, K., Gratier, P., Sano, H., et al. 2018, PASJ, 70, S52, doi: 10.1093/pasj/psy020
- Theis & Kohle (2001) Theis, C., & Kohle, S. 2001, A&A, 370, 365, doi: 10.1051/0004-6361:20010198
- Thilker et al. (2004) Thilker, D. A., Braun, R., Walterbos, R. A. M., et al. 2004, ApJ, 601, L39, doi: 10.1086/381703
- Thilker et al. (2010) Thilker, D. A., Bianchi, L., Schiminovich, D., et al. 2010, ApJ, 714, L171, doi: 10.1088/2041-8205/714/1/L171
- Tikhonov, N. A. et al. (2003) Tikhonov, N. A., Galazutdinova, O. A., & Aparicio, A. 2003, A&A, 401, 863, doi: 10.1051/0004-6361:20021819
- Tody (1986) Tody, D. 1986, in Society of Photo-Optical Instrumentation Engineers (SPIE) Conference Series, Vol. 627, Instrumentation in astronomy VI, ed. D. L. Crawford, 733
- Tody (1993) Tody, D. 1993, in Astronomical Society of the Pacific Conference Series, Vol. 52, Astronomical Data Analysis Software and Systems II, ed. R. J. Hanisch, R. J. V. Brissenden, & J. Barnes, 173
- Tremaine et al. (1975) Tremaine, S. D., Ostriker, J. P., & Spitzer, L., J. 1975, ApJ, 196, 407, doi: 10.1086/153422
- Trujillo et al. (2001) Trujillo, I., Aguerri, J. A. L., Cepa, J., & Gutiérrez, C. M. 2001, MNRAS, 328, 977, doi: 10.1046/j.1365-8711.2001.04937.x
- Tsatsi et al. (2017) Tsatsi, A., Mastrobuono-Battisti, A., van de Ven, G., et al. 2017, MNRAS, 464, 3720, doi: 10.1093/mnras/stw2593
- Valdez-Gutiérrez et al. (2002) Valdez-Gutiérrez, M., Rosado, M., Puerari, I., et al. 2002, AJ, 124, 3157, doi: 10.1086/344304
- Valenzuela et al. (2014) Valenzuela, O., Hernandez-Toledo, H., Cano, M., et al. 2014, AJ, 147, 27, doi: 10.1088/0004-6256/147/2/27
- Valluri et al. (2005) Valluri, M., Ferrarese, L., Merritt, D., & Joseph, C. L. 2005, ApJ, 628, 137, doi: 10.1086/430752
- van de Sande et al. (2017a) van de Sande, J., Bland-Hawthorn, J., Fogarty, L. M. R., et al. 2017a, ApJ, 835, 104, doi: 10.3847/1538-4357/835/1/104
- van de Sande et al. (2017b) van de Sande, J., Bland-Hawthorn, J., Brough, S., et al. 2017b, MNRAS, 472, 1272, doi: 10.1093/mnras/stx1751
- van den Bergh (1995) van den Bergh, S. 1995, AJ, 110, 613, doi: 10.1086/117546
- van den Bosch & de Zeeuw (2010) van den Bosch, R. C. E., & de Zeeuw, P. T. 2010, MNRAS, 401, 1770, doi: 10.1111/j.1365-2966.2009.15832.x
- van der Marel & Franx (1993) van der Marel, R. P., & Franx, M. 1993, ApJ, 407, 525, doi: 10.1086/172534
- van der Marel & Guhathakurta (2008) van der Marel, R. P., & Guhathakurta, P. 2008, ApJ, 678, 187, doi: 10.1086/533430
- van Woerden et al. (1993) van Woerden, H., van Driel, W., Braun, R., & Rots, A. H. 1993, A&A, 269, 15
- Verolme et al. (2002) Verolme, E. K., Cappellari, M., Copin, Y., et al. 2002, MNRAS, 335, 517, doi: 10.1046/j.1365-8711.2002.05664.x
- Voggel et al. (2018) Voggel, K. T., Seth, A. C., Neumayer, N., et al. 2018, ApJ, 858, 20, doi: 10.3847/1538-4357/aabae5
- Walcher et al. (2006) Walcher, C. J., Böker, T., Charlot, S., et al. 2006, ApJ, 649, 692, doi: 10.1086/505166
- Walcher et al. (2005) Walcher, C. J., van der Marel, R. P., McLaughlin, D., et al. 2005, ApJ, 618, 237, doi: 10.1086/425977
- Wallace & Hinkle (1996) Wallace, L., & Hinkle, K. 1996, ApJS, 107, 312, doi: 10.1086/192367
- Walo-Martín et al. (2020) Walo-Martín, D., Falcón-Barroso, J., Dalla Vecchia, C., Pérez, I., & Negri, A. 2020, MNRAS, 494, 5652, doi: 10.1093/mnras/staa1066
- White et al. (2019) White, R. L., Long, K. S., Becker, R. H., et al. 2019, ApJS, 241, 37, doi: 10.3847/1538-4365/ab0e89
- Whitmore et al. (2020) Whitmore, B. C., Chandar, R., Lee, J., et al. 2020, ApJ, 889, 154, doi: 10.3847/1538-4357/ab59e5
- Wiklind & Henkel (1990) Wiklind, T., & Henkel, C. 1990, A&A, 227, 394
- Williams et al. (2010a) Williams, B. F., Dalcanton, J. J., Gilbert, K. M., et al. 2010a, ApJ, 716, 71, doi: 10.1088/0004-637X/716/1/71
- Williams et al. (2013) Williams, B. F., Dalcanton, J. J., Stilp, A., et al. 2013, ApJ, 765, 120, doi: 10.1088/0004-637X/765/2/120
- Williams et al. (2010b) —. 2010b, ApJ, 709, 135, doi: 10.1088/0004-637X/709/1/135
- Young & Lo (1997) Young, L. M., & Lo, K. Y. 1997, ApJ, 476, 127, doi: 10.1086/303618
- Yukita et al. (2007) Yukita, M., Swartz, D. A., Soria, R., & Tennant, A. F. 2007, ApJ, 664, 277, doi: 10.1086/518237
- Zheng et al. (2017) Zheng, Y., Peek, J. E. G., Werk, J. K., & Putman, M. E. 2017, ApJ, 834, 179, doi: 10.3847/1538-4357/834/2/179
- Zinnecker & Cannon (1986) Zinnecker, H., & Cannon, R. D. 1986, in Star Forming Dwarf Galaxies and Related Objects. Proceedings of a workshop held at Paris, France, 1 - 3 July 1985, ed. D. Kunth, T. X. Thuan, & J. Tran Thanh Van (Gif-sur-Yvette: Éditions Frontières), 155
- Zschaechner et al. (2011) Zschaechner, L. K., Rand, R. J., Heald, G. H., Gentile, G., & Kamphuis, P. 2011, ApJ, 740, 35, doi: 10.1088/0004-637X/740/1/35
Appendix A Individual nuclei: their host galaxies and kinematic maps
In this Appendix, we describe briefly the host galaxies in our sample, giving the potentially relevant information for the formation of their NSCs, and we show individual nuclear-kinematic maps extracted from our observations. In the top row of Fig. 8 to 18 we show the first four moments of the LOSVD. From left to right: mean velocity , velocity dispersion , skewness and kurtosis . (top-left panel) was corrected for an approximation of the systemic velocity, calculated as the average value within the central 0.3 arcsec 0.3 arcsec. In the bottom row, we show the respective uncertainties, per Voronoi bin, of the first four moments of the LOSVD. Dashed green ellipses indicate the elliptical isophotes. For completeness and to avoid a subjective selection, we show the full Voronoi-binned area, although numerous bins display large uncertainties. These give often a qualitative idea of the kinematic trend in the outer region of the nuclei. Similar kinematic maps of M 32, NGC 205, NGC 404, NGC 5102 and NGC 5206 were already published (Seth et al., 2008, 2010; Seth, 2010; Nguyen et al., 2018). However, and were not included for all of them and, when possible, we cover a wider area. For these reasons and for completeness, we show here the maps of our full sample, consistent with the previously-published ones.
A.1 Early-type galaxies
Of the eleven host galaxies in our sample, five are classified as early types (Table 1). We describe and discuss briefly each one of them and the kinematics of their nuclei as follows.
A.1.1 M 32
M 32 is a dwarf compact elliptical (cE) in the Local Group, close satellite of M 31. It hosts the least massive of the three supermassive black holes (SMBHs) detected in the Local group ( M☉) (e.g., Verolme et al., 2002; van den Bosch & de Zeeuw, 2010; Seth, 2010; Nguyen et al., 2018). M 32’s origin is still controversial. As also suggested by its SMBH, it is thought to be a tidally-stripped remnant, result of the interaction with its massive neighbour M 31 (e.g., Dierickx et al., 2014; D’Souza & Bell, 2018). One possibility is that its progenitor was a low-luminosity spiral (Bekki et al., 2001). In support of this “threshed-spiral” scenario, a faint stellar disk was identified by Graham (2002) and Nguyen et al. (2018) in the outer parts of M 32. Furthermore, stellar kinematics of M 32 from Verolme et al. (2002) and Dressler & Richstone (1988) show disk-like rotation with a maximum velocity of km s-1, slightly decreasing towards the outskirts. Two main stellar populations were identified in M 32. One older than 5 Gyr with subsolar metallicities, the other younger and metal rich (Schiavon et al., 2004; Monachesi et al., 2012), contributing mostly in the nuclear region (Rose et al., 2005; Coelho et al., 2009; Miner et al., 2011).
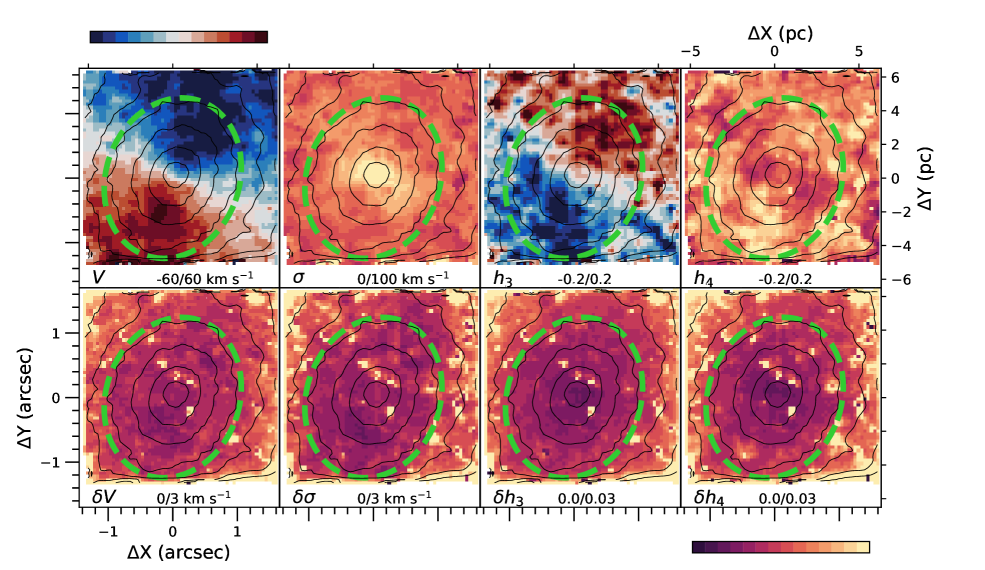
The high S/N per spaxel allows us to observe kinematic features in M 32’s nucleus at sub-parsec resolution in the full FoV, as shown in Fig. 8. We find evidence of a relatively fast-rotating disk-like component, with velocities up to km s-1 (top-left panel) that are clearly anticorrelated with skewness (third top panel from the left). This anticorrelation suggests disk-like rotation superimposed on weaker or no rotation (e.g., van der Marel & Franx, 1993). Velocity dispersion displays a strong peak in the center, which can be explained by the presence of a SMBH. A structure of higher values of appears to be aligned with the minor axis. The kurtosis map, anticorrelated with , shows slightly negative values, indicating broader profiles of the LOSVD with respect to a Gaussian, along the rotation axis and positive values across the rest of the disk. As discussed by Seth (2010), these and maps suggest the superposition in the LOS of a dominant rotating disk on a much slower or non-rotating bulge.
Due to the proximity of this galaxy, small structures in the eight maps might correspond to individual stars, deviating from the integrated kinematics of the galaxy and determining larger uncertainties. The high quality of this data allows us to determine the kinematic parameters with low uncertainties: generally below 2 km s-1 for and and below 0.02 for and . Uncertainties are higher close to the edges of the FoV. Kinematic maps in Seth (2010) are within our uncertainties. Our results are also compatible with other previous studies (Dressler & Richstone, 1988; Joseph et al., 2001).
The strong disk-like rotation in the massive M 32’s nucleus ( M☉, see Nguyen et al. 2018), typical of the central regions of disky elliptical galaxies, is consistent with an in-situ formation from accreted gas (Joseph et al., 2001; Hoffman et al., 2009; Seth, 2010). Nuclear kinematics can be related to M 32’s controversial origin. In Fig. 3 and 4, the nucleus of M 32 lies in the uppermost region covered by late-type galaxies and shows one of the highest proportion between ordered and random motions, in spite of the high values of velocity dispersion. If the compact galaxy that we see today is a tidally stripped remnant, the nucleus might be still bearing the footprint of its “threshed”-spiral host. It corrotates with the galaxy, as from comparing with the larger-scale kinematics mapped by Verolme et al. (2002), while its chemical properties, consistent with a spiral and not with a classical elliptical galaxy, point as well to this same scenario (Davidge et al., 2008). Strong tidal interactions with M 31 may have also favoured gas inflow towards the center, ending in a starburst forming the youngest populations in the NSC (Bekki et al., 2001).
A.1.2 NGC 205
NGC 205 is also located in the Local Group and is the brightest and the closest to M 31 of its three dwarf-elliptical (dE) companions (Davidge, 2005). Several signs of past interactions with M 31 have been found in both stellar and gas properties of NGC 205 (e.g., Cepa & Beckman, 1988; Young & Lo, 1997; Mateo, 1998; Davidge, 2003a; McConnachie et al., 2004; Thilker et al., 2004). NGC 205 was initially thought to be globally an old galaxy, since its stellar populations were associated with the ones in MW GCs (Baade, 1944; Mould et al., 1984). However, signs of recent star-formation activity, probably triggered by interactions with M 31, were later found in the central regions (Mateo, 1998; Cappellari et al., 1999; Davidge, 2003a; Butler & Martínez-Delgado, 2005).
We observe relatively slow rotation in the nucleus of NGC 205. The rotation does not happen around the photometric minor axis, as seen in the top-left panel of Fig. 9, suggesting that mergers played an important role in the formation of this NSC. Velocity dispersion drops in the central region within the elliptical isophote, in agreement with the presence of a low-mass central BH as first investigated by Valluri et al. (2005) and Nguyen et al. (2018). Nguyen et al. (2019) provided a model of the measured kinematics and measured the BH mass ( M☉). The low values are also consistent with the observed dominant young dynamically-cold populations (De Rijcke et al., 2006).
We consider reliable the absolute values of and only within the arcsec isophotes, where uncertainties are not too large. However, a larger portion of the FoV hints that the galaxy may follow a similar rotation pattern and a velocity dispersion increasing farther from the center. Significant rotation was measured at larger scales, but along the major axis of the galaxy (Simien & Prugniel, 2002). No pattern can be distinguished in our and maps, in general with large uncertainties. Our results are consistent with the kinematic maps published by Nguyen et al. (2018).
The nucleus of NGC 205 is located, in Fig. 3 and 4, in the bottom-left region dominated by nuclei in early-type galaxies. Although this might be partially due to the impact of the PSF (see Appendix D), we suggest that it is also related to the complex structure suggested by both the kinematics and the stellar populations that were found in this blue NSC, whose total mass is M☉ (De Rijcke et al., 2006). Young stellar populations ( Gyr old) dominate, while they coexist with intermediate-age stars (Bica et al., 1990; Butler & Martínez-Delgado, 2005; Monaco et al., 2009; Nguyen et al., 2019), suggesting that this NSC was formed in different episodes and different mechanisms might have been at play. Its rotation decoupled from its larger scale host, points to a significant merger contribution for its stars or the gas originating them.
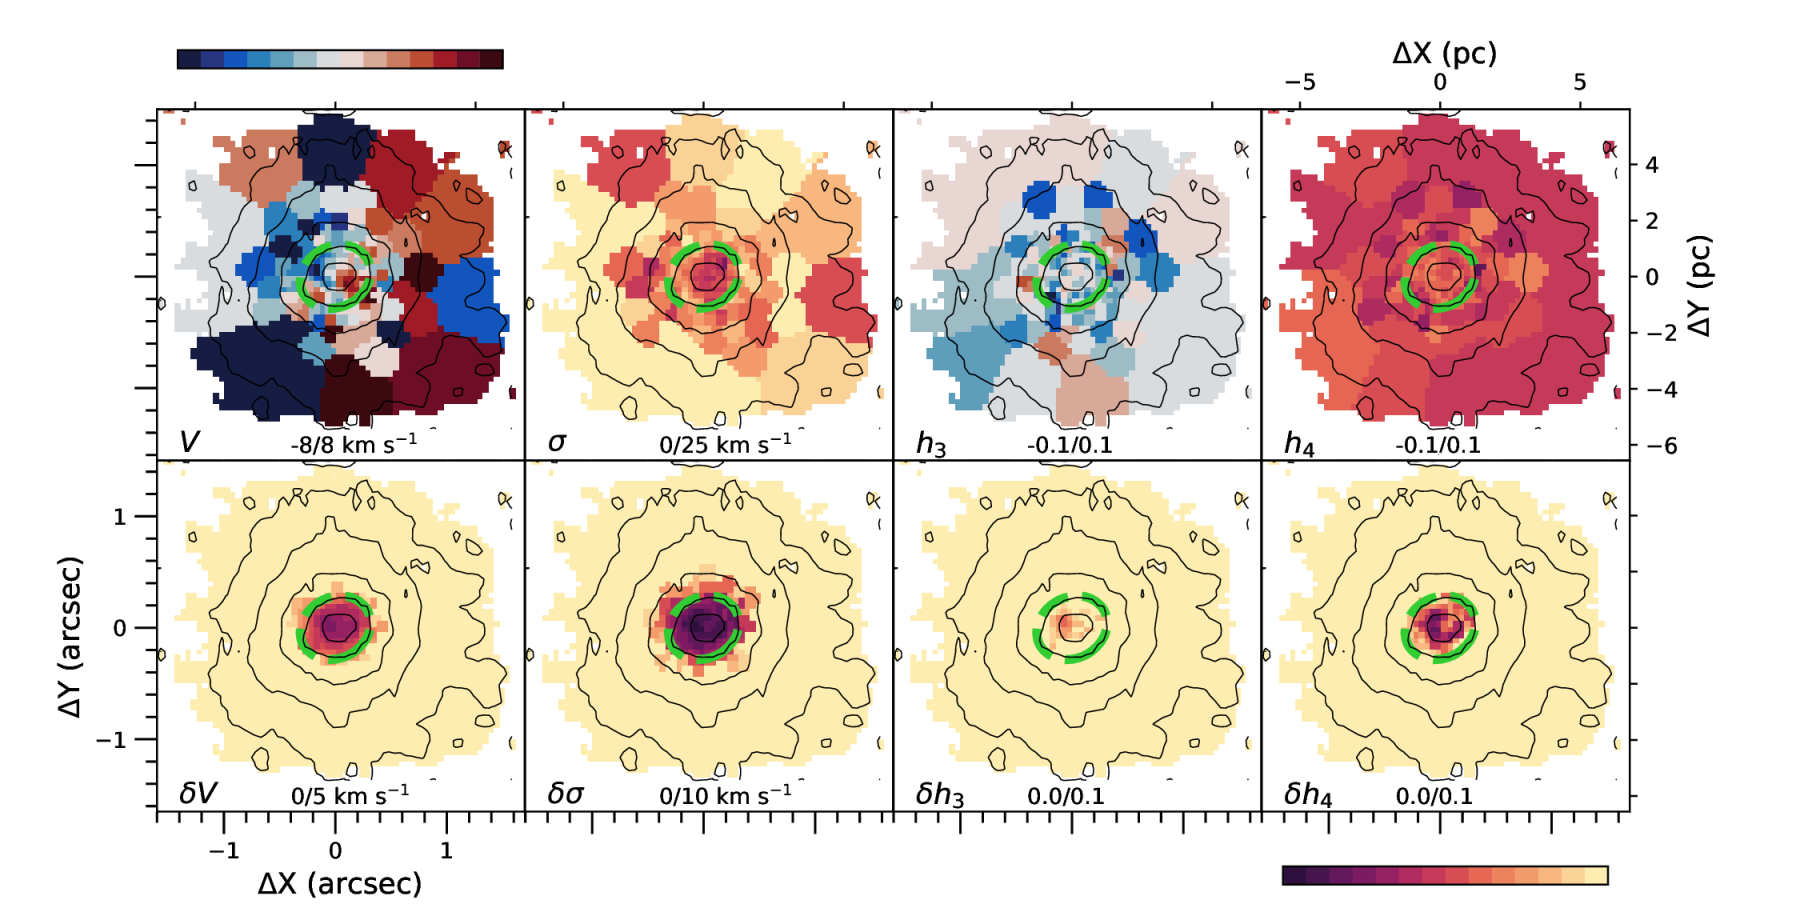
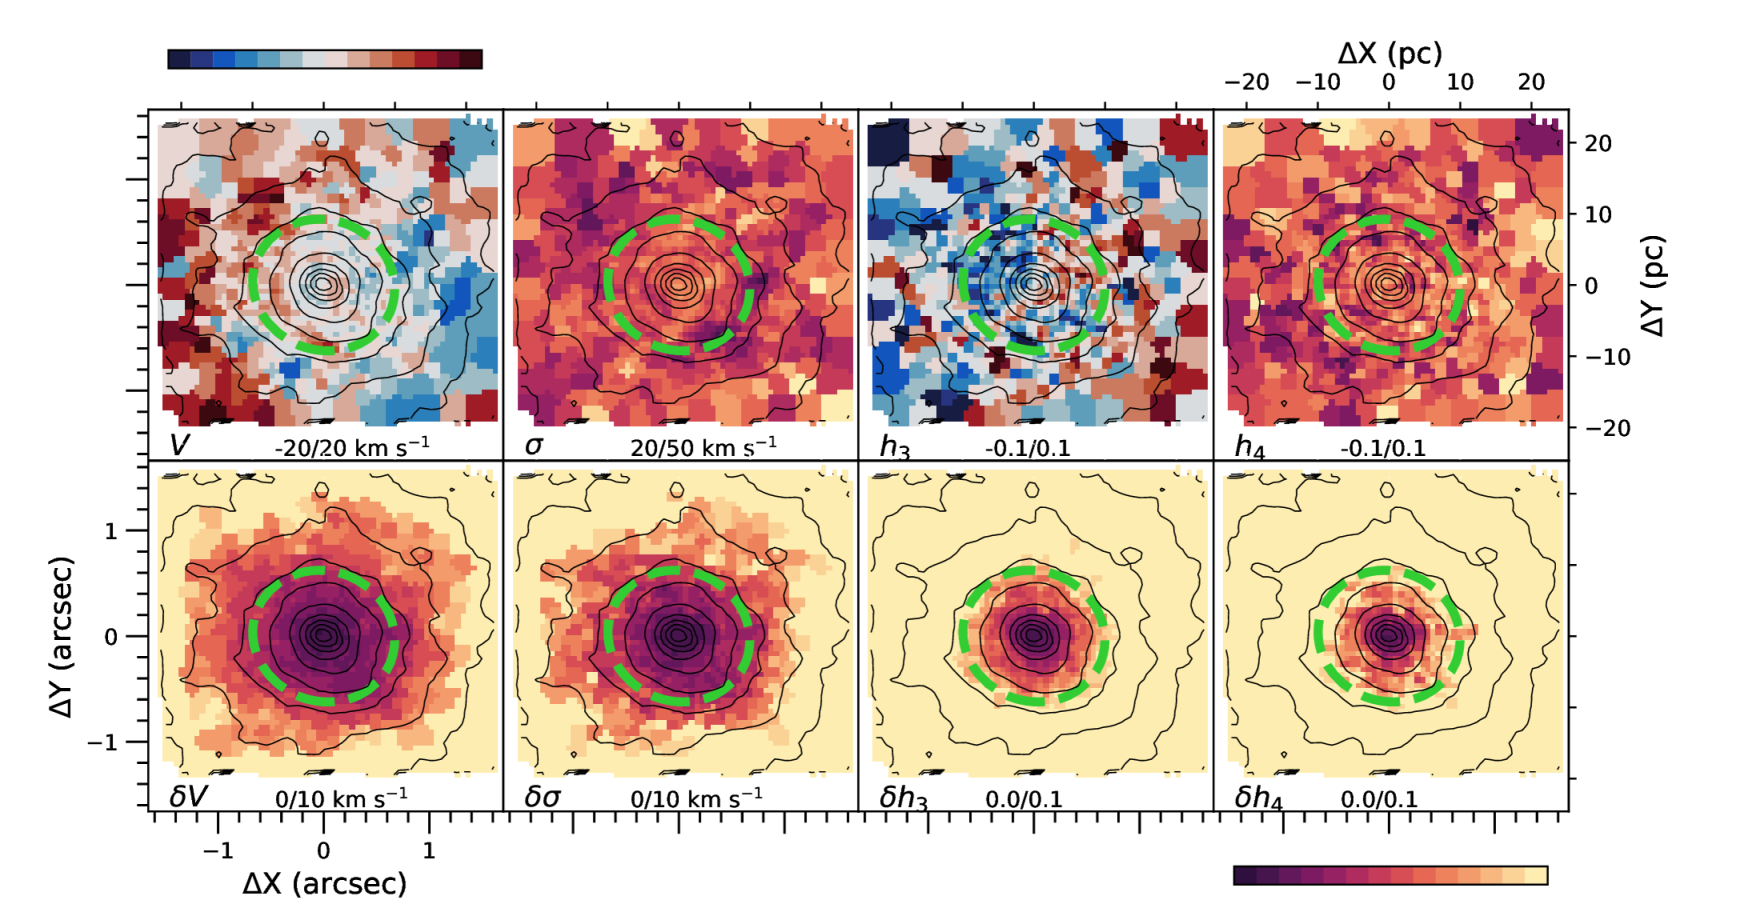
A.1.3 NGC 404
NGC 404 is a nearly face-on dwarf lenticular galaxy ( inclined, del Río et al. 2004), hosting a low-ionization nuclear emission-line region (LINER) (Ho et al., 1997; Dumont et al., 2020; Boehle et al., 2018), powered by a BH of M☉(Davis et al., 2020). Member of the galaxy group LGG 11, it is relatively isolated (Garcia, 1993; Williams et al., 2010a). NGC 404 is characterized by a prominent warped HI component, something rather exceptional for an early-type galaxy. An extended gaseous disk with a doughnut shape, with the optical galaxy located within the hole, is combined with a misaligned and kinematically-decoupled more elliptical annulus (del Río et al., 2004).
A merger origin was proposed for this complex structure, with recent star formation associated with a rejuvenating process (see also Bouchard et al. 2010; Williams et al. 2010a; Thilker et al. 2010). The properties in the central region of this galaxy, with a massive gas and dust cloud and younger stellar populations than in the disk, support this scenario and suggests a star formation in different episodes (Wiklind & Henkel, 1990; Tikhonov, N. A. et al., 2003; Cid Fernandes et al., 2005; Bouchard et al., 2010; Williams et al., 2010a; Seth et al., 2010). The complex stellar structure of NGC 404 may be the result of the combination of in-situ older components with newer ones acquired during mergers. These may have taken the galaxy through a morphological transition from spiral to lenticular (Bouchard et al., 2010).
The kinematics of NGC 404’s nucleus is shown in Fig. 10. We obtained good and maps in a large portion of the FoV, recovering the same structures and values (within our errors) as published by Seth et al. (2010). We add here and , with low uncertainties only within the elliptical isophote. Kinematics reveals a complex structure. Out of the ellipse, we observe a disk-like rotating structure, as also suggested by the anticorrelation. This component is kinematically decoupled from the close surroundings, but co-rotating with the HI disk (del Río et al., 2004; Bouchard et al., 2010; Seth et al., 2010). The region within the rotates slower and/or the lower measured might be due to the additional counter-rotating structure that is seen in the center of our map. This was already identified by Seth et al. (2010) within the central arcsec and associated with a distinct photometric component and the detection of hot dust. A higher within the than in the surroundings is observed. The central values are in agreement with Ho et al. (2009).
The presence of the inner counter-rotating component superposed to the outer one leads to a lower integrated rotation velocity and a higher dispersion in the LOS. In fact, NGC 404 is the lowest and left-most point in the diagrams in Fig. 3 and 4. While its location is probably affected by different factors such as the low inclination, the contamination of the underlying galaxy and the mass of the central BH, it might be mainly due to the presence of kinematically distinct components in the LOS (see also Sect. 5.2).
A dominant stellar age of Gyr and some other younger and older populations, suggest the formation of this NSC during bursts of star formation triggered by gas inflow during mergers (Cid Fernandes et al., 2005; Seth et al., 2010; Bouchard et al., 2010). Nguyen et al. (2017) suggested that the 1 Gyr population is most dominant in the central arcsec, indicating that the counter-rotating component was formed at that time, probably in situ after a minor merger, as suggested by its compactness. NIR emission lines in this nucleus revealed also gas thermal excitation from shocks (Seth et al., 2010; Boehle et al., 2018). The complex gas structure of the galaxy also points to the merger scenario. In conclusion, the position of this nucleus in the and diagrams might be indicating a complex NSC formation, led by past mergers either via star-cluster accretion or in-situ starbursts after gas inflow.
A.1.4 NGC 5102
NGC 5102 is located in the Cen A group and it is classified as an S0, although some of its properties are not typical of an early type (e.g. Davidge, 2008). For instance, it is bluer than a typical S0 and it has an extended H I disk (van Woerden et al., 1993). Davidge (2008) defined it as a post-starburst galaxy because of the signs of past large-scale star formation, and he suggested that it could have been a late-type spiral in the past. Integral-field spectroscopy data from MUSE (Mitzkus et al., 2017), covering up to the galaxy effective radius, revealed two counter-rotating disks, one more centrally concentrated than the other. Mitzkus et al. (2017) argued that the more extended disk had been formed already, when counter-rotating gas was accreted and formed the second disk (see also van Woerden et al. 1993). Stellar-population analysis shows a strong gradient in both age and metallicity, with younger and more metal-rich stars towards the center. X-ray emission was detected by Kraft et al. (2005) both as a point source in the center probably indicating a low-luminosity active galactic nucleus (LLAGN), and a diffuse emission, in the central kpc, probably due to hot gas shocked during the most recent starburst. A SMBH (M M☉) was detected by Nguyen et al. (2018; 2019).
This NSC was photometrically fitted by Nguyen et al. (2018) with two Sérsic components. One of them is more massive, flatter and more extended (with pc) than the inner younger one (with pc). Not the entire outer component was covered by the SINFONI FoV. In Fig. 11 we indicate with a green dashed ellipse the area where we integrated and (see Sect. 4.5). The region in our FoV displays relatively strong rotation, with maximum values at almost 40 km s-1 (top-left panel). This rotation corresponds to the outer Sérsic component. Nguyen et al. (2018) suggested that both components may have been formed in situ, in different episodes, from gas inflow related to mergers. Davidge (2015), Mitzkus et al. (2017) and Kacharov et al. (2018) measured ages of Gyr in the NSC, much younger and more metal poor than the surrounding galaxy. The nuclear outer component co-rotates with the larger-scale inner disk found by Mitzkus et al. (2017), and both counter-rotate with respect to the outer galaxy. Therefore, both may have formed from the same gas-accretion processes.
The very central region is associated with a peak in velocity dispersion up to km s-1 (second top panel from left), consistent with the presence of a SMBH. and are anticorrelated respectively with and , although their values show large relative uncertainties. This NSC appears to be more massive than the average for galaxies with similar stellar mass or velocity dispersion, with a NSC stellar mass of M☉(Nguyen et al., 2018). Like the massive one in M 32, it lies in the upper region of the and diagrams (Fig. 3 and 4), more typical of late-type hosts. Both galaxies may show, in their nuclear kinematics, hints of their past as spirals and of the interactions that led to their transformation to early types.
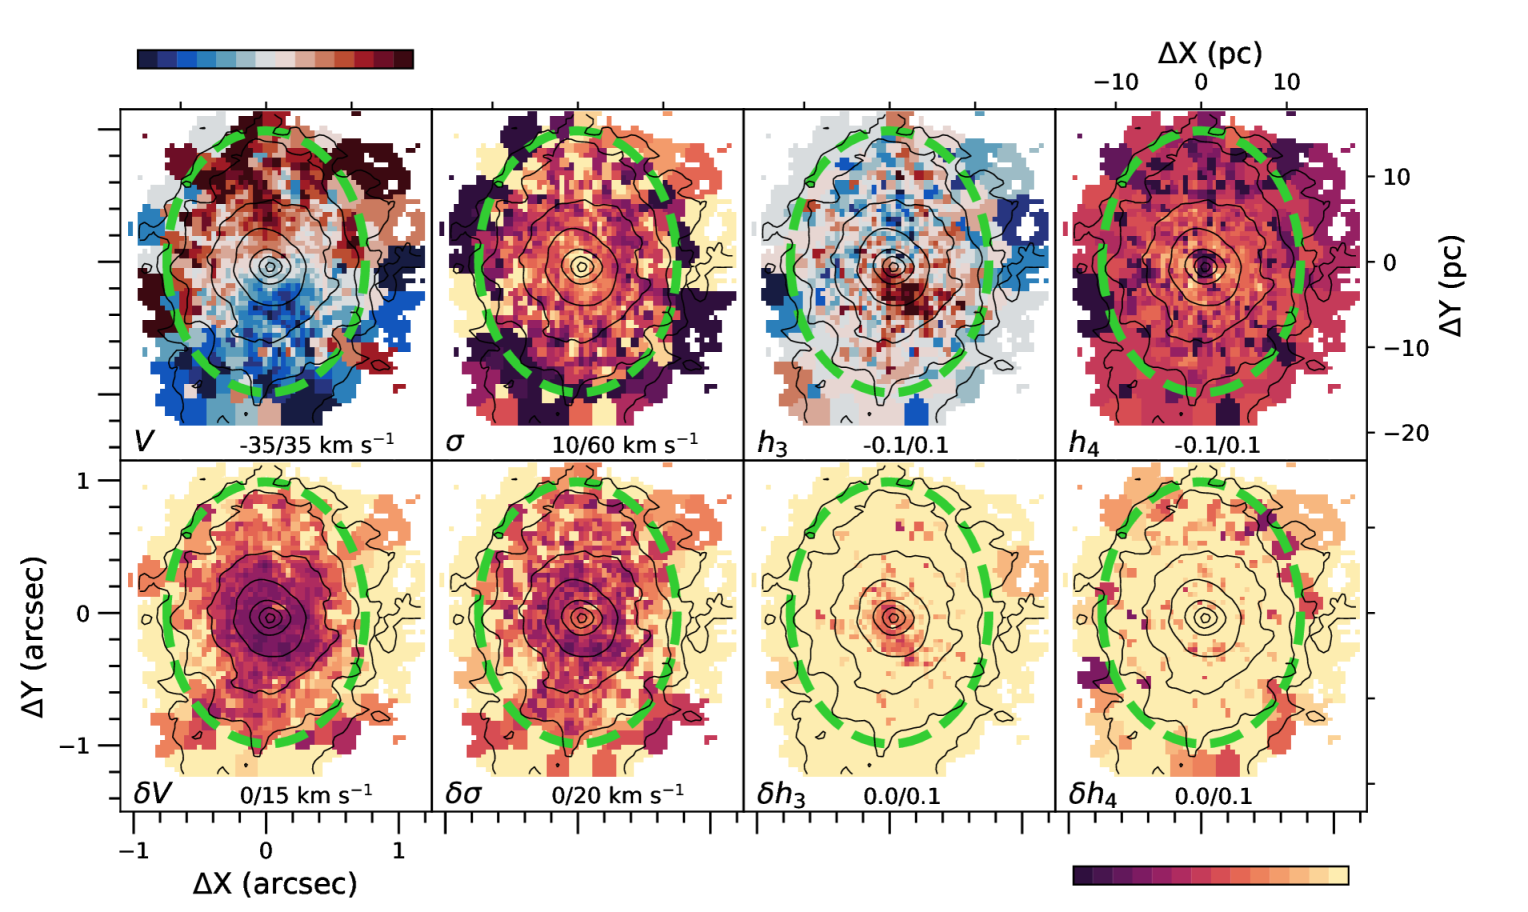
A.1.5 NGC 5206
NGC 5206 is another nucleated S0 galaxy in the Cen A group. Not much is found in the literature about the past of this galaxy. However, the following complex structure may be the signature of past interactions. Apart from the bright nucleus (Caldwell & Bothun, 1987), its brightness profile may indicate the presence of a bulge-like component, with a bulge-to-total flux ratio of 0.08, closer to values of typical spiral galaxies (Laurikainen et al., 2010). Moreover, Laurikainen et al. (2010) described a “very faint dispersed bar” (at radii lower than 1.4 kpc) and a faint lens-like structure at radii lower than 0.3 kpc. In contrast, Nguyen et al. (2018) fitted HST images with only one (disk) component apart from the NSC. They observed a color gradient towards bluer stars in the center. Some ionized gas was detected in this galaxy (Cote et al., 1997; Kennicutt et al., 2008), and a poor atomic gas fraction (lower than 0.1%) was calculated by de Swardt et al. (2010). Nguyen et al. (2018; 2019) detected a SMBH of M M☉.
Nuclear kinematic maps of NGC 5206 (Fig. 12) are characterized by slow rotation and higher velocity dispersions in the very central region, closer to the SMBH. Nguyen et al. (2018) presented kinematic maps in a smaller central region, with results consistent with ours. No structures can be identified in our maps of and . As in NGC 5102, the brightness profile of the NSC was fitted with a double Sérsic (Nguyen et al., 2018). However, in this case, the two components have similar morphologic and kinematic properties. Kacharov et al. (2018) analysed the stellar populations of this NSC and proposed a continuous star formation and gradual chemical enrichment. Most NSC stars would have been formed less than 4.5 Gyr ago, with a peak Gyr ago. No substantial difference in age and metallicity was found with respect to the surrounding field stars of the galaxy. As NGC 205, it is located, in Fig. 3 and 4, in the bottom-left region but close to the “late-type dominated region”. In both galaxies, this might be related to the composition of different stellar populations with different kinematic signatures.
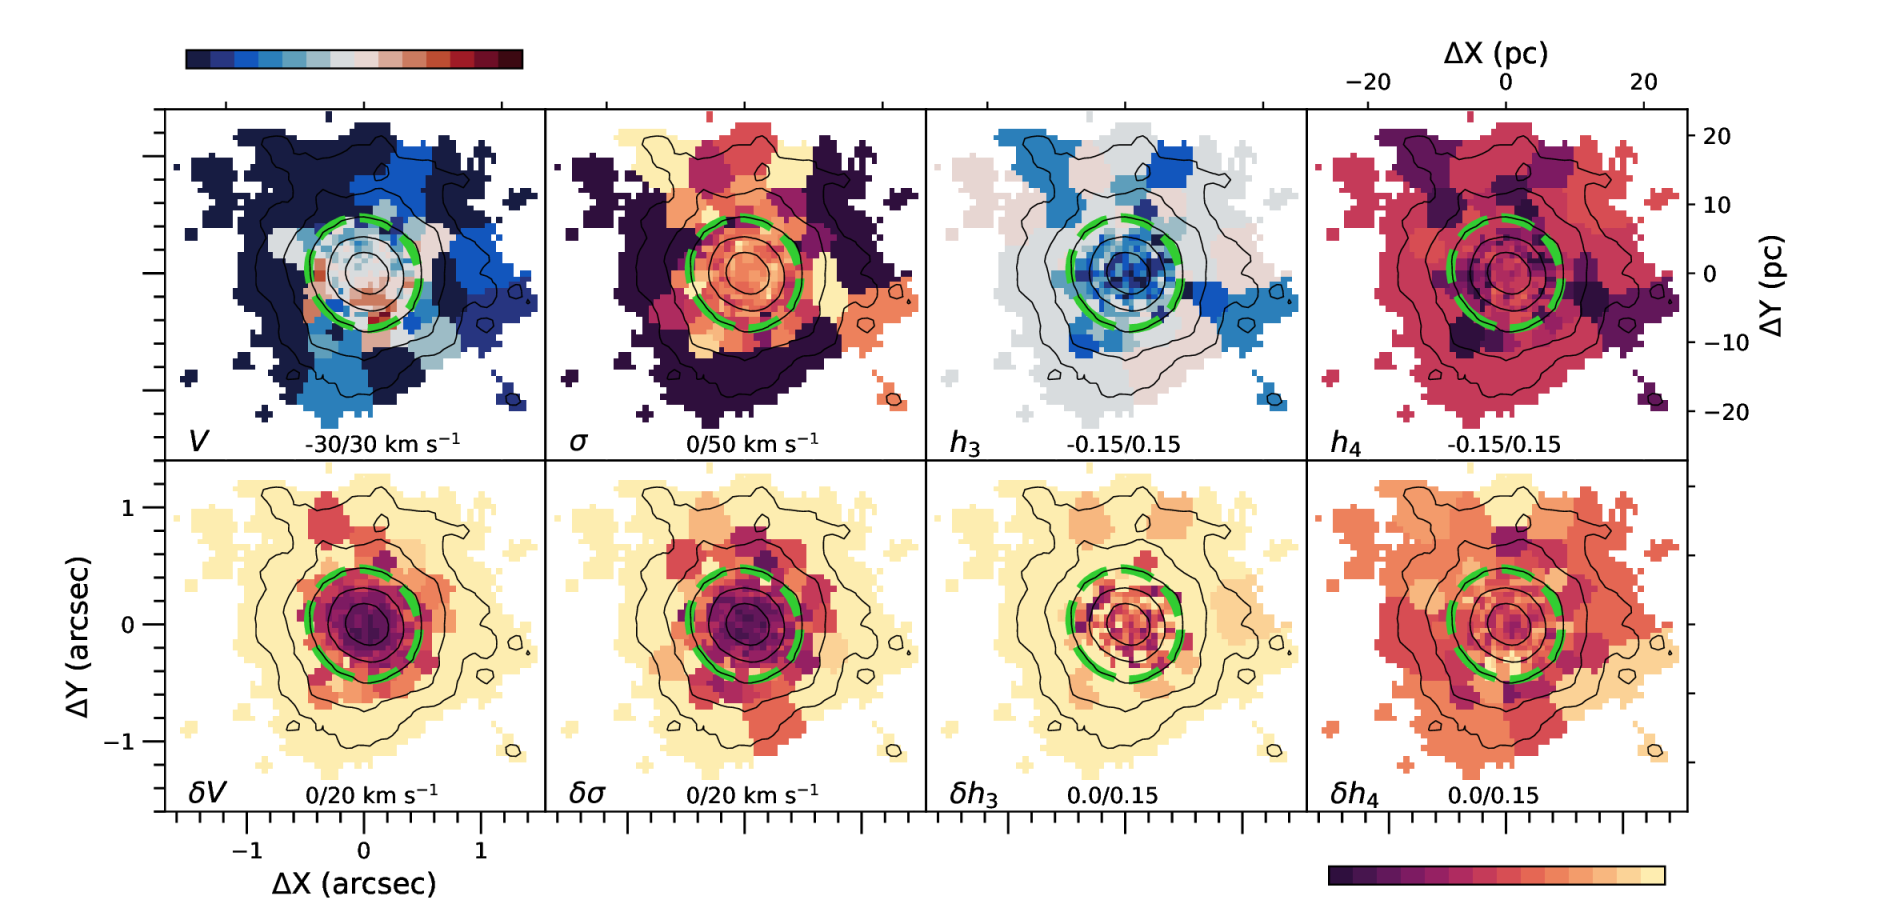
A.2 Late-type galaxies
Six host galaxies of our eleven nuclei are classified as late types (Table 1). Host galaxies and nuclear kinematics are individually described and briefly discussed as follows.
A.2.1 M 33
M 33 is a late-type spiral in the Local Group, thought to be orbiting around M 31 (e.g., van der Marel & Guhathakurta, 2008). Weak tidal interactions with M 31 were proposed to explain different atomic and ionized-gas structures, such as extended disk warps, an arc, and a filament (e.g., Corbelli et al., 1989; Corbelli & Schneider, 1997; Putman et al., 2009; Corbelli et al., 2014; Semczuk et al., 2018; Tachihara et al., 2018). The gas in these features, coming from a galactic fountain and/or being previously stripped from M 33’s disk in a previous interaction, is now falling back, fuelling the intense ongoing star formation (Putman et al., 2009; Zheng et al., 2017).
With no observed bulge, a halo component and a kinematically-distinct stellar stream were detected by McConnachie et al. (2006). The galaxy disk shows stellar-population gradients that are consistent with an inside-out formation scenario (Beasley et al., 2015; Mostoghiu et al., 2018). However, these gradients are inverted outside the star-forming disk, suggesting a different (outside-in or ex-situ) origin (see also Davidge 2003b and Robles-Valdez et al. 2013). No signatures were found of any SMBH in M 33 (e.g., Gebhardt et al., 2001). However, it hosts a bright X-ray and radio source in its center (Long et al., 1981; White et al., 2019) and it has been debated whether this emission is associated with a central (low-mass, M☉) BH (e.g., Gebhardt et al., 2001; Merritt et al., 2001).
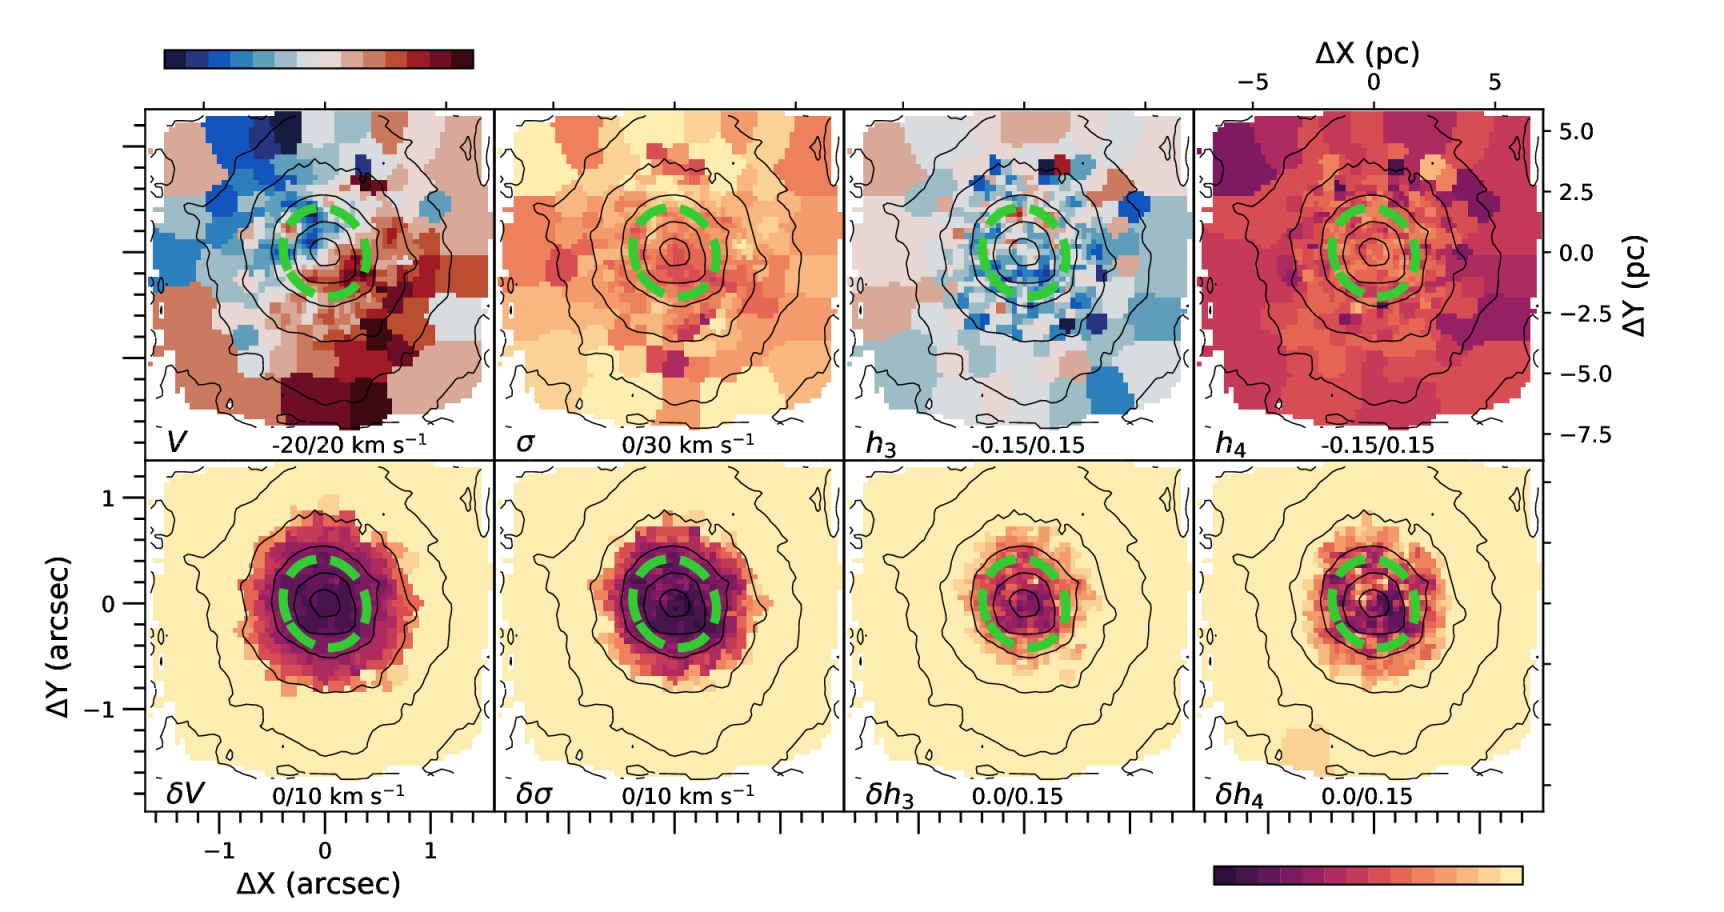
Maps of the kinematics of the nucleus in M 33 are shown in Fig. 13. Very high spatial resolution is maintained in the (almost unbinned) central region of M 33’s nucleus, where uncertainties are below 5 km s-1. Clear rotation is shown throughout the FoV, while the velocity dispersion drops within , with values consistent with Kormendy & McClure (1993) and Gebhardt et al. (2001). This kinematics supports the lack of a central SMBH and is compatible with a low-mass central BH. A anticorrelation is hinted while no structures are visible in the map. The subtraction of individual stars from M 33’s data cube might be not perfect and leads to some residual structures that are seen in the maps.
The nucleus of M 33, with a dynamical mass of M☉ (Kormendy et al., 2010), was defined as very compact. It is characterized by younger stars than the surroundings and bluer colors towards its center (Kormendy & McClure, 1993; Lauer et al., 1998; Carson et al., 2015). It shows an important amount of dust, compatible with one or more strong starbursts occurred in the last Gyr (Gordon et al., 1999; Davidge, 2000; Long et al., 2002), probably fuelled by the observed gas infall. Hartmann et al. (2011), simulating the accretion of young stellar clusters to an in-place nuclear disk, could recover the properties of the NSC in M 33 (rotation, size, ellipticity) only when the in-situ disky component still dominated in mass. They concluded that gas accretion is needed to explain NSC formation in late-type spirals.
A.2.2 NGC 2403
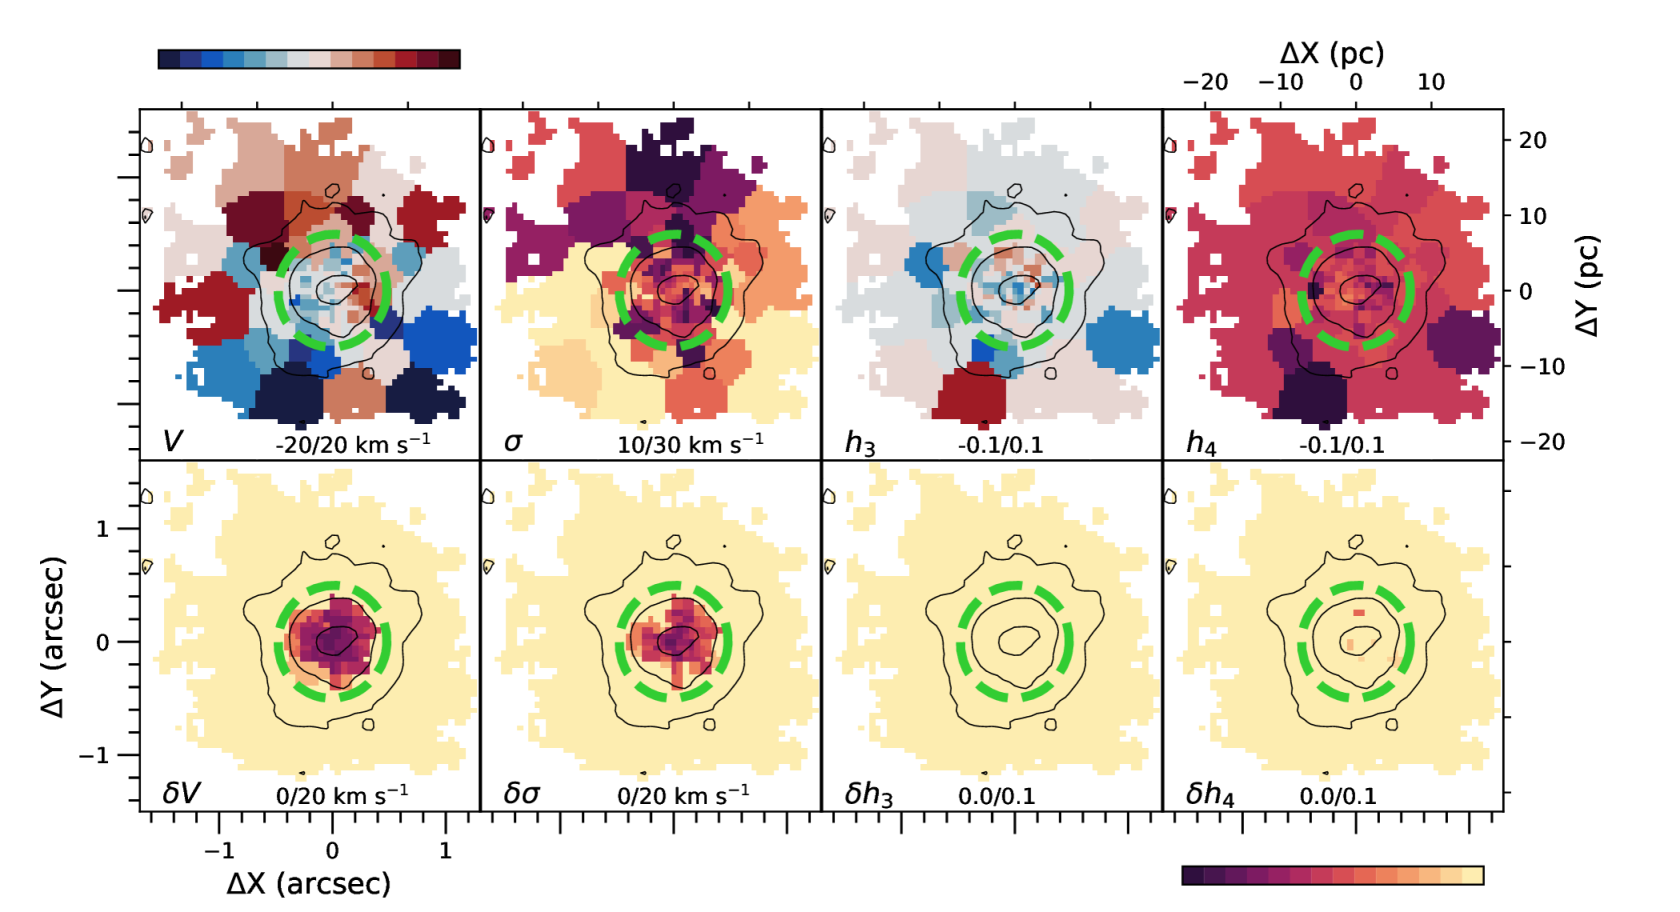
NGC 2403 is very similar to M 33 in its morphology, brightness, size, gas chemical properties and star-formation history (Garnett et al., 1997; Davidge & Courteau, 2002; Davidge, 2003b). The transient X-ray source detected by Yukita et al. (2007) suggests the presence of a low-mass BH, of similar properties to the one in M 33’s center. Being the second brightest galaxy of the M 81 group, it is located in its outskirts (e.g., Karachentsev et al., 2002; Williams et al., 2013; Carson et al., 2015). Farther from M 81 than M 33 from M 31 (e.g., Davidge, 2003b), its higher oxygen yield than M 33 suggests it probably did not suffer from a similar gas stripping (Garnett et al., 1997). Nevertheless, it is approaching to M 81 and has several faint dwarf satellites. A close one of them is old, metal poor and has no gas (Karachentsev et al., 2002, 2013; Carlin et al., 2016).
NGC 2403 has an extended and complex gas and dust structure (Guélin & Weliachew, 1969; Shostak, 1973; Fraternali et al., 2002b; Bendo et al., 2007). Apart from the warped HI disk, an additional component, moving towards the galactic center, was observed by Fraternali et al. (2001, 2002b). It was interpreted as the result of a galactic fountain or an active gas channel between the disk and the halo (Fraternali et al., 2002a). An additional cloud close to NGC 2403, probably stripped from a satellite, was later discovered (de Blok et al., 2014). The stellar component is distributed in a young undisturbed disk, and a more extended, thicker and fainter component, which is older and metal poor (Davidge, 2003b; Barker et al., 2012; Williams et al., 2013).
Slow rotation is seen in the central region of this low-surface-brightness nucleus that appears to be almost face on (Fig. 14). Its low velocity dispersion (slightly higher in the very center) is in agreement with a low-mass BH. This NSC is younger than the surrounding central region of the galaxy, as well as the one in M 33, but even bluer (Davidge & Courteau, 2002). However, the absence of significant emission from ionized gas suggests that the star formation might have recently halted (Drissen et al., 1999; Böker et al., 1999). The NSC displays a larger size with longer wavelengths (Carson et al., 2015), as well as M 33, suggesting that it was formed in different star-formation episodes, from gas funnelled from the different structures observed around.
A.2.3 NGC 2976
This bulgeless galaxy is classified as an Sc peculiar and it is located in the core of the M 81 Group (e.g., Karachentsev et al., 2002). This region is covered by a system of HI clouds, filaments and bridges connecting galaxies, including NGC 2976, to M 81 (Appleton et al., 1981; Chynoweth et al., 2008). Past interactions of NGC 2976 within the group are further supported by other studies (Drzazga et al., 2016; Carozzi-Meyssonnier, 1980; Adams et al., 2012). The stellar populations are distributed in a young inner disk and in an old outer component (disk or halo) (Bronkalla & Notni, 1990; Bronkalla et al., 1992). Inner-disk star formation, distributed in a ring-like structure, as well as outside-in gas depletion in the outer component, were probably triggered by the group environment (see also Williams et al. 2010b). Gas would have been stripped from the halo and/or channelled towards the galaxy center. Another consequence of this might be the formation of a weak (gas-rich) bar, connecting two strong H-emission spots on both sides of the galaxy and favouring a potential nuclear starburst forming the NSC (Tacconi et al., 1990; Daigle et al., 2006; Menéndez-Delmestre et al., 2007; Spekkens & Sellwood, 2007; Grier et al., 2011; Adams et al., 2012; Valenzuela et al., 2014).
The kinematics of this nucleus (Fig. 15) shows clear rotation throughout the full FoV, even in the regions where large uncertainties warn us not to trust absolute values. Due to the low S/N, especially out of the elliptical isophote, it is challenging to distinguish any structures in the maps of the higher moments and . We know from photometry that this NSC displays some clumpiness and a significant flattening, as a disk oriented in the same way as the galaxy (Carson et al., 2015). The evidence provided for gas inflow towards the galactic center, with the bar playing a significant role, supports an in-situ formation for this NSC. However, it may have been formed in different star-formation episodes or by different formation mechanisms, since asymmetric stellar populations were identified by Carson et al. (2015). It has a more compact bluer component to the north (with the HI structures in the north-east direction, e.g. Chynoweth et al. 2008) and a more extended and irregular redder component to the south.
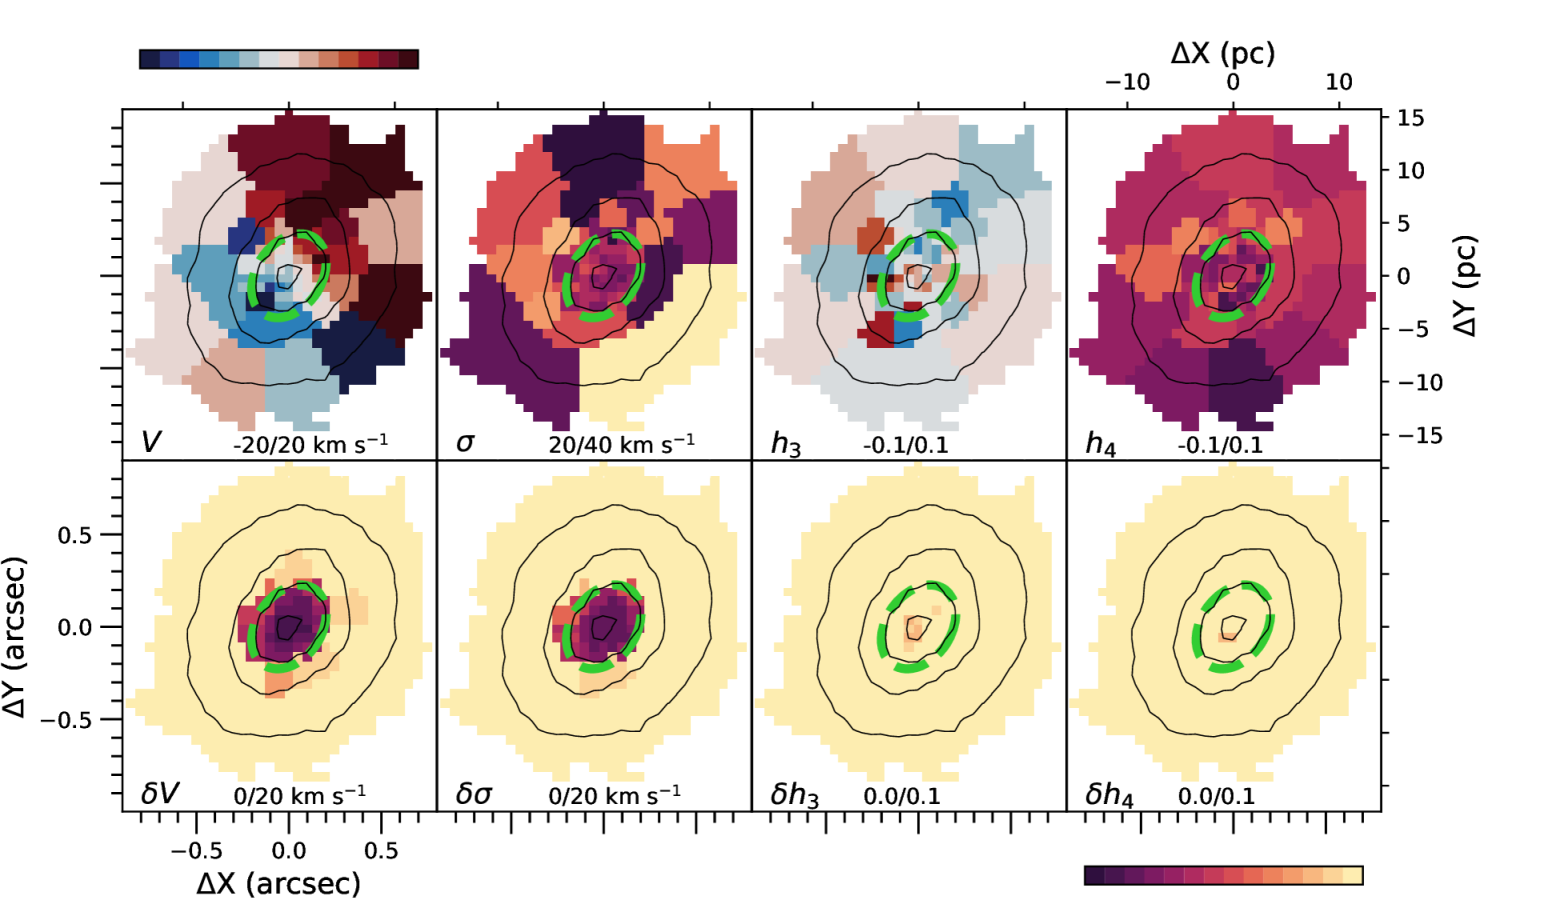
A.2.4 NGC 4244
NGC 4244 is an edge-on late-type spiral, member of the M 94 Group and probably weakly interacting with NGC 4214 (e.g., Seth et al., 2005a, b; Comerón et al., 2011; Carson et al., 2015). Bulgeless, its brightest components are a prominent disk and a NSC. The disk was fitted vertically with two components, a thin and a thick disks, by Comerón et al. (2011). It is characterized, at increasing distances from the midplane, respectively by young, intermediate and old stars (Seth et al., 2005a, b). These populations break all at the same radius, pointing to a past interaction that may also explain the presence of a stellar diffuse component (de Jong et al., 2007; Seth et al., 2007). NGC 4244 has a massive and thick HI disk. A warped and a flaring components, as well as other peculiar features in correspondence of star-forming regions, were observed (Olling, 1996; Zschaechner et al., 2011). At a smaller scale the stellar disk warps in the opposite direction to the HI disk, and shows signs of potential tidal interactions (Comerón et al., 2011). This galaxy may host in its center a massive BH of M☉ (Hartmann et al., 2011; De Lorenzi et al., 2013).
The nearly edge-on nucleus of NGC 4244 (Hartmann et al., 2011) shows the highest ratio between circular and random motions in our sample (see Fig. 3 and 4), with the highest . Its kinematic maps are shown in Fig. 16 and are in agreement with the ones shown by Seth et al. (2008). Values of within the central region, with reasonable uncertainties, are consistent with measurements from Ho et al. (2009). A clear rotation pattern, anticorrelated with , indicates a disky structure. In fact, the nucleus of NGC 4244 is made up by a compact spheroidal component and a more extended disk, co-rotating with the HI disk (Seth et al., 2008; Carson et al., 2015). Multiple stellar populations were identified in this NSC, with young stars ( Myr) dominating the disk component. Old and more metal-poor stellar populations dominate above and below the midplane (Seth et al., 2006, 2008). A combined accretion of gas and star clusters from the galaxy disk was proposed for the formation of this massive NSC ( M☉), supported by results from simulations and dynamical models (Hartmann et al., 2011; De Lorenzi et al., 2013).
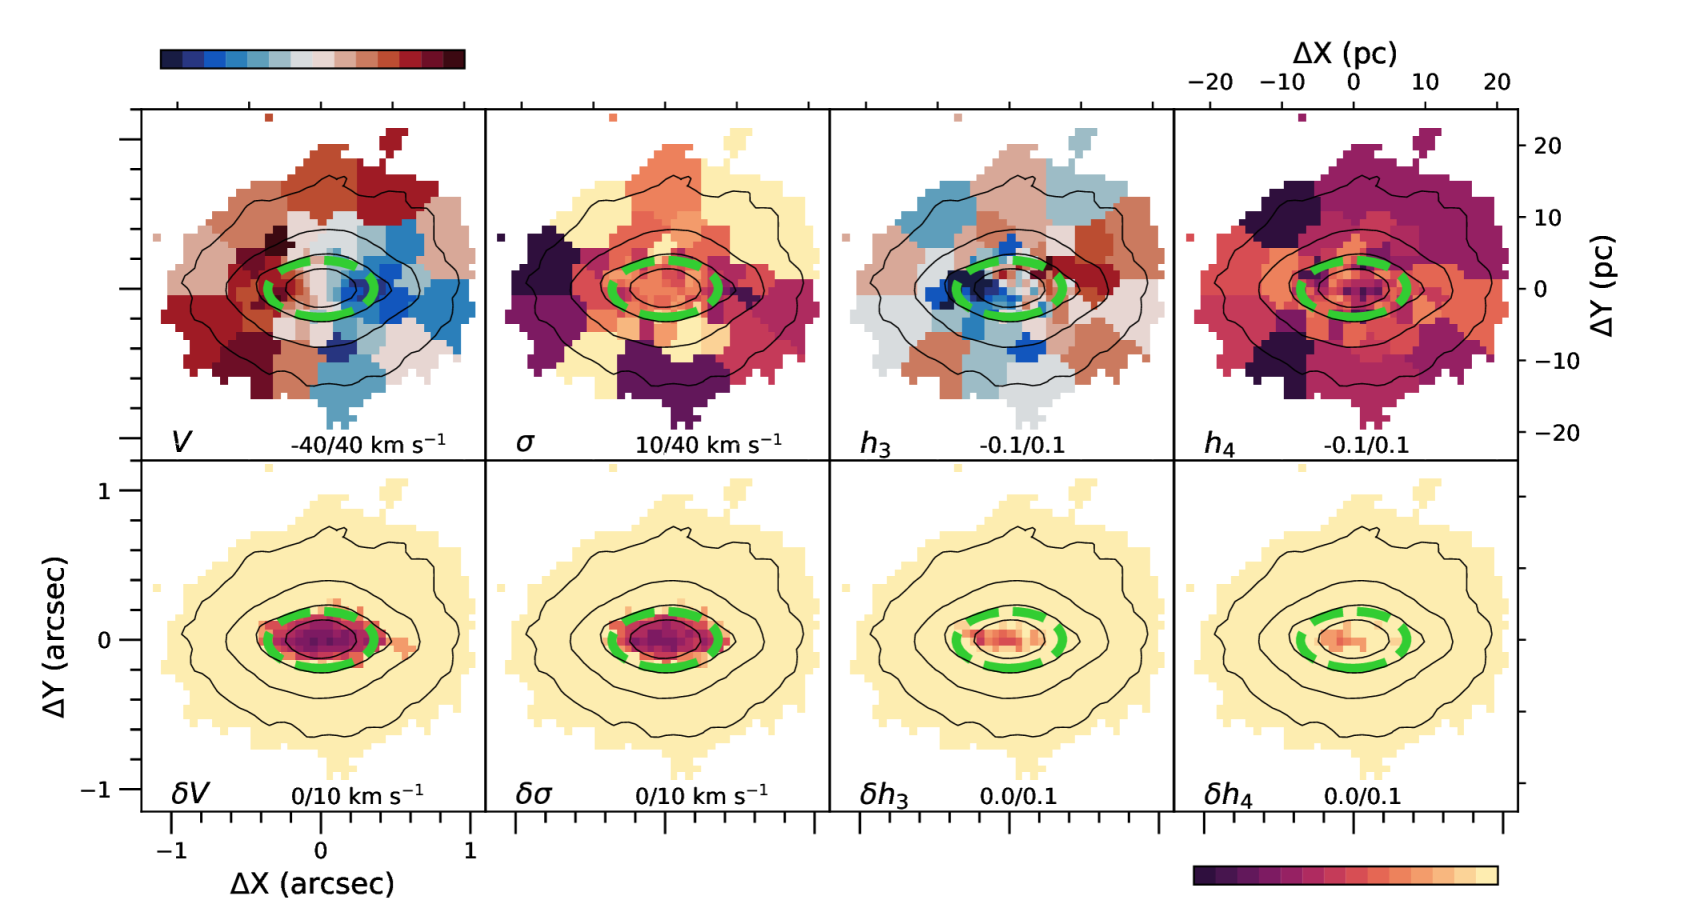
A.2.5 NGC 4449
NGC 4449 is a luminous irregular galaxy with intense recent star formation and a rich population of star clusters of all ages (Kumari et al., 2017; Whitmore et al., 2020). Numerous studies presented hints of recent interactions, such as stellar tidal streams and, on the west side of the galaxy, a star cluster with a tidal structure which could be the remnant nucleus of a disrupted dwarf galaxy (Martínez-Delgado et al., 2012; Annibali et al., 2008). Although NGC 4449 appears relatively isolated, since its only close companion (in the projected space) is DDO 125, a past interaction between the two galaxies was suggested, e.g., by Theis & Kohle (2001) and Valdez-Gutiérrez et al. (2002). This would explain the complex morphology and kinematics of the extended gas structure around NGC 4449 (Bajaja et al., 1994; Hunter, 1997; Hunter & Gallagher, 1997). Pointing to the same direction, counter-rotation has been observed in the inner gas component (within kpc) with respect to the outer gas envelope (Hunter et al., 1998).
In Fig. 17, we observe slow rotation and low values of . The kinematic analysis of this nucleus was the most challenging in our sample, due to the combination of the lowest S/N among our data cubes and the low absolute values of the kinematic parameters (proving the limits of our method). The nucleus of NGC 4449, associated with intense emission of ionized gas, shows no evidence of old populations and hosts the youngest stars of the galaxy ( Myr old) (Böker et al., 1999; Gelatt et al., 2001; Annibali et al., 2008). The latter indicate a very recent starburst, probably a consequence of a violent event that doubled the star-formation rate between 10 and 16 Myr ago (Cignoni et al., 2018; Whitmore et al., 2020).
The relatively low metallicity shows that these stars were formed from gas that was not significantly enriched (Böker et al., 2001). This is also confirmed by the lower metallicity of ionized gas in the central region than in the rest, suggesting metal-poor gas accretion during a potential recent merger (Kumari et al., 2017). This gas might have been funnelled towards the galactic center by the S-shaped structure that was observed in this nuclear region (Gelatt et al., 2001). This might be a bar-like debris of a past interaction, probably a small (accreted) spiral seen edge-on. This structure (9.5 pc long, Gelatt et al. 2001), might be the rotating structure in the center of our FoV.
Looking like a good candidate for a pure gas-accretion NSC formation, we would have expected to find this nucleus in an upper location in Fig. 3 and 4. Its peculiar nature (and of its host), and the potential composition of different structures in the LOS as a result of mergers, might explain why it is the lowest point for late-type galaxies in our diagrams. In alternative, its very young age and mass lower than M☉ (Georgiev et al., 2016) might be implying that it did not have time to grow enough and reach the high rotation levels typical of the most massive NSCs such as M 32, NGC 4244, NGC 5102 and NGC 7793.
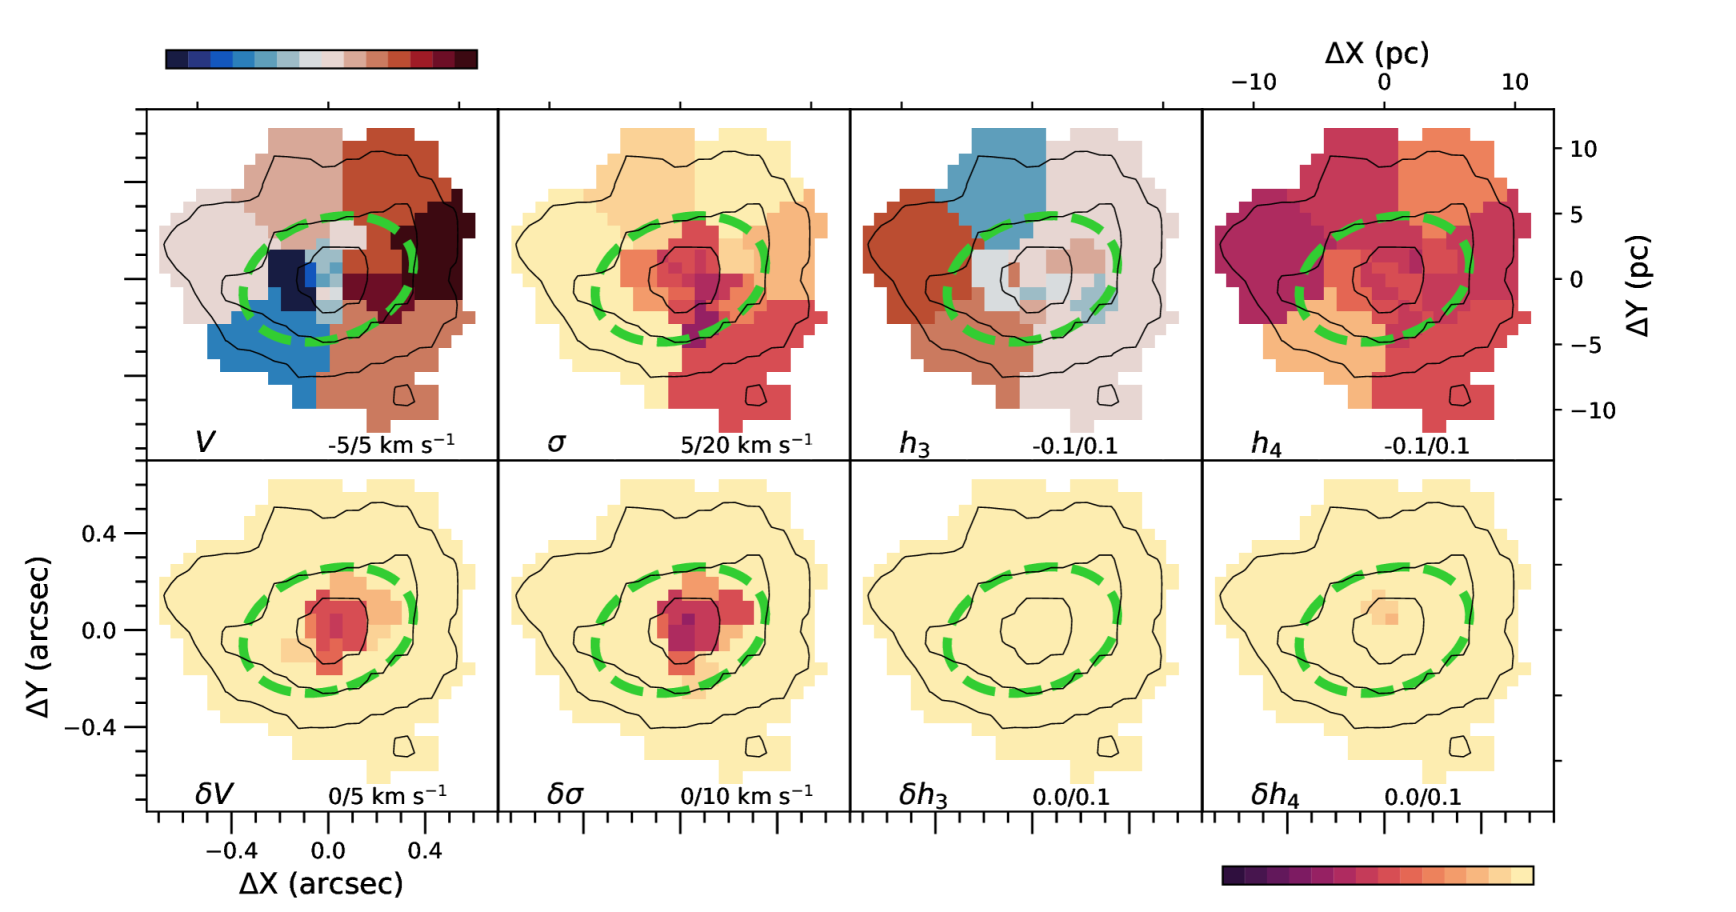
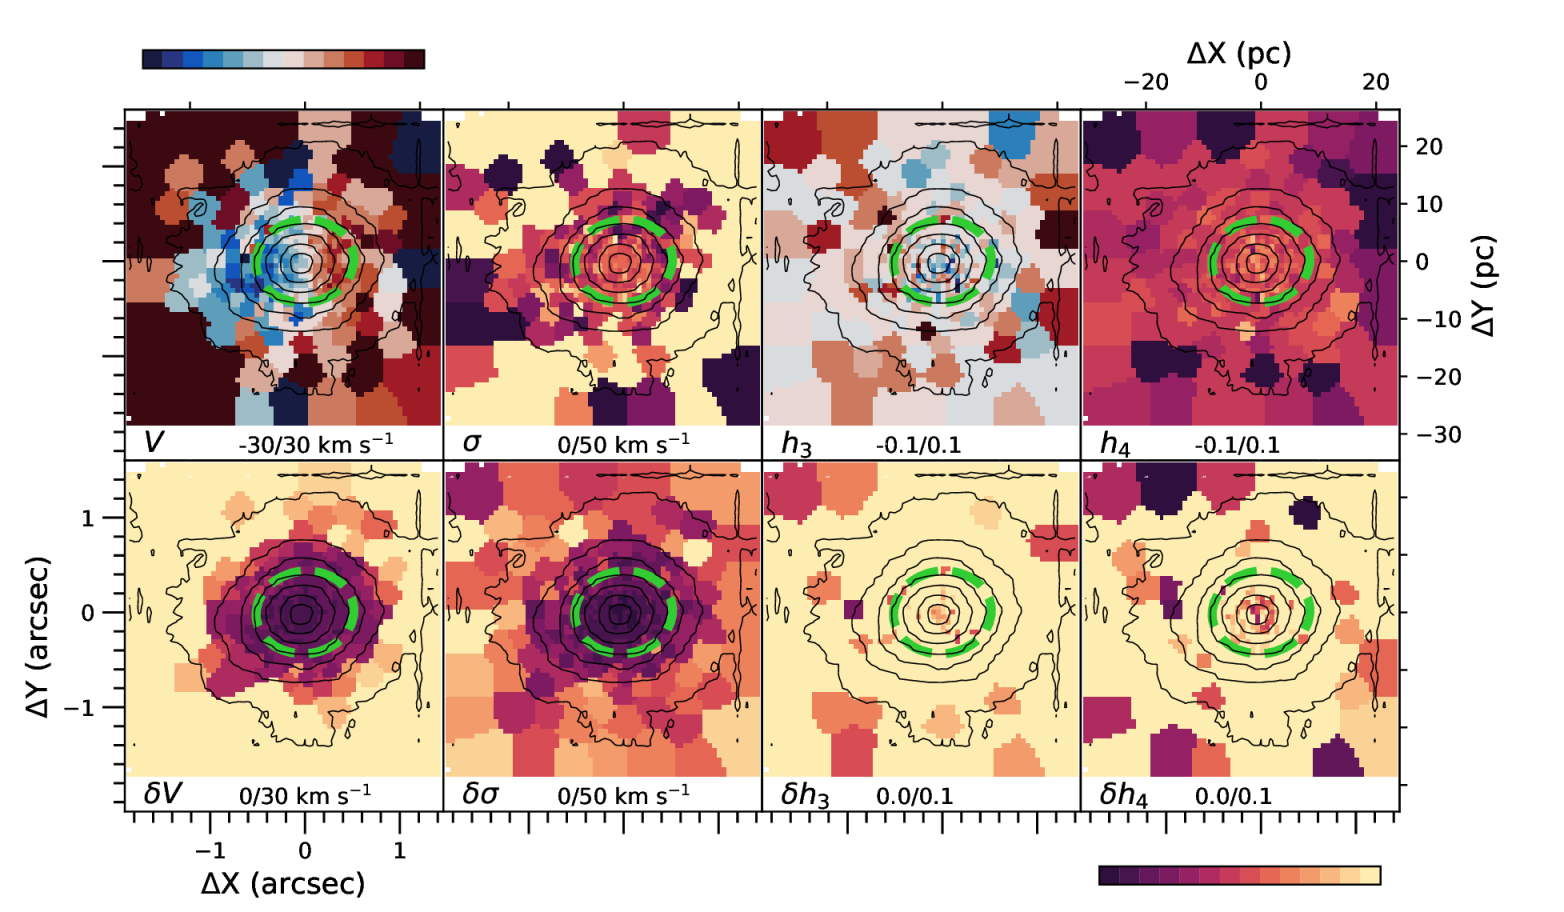
A.2.6 NGC 7793
NGC 7793 is a bright spiral galaxy, member of the Sculptor group. It has two dwarf close companions in the same subgroup (Karachentsev et al., 2003). Considered as the prototype of Sd galaxies (Shapley, 1943), it has no bulge (but a bright nucleus). It is rich in star-forming regions in its multiple fragmented and clumpy spiral arms (de Vaucouleurs & Davoust, 1980; Smith et al., 1984; Sacchi et al., 2019). Both the extended HI and diffuse H components show a declining rotation curve, some level of non-circular motions, and a warp in the outskirts. (Dicaire et al., 2008; Carignan & Puche, 1990; Davoust & de Vaucouleurs, 1980; de Vaucouleurs & Davoust, 1980). The stellar disk of NGC 7793 is made up by an old underlying component and young populations in the spiral arms (de Vaucouleurs & Davoust, 1980; Davidge, 1998). Old stars, with an upturn in their brigthtness profile in the outskirts, extend farther than the young populations and than the HI disk. Radial migration was proposed by Radburn-Smith et al. (2012) to explain this. The resolved star-formation history of NGC 7793 reveals an increase in the star-formation rate in time and spatially from the inner to the outer regions, pointing to a inside-out growth of the disk (Sacchi et al., 2019). A massive BH of was recently estimated by Neumayer et al. (in prep.).
The NSC in NGC 7793 is rather massive ( M☉, Walcher et al. 2005). It shows clear rotation around its minor axis, with a slightly asymmetric pattern (Fig. 18). Velocity dispersion assumes slightly higher values in the very central region, that are in agreement with the average velocity dispersion from Walcher et al. (2005) ( km s-1), measured over a 10-arcsec-long slit. It is difficult to distinguish any structures in the and maps, with high relative uncertainties. NGC 7793’s nucleus, dominated by very young stars, is one of the many star-formation regions in this galaxy (Diaz et al., 1982; Shields & Filippenko, 1992; Walcher et al., 2006; Kacharov et al., 2018). A color gradient and a UV-prominent ring structure showed that youngest stars are mainly located in the outer part of the NSC, suggesting circumnuclear star formation (Carson et al., 2015). The position of this nucleus in the and diagrams (Fig. 6 and 7), in the upper region, suggests in-situ formation as the dominant formation mechanism. On the other hand, results on the stellar-population properties of this NSC, consisting in a variety of ages and metallicities, point towards multiple star clusters mergers contributing the older components (Kacharov et al., 2018).
Appendix B radial distribution in the nuclear regions of the eleven early and late-type galaxies in our sample
We show in Fig. 19 the radial profiles of for each nucleus in our sample. Each point corresponds to and in each Voronoi bin, as mapped in figures from 8 to 18. Points and names of early-type galaxies are plotted in red and the ones of late-type galaxies in blue. Error bars, plotted in grey, correspond to the uncertainties mapped in figures from 8 to 18. These plots may help the assessment and interpretation of Fig. 3, 4, 6, and 7.
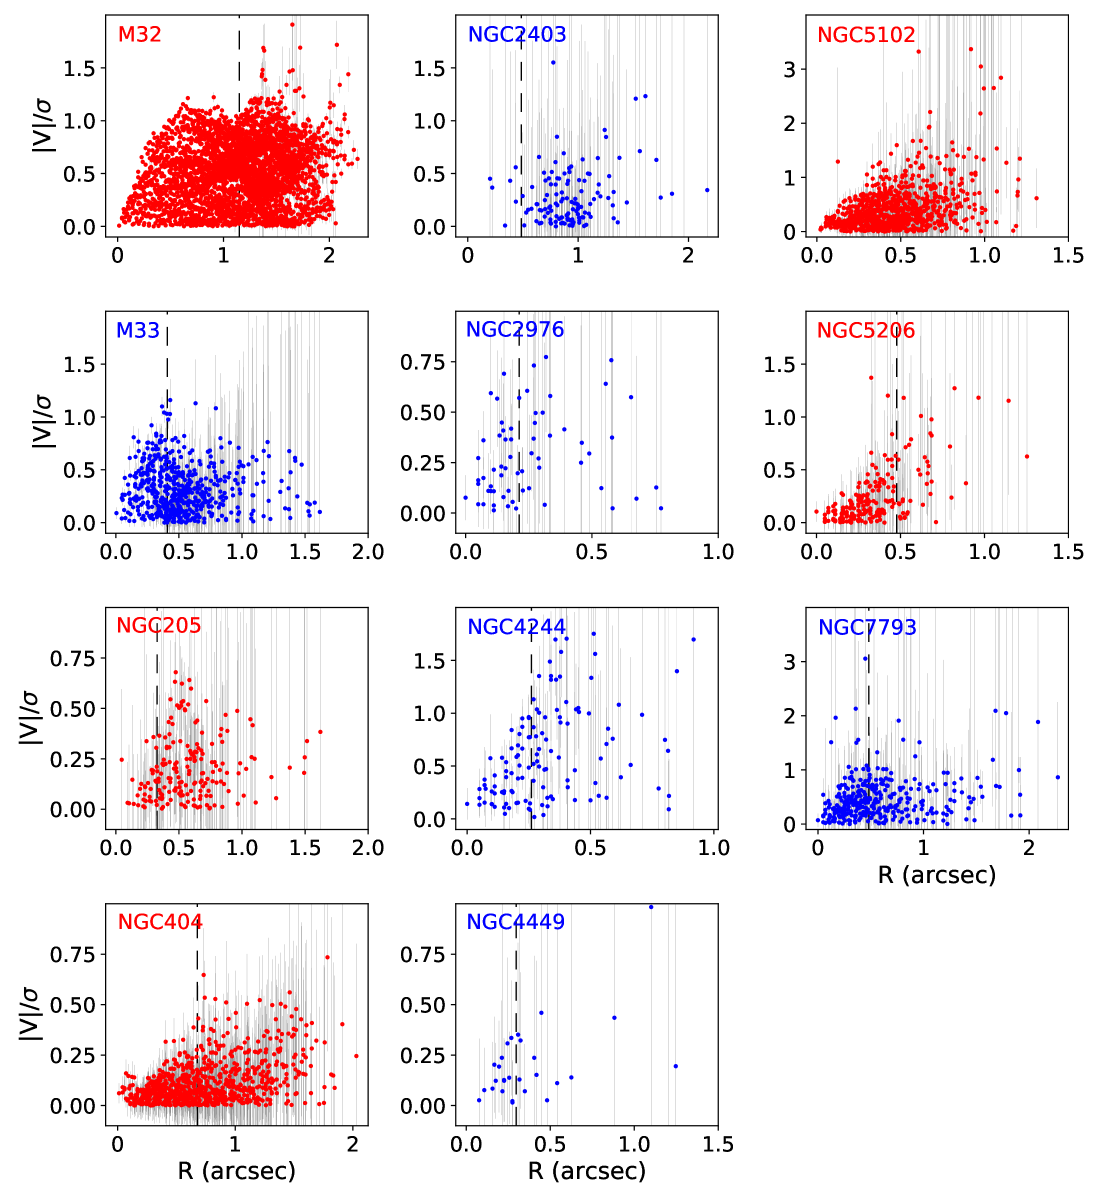
Appendix C Measurements of , and for our sample of eleven nuclei
We provide here our results for , and , calculated as explained in Sect. 4.5, for the eleven nuclei in our sample. These values are plotted in Fig. 3, 4, 6, and 7. Values corrected from the PSF effect were calculated as explained in Appendix D and are shown in Fig. 20 and 21. and for NGC 4244, NGC 5102 and NGC 5206 are upper limits.
| Galaxy name | ||||||||
|---|---|---|---|---|---|---|---|---|
| M 32 | 0.187 | 0.003 | 0.504 | 0.001 | 0.456 | 0.001 | 0.589 | 0.526 |
| M 33 | 0.113 | 0.024 | 0.419 | 0.007 | 0.354 | 0.006 | 0.608 | 0.529 |
| NGC 205 | 0.164 | 0.034 | 0.217 | 0.013 | 0.169 | 0.012 | 0.405 | 0.296 |
| NGC 404 | 0.091 | 0.009 | 0.089 | 0.003 | 0.079 | 0.003 | 0.122 | 0.108 |
| NGC 2403 | 0.042 | 0.018 | 0.294 | 0.041 | 0.254 | 0.020 | 0.420 | 0.362 |
| NGC 2976 | 0.287 | 0.063 | 0.310 | 0.038 | 0.273 | 0.026 | 0.616 | 0.594 |
| NGC 4244 | 0.465 | 0.035 | 0.572 | 0.018 | 0.499 | 0.014 | 0.858 | 0.677 |
| NGC 4449 | 0.318 | 0.034 | 0.203 | 0.081 | 0.165 | 0.033 | 0.357 | 0.275 |
| NGC 5102 | 0.243 | 0.004 | 0.325 | 0.007 | 0.351 | 0.005 | 0.440 | 0.465 |
| NGC 5206 | 0.079 | 0.020 | 0.219 | 0.012 | 0.195 | 0.010 | 0.274 | 0.243 |
| NGC 7793 | 0.157 | 0.015 | 0.392 | 0.012 | 0.367 | 0.010 | 0.528 | 0.494 |
Appendix D PSF measurements and their impact on the observed and
We follow the approach of Harborne et al. (2020) to assess the impact of atmospheric seeing on our observational measurements of the nuclear and . They proposed general analytic corrections, modelled making use of mock observations of numerical simulations, accounting for the PSF-effect on and on galaxies of different Hubble types. From their Eq. 16, 17 and 18, the corrected and are:
| (D1) |
and
| (D2) |
where:
| (D3) |
and
| (D4) |
| Galaxy | component | light fraction | Reference | ||
| name | of the fit | (arcsec) | % | (arcsec) | |
| M 32 | Gaussian | 0.23 | 45 | 0.46 | Seth (2010) |
| Moffat | 0.66(1) | 55 | |||
| M 33 | Gaussian | 0.09 | 65 | 0.31 | this work |
| Gaussian | 0.71 | 35 | |||
| NGC 205 | Gaussian | 0.25 | 68 | 0.40 | Nguyen et al. (2018) |
| Moffat | 0.73(1) | 32 | |||
| NGC 2403 | Gaussian | 0.22 | 86 | 0.38 | this work |
| Gaussian | 1.35 | 14 | |||
| NGC 2976 | Gaussian | 0.13 | 68 | 0.34 | this work |
| Gaussian | 0.78 | 32 | |||
| NGC 404 | Gaussian | 0.12 | 50 | 0.44 | Seth et al. (2010) |
| Moffat | 0.75(1) | 50 | |||
| NGC 4244 | Gaussian | 0.23 | 100 | 0.23 | Seth et al. (2008) |
| NGC 5102 | Gaussian | 0.08 | 35 | 0.56 | Nguyen et al. (2018) |
| Gaussian | 0.82 | 65 | |||
| NGC 5206 | Gaussian | 0.12 | 60 | 0.24 | Nguyen et al. (2018) |
| Gaussian | 0.42 | 40 | |||
| NGC 7793 | Gaussian | 0.17 | 67 | 0.30 | this work |
| Gaussian | 0.57 | 33 |
These corrections are functions of the ratio , between the standard deviation of the PSF distribution , and the major axis of the NSC half-light ellipse . In addition, the impact of the PSF depends on the concentration of the light, indicated by the Sérsic index .
We show in Table 3 the details of the available PSF measurements, mentioned in Sect. 3, for our observations. For galaxies in Table 3, we used the light-weighted average FWHM of the different PSF-fitting components (). For NGC 4449, since it was not possible to derive a PSF for our data cubes from optical images (due to the complexity of its central region), we used the average PSF size measured for our observations with the same instrument and mode (NIFS with LGS AO, see Sect. 3.1). This corresponds to arcsec. As for , we used the values in Table 1. When two values of are given in the table, because the NSC was fitted with a double Sérsic profile, we adopted the highest index to obtain the largest correction and being more conservative. Therefore we obtained upper limits for the corrected values of NGC 4244, NGC 5102 and NGC 5206. Since for NGC 4449 we did not find any available value for , we approximate it to the mean Sérsic index of the rest of the sample ().
The obtained values of and are indicated in Table 2 (Appendix C). They are shown in the and diagrams plotted in Fig. 20 and 21. Nuclei hosted by early and late-type galaxies are indicated respectively with red circles and blue hexagons. Upper limits are indicated with downwards triangles. In the figure, the corrected points are compared to the uncorrected ones from Fig. 3 and 4 (shaded symbols). It is shown how they move upwards when the effect of the PSF is taken into account. However, each one of them does it in a different amount. While the PSF impact is relatively small for the nuclei in NGC 404 and NGC 5206, it is not so small for NGC 205. Its PSF correction, the largest among the early-type galaxies in our sample and mainly due to the small size of the NSC, drives the red circle to values not so different from NGC 2403 and NGC 5102. Except for NGC 205, PSF corrections are in general more significant for late-type galaxies. This is due to their stronger rotation, in some cases combined with a larger concentration of the nucleus in the center. In fact, the PSF impact is more significant for nuclei with higher and and with smaller relative to the PSF size. In particular, the highest determines a strong PSF effect for NGC 2976’s nucleus.

