Dynamical backaction in an ultrahigh-finesse fiber-based microcavity
Abstract
The use of low-dimensional objects in the field of cavity optomechanics is limited by their low scattering cross section compared to the size of the optical cavity mode. Fiber-based Fabry-Pérot microcavities can feature tiny mode cross sections and still maintain a high finesse, boosting the light-matter interaction and thus enabling the sensitive detection of the displacement of minute objects. Here we present such an ultrasensitive microcavity setup with the highest finesse reported so far in loaded fiber cavities, . We are able to position-tune the static optomechanical coupling to a silicon nitride membrane stripe, reaching frequency pull parameters of up to . We also demonstrate radiation pressure backaction in the regime of an ultrahigh finesse up to .
I Introduction
The prospering field of cavity optomechanics [1] studies the coupling between the vibrations of a macroscopic mechanical object and the mode of an electromagnetic cavity. Possible applications range from exploring quantum signatures of macroscopic objects [2, 3], over generating quantum states of light and matter [4, 5, 6], to realizing nonreciprocal devices [7, 8] or acceleration or force sensors [9, 10, 11]. Those applications are enabled by the extreme detection sensitivities of optomechanical systems [12] and often enhanced by minimal thermally induced decoherence at cryogenic temperatures or via reservoir engineering [13, 14].
A convenient way to improve the performance of the optomechanical system is to separate the mechanical and the optical cavity mode in a membrane-in-the-middle type configuration [15], which allows to simultaneously optimize both the mechanical resonator and the optical cavity. Typically, the mechanical resonators under investigation are macroscopic objects such as membranes with almost millimeter-scale lateral dimensions [16, 17, 18, 19, 20]. However, studying mechanical objects with dimensions in the lower-nanometer regime can be an interesting alternative. As a result of their outstandingly low masses these systems are extremely sensitive to environmental changes. At the same time they exhibit large zero-point fluctuations , enabling large single-photon coupling strengths . Optical cavities with small mode volumes [21] are perfect candidates to detect the vibrations of such mesoscopic objects. Reducing the mode volume increases the light-matter coupling [22]. This boosts the frequency pull parameter , which translates the displacement of the mechanical resonator to a frequency shift of the cavity. Although the frequency pull parameter is set by the geometry and the optical properties of the system, the cavity finesse boosts the circulating photon number and therefore the effective coupling . A large finesse also contributes to maintain small cavity linewidths despite the large free spectral range of small mode volume cavities. This is necessary to enhance the single photon cooperativity , a key parameter for optomechanical experiments [1]. In addition, the finesse increases the magnitude of phase fluctuations in the output field and, thus, improves the sensitivity of the measurement.
The required cavity specifications can be fulfilled with fiber-based Fabry-Pérot microcavities (FFPCs), which have been pioneered in the cavity quantum electrodynamics community [21, 23, 24] but have successfully been adapted to optomechanical [25] and ion-trapping systems [26]. Although FFPC-based optomechanical systems are nowadays being studied by several groups [27, 28, 29], their operation is to date enabled by measures to suppress their extreme sensitivity towards frequency fluctuations. This is conveniently accomplished by constraining the finesse to not exceed values of a few and/or by operating at cryogenic temperatures where the Brownian thermal noise of the FFPC mirrors is suppressed.
In this paper, we introduce a platform for cavity optomechanics that is optimized for ultrasensitive optical detection of single-digit nanometer-size mechanical objects. This is achieved with a FFPC that features a small mode cross section while maintaining the highest finesse reported so far in loaded FFPCs, exceeding that of the ground-breaking work in Ref. [25] by almost one order of magnitude. The stable operation of the cavity is enabled by a very rigid cavity gluing scheme combined with a thorough acoustic shielding. This unlocks the previously unaccessible realm of precision sensing at room temperature using ultrahigh-finesse FFPC systems.
In the following, we present a proof-of-principle demonstration of the FFPC platform, demonstrating radiation pressure backaction using a free-standing stoichiometric silicon nitride (Si3N4) membrane stripe which is inserted into the cavity. We note, however, that the choice of the mechanical resonator in this resonator-in-the-middle scheme is flexible, and conveniently allows for the investigation of, for example, tethered membranes [20, 30], nanowires [29] or low-dimensional materials such as carbon nanotubes (CNTs) [31, 27, 32, 33] or two-dimensional crystals [34]. In particular, CNTs are discussed as one possible path towards quantum optomechanics at room temperature [32].
II Methods
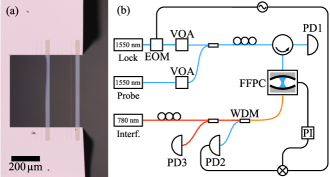
The measurements presented in this work are performed on a stoichiometric high-stress Si3N4 membrane (Norcada) etched in wide stripes of dimensions . The sample frame is mechanically cleaved to obtain a U shape which allows the membrane stripes to be inserted into the fiber cavity. Figure 1(a) shows a micrograph of the sample. The mechanical mode of interest is the second harmonic flexural eigenmode () with a mechanical resonance frequency, linewidth and mechanical quality factor in vacuum () of , , and , respectively. We calculate the effective mass of the sample from its geometry, yielding zero point fluctuations of . The sample is mounted on a five-axis nanopositioner tower (Attocube ANP101 series) placed close to the FFPC inside a vacuum chamber that enables optical access. To eliminate any source of vibrations the vacuum is maintained at with an ion pump and the whole chamber is placed inside an acoustically shielded box.
Figure 1(b) shows a schematic of the optical setup. A low-noise laser (NKT Koheras Basik X15) with a wavelength of is used as the lock laser for the stabilization of the cavity length. The lock tone is phase-modulated with an electro-optic modulator (EOM) at a frequency of . The cavity transmission (PD2) is demodulated in a Poud-Drever-Hall [35] inspired scheme using a fast lock-in amplifier (Zurich Instruments HF2LI). The error signal is fed to an analog PI controller. The resulting control signal passes a home-built high-voltage amplifier and is sent to shear piezos supporting the fiber mirrors to stabilize the cavity length. We choose the detuning of the lock tone from the cavity resonance , in a way to minimize backaction on the mechanical element. We use a probe tone (NKT Koheras Basik E15) near to measure dynamical backaction by sweeping the probe wavelength across the cavity resonance. A home-build external cavity diode laser [36] stabilized on a rubidium cell is used for interferometric readout of the sample position.
III Fiber-Based microcavity
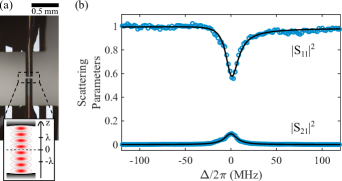
The microcavity consists of two mirrors concavely shaped on fiber end faces by CO2 laser ablation, with resulting curvatures of and for the single-mode (SM) input and multi-mode (MM) output fiber, respectively, which yield a near-planar cavity configuration [37]. The mirror spacing is . The processed fibers are then ion-beam sputter coated by Laseroptik GmbH with a highly reflective distributed Bragg reflector centered around with a designed transmission of 10 . To form the cavity, the fibers are rigidly glued to silicon v-groove chips on top of shear piezo elements. During the gluing process all degrees of freedom are aligned and fixed, resulting in a very stable cavity. By applying a voltage to the shear piezos the cavity length can be tuned by roughly half a wavelength. Figure 2(a) shows a photograph of the final cavity with the input SM fiber on the top of the picture.
We use the laser to measure the relative sample position. This wavelength is outside the coating band of the cavity, allowing a low-finesse interferometric readout of the membrane position. The interferometric tone is launched from the back side of the cavity through the MM fiber. The two wavelengths are split in a wave-division multiplexer (WDM) and the reflection is measured at PD3 (see Fig. 1(b)).
We characterize the reflection and transmission response of the cavity by fixing the lock laser frequency and scanning the cavity length across a TEM00 resonance. Phase-modulated sidebands enable the voltage sent to the cavity piezos to be converted into frequency units. Careful calibration of the gains and losses in the system allows the normalized scattering parameters and to be extracted from the input power and the power in reflection and transmission in front of the cavity (Fig. 2(b)). We fit the normalized transmission and reflection to extract the total cavity losses and the input couplings and of the two mirrors. Due to the imperfect alignment of the mirror surface with respect to the fiber core, light reflected from the cavity is filtered spatially, resulting in an asymmetrical reflection lineshape. This effect is specific to FFPCs and effectively lowers the off-resonant reflection [24]. We take the asymmetry into account by adding an heuristic phase factor to , but a detailed description of this phenomenon can be found in Ref. [24]. The final fit formulas read as follows:
| (1) | ||||
Note that we integrate losses due to imperfect mode matching (especially significant for fiber-based cavities with off-centered mirrors) into the input coupling to comply with the established notation for open cavities. Figure 2(b) displays the measurements of and along with their fits. The obtained loss rates are , , and .
We measure a cavity length (mirror spacing) of by sweeping the probe tone across multiple free spectral ranges. From the cavity length we obtain a free spectral range of . The mode profile can be calculated from the mirror properties. The resulting mode volume is as small as with a mode waist of . The finesse of the empty cavity is , which is almost an oder of magnitude higher than that of Ref. [25].
IV Optomechanical Coupling and Dynamical Backaction
To map out the dispersive coupling experimentally, that is, the frequency pull parameter , we scan both piezos symmetrically to change the cavity length while the membrane is moved along the cavity axis [15] ( direction, cf. Fig. 2(a)) and record the cavity transmission and reflection at each position. For this measurement we only use the lock laser at fixed wavelength of . The reflection of the interferometer tone allows us to calibrate the sample position with respect to a certain node of the cavity field. To align the membrane to the cavity mode axis, we maximize the TEM00 transmission and we minimize scattering into higher-order modes. The map of the cavity detuning for different sample positions in Fig. 3(a) reveals a clear sinusoidal periodicity in the intracavity field as expected for a Fabry-Pérot cavity when the mirrors are displaced symmetrically [15, 16].
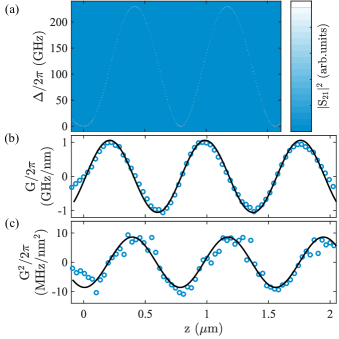
The linear dispersive coupling [1] and the quadratic coupling are extracted from this measurement. The resulting linear coupling (Fig. 3(b)) can be as large as , corresponding to a single-photon coupling rate of . The quadratic coupling is substantial only when the sample is close to the nodes or antinodes of the intracavity field. This is when the quadratic coupling reaches values of up to (Fig. 3(c)). We can numerically reproduce this modulation via the transfer matrix method [38]. The membrane stripe is simulated as a dielectric slab with a refractive index of (see Appendix A), in accordance with the values reported in the literature [39, 40]. The shape and magnitude of both the linear and quadratic coupling agree well with the numerical simulations.
Any absorption in the Si3N4 mechanical resonator at , intrinsic and/or due to residues from fabrication, leads to a modulation of the cavity losses with respect to the sample position [16, 31, 41]. However, this modulation is small due the small value of the imaginary part of the refractive index [42, 40]. With the sample placed at the node of the cavity, we measure linewidths of , corresponding to a loaded finesse of , almost unchanged from the empty cavity. Away from the node, the linewidth stays below , corresponding to . By measuring the linewidth as a function of sample position we can extract the dissipative coupling (see Appendix A) and we obtain a value of the order of . The dissipative coupling is four orders of magnitude smaller than the dispersive coupling.
We demonstrate dynamical backaction in our system by measuring the optical spring effect [43, 44] from the cavity and the second harmonic of the Si3N4 stripe (). For this measurement the sample is placed away from a cavity node, corresponding to or according to the data in Fig. 3. The cavity length is stabilized on the lock tone and the probe tone is scanned across the cavity resonance. For each probe detuning we record the mechanical power spectral density (PSD), yielding the thermally induced vibrations of the membrane stripe. As their Lorentzian shape is obscured by small yet unavoidable frequency fluctuations, a Voigt fit is employed to extract the mechanical resonance frequency and effective linewidth (see Appendix B for details).
A detuned drive of the cavity optomechanical system exerts dynamical backaction on the mechanical resonator leading to a modification of the mechanical resonance frequency expressed as (Ref. [45]). Including a dissipative coupling term, this frequency shift is given by
| (2) |
with the effective dispersive coupling and the effective dissipative coupling , respectively [41].
The mechanical frequency shift depends on the circulating photon number through and , the probe detuning , and . However, the circulating photon number also depends on the probe detuning. In order to be able to fit Equation IV to the measured mechanical frequency shift, we need to know the exact photon number. To this end, for every detuning step, we calculate the photon number from the probe transmission and the launched probe power (Fig. 4(a), black circles). For all presented measurements, we sweep the detuning from positive to negative values. The circulating photon number response appears bistable. First, it increases slightly and at around the photon number forms a plateau with constant low value. As the detuning approaches zero, the system transitions to a solution with high photon number and the photon number decreases gradually for negative detunings. Here, the response appears Lorentzian as expected, with linewidth , corresponding to .
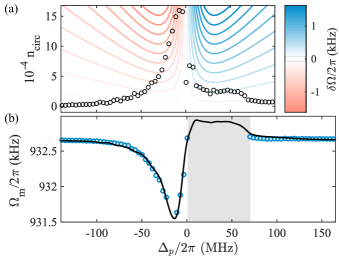
Figure 4(b) shows the measured mechanical frequency as a function of the probe detuning. The missing data points for positive detunings correspond to the regime of self-sustained oscillations of the mechanical oscillator, which we are unable to resolve due to the limited bandwidth of the measurement. The black solid line is a fit to Equation IV with best fit parameters and , where the measured circulating photon number from Fig. 4 was used as input, and the dissipative coupling was considered negligible. The fit nicely describes the softening of the mode for negative detunings. Around the plateau of the photon number, the mechanical mode oscillates close to its natural frequency. The small stiffening of the mode below a detuning of is reproduced by the theory. The asymmetry of the fit between negative and positive detunings stems from the large difference in photon numbers. The single-photon coupling strength extracted from the fit is in good agreement with the value of obtained from the data presented in Fig. 3 at a sample position of for both simulations and measurement. The contour lines in Fig. 4(a) depict the dependence of the mechanical frequency shift on the circulating photon number and probe detuning for the fit values of and as from Equation IV.
The cavity linewidth that we obtain from the fit in Fig. 4(b) is three times larger than the cavity linewidth calculated from the resonant transmission MHz. We assume that this is due to noise in the detuning from cavity length fluctuations. Fluctuations in the cavity length lead to fluctuations of the effective detuning, resulting in a mismatch between the theoretical and experimental values of the mechanical frequency shift. However, if one neglects photothermal effects inside the mirror coatings and radiation pressure effects on the cavity mirrors, these fluctuations are independent of the photon number. In our measurements we effectively average the mechanical response and the mechanical frequency matches on average the theoretical value (Fig. 4(b)). This occurs because the fluctuations are symmetric with respect to the applied effective detuning.
The optical damping arising from dynamical backaction is given by [41]
| (3) |
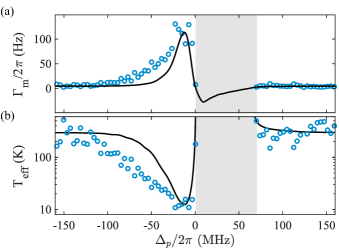
so that the effective mechanical linewidth results in . In the presence of optomechanical backaction, the thermal force driving the mechanical resonator remains constant, but the effective mechanical linewidth is altered. To measure the mode temperature, we extract the effective mechanical damping from the Voigt fit of the measured mechanical spectra and obtain the effective mode temperature from the phonon bath temperature via .
The obtained linewidths are plotted in Fig. 5(a) together with the theoretical curve (black line) with the parameters from the fit of the optical spring measurement (, ) and neglecting the dissipative coupling term. Figure 5(b) displays the effective mode temperature calculated from the measured linewidths. The theory predicts a negative effective mechanical damping, that is, heating of the mechanical mode, for the positive detunings where we measure a plateau of the photon number. In the measurements we observe an effective damping close to zero which corresponds to self-sustained oscillations. This measurement is limited by the bandwidth of the measurement and the quality of the Voigt profile fits that we use to extract the mechanical linewidth. For negative detunings, we observe optomechanical cooling of the mode from room temperature down to , which is verified by additional measurements where we sweep the probe power (see Appendix C).
V Conclusion
In conclusion, we present an extremely sensitive FFPC setup with a small mode volume and an ultrahigh finesse exceeding . We perform a full characterization of the setup and we demonstrate dynamical backaction on the second harmonic flexural mode of a stoichiometric Si3N4 membrane stripe. All measurements are supported by theoretical models, allowing the parameters of the system to be quantitatively extracted. The finesse of the loaded cavity of up to is exceptionally high for a loaded FFPC system, exceeding that from Ref. [25] by more than one order of magnitude. We report an optomechanical coupling strength of while values up to are accessible at a different position of the membrane stripe in the cavity mode. Furthermore, we show self-sustained oscillations of the mechanical mode and optomechanical cooling from room temperature down to an effective mode temperature of .
Following the proposal in Ref. [31], the use of single-walled CNTs [27] in this FFPC is very promising. A dispersive coupling strength around is expected, which would place the system deep inside the strong coupling regime.In addition, the outstanding sensitivity of CNTs [46] enables ultrasensitive cavity optomechanics at room temperature. Owing to the versatility of the presented setup other interesting nanoscale mechanical structures such as nanowires, nanorods, or two-dimensional materials such as h-BN can be studied. By additionally exploiting optical dipole transitions in the said materials, the realization of hybrid optomechanical systems seems to be in reach.
The data supporting the findings of this study are available online [47].
Acknowledgements.
Financial support from the Ministry of Research and the Arts of Baden-Württemberg within the Center for Applied Photonics (CAP) is gratefully acknowledged. I.S.A. acknowledges support from the European Union’s Horizon 2020 research and innovation programme under the Marie Sklodowska-Curie grant agreement No. 722923 (OMT).Appendix A Cavity linewidth and dissipative optomechanical coupling
The extraction of the cavity linewidth during the static optomechanical coupling measurements is a nontrivial task. Scans over the cavity resonance show a broadened response compared with what should be expected from the normalized on-resonant transmission . For positions with a strong dispersive coupling, this broadening originates from the optomechanically induced static bistability [48]. However, even for smaller coupling or small laser powers, fluctuations in the sample position lead to a spectral broadening of the cavity resonance. Those fluctuations arise from acoustical noise and vibrations into the surrounding that couple in the system through the relatively floppy stack of nanopositioners. Vibration damping and acoustic shielding of the setup help to minimize those vibrations in the low-frequency regime (below approximately ). The bandwidth of the feedback loop to stabilize the cavity length is limited by resonances of the fiber mirrors acting as cantilever-type mechanical resonators with eigenfrequencies around (see Fig. 6).
The lifetime of cavity photons of approximately is much shorter than the timescale of the fluctuations of approximately , resulting in a spectral response which follows a convolution of a Lorentzian peak and a Gaussian noise distribution, that is, a Voigt profile (see Appendix B). However, the frequency resolution of the static optomechanical coupling measurements is too small to produce successful Voigt fits due to the large magnitude of the scans. We use instead the linewidth calculated from the normalized on-resonant transmission as a first approximation. Note that the input power measured on the output port of the circulator and the transmitted power measured on detector PD2 are lower and higher bounds to the actual cavity input and transmission, respectively. Thus, the linewidth that we calculate is an upper bound on the actual cavity linewidth.
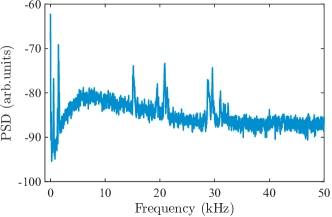
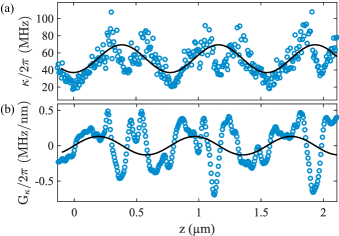
Figure 7(a) depicts the measured cavity linewidths with the sample inserted (blue circles) and simulations (black solid line) as a function of the membrane’s position. To reproduce the measurement we need an imaginary part of the refractive index of , which agrees to what has been reported in the literature for stoichiometric Si3N4 (Ref. [39, 40]). This validates our approximation to extract the cavity linewidth from the normalized on-resonant transmission.
The dissipative coupling can be calculated from the linewidths obtained both from the measurements and from the numerical simulations (see Fig. 7(b)). The exact shape of the measured coupling is hard to extract and depends strongly on how smoothly the derivative is calculated. Nevertheless, both the measurement and simulations show a dissipative coupling of the order of . Thus, for the measurements presented in this letter, the dissipative coupling is four orders of magnitude smaller than dispersive coupling.
Appendix B Mechanical Response
As soon as we lock the cavity, any cavity length fluctuations will alter the detuning and consequently the optical spring effect, which is translated into mechanical frequency noise. As this noise is of Gaussian origin, the resulting mechanical spectra follows a Voigt distribution - a convolution of a Lorentzian peak with a Gaussian noise distribution - very common in spectroscopy where lines appear Doppler broadened [49]. The Voigt profile is given by
Here denotes the Gaussian distribution with standard deviation and is the textbook Cauchy-Lorentz distribution with the half-width at half maximum . Voigt profiles can also be used to fit peaks that are too narrow to be resolved by the finite bandwidth of the measurement devices [50].
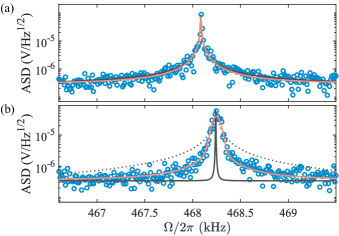
Figure 8 (a) displays the Brownian motion resonance of the fundamental harmonic flexural mode (, , , ) under dynamical backaction. We can fit the measurement both with a Lorentzian function (black line) and with a Voigt profile (orange line). Both fits yield low mechanical dampings of and , respectively. The Voigt profile yields a Gaussian broadening of , probably limited by the resolution bandwidth of the spectrum analyzer. In Fig. 8 (b) we lock the cavity with the lock tone blue detuned. As expected, the optical spring effect shifts the mechanical resonance to slightly higher frequencies. The expected narrowing of the effective mechanical linewidth is obscured by broadening of the resonance (Fig. 8 (b)). A Lorentzian fit of the central part of the peak (black dotted line) largely overestimates the tails, while a Lorentzian fit of the tails (black solid line) clearly deviates from the resonance shape. A Voigt profile (orange line) nicely reproduces the data and yields values and . The extracted effective mechanical damping is reduced from the natural damping as expected.
Appendix C Power sweep
We perform a power sweep for a fixed probe detuning to confirm our observations of optomechanical cooling. According to Eqs. IV and IV we expect both the mechanical resonance frequency and the effective mechanical linewidth to increase linearly with the number of cavity photons. In contrast to the measurements in the main text, we consider the fundamental harmonic flexural mode in the following (, , , ). As a result of its lower mechanical quality factor this mode is less prone to start self-oscillating. We place the sample at a position of around (below a node of the cavity field) resulting in a cavity linewidth of and stabilize the cavity in a way that the lock tone is blue detuned.
We fix a probe detuning of and we scan the probe power from to . That corresponds to a number of circulating photons due to the probe tone of up to . The photon number due to the lock tone is constant during the measurement, . We select a large lock detuning to minimize backaction from the lock tone. At the same time, a large lock photon number ensures a strong feedback signal that boosts the lock quality.
We record the mechanical spectra of both the interferometer and the X quadrature extracted from the heterodyne signal in transmission. The mechanical PSDs are fitted with Voigt profiles to obtain the mechanical resonances and the effective mechanical dampings.
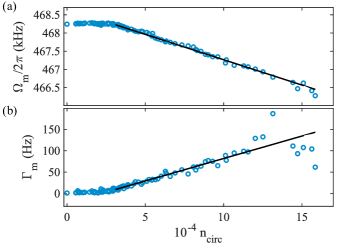
Figure 9(a) displays the mechanical frequency as a function of probe photon number. From around the mechanical resonance decreases linearly with the probe photon number. The slope of a linear regression (black line) in this range yields a dispersive single-photon coupling of . If we consider the effective mechanical damping in Fig. 9(b) we observe the expected linear increase of with the photon number in the range between and . Again, we extract the single-photon coupling from a linear regression and we obtain . Those values appear reasonable compared with the single-photon couplings from the main text.
The mode self-oscillates for photon numbers below , where the mechanical resonance frequency remains constant and the observed effective damping is close to zero. The linear regression allows to estimate the optical damping induced by the lock tone to be of the order of .
References
- Aspelmeyer et al. [2014a] M. Aspelmeyer, T. J. Kippenberg, and F. Marquardt, Cavity optomechanics, Rev. Mod. Phys. 86, 1391 (2014a).
- Chan et al. [2011] J. Chan, T. P. M. Alegre, A. H. Safavi-Naeini, J. T. Hill, A. Krause, S. Gröblacher, M. Aspelmeyer, and O. Painter, Laser cooling of a nanomechanical oscillator into its quantum ground state, Nature 478, 89 (2011).
- Teufel et al. [2011] J. D. Teufel, T. Donner, D. Li, J. W. Harlow, M. S. Allman, K. Cicak, A. J. Sirois, J. D. Whittaker, K. W. Lehnert, and R. W. Simmonds, Sideband cooling of micromechanical motion to the quantum ground state, Nature 475, 359 (2011).
- Palomaki et al. [2013] T. A. Palomaki, J. D. Teufel, R. W. Simmonds, and K. W. Lehnert, Entangling mechanical motion with microwave fields, Science 342, 710 (2013).
- Lecocq et al. [2015] F. Lecocq, J. B. Clark, R. W. Simmonds, J. Aumentado, and J. D. Teufel, Quantum nondemolition measurement of a nonclassical state of a massive object, Phys. Rev. X 5, 041037 (2015).
- Riedinger et al. [2016] R. Riedinger, S. Hong, R. A., J. A. Slater, J. Shang, A. G. Krause, V. Anant, M. Aspelmeyer, and S. Gröblacher, Non-classical correlations between single photons and phonons from a mechanical oscillator, Nature 530, 313 (2016).
- Peterson et al. [2017] G. A. Peterson, F. Lecocq, K. Cicak, R. W. Simmonds, J. Aumentado, and J. D. Teufel, Demonstration of efficient nonreciprocity in a microwave optomechanical circuit, Phys. Rev. X 7, 031001 (2017).
- Bernier et al. [2017] N. R. Bernier, L. D. Tóth, A. Koottandavida, M. A. Ioannou, D. Malz, A. Nunnenkamp, A. K. Feofanov, and T. J. Kippenberg, Nonreciprocal reconfigurable microwave optomechanical circuit, Nat. Commun. 8, 604 (2017).
- Hutchison and Bhave [2012] D. N. Hutchison and S. A. Bhave, Z-axis optomechanical accelerometer, in 2012 IEEE 25th International Conference on Micro Electro Mechanical Systems (MEMS) (IEEE, 2012).
- Miao et al. [2012] H. Miao, K. Srinivasan, and V. Aksyuk, A microelectromechanically controlled cavity optomechanical sensing system, New J. Phys. 14, 075015 (2012).
- Simonsen et al. [2019] A. Simonsen, J. D. Sánchez-Heredia, S. A. Saarinen, J. H. Ardenkjær-Larsen, A. Schliesser, and E. S. Polzik, Magnetic resonance imaging with optical preamplification and detection, Sci. Rep. 9, 18173 (2019).
- Mason et al. [2019] D. Mason, J. Chen, M. Rossi, Y. Tsaturyan, and A. Schliesser, Continuous force and displacement measurement below the standard quantum limit, Nat. Phys. 15, 745 (2019).
- Purdy et al. [2017] T. P. Purdy, K. E. Grutter, K. Srinivasan, and J. M. Taylor, Quantum correlations from a room-temperature optomechanical cavity, Science 356, 1265 (2017).
- Tebbenjohanns et al. [2019] F. Tebbenjohanns, M. Frimmer, A. Militaru, V. Jain, and L. Novotny, Cold damping of an optically levitated nanoparticle to microkelvin temperatures, Phys. Rev. Lett. 122, 223601 (2019).
- Thompson et al. [2008] J. D. Thompson, B. M. Zwickl, A. M. Jayich, F. Marquardt, S. M. Girvin, and J. G. E. Harris, Strong dispersive coupling of a high-finesse cavity to a micromechanical membrane, Nature 452, 72 (2008).
- Jayich et al. [2008] A. M. Jayich, J. C. Sankey, B. M. Zwickl, C. Yang, J. D. Thompson, S. M. Girvin, A. A. Clerk, F. Marquardt, and J. G. E. Harris, Dispersive optomechanics: a membrane inside a cavity, New J. Phys. 10, 095008 (2008).
- Wilson et al. [2009] D. J. Wilson, C. A. Regal, S. B. Papp, and H. J. Kimble, Cavity optomechanics with stoichiometric SiN films, Phys. Rev. Lett. 103, 207204 (2009).
- Karuza et al. [2013] M. Karuza, C. Biancofiore, M. Bawaj, C. Molinelli, M. Galassi, R. Natali, P. Tombesi, G. D. Giuseppe, and D. Vitali, Optomechanically induced transparency in a membrane-in-the-middle setup at room temperature, Phys. Rev. A 88, 013804 (2013).
- Purdy et al. [2013] T. P. Purdy, R. W. Peterson, and C. A. Regal, Observation of radiation pressure shot noise on a macroscopic object, Science 339, 801 (2013).
- Reinhardt et al. [2016] C. Reinhardt, T. Müller, A. Bourassa, and J. C. Sankey, Ultralow-noise SiN trampoline resonators for sensing and optomechanics, Phys. Rev. X 6, 021001 (2016).
- Hunger et al. [2010] D. Hunger, T. Steinmetz, Y. Colombe, C. Deutsch, T. W. Hänsch, and J. Reichel, A fiber fabry–perot cavity with high finesse, New J. Phys. 12, 065038 (2010).
- Waldron [1960] R. Waldron, Perturbation theory of resonant cavities, Proc. IEE Part C: Monographs 107, 272 (1960).
- Muller et al. [2010] A. Muller, E. B. Flagg, J. R. Lawall, and G. S. Solomon, Ultrahigh-finesse, low-mode-volume fabry–perot microcavity, Opt. Lett. 35, 2293 (2010).
- Gallego et al. [2016] J. Gallego, S. Ghosh, S. K. Alavi, W. Alt, M. Martinez-Dorantes, D. Meschede, and L. Ratschbacher, High-finesse fiber fabry–perot cavities: stabilization and mode matching analysis, Appl. Phys. B 122, 47 (2016).
- Flowers-Jacobs et al. [2012] N. E. Flowers-Jacobs, S. W. Hoch, J. C. Sankey, A. Kashkanova, A. M. Jayich, C. Deutsch, J. Reichel, and J. G. E. Harris, Fiber-cavity-based optomechanical device, Appl. Phys. Lett. 101, 221109 (2012).
- Brandstätter et al. [2013] B. Brandstätter, A. McClung, K. Schüppert, B. Casabone, K. Friebe, A. Stute, P. O. Schmidt, C. Deutsch, J. Reichel, R. Blatt, and T. E. Northup, Integrated fiber-mirror ion trap for strong ion-cavity coupling, Rev. Sci. Instrum. 84, 123104 (2013).
- Stapfner et al. [2013] S. Stapfner, L. Ost, D. Hunger, J. Reichel, I. Favero, and E. M. Weig, Cavity-enhanced optical detection of carbon nanotube brownian motion, Appl. Phys. Lett. 102, 151910 (2013).
- Kashkanova et al. [2016] A. D. Kashkanova, A. B. Shkarin, C. D. Brown, N. E. Flowers-Jacobs, L. Childress, S. W. Hoch, L. Hohmann, K. Ott, J. Reichel, and J. G. E. Harris, Superfluid brillouin optomechanics, Nat. Phys. 13, 74 (2016).
- Fogliano et al. [2021] F. Fogliano, B. Besga, A. Reigue, P. Heringlake, L. Mercier de Lépinay, C. Vaneph, J. Reichel, B. Pigeau, and O. Arcizet, Mapping the cavity optomechanical interaction with subwavelength-sized ultrasensitive nanomechanical force sensors, Phys. Rev. X 11, 021009 (2021).
- Norte et al. [2016] R. A. Norte, J. P. Moura, and S. Gröblacher, Mechanical resonators for quantum optomechanics experiments at room temperature, Phys. Rev. Lett. 116, 147202 (2016).
- Favero and Karrai [2008] I. Favero and K. Karrai, Cavity cooling of a nanomechanical resonator by light scattering, New J. Phys. 10, 095006 (2008).
- Tavernarakis et al. [2018] A. Tavernarakis, A. Stavrinadis, A. Nowak, I. Tsioutsios, A. Bachtold, and P. Verlot, Optomechanics with a hybrid carbon nanotube resonator, Nat. Commun. 9, 662 (2018).
- Barnard et al. [2019] A. W. Barnard, M. Zhang, G. S. Wiederhecker, M. Lipson, and P. L. McEuen, Real-time vibrations of a carbon nanotube, Nature 566, 89 (2019).
- Singh et al. [2014] V. Singh, S. J. Bosman, B. H. Schneider, Y. M. Blanter, A. Castellanos-Gomez, and G. A. Steele, Optomechanical coupling between a multilayer graphene mechanical resonator and a superconducting microwave cavity, Nat. Nanotechnol. 9, 820 (2014).
- Drever et al. [1983] R. W. P. Drever, J. L. Hall, F. V. Kowalski, J. Hough, G. M. Ford, A. J. Munley, and H. Ward, Laser phase and frequency stabilization using an optical resonator, Appl. Phys. B 31, 97 (1983).
- Ricci et al. [1995] L. Ricci, M. Weidemüller, T. Esslinger, A. Hemmerich, C. Zimmermann, V. Vuletic, W. König, and T. Hänsch, A compact grating-stabilized diode laser system for atomic physics, Opt. Commun. 117, 541 (1995).
- Siegman [1986] A. E. Siegman, Lasers (University Science Books, Mill Valley, Calif, 1986).
- Katsidis and Siapkas [2002] C. C. Katsidis and D. I. Siapkas, General transfer-matrix method for optical multilayer systems with coherent, partially coherent, and incoherent interference, Appl. Opt. 41, 3978 (2002).
- Kim et al. [2006] D. S. Kim, S. G. Yoon, G. E. Jang, S. J. Suh, H. Kim, and D. H. Yoon, Refractive index properties of SiN thin films and fabrication of SiN optical waveguide, J. Electroceram. 17, 315 (2006).
- Karuza et al. [2012] M. Karuza, C. Molinelli, M. Galassi, C. Biancofiore, R. Natali, P. Tombesi, G. D. Giuseppe, and D. Vitali, Optomechanical sideband cooling of a thin membrane within a cavity, New J. Phys. 14, 095015 (2012).
- Biancofiore et al. [2011] C. Biancofiore, M. Karuza, M. Galassi, R. Natali, P. Tombesi, G. D. Giuseppe, and D. Vitali, Quantum dynamics of an optical cavity coupled to a thin semitransparent membrane: Effect of membrane absorption, Phys. Rev. A 84, 033814 (2011).
- Zwickl et al. [2008] B. M. Zwickl, W. E. Shanks, A. M. Jayich, C. Yang, A. C. Bleszynski Jayich, J. D. Thompson, and J. G. E. Harris, High quality mechanical and optical properties of commercial silicon nitride membranes, Appl. Phys. Lett. 92, 103125 (2008).
- Marquardt et al. [2007] F. Marquardt, J. P. Chen, A. A. Clerk, and S. M. Girvin, Quantum theory of cavity-assisted sideband cooling of mechanical motion, Phys. Rev. Lett. 99, 093902 (2007).
- Wilson-Rae et al. [2007] I. Wilson-Rae, N. Nooshi, W. Zwerger, and T. J. Kippenberg, Theory of ground state cooling of a mechanical oscillator using dynamical backaction, Phys. Rev. Lett. 99, 093901 (2007).
- Aspelmeyer et al. [2014b] M. Aspelmeyer, T. J. Kippenberg, and F. Marquard, Cavity Optomechanics - Nano- and Micromechanical Resonators Interacting with Light (Springer Berlin Heidelberg, 2014).
- Moser et al. [2013] J. Moser, J. Güttinger, A. Eichler, M. J. Esplandiu, D. E. Liu, M. I. Dykman, and A. Bachtold, Ultrasensitive force detection with a nanotube mechanical resonator, Nat. Nanotechnol. 8, 493 (2013).
- roc [2021] The data within this paper are available on zenodo.org, doi: 10.5281/zenodo.5005974 (2021).
- Dorsel et al. [1983] A. Dorsel, J. D. McCullen, P. Meystre, E. Vignes, and H. Walther, Optical bistability and mirror confinement induced by radiation pressure, Phys. Rev. Lett. 51, 1550 (1983).
- Olivero and Longbothum [1977] J. Olivero and R. Longbothum, Empirical fits to the voigt line width: A brief review, J. Quant. Spectrosc. Radiat. Transf. 17, 233 (1977).
- Chen et al. [2015] M. Chen, Z. Meng, J. Wang, and W. Chen, Ultra-narrow linewidth measurement based on voigt profile fitting, Opt. Express 23, 6803 (2015).