A Multi-Channel Ratio-of-Ratios Method for Noncontact Hand Video Based SpO2 Monitoring Using Smartphone Cameras
Abstract
Blood oxygen saturation (SpO2) is an important indicator for pulmonary and respiratory functionalities. Clinical findings on COVID-19 show that many patients had dangerously low blood oxygen levels not long before conditions worsened. It is therefore recommended, especially for the vulnerable population, to regularly monitor the blood oxygen level for precaution. Recent works have investigated how ubiquitous smartphone cameras can be used to infer SpO2. Most of these works are contact-based, requiring users to cover a phone’s camera and its nearby light source with a finger to capture reemitted light from the illuminated tissue. Contact-based methods may lead to skin irritation and sanitary concerns, especially during a pandemic. In this paper, we propose a noncontact method for SpO2 monitoring using hand videos acquired by smartphones. Considering the optical broadband nature of the red (R), green (G), and blue (B) color channels of the smartphone cameras, we exploit all three channels of RGB sensing to distill the SpO2 information beyond the traditional ratio-of-ratios (RoR) method that uses only two wavelengths. To further facilitate an accurate SpO2 prediction, we design adaptive narrow bandpass filters based on accurately estimated heart rate to obtain the most cardiac-related AC component for each color channel. Experimental results show that our proposed blood oxygen estimation method can reach a mean absolute error of 1.26% when a pulse oximeter is used as a reference, outperforming the traditional RoR method by 25%.
Index Terms:
Blood oxygen saturation, contact-free, smartphone, hand videos, ratio-of-ratios model.I Introduction
Peripheral blood oxygen saturation (SpO2) shows the ratio of oxygenated hemoglobin to total hemoglobin in the blood, which serves as a vital health signal for the operational functions of organs and tissues [1]. It has become increasingly important in the COVID-19 pandemic, where many patients have experienced “silent hypoxia,” a low level of SpO2 even before obvious breathing difficulty is observed [2, 3, 4]. The vulnerable population with a high possibility of infection is recommended to monitor their oxygen status continuously for early COVID-19 detection [2, 5].
Pulse oximeters have been widely used for SpO2 measurement at home and in hospitals in the form of a finger-clip or earlobe-clip [6, 7], which adopts the ratio-of-ratios (RoR) principle. The RoR principle is based on the different optical absorption rates of the oxygenated hemoglobin (HbO2) and deoxygenated hemoglobin (Hb) at nm (red) and nm (infrared) wavelengths. By illuminating red and infrared lights on the peripheral microvascular bed of tissue such as the fingertip, the intensity of the transmitted light on the receiver end of the pulse oximeter contains pulsatile information to derive the level of blood oxygen saturation. The gold standard for measuring the blood oxygen saturation is blood gas analysis, which is invasive and painful and requires well-trained healthcare providers to perform the test. In contrast, the pulse oximeter is noninvasive and provides readings in nearly real time, and is therefore more tolerated and convenient for daily use. The pulse oximeter is known to have a deviation of from the gold standard when the blood oxygen saturation is in the range of to [8], which is well-known and accepted in the clinical use.
With the ubiquity of smartphones and the growing market of smart fitness devices, the RoR principle has been applied to new nonclinical settings for SpO2 measurement. Apple Watch Series 6 has blood oxygen measurement functionality, and it requires skin contact with the watch neither too tight nor too loose for the best results [9]. The recent scientific literature also explored methods for SpO2 estimation using a smartphone. These methods require a user to use his/her fingertip to cover an optical sensor (a built-in camera or a dedicated sensor) and a nearby light source (a built-in flashlight or purposely designated lights) to capture the reemitted light from the illuminated tissue [10, 11, 12, 13, 14]. The aforementioned SpO2 estimation methods based on smartphone and smartwatch are contact-based. It is sensitive to motion, and may irritate sensitive skin or cause a sense of burning from the heat built up if the fingertip is in contact with the flashlight on for an extended period of time.
Researchers have recently investigated measuring the saturation of blood oxygen by means of contactless techniques [15, 16, 17, 18]. These methods typically acquire a user’s face video under ambient light with CCD cameras to estimate SpO2 from pulsatile information of monochromatic wavelengths. Shao et al. [19] also use a facial video-based method to monitor SpO2 that is implemented using a CMOS camera with a light source alternating at two different wavelengths. Tsai et al. [20] acquire hand images with CCD cameras under two monochromatic lights to analyze SpO2 from the reflective intensity of the shallow skin tissue. These contactless methods can provide alternatives of contact-based SpO2 measurements for individuals with finger injuries or nail polish [21, 22], for whom the traditional pulse oximeters may be inaccurate. However, the setups used in the abovementioned studies are expensive and not common for daily use.
More economical camera devices, low-cost webcams [23, 24, 25, 26] and smartphones [27] have also been applied for contactless SpO2 estimation. Unlike pulse oximeters, all three color channels in these economical RGB cameras capture a wide range of wavelengths from the ambient light. Most works using RGB cameras [23, 24, 25, 26, 27] directly apply the conventional narrowband red–infrared RoR principle to the red and blue (or green) channels of RGB videos without addressing the broadband nature of the color channels.
In this paper, we propose a multi-channel RoR method for noncontact SpO2 monitoring using hand videos captured by smartphone cameras under ambient light. The contributions of our work include:
-
•
We exploit all three RGB channels to extract features for SpO2 prediction, instead of limiting to two wavelengths/color channels as in traditional RoR methods. Efficiently utilizing three channels is nontrivial and is one of the key research issues we shall address in this paper. We will take into consideration the underlying optophysiological model given the smartphone camera as the remote sensor and the ambient light environment. Our proposed multi-channel RoR based method can achieve a mean absolute error of in SpO2 estimation with the pulse oximeter as the reference, which is lower than that of the traditional RoR model.
-
•
We filter the RGB signals with a narrow adaptive bandpass (ABP) filter centered at an accurately estimated heart rate (HR) to obtain the most relevant cardiovascular-related AC component from each color channel for feature extraction. We systematically analyze and verify the important roles of both the narrow ABP filter and the accurate HR tracking for accurate SpO2 monitoring.
-
•
We investigate the more favorable scenario for data collection by using hand as the signal source for the period that face-covering mandate is on. It has a few practical advantages compared to facial videos, including being applicable with masks on, less privacy concern, and potentially being more tolerant to different skin tones than the face. We analyze the impact of the sides of the hand and skin tones on the SpO2 estimation performance. Given our collected dataset, we find that using the palm side for video capturing has a good SpO2 estimation performance regardless of the skin tones. We also do not observe significant performance differences between skin-tone subgroups if they use the palm side for video capturing.
II Background and Related Work
In this section, we review the ratio-of-ratios (RoR) model for SpO2 measurement. Consider a light source with spectral distribution illuminating the skin, and a remote color camera with spectral responsivity recording a video. The light from the source travels through the tissue and part of the light in the tissue is reemitted to be received by the color camera. During each cardiac cycle, the heart muscle contracts and relaxes, so that the blood is bumped to the body and travels back to the heart. During this process, the blood volume increases and decreases in the arterial vessels, causing increased and decreased light absorption [28]. According to the skin-reflection model [29, 30], the color camera will receive the specularly reflected light from the skin surface and the diffusely reemitted light from the tissue–light interaction that contains the cardiac-related pulsatile information. Based on the verified assumption proposed in [17] that the specular reflection components can be ignored if the movement is minimized, the camera sensor response at time can be expressed as:
| (1) |
where the is the wavelength, the integral range captures the responsive wavelength band of channel of the camera, is the spectral intensity of the light source, is the diffusion coefficient, and is the sensor response of channel of the camera.
According to the Beer-Lambert’s law [16], the diffusion coefficient can be expanded into:
| (2) | ||||
where , , and are the extinction coefficients of arterial deoxyhemoglobin, arterial oxyhemoglobin, and other tissues including the venous blood vessel, respectively; , , and are the concentrations of the corresponding substances; is the path length that the light travels in the tissue and is assumed to be time-invariant; is the path length that the light travels in the arterial blood vessels. Note that is time-varying because the arteries will dilate with increased blood during systole compared to diastole.
The integral range can be simplified to a single value when the camera is monochromatic, incoming light is filtered by a narrowband optical filter, or alternatively, the light source is a narrowband LED. Then the response of the camera sensor in (1) can be written as:
| (3) | ||||
Let denote the difference of the light path of the pulsatile arterial blood between diastole when and systole when . The log-ratio of the response of the th channel of the camera sensor during diastole and systole can then be written as:
| (4a) | ||||
| (4b) | ||||
For two different wavelengths and , the ratio of ratios (RoR) can then be defined as:
| (5) |
Since , the relation between RoR and SpO2 can be written as:
| (6a) | ||||
| (6b) | ||||
where the linear approximation can be obtained by a Taylor expansion.
The linear RoR model in (6b) has been applied under different SpO2 measurement scenarios. For pulse oximeters, nm and nm are used to leverage the optical absorption difference of Hb and HbO2 at the two wavelengths. In some prior art using narrowband light sources or monochromatic camera sensors [15, 19] for contactless SpO2 monitoring, different combinations of have been explored. In the prior art using consumer-grade RGB cameras [23, 24, 25, 26, 27], only two out of the three available RGB channels were used for the linear RoR model.
Among the abovementioned SpO2 estimation methods using consumer-grade RGB cameras, the SpO2 data collected in [23, 24] only cover a small dynamic range (mostly above ), which is not very meaningful. Bal et al. [25] and Tarassenko et al. [26] show a fitted linear relation between RoR and SpO2 for data that last for merely several minutes. These limitations can be attributed to that, unlike the signals captured in the narrowband setting that is modeled precisely by (3) and (4), all three RGB color channels capture a wide range of wavelengths from the ambient light, as is described in (1). The aggregation of the broad range of wavelengths lowers the optical difference between Hb and HbO2 and makes it less optically selective than narrowband sensors used in oximeters. To address this issue, we disentangle the aggregation through a careful combination of the pulsatile signals from all three channels of RGB videos to efficiently distill the SpO2 information.
III Proposed Multi-Channel RoR Method
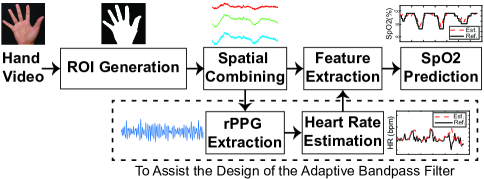
Fig. 1 illustrates the proposed procedure for the SpO2 estimation from the smartphone captured hand videos. First, the hand is detected as the region of interest (ROI) for each frame. Second, the spatial average from the ROI is calculated to obtain three time-varying signals of RGB channels. The averaged RGB signals are extracted for two purposes: i) to estimate the heart rate (HR), and ii) to acquire the filtered cardio-related AC components using an HR-based adaptive bandpass filter. Third, the ratio between the AC and the DC components for each color channel and the pairwise ratios of the resulting three ratios are computed as the features for a regression model where SpO2 is treated as the label. The details of each step are provided as follows.
III-A ROI Generation via Thresholding and Spatial Combining
To facilitate the data collection with good quality, we use a rectangle to enclose the target hand region. We use an interactive user interface for this step, which can be replaced by an automated hand detection algorithm [31] if desired. The pixels in this region are converted from the RGB color space to the YCrCb color space, and the Cr channel is used [32] to determine a threshold that best differentiates the skin pixels from the background using the Otsu algorithm [33]. We apply morphological erosion and dilation operations with a median filter to exclude noise pixels outside the region of the binary hand mask. The final hand-shaped mask is considered as the ROI, and an example is shown in the second picture in Fig. 1. For all frames in the video, we calculate the spatial average values of the red, green, and blue channels in the ROI and denote them as , and arrange them into a matrix .
III-B rPPG Extraction and HR Estimation
In a typical RoR method, after matrix is calculated, the AC component for each channel of is quantified by either the standard deviation [10] or the peak-to-valley amplitude [19]. Since the signal-to-noise ratio (SNR) is lower for the video captured by a smartphone in a contactless manner, we propose to use an adaptive bandpass filter centered at the HR frequency to clean the RGB channel signals so as to extract the AC components more precisely.
The HR can be measured contact-free by capturing the pulse-induced subtle color variations of the skin. The pulse signal, referred to as remote photoplethysmogram (rPPG), can be obtained from applying the plane-orthogonal-to-skin (POS) algorithm [29], which defines a plane orthogonal to the skin tone in the RGB space for robust rPPG extraction. The HR is then tracked from the rPPG signal via a state-of-the-art adaptive multi-trace carving (AMTC) [34] algorithm that tracks the HR from the spectrogram of rPPG by dynamic programming and adaptive trace compensation.
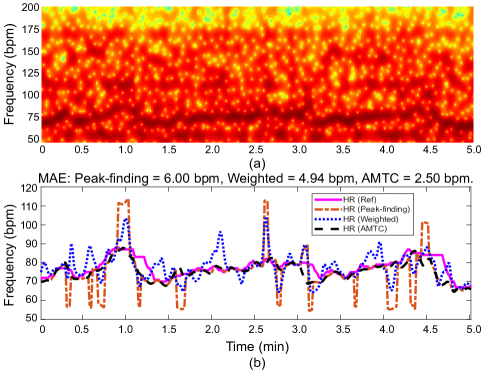
To study the role of accurate HR tracking for feature extraction, we also implemented a peak-finding method and a weighted energy method for frequency estimation [35] to compare with AMTC. The peak-finding method takes the peaks of the squared magnitude of the Fourier transform of rPPG as the estimated HR values, which was used in [16] and [17]. The weighted energy method finds the heart rate by weighing the frequency bins in the corresponding frame of the spectrogram of rPPG. Compared to the peak-finding method, the weighted energy method is more robust to outliers in frequency. Fig. 2 illustrates an example of the HR estimation results by the peak-finding method, the weighted energy algorithm, and AMTC, respectively.
III-C Feature Extraction
We use a processing window of 10 seconds with a step size of 1 second to segment the whole video into windows. Within each window, the DC and AC components of the RGB channels are calculated to build a feature vector .
DC component We use a second-order lowpass Butterworth filter with a cutoff frequency at 0.1 Hz. The DC component is estimated using the median of the lowpass filtered signal of each window.
AC component The estimated heart rate values from Section III-B are used as the center frequencies for the adaptive bandpass (ABP) filters to extract the AC components of the RGB channels, which eliminates all frequency components that are unrelated to the cardiac pulse. We adopt an 8th-order Butterworth bandpass filter with Hz (6 bpm) bandwidth, centering at the estimated HR of the current window. The magnitude of the AC component is estimated using the average of the peak-to-valley amplitudes of the filtered signals within the current processing window.
We define the normalized AC components at the th window as , where represents color channel and . We define the multi-channel ratio-of-ratios based feature vector of the th window as .
III-D Regression and Prediction
In this first proof-of-concept work leveraging multi-channel ratio features, we use linear regression (LR) and support vector regression (SVR) to learn the mapping between the features and the SpO2 level. Since LR captures only the linear relationship, it has limited learning capability and will serve as a baseline. The objective function is , where contains the target SpO2 values, is the feature/data matrix derived from the input, and contains the weights. An -regularization term is added to the objective function to avoid rank deficiency caused by the collinearity among features. To select the optimal regularization parameter , we use a 5-fold cross-validation. In addition to LR, we use the SVR to better capture the nonlinearity of the features. The Libsvm library [36] is used for training the -SVR, , where is the linear -insensitive loss function [37]. Our implementation uses the radial basis function (RBF) kernel to capture the nonlinearity. The hyperparameters, including the penalty cost and the kernel parameter of kernel function are selected via a grid search over a 5-fold cross-validation loss.
Once an estimated weight vector is learned from the linear or support vector regression, is then used to predict a preliminary SpO2 signal. Finally, a 10-second moving average window is applied to smooth out the preliminarily predicted signal to obtain the final predicted SpO2 signal.
IV Experimental Results
IV-A Data Collection
Fourteen volunteers, including eight females and six males, were enrolled in our study under protocol #1376735-2 approved by the University of Maryland Institutional Review Board (IRB), with age range between and , and Fitzpatrick skin types II–V. There are two, eight, one, and three participants having skin types II, III, IV, and V, respectively. None of the participants had any known cardiovascular or respiratory diseases. During the data collection, participants were asked to hold their breath to induce a wide dynamic range of SpO2 levels. The typical SpO2 range for a healthy person is from . By holding breath, the SpO2 level can drop below . Once the participant resumes normal breathing, the SpO2 will return to the level before the breath-holding.
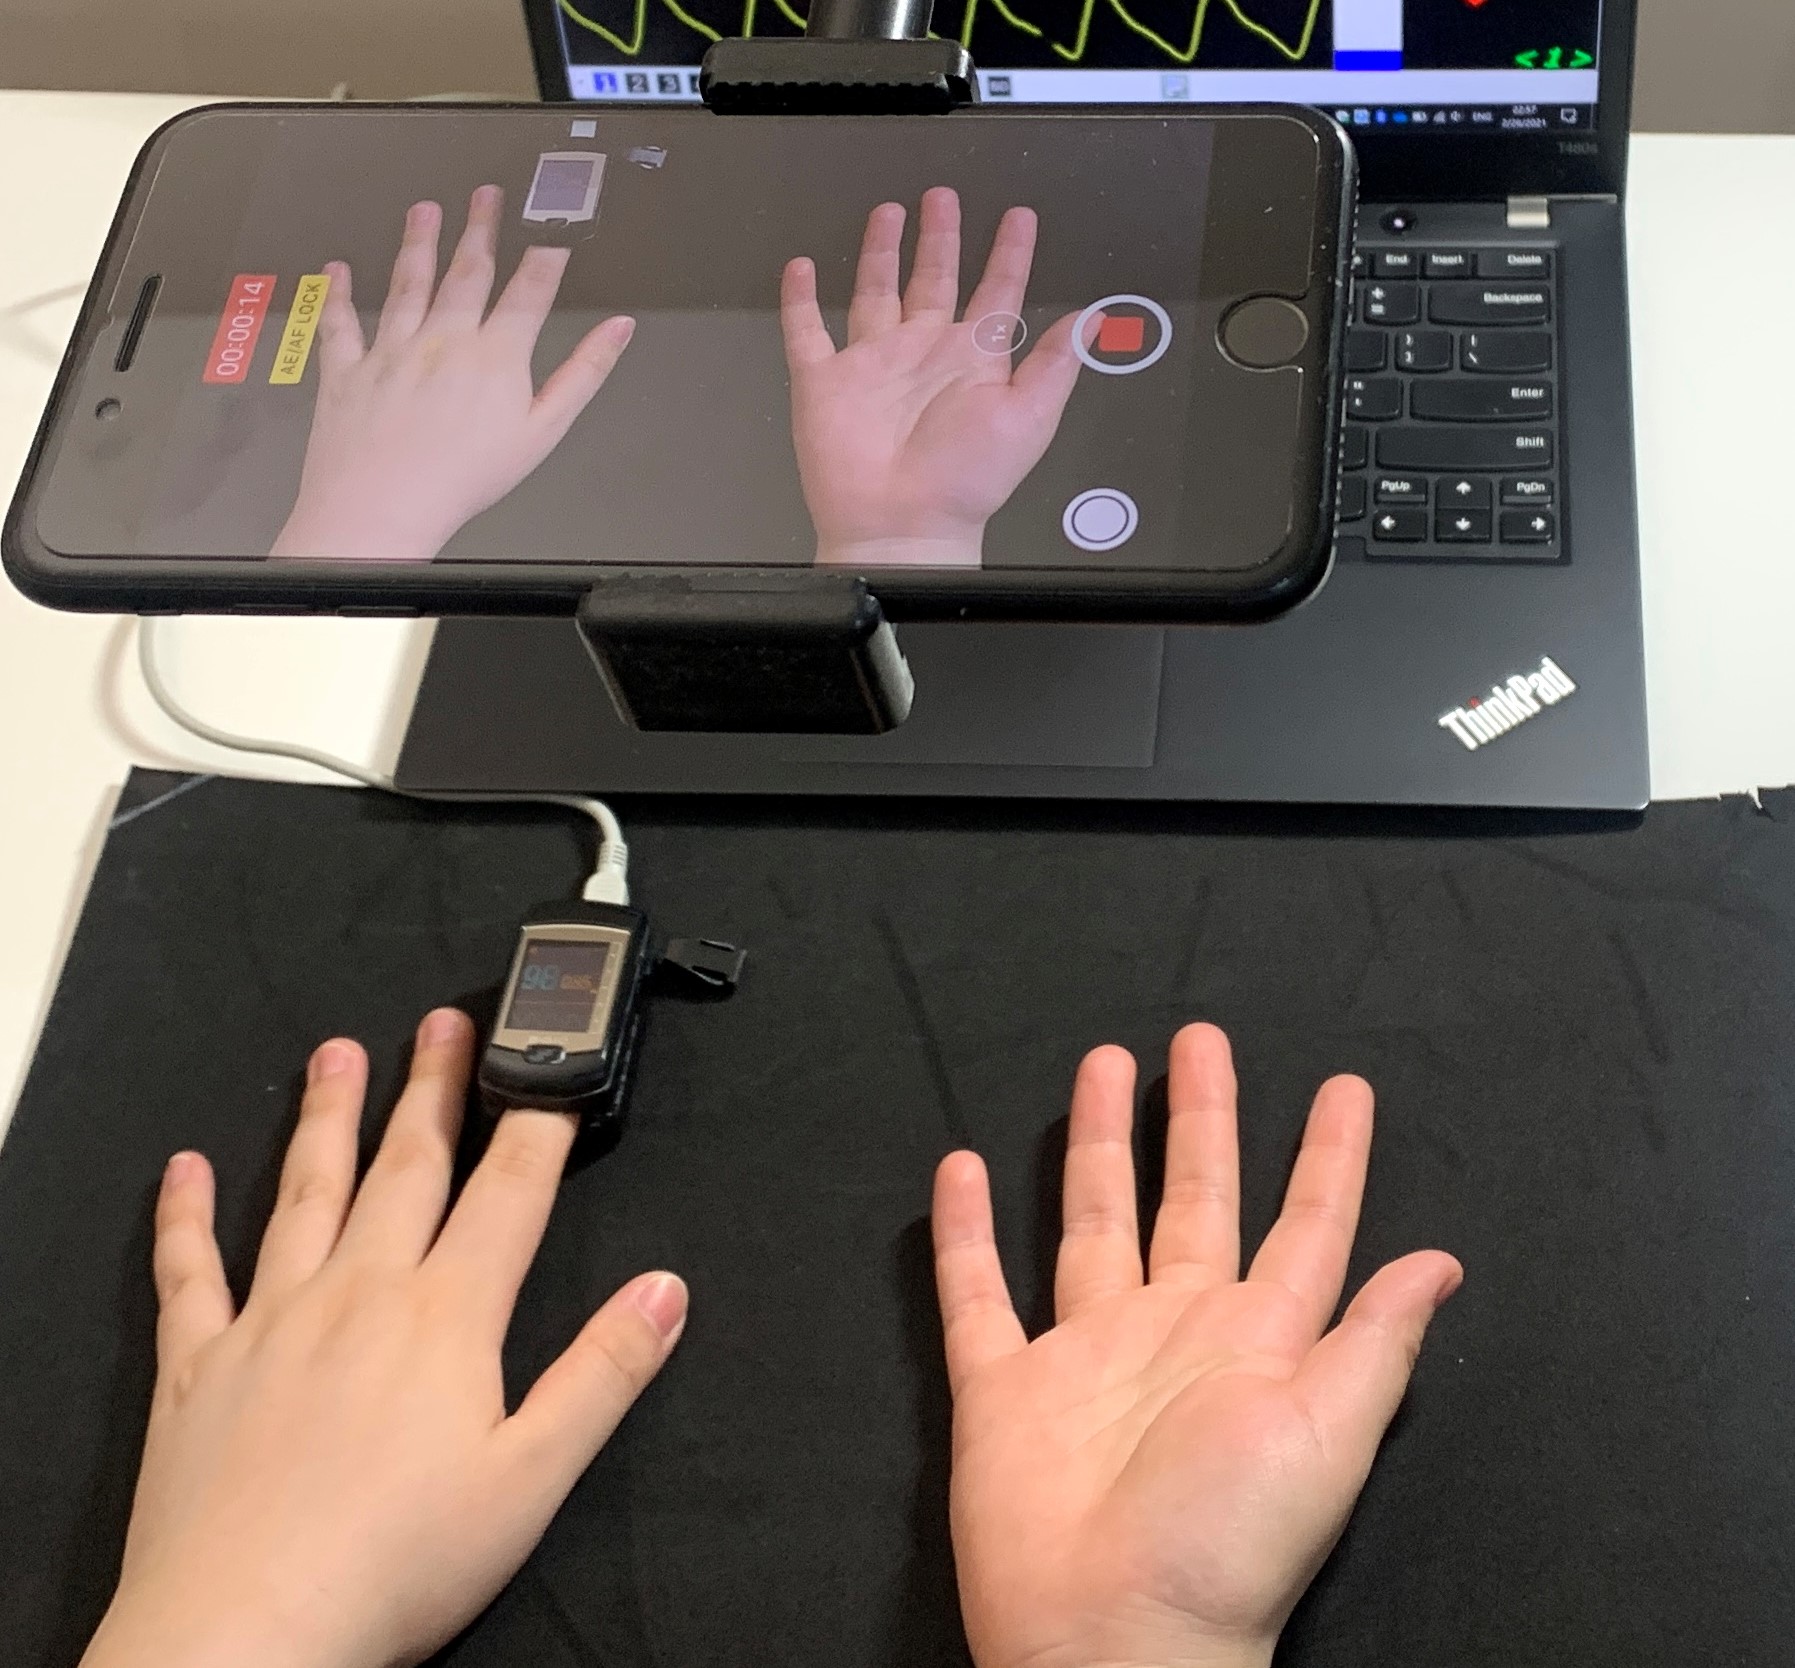
Each participant was recorded for two sessions. During the recording, the participant sat comfortably in an upright position and put both hands on a clean dark foam sheet placed on a table. As shown in Fig. 3, the palm side of the right hand and the back side of the left hand were facing the camera. These two hand-video capturing positions are defined as palm up (PU) and palm down (PD), respectively. Simultaneously, a Contec CMS-50E pulse oximeter was clipped to the left index finger to measure the participant’s SpO2 level. As we have reviewed earlier, the oximeter is adopted clinically as to be within a deviation from the invasive, gold standard for SpO2 [8], so we use the oximeter measurement results as the reference in our experiments. An iPhone 7 Plus camera was used for video recording. The video started 30 seconds before the oximeter starts, and stopped immediately after the oximeter ends to allow for proper time synchronization. The participants were asked to hold their breath to lower the SpO2 level and were told to resume normal breathing if they felt discomfort. The aforementioned process is defined as one breath-holding cycle. In each session, the breath-holding cycles were repeated three times. After the first session, the participants were asked to relax for at least minutes before attending the second session for data collection. From our data collection protocol using breath-holding, we were able to obtain the SpO2 measurements with a dynamic range from to .
The total length of recording time for all fourteen participants is 138.9 minutes. The current data size is relatively small for large-scale neural network training. This is by a large part due to the restrictions for human subject related data collection imposed during the COVID-19. The available data, however, is adequate for our principled multi-channel signal based approach to SpO2 monitoring, showing a benefit of combining signal processing and biomedical knowledge and modeling with data than the primarily data-driven approach.
Delay Estimation of Pulse Oximeter: When the CMS-50E oximeter is turned on and ready for measurement, the first reading is displayed a few seconds after the finger is inserted. This delay may be due to oximeter’s internal firmware startup and algorithmic processing. Since we need to synchronize the video and the oximeter readings using their precise starting time stamps, the delay in oximeter can introduce misalignment errors in the reference data that we use to train the regression model. To avoid the misalignment, we first estimate the delay and then compensate for that in the training and testing. To do so, we asked one participant to repeatedly place the left index finger, middle finger, and ring finger into the oximeter 50 times each and obtained the average delay time of 1.8s, 1.9s, and 1.7s, respectively. Because the left index finger is used for reference data collection in our setup, we take 1.8s as the delay. To further examine whether there exists any difference among the delays from the three fingers, we conducted a one-way ANOVA test. The -value is , which shows no statistically significant different delays among the three fingers.
IV-B Performance Metrics
The performance of the algorithm is evaluated using the mean absolute error (MAE) (7a) and Pearson’s correlation coefficient (7b) given below:
| (7a) | ||||
| (7b) | ||||
where , , , and denote the reference SpO2 signal, the estimated SpO2 signal, the average values of all coordinates of vectors and , respectively. We adopt the correlation metric to evaluate how well the trend of the SpO2 signal is tracked.
IV-C Results From Proposed Algorithm
In this subsection, we use the training data from one participant to train the regression model for the prediction of his/her testing session recorded a period of time later. We call the aforementioned training and testing procedure the participant-specific mode in which the models are specifically learned for each participant. We will discuss the leave-one-out mode of the performance of the proposed algorithm in Section IV-E.
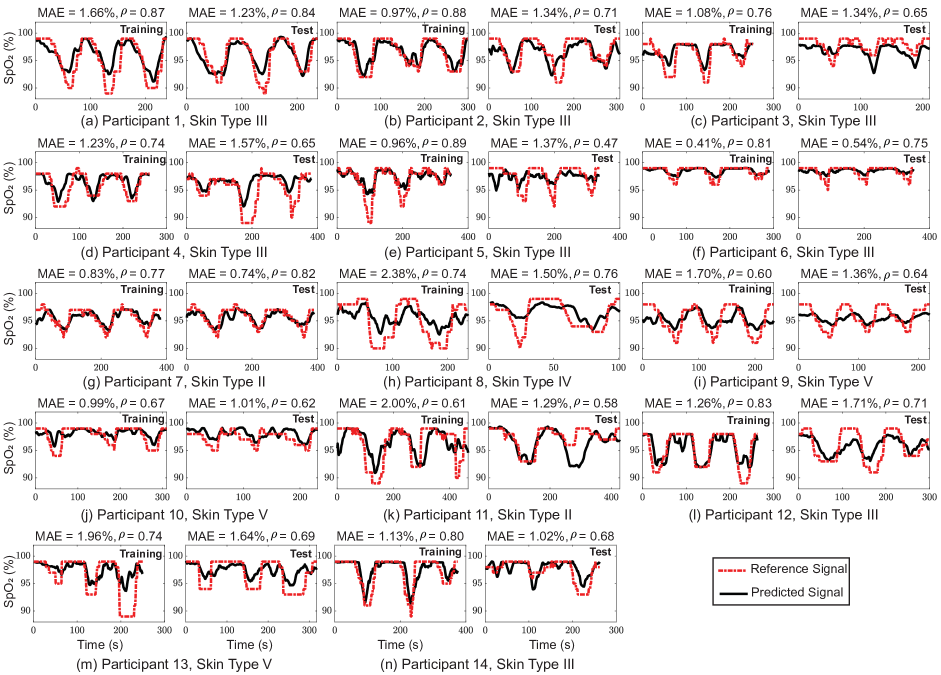
Fig. 4 presents the learning results for all the participants using SVR for PU cases. Both training and testing sessions are shown for each participant. The SpO2 curves in each session contain three dips that are resulted from breath holding, except for participant #8 who had a shorter session due to limited tolerance of breath-holding. For each participant, we provide the skin-tone information in the subplot and show the accuracy indicators, MAE and , for SpO2 prediction. In all training sessions, MAE is below and is above . From this observation, we find that all the predicted SpO2 signals in the training sessions are closely following the reference signals. Furthermore, all testing MAE values are within , suggesting that those trained models adapt well to the testing data. While there are a few cycles that the predicted signal does not fully follow the reference signal, such as the second dip for participant #4 and participant #11, the trends are consistent.
| Training | Testing | |||||
|---|---|---|---|---|---|---|
| MAE | Correlation | MAE | Correlation | |||
| LR | PU | 1.69% | 0.63 | 1.52% | 0.62 | |
| (0.57%) | (0.16) | (0.54%) | (0.11) | |||
| PD | 1.74% | 0.61 | 1.53% | 0.56 | ||
| (0.76%) | (0.21) | (0.53%) | (0.21) | |||
| SVR | PU | 1.33% | 0.76 | 1.26% | 0.68 | |
| (0.54%) | (0.09) | (0.33%) | (0.10) | |||
| PD | 1.35% | 0.75 | 1.28% | 0.65 | ||
| (0.45%) | (0.09) | (0.40%) | (0.14) | |||
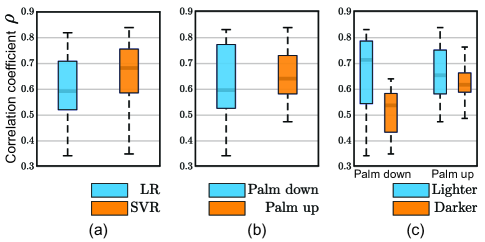
Table I summarizes the training and testing SpO2 estimation performance of both LR and SVR based methods for both PU and PD cases. The best performance is achieved using SVR method in the PU case. We further examine the difference between the two regression methods using boxplots in Fig. 5(a) that show the distributions of the correlation for testing by LR and SVR, respectively. Each boxplot in Fig. 5(a) contains both PU and PD cases from all participants. The results are compared in terms of the median and the interquartile range (IQR). IQR quantifies the spread of the distribution by measuring the difference between the first quartile and the third quartile. The boxplots in Fig. 5(a) reveal that the SVR method outperforms LR with a higher median of 0.68 compared to 0.59 and with a narrower IQR of 0.17 compared to 0.19. This suggests that there may exist a nonlinear relationship between the extracted features and the SpO2 values.
To examine the impact of the side of a hand and the skin tone on the performance of SpO2 estimation, we analyze the following two research questions: (i) whether the side of hand makes a difference in lighter skin (type II and III) or darker skin (type IV and V) or mixed skins (all participants), and (ii) whether the different skin tones matter in PU or PD case.
To answer question (i), we first focus on the distributions from PU and PD cases in Fig. 5(b) with each boxplot representing the correlation in testing for all participants. We observe that the PU case outperforms the PD case with a higher median of 0.64 compared to 0.60 and a narrower IQR of 0.15 compared to 0.25. We then zoom into each subgroup of skin tones shown in Fig. 5(c). For the lighter skin group, even though the median of PD case is 0.71, which is 9% better than that of PU, the IQR of PD case is 0.24, which is worse than the IQR of 0.17 of PU case. This suggests that the distributions are comparable between PU and PD cases for the lighter skin group. For the darker skin group, the PU case outperforms the PD case with a higher median of 0.62 compared to 0.54 and a narrower IQR of 0.07 compared to 0.15. In summary, there is no substantial difference between PU and PD cases in the lighter skin group, whereas for the darker skin group and overall participants, the PU case is better than the PD case.
To answer question (ii), we first focus on the left two boxplots of Fig. 5(c). In the PD case, the median of the lighter skin group is significantly larger than that of the darker skin group by 31%, however, the lighter skin group also has a larger IQR. This makes it difficult to make a conclusion from the median–IQR analysis, hence we apply the -test to complement our analysis. We note that the -value is 0.037 0.05, showing that there is a significant difference in between these two groups. In the PU case shown in the right half of Fig. 5(c), the medians of the lighter skin group and darker skin group are 0.65 and 0.62, with IQR being 0.17 and 0.07, respectively. Thus, in our current dataset, no substantial performance difference is observed between lighter and darker skin tones in the PU case.
IV-D Ablation Study of Proposed Pipeline
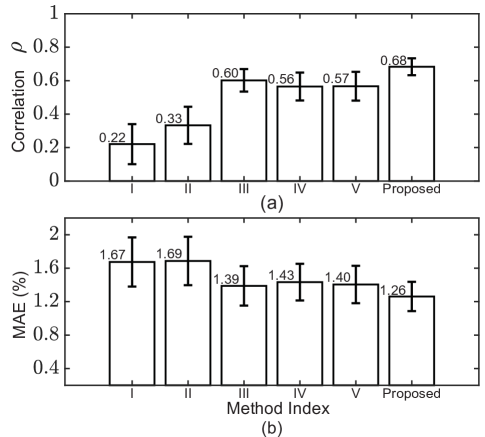
In Sections III-B and III-C, we have proposed three key designs in our algorithm, including a) the feature vector containing pulsatile information from all RGB channels, b) the narrow ABP filter, and c) the passband of ABP filter centered at precise HR frequency tracked by AMTC. To study the importance of each component, we conducted three controlled experiments by removing one factor at a time and the configurations of methods corresponding to the experiments are listed in Table II. The results for the methods are illustrated in Fig. 6. The height of each bin shows the average of correlation coefficient or the MAE of SpO2 estimation results from testing sessions (SVR, PU case) of all participants. Each pair of error bars corresponds to the confidence interval that is calculated as , where is the sample standard deviation and is the sample size/number of participants.
| Method Index | Configuration | |||||||
|---|---|---|---|---|---|---|---|---|
|
|
|
||||||
| I | Two-channel RoR | ✓ | ✓ | |||||
| II | ✓ | No ABP | n/a | |||||
| III | ✓ | Wide ABP | ✓ | |||||
| IV | ✓ | ✓ | Peak-finding | |||||
| V | ✓ | ✓ | Weighted energy | |||||
| Proposed | ✓ | ✓ | ✓ | |||||
IV-D1 Advantage of The Proposed Multi-Channel RoR Over Two-Channel RoR
In this part, we compare our proposed algorithm with “Method (I): RoR with nABP (AMTC).” Method (I) follows the feature extraction method proposed in Section III-C, including the narrow adaptive bandpass filter (nABP) centered at AMTC-tracked HR. The only exception is that, instead of using the feature vector that contains multi-channel information, only the ratio of ratios between the red and blue channels as in traditional RoR methods is used.
Fig. 6 reveals that our proposed method outperforms method (I) by a big margin. More specifically, our proposed method improves the correlation coefficient from to and the MAE from to . This improvement confirms that our proposed multi-channel feature set helps with the more accurate SpO2 monitoring.
IV-D2 Contribution of Narrowband ABP Filter for Feature Extraction
Here we compare with the following two methods to show the necessity of using a narrowband HR-guided bandpass filter:
-
•
Method (II): Feature vector without ABP uses a nonadaptive, generic bandpass filter with the passband over Hz, covering the normal range of heart rate in sedentary mode to replace the HR-based narrow ABP filter proposed in Section III-C for feature extraction.
-
•
Method (III): Feature vector with wide ABP (AMTC) applies a wider ABP filter with Hz bandwidth than the Hz one used in our proposed method. This wider ABP filter’s center frequency is provided by the AMTC tracking algorithm of the HR described in Section III-B.
The bandpass filters used for methods (II) and (III) have the same bandwidth, Hz. In terms of center frequency, method (II) used a fixed setting at Hz, while method (III) is adaptively centered at the estimated HR value. Compared to method (II), method (III) has an improved testing MAE by . Furthermore, compared to method (III), our proposed method with a narrow ABP filter improves the correlation coefficient for testing by and MAE by , suggesting the contribution of the narrow HR-based ABP filter strategy for AC computation.
IV-D3 Importance of Accurate HR Tracking on SpO2 Monitoring
We consider the following two methods to compare with our proposed method:
-
•
Method (IV): Feature vector with narrow ABP (peak-finding) applies a narrow ABP filter of bandwidth Hz for extracting the feature vector . The center frequency of the ABP filter is the HR estimated from the peak-finding algorithm described in Section III-B.
-
•
Method (V): Feature vector with narrow ABP (weighted) is similar to method (IV), except that the frequency estimation algorithm is replaced by the weighted energy in Section III-B.
The averaged MAE of the HR estimation for all participants by the peak-finding algorithm, weighted frequency estimation algorithm, and AMTC algorithm are bpm, bpm, and bpm, respectively.
Fig. 6 shows that methods (IV) and (V) perform similarly with vs. for correlation and vs. for MAE, respectively. Our proposed method guided by the AMTC tracked HR outperforms methods (IV) and (V) by and in correlation, and by and in MAE, respectively. These results suggest that the accurate HR estimation for ABP filter design improves the quality of the AC magnitude by preserving the most cardiac-related signal from RGB channels, which in turn helps with the accurate SpO2 monitoring.
IV-E Leave-One-Out Experiments
As a proof of concept and considering the currently limited amount of the available data, we have so far discussed the SpO2 estimation under the participant-specific (PS) scenario in Section IV where the models are calibrated for each individual. This PS mode corresponds well to the trending “precision telehealth” that tailors the healthcare service to individuals.
In this subsection, we consider a more practical scenario where the test participant’s data are never seen or only form a limited portion of the training data. In this scenario, we can develop a group-based model based on skin tone or other determinants of health, and for each subgroup, the model is “universal” and participant-independent. We will examine this group-based model through the following two modes of leave-one-out experiments:
-
•
Leave-one-session-out (LOSessO): when testing on a given participant, we include his/her training session data together with other participants’ data for training.
-
•
Leave-one-participant-out (LOPartO): when testing on a given participant, we only use other people’s data for training and leave out the data from this test participant.
LOPartO LOSessO PS MAE MAE MAE PU 1.70% 0.53 1.59% 0.55 1.26% 0.68 (0.60%) (0.38) (0.58%) (0.36) (0.33%) (0.10) PD 1.76% 0.48 1.70% 0.50 1.28% 0.65 (0.59%) (0.38) (0.59%) (0.39) (0.40%) (0.14)
We group the participants by the skin type into lighter skin color (skin types II and III) and darker skin color (skin types IV and V) groups. We conduct LOSessO and LOPartO experiments on each subgroup and obtain the SVR generated testing results from all participants in Table III. The MAE and correlation coefficient improve from LOPartO to LOSessO to PS for both PU and PD cases. This result suggests that the precision telehealth inspired PS mode is the most accurate approach to monitoring SpO2 for an individual. Based on the overall results shown in Table III, most participants demonstrate a consistent trend of the accuracy of SpO2 estimation from LOPartO to LOSessO to PS case. The correlation of participant #12 is less than in both leave-one-out modes, suggesting that this participant may have some uncommon relation compared to others between the extracted features and SpO2 values.
V Discussion
V-A Performance on Contact SpO2 Monitoring
In addition to contact-free SpO2 monitoring, we evaluate whether our proposed algorithm can be applied to a contact-based smartphone setup. To collect data, the left index finger covers the smartphone’s illuminating flashlight and the nearby built-in camera, and the camera captures a pulse video at the fingertip. Another smartphone is used to simultaneously record a top view video of the back side of the right hand whose index finger is placed in the oximeter for SpO2 reference data collection. One participant took part in this extended experiment where one training session with three breath-holding cycles was recorded, and three testing sessions were recorded 30 minutes after the training session.
In Table IV, we compare the performance of our proposed algorithm in both the contact-based and contact-free SpO2 measurement settings. The conventional RoR models used in [10] and [11] were implemented as baseline models for contact-based SpO2 measurement. In [10], the mean and standard deviation of each window from the red and blue channels are calculated as the DC and AC components. A linear model was built to relate the ratio-of-ratios from the two color channels with SpO2. In [11], the median of the pulsatile peak-to-valley amplitude is regarded as the AC component. For the two RoR methods, we implemented both LR and SVR. For contact-free SpO2 measurement, we take the traditional two-color channel RoR method implemented in Section IV-D as the baseline to compare with the proposed method.
Table IV reveals that our proposed algorithm outperforms other conventional RoR models in the contact-based SpO2 monitoring. Even in the contact-free case, our algorithm presents a comparable performance to that of the contact-based cases, despite that the SNR of the fingertip video is better than the SNR from a remote hand video.
V-B Resilience Against Blurring
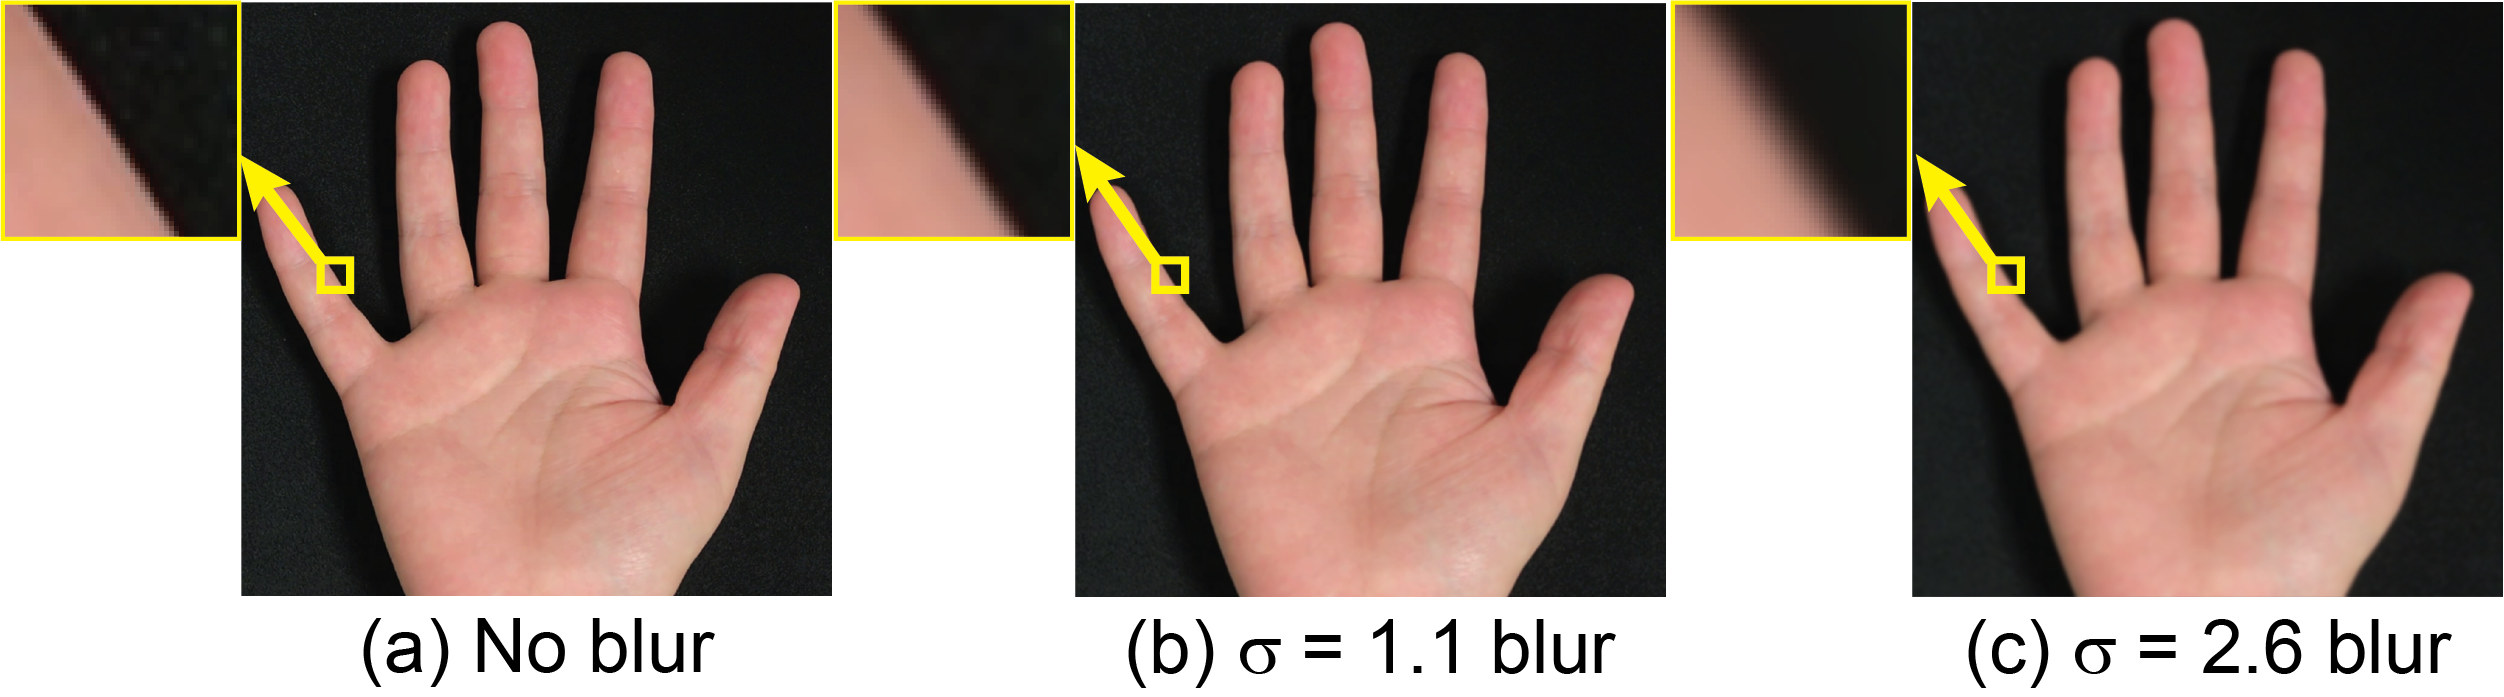
In this subsection, we explore the robustness of our algorithm to the blurring effect on hand images. In the current setup, the hands are placed on a stable table with a cellphone camera acquiring the skin color of both hands. Ideal laboratory conditions are often not satisfied under practical scenarios, and the hand images captured by the cellphone cameras may be blurred due to being out of focus. The point spread function is modeled as a 2D homogeneous Gaussian kernel. The finite support of the kernel is defined manually to generate perceptually different blurry effects and then the standard deviation is computed based on the given support. To test different blurry effects, we experimented with two different blurry levels ( pixels) and ( pixels), respectively. The blurring effects are demonstrated in Fig. 7.
Training Testing MAE MAE blur 1.41% 0.72 1.31% 0.67 ( pixels) (0.50%) (0.11) (0.35%) (0.09) blur 1.42% 0.70 1.34% 0.68 ( pixels) (0.59%) (0.16) (0.41%) (0.10) No blur 1.33% 0.76 1.26% 0.68 (0.54%) (0.09) (0.33%) (0.10)
Table V presents the SVR generated results for PU cases with different and kernel sizes. We use the SVR, PU scenario to showcase here as it achieves the best SpO2 prediction performance, which is verified in Section IV-C. From the table, we find that our algorithm is robust to the Gaussian blurring effect. After the blurring, the testing remains the same, and testing MAE is higher than the no blurring case. After the blurring, the testing is lower and MAE is higher than the no blurring case.
V-C Limitations and Further Verification with Different Hypoxia Protocols
From the recordings of our data collection protocol for voluntary breath-holding, we observed that HR and SpO2 are correlated for many participants. That is, in one breath-holding cycle, when the participant starts to hold breath, his/her HR increases and SpO2 drops as the oxygen runs out. As he/she resumes normal breathing, his/her HR and SpO2 recover to be within the normal range. Due to individuals’ different physical conditions, in some participants, the peak of the HR signal and valley of the SpO2 signal happen in such a short time interval that HR and SpO2 are significantly negatively correlated. This observation is in line with the biological literature [38]. In the literature, breath-holding exercises were found to be able to yield significant changes in the cardiovascular system. In the central circulation, they caused significant changes in heart rate, and in the peripheral circulation, they caused significant changes in arterial blood flow and oxygen saturation.
Based on the above observation that HR is correlated with SpO2 during breath-holding, we are curious whether our method also works for a different protocol where the HR remains relatively constant compared to SpO2. An intermittent hypoxia protocol used in the literature shows that by receiving hypoxic air (inspired fraction of oxygen between and ) intermittently with normoxic air, the participant can have a much milder HR change than breath-holding, while a significant decrease in SpO2 can be achieved during the hypoxia [39, 40]. The research restriction affecting human subject research in many U.S. institutions limited our ability to carry out the abovementioned hypoxia protocol. Once the restriction is eased, we will investigate the performance of our proposed algorithm when applied to other hypoxia protocols.
VI Conclusion and Future Work
This paper presents a contact-free method of measuring blood oxygen saturation from hand videos captured by smartphone cameras. Our proposed method is a synergistic combination of several key components, including the multi-channel ratio-of-ratios feature set, the narrowband filtering that adaptively centered at heart rates, and the accurately estimated heart rate. We have seen encouraging results of a mean absolute error of with a commercial pulse oximeter as the reference, outperforming the conventional ratio-of-ratios method by . We have also analyzed the impact of sides of the hand and skin tones on the SpO2 estimation. We have found that, given our collected dataset, the palm side performs well regardless of the skin tone. Besides, we do not observe significant performance differences between lighter and darker skin tones in the palm-up case.
Future work includes verifying our methods with data collected under different hypoxia protocols, enlarging the dataset with more variations in skin color, and applying large-scale and interpretable neural networks with optophysiological insights.
References
- [1] M. C. Simon and B. Keith, “The role of oxygen availability in embryonic development and stem cell function,” Nature Reviews Molecular Cell Biology, vol. 9, no. 4, pp. 285–296, Apr. 2008.
- [2] N. Shenoy, R. Luchtel, and P. Gulani, “Considerations for target oxygen saturation in COVID-19 patients: Are we under-shooting?” BMC Medicine, vol. 18, no. 1, pp. 1–6, Dec. 2020.
- [3] J. Couzin-Frankel, “The mystery of the pandemic’s ‘happy hypoxia’,” Science, 2020. [Online]. Available: https://science.sciencemag.org/content/368/6490/455
- [4] M. J. Tobin, F. Laghi, and A. Jubran, “Why COVID-19 silent hypoxemia is baffling to physicians,” American Journal of Respiratory and Critical Care Medicine, vol. 202, no. 3, pp. 356–360, Aug. 2020.
- [5] J. Teo, “Early detection of silent hypoxia in COVID-19 pneumonia using smartphone pulse oximetry,” J. Medical Systems, vol. 44, no. 8, pp. 1–2, Aug. 2020.
- [6] J. G. Webster, Design of pulse oximeters. CRC Press, Oct. 1997.
- [7] J. W. Severinghaus, “Takuo Aoyagi: Discovery of pulse oximetry,” Anesthesia and Analgesia, vol. 105, no. 6, pp. S1–S4, Dec. 2007.
- [8] A. Plüddemann, M. Thompson, C. Heneghan, and C. Price, “Pulse oximetry in primary care: Primary care diagnostic technology update,” British J. General Practice, vol. 61, no. 586, pp. 358–359, May 2011.
- [9] “How to use the Blood Oxygen app on Apple Watch Series 6,” https://support.apple.com/en-us/HT211027, Accessed: 2021-05-17.
- [10] C. G. Scully, J. Lee, J. Meyer, A. M. Gorbach, D. Granquist-Fraser, Y. Mendelson, and K. H. Chon, “Physiological parameter monitoring from optical recordings with a mobile phone,” IEEE Trans. Biomed. Eng., vol. 59, no. 2, pp. 303–306, Jul. 2011.
- [11] Z. Lu, X. Chen, Z. Dong, Z. Zhao, and X. Zhang, “A prototype of reflection pulse oximeter designed for mobile healthcare,” IEEE J. Biomed. Health Inform., vol. 20, no. 5, pp. 1309–1320, Aug. 2015.
- [12] X. Ding, D. Nassehi, and E. C. Larson, “Measuring oxygen saturation with smartphone cameras using convolutional neural networks,” IEEE J. Biomed. Health Inform., vol. 23, no. 6, pp. 2603–2610, Dec. 2018.
- [13] N. Bui, A. Nguyen, P. Nguyen, H. Truong, A. Ashok, T. Dinh, R. Deterding, and T. Vu, “Smartphone-based SpO2 measurement by exploiting wavelengths separation and chromophore compensation,” ACM Trans. Sens. Netw., vol. 16, no. 1, pp. 1–30, Jan. 2020.
- [14] İ. Tayfur and M. A. Afacan, “Reliability of smartphone measurements of vital parameters: A prospective study using a reference method,” The American J. Emergency Medicine, vol. 37, no. 8, pp. 1527–1530, Aug. 2019.
- [15] L. Kong, Y. Zhao, L. Dong, Y. Jian, X. Jin, B. Li, Y. Feng, M. Liu, X. Liu, and H. Wu, “Non-contact detection of oxygen saturation based on visible light imaging device using ambient light,” Opt. Exp., vol. 21, no. 15, pp. 17 464–17 471, Jul. 2013.
- [16] M. Van Gastel, S. Stuijk, and G. de Haan, “New principle for measuring arterial blood oxygenation, enabling motion-robust remote monitoring,” Scientific Reports, vol. 6, no. 1, pp. 1–16, Dec. 2016.
- [17] A. R. Guazzi, M. Villarroel, J. Jorge, J. Daly, M. C. Frise, P. A. Robbins, and L. Tarassenko, “Non-contact measurement of oxygen saturation with an RGB camera,” Biomed. Opt. Express, vol. 6, no. 9, pp. 3320–3338, Sep. 2015.
- [18] M. van Gastel, W. Verkruysse, and G. de Haan, “Data-driven calibration estimation for robust remote pulse-oximetry,” Applied Sciences, vol. 9, no. 18, p. 3857, Jan. 2019.
- [19] D. Shao, C. Liu, F. Tsow, Y. Yang, Z. Du, R. Iriya, H. Yu, and N. Tao, “Noncontact monitoring of blood oxygen saturation using camera and dual-wavelength imaging system,” IEEE Trans. Biomed. Eng., vol. 63, no. 6, pp. 1091–1098, Sep. 2015.
- [20] H.-Y. Tsai, K.-C. Huang, and J. A. Yeh, “No-contact oxygen saturation measuring technology for skin tissue and its application,” IEEE Instrum. Meas. Magazine, vol. 19, no. 5, pp. 57–64, Sep. 2016.
- [21] C. J. Coté, E. A. Goldstein, W. H. Fuchsman, and D. C. Hoaglin, “The effect of nail polish on pulse oximetry,” Anesthesia and Analgesia, vol. 67, no. 7, pp. 683–686, Jul. 1988.
- [22] G. H. Yönt, E. A. Korhan, and B. Dizer, “The effect of nail polish on pulse oximetry readings,” Intensive and Critical Care Nursing, vol. 30, no. 2, pp. 111–115, Apr. 2014.
- [23] A. d. F. G. Rosa and R. C. Betini, “Noncontact SpO2 measurement using Eulerian video magnification,” IEEE Trans. Instrum. Meas., vol. 69, no. 5, pp. 2120–2130, May 2019.
- [24] G. Casalino, G. Castellano, and G. Zaza, “A mHealth solution for contact-less self-monitoring of blood oxygen saturation,” in IEEE Symp. Comp. Comm., Jul. 2020, pp. 1–7.
- [25] U. Bal, “Non-contact estimation of heart rate and oxygen saturation using ambient light,” Biomed. Opt. Exp., vol. 6, no. 1, pp. 86–97, Jan. 2015.
- [26] L. Tarassenko, M. Villarroel, A. Guazzi, J. Jorge, D. Clifton, and C. Pugh, “Non-contact video-based vital sign monitoring using ambient light and auto-regressive models,” Physiol. Meas, vol. 35, no. 5, p. 807, Mar. 2014.
- [27] Z. Sun, Q. He, Y. Li, W. Wang, and R. K. Wang, “Robust non-contact peripheral oxygenation saturation measurement using smartphone-enabled imaging photoplethysmography,” Biomed. Opt. Exp., vol. 12, no. 3, pp. 1746–1760, Mar. 2021.
- [28] Y. Sun and N. Thakor, “Photoplethysmography revisited: From contact to noncontact, from point to imaging,” IEEE Trans. Biomed. Eng., vol. 63, no. 3, pp. 463–477, 2015.
- [29] W. Wang, A. C. den Brinker, S. Stuijk, and G. de Haan, “Algorithmic principles of remote PPG,” IEEE Trans. Biomed. Eng., vol. 64, no. 7, pp. 1479–1491, Sep. 2016.
- [30] R. Szeliski, Computer Vision: Algorithms and Applications. Springer Science & Business Media, 2010.
- [31] A. Urooj and A. Borji, “Analysis of hand segmentation in the wild,” in Proceedings of the IEEE Conference on Computer Vision and Pattern Recognition (CVPR), 2018, pp. 4710–4719.
- [32] D. Chai and K. N. Ngan, “Face segmentation using skin-color map in videophone applications,” IEEE Trans. Circuits and Systems for Video Technology, vol. 9, no. 4, pp. 551–564, Jun. 1999.
- [33] N. Otsu, “A threshold selection method from gray-level histograms,” IEEE Trans. Syst., Man, and Cybernet., vol. 9, no. 1, pp. 62–66, Jan. 1979.
- [34] Q. Zhu, M. Chen, C.-W. Wong, and M. Wu, “Adaptive multi-trace carving for robust frequency tracking in forensic applications,” IEEE Trans. Inf. Forensics Security, vol. 16, pp. 1174–1189, May 2020.
- [35] A. Hajj-Ahmad, R. Garg, and M. Wu, “Instantaneous frequency estimation and localization for ENF signals,” in Proc. 4th Annu. Summit and Conf. (APSIPA), Dec. 2012, pp. 1–10.
- [36] C.-C. Chang and C.-J. Lin, “LIBSVM: A library for support vector machines,” ACM Trans. Intelligent Systems and Technology, vol. 2, no. 3, pp. 1–27, May 2011.
- [37] S. Theodoridis, Machine Learning: A Bayesian and Optimization Perspective. Academic press, 2015.
- [38] A. Grunovas, E. Trinkunas, A. Buliuolis, E. Venskaityte, and J. Poderys, “Cardiovascular response to breath-holding explained by changes of the indices and their dynamic interactions,” Biological Systems: Open Access, vol. 5, p. 152, 2016.
- [39] M. Faulhaber, H. Gatterer, T. Haider, T. Linser, N. Netzer, and M. Burtscher, “Heart rate and blood pressure responses during hypoxic cycles of a 3-week intermittent hypoxia breathing program in patients at risk for or with mild COPD,” Int. J. Chronic Obstructive Pulmonary Disease, vol. 10, p. 339, 2015.
- [40] M. Koehle, W. Sheel, W. Milsom, and D. McKenzie, “The effect of two different intermittent hypoxia protocols on ventilatory responses to hypoxia and carbon dioxide at rest,” in Integration in Respiratory Control. Springer, 2008, pp. 218–223.