11email: carlos.cabezas@csic.es, marcelino.agundez@csic.es 22institutetext: Observatorio Astronómico Nacional, IGN, Calle Alfonso XII 3, E-28014 Madrid, Spain 33institutetext: Observatorio de Yebes, IGN, Cerro de la Palera s/n, E-19141 Yebes, Guadalajara, Spain
Interstellar detection of the simplest aminocarbyne, H2NC:
an ignored but abundant molecule††thanks: Based on observations carried out with the IRAM 30m Telescope. IRAM is supported by INSU/CNRS (France), MPG (Germany) and IGN (Spain). These authors contributed equally to this work.
We report the first identification in space of H2NC, a high-energy isomer of H2CN that has been largely ignored in chemical and astrochemical studies. The observation of various unidentified lines around 72.2 GHz in the cold dark cloud L483 motivated the search for, and successful detection of, additional groups of lines in harmonic relation. After an exhaustive high-level ab initio screening of possible carriers, we confidently assign the unidentified lines to H2NC based on the good agreement between astronomical and theoretical spectroscopic parameters and sound spectroscopic and astrochemical arguments. The observed frequencies are used to precisely characterize the rotational spectrum of H2NC. This species is also detected in the cold dark cloud B1-b and the = 0.89 galaxy in front of the quasar PKS 1830211. We derive H2NC/H2CN abundance ratios 1 in L483 and B1-b and 0.27 toward PKS 1830211. Neither H2NC nor H2CN are detected in the dark cloud TMC-1, which seriously questions a previous identification of H2CN in this source. We suggest that the H2NC/H2CN ratio behaves as the HNC/HCN ratio, with values close to one in cold dense clouds and below one in diffuse clouds. The reactions N + CH3 and C + NH3 emerge as strong candidates to produce H2NC in interstellar clouds. Further studies on these two reactions are needed to evaluate the yield of H2NC. Due to the small number of atoms involved, it should be feasible to constrain the chemistry behind H2NC and H2CN, just as it has been done for HNC and HCN, as this could allow to use the H2NC/H2CN ratio as a probe of chemical or physical conditions of the host clouds.
Key Words.:
astrochemistry – line: identification – molecular processes – ISM: molecules – radio lines: ISM1 Introduction
High spectral resolution line surveys of molecular clouds are invaluable tools to do molecular spectroscopy in space and to study fundamental chemical processes. Since the discovery of HCO+, first assigned to an unidentified line (Buhl & Snyder, 1970) based on ab initio calculations (Wahlgren et al., 1973) and later on confirmed in the laboratory (Woods et al., 1975), several molecular species have been detected in space prior to their characterization in the laboratory, in most cases aided by state-of-the-art ab initio calculations. Examples of this kind are HCS+ (Thaddeus et al., 1981), C4H (Gúelin et al., 1978), C6H (Suzuki et al., 1986), and C3H+ (Pety et al., 2012), all them confirmed later on in the laboratory, as well as the cases of C5N- (Cernicharo et al., 2008), MgC3N and MgC4H (Cernicharo et al., 2019), and HC5NH+ (Marcelino et al., 2020), which have not been yet observed in the laboratory. If the source displays narrow lines and spectral resolution is high enough, it is possible to resolve the hyperfine structure and derive very precise spectroscopic parameters (e.g., Cernicharo et al. 1987).
Here we present a new case of molecular spectroscopy done in space. Thanks to sensitive high-spectral resolution observations of the cold dark cloud L483 at mm wavelengths we have detected various groups of unidentified lines, revealing a complex hyperfine structure, which we confidently assign to H2NC. This species is the simplest member of the family of aminocarbyne ligands, well known in organometallic chemistry (Pombeiro et al., 2001). It is also a high-energy metastable isomer of the methylene amidogen radical (H2CN), and as such it has been largely ignored in many chemical and astrochemical studies. We however find that in the cold dark clouds L483 and B1-b, H2NC has the same abundance than H2CN itself. These results illustrate nicely how the chemical composition of cold interstellar clouds is driven by chemical kinetics rather than by thermochemical considerations, unlike suggested by Lattelais et al. (2009). We discuss which chemical reactions could be behind the formation of H2NC, something that has been overlooked in the literature.
2 Astronomical observations
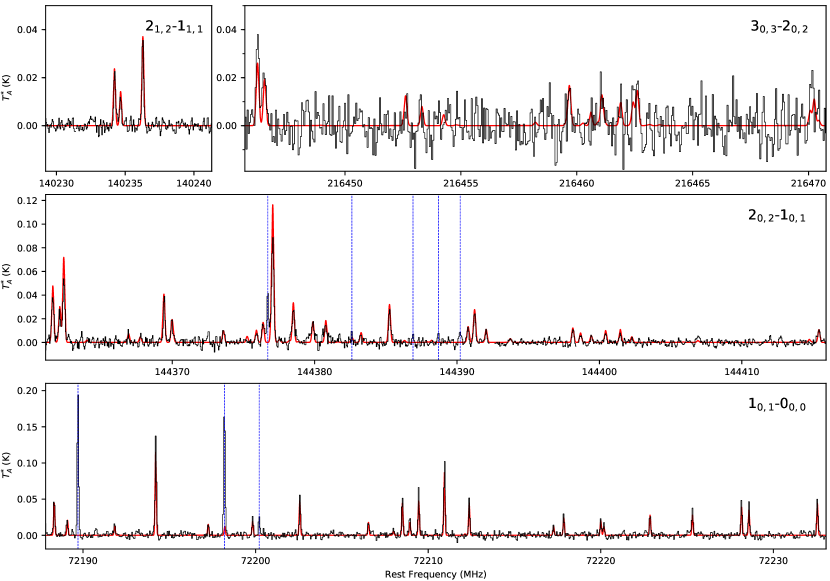
We recently carried out a line survey of the cold dark cloud L483 in the 80-116 GHz frequency range with the IRAM 30m telescope (Agúndez et al., 2019). Additional observations of L483 were carried out in December 2018 to cover the 72-80 GHz range. A group of lines spread over a frequency interval of 45 MHz around 72.2 GHz, close to the hyperfine components of the = 1-0 transition of CCD, caught our attention, as we could not assign them using either the CDMS111https://cdms.astro.uni-koeln.de (Müller et al., 2005), JPL222https://spec.jpl.nasa.gov (Pickett et al., 1998), or MADEX333https://nanocosmos.iff.csic.es/madex (Cernicharo, 2012) catalogues. The spectral pattern is typical of a molecule with a complex fine and hyperfine structure. Since the hyperfine structure usually collapses for increasing rotational quantum number, the large splitting observed suggests that the lines correspond to a rotational transition with a low rotational quantum number. Our first hypothesis was that the set of unidentified lines corresponds to the = 1-0 rotational transition of a linear or quasi-linear species. The rotational constant , or ( + )/2, would then be 36.1 GHz, which implies that the species must contain two heavy atoms (C, N, O) and possibly one or various H atoms. If the lines corresponded to a higher rotational transition, e.g., = 2-1, the immediately higher transition, e.g., = 3-2, would fall below 116 GHz, and we have no hint of it in our sensitive 3 mm data. Moreover, we are confident that the lines do not arise from a heavy isotopologue involving D, 13C, 15N, 17O, or 18O because this would imply to have a similar pattern of lines from the parent species at higher frequencies and significantly more intense (see the case of HDCCN; Cabezas et al. 2021), and there is no feature in our 3 mm consistent with this possibility. The only species that fulfill these criteria, such as HCN, C2H, and N2H+, have the rotational spectrum of their minor isotopologues well characterized in the laboratory.
| peak | ||||||||||||||||
|---|---|---|---|---|---|---|---|---|---|---|---|---|---|---|---|---|
| (MHz) | (MHz) | (km s-1) | (mK) | (mK km s-1) | ||||||||||||
| 1 | 0 | 1 | 1.5 | 1.5 | 2.5 | 0 | 0 | 0 | 0.5 | 0.5 | 1.5 | 72188.328(10) | 0.007 | 0.41(3) | 52 | 22.5(11) |
| 1 | 0 | 1 | 1.5 | 0.5 | 1.5 | 0 | 0 | 0 | 0.5 | 0.5 | 0.5 | 72189.077(10) | 0.024 | 0.45(6) | 21 | 10.1(10) |
| 1 | 0 | 1 | 1.5 | 2.5 | 1.5 | 0 | 0 | 0 | 0.5 | 1.5 | 1.5 | 72191.838(10) | 0.006 | 0.40(12) | 17 | 7.3(15) |
| 1 | 0 | 1 | 1.5 | 2.5 | 3.5 | 0 | 0 | 0 | 0.5 | 1.5 | 2.5 | 72194.219(10) | 0.008 | 0.38(1) | 137 | 56.0(12) |
| 1 | 0 | 1 | 0.5 | 0.5 | 1.5 | 0 | 0 | 0 | 0.5 | 0.5 | 0.5 | 72197.262(10) | 0.005 | 0.20(10) | 26 | 5.6(14) |
| 1 | 0 | 1 | 1.5 | 0.5 | 1.5 | 0 | 0 | 0 | 0.5 | 0.5 | 1.5 | 72199.831(10) | 0.003 | 0.37(4) | 27 | 10.4(10) |
| 1 | 0 | 1 | 1.5 | 2.5 | 1.5 | 0 | 0 | 0 | 0.5 | 1.5 | 0.5 | 72202.571(10) | 0.012 | 0.35(2) | 57 | 21.2(11) |
| 1 | 0 | 1 | 1.5 | 0.5 | 0.5 | 0 | 0 | 0 | 0.5 | 1.5 | 1.5 | 72206.545(10) | 0.006 | 0.46(11) | 17 | 8.5(13) |
| 1 | 0 | 1 | 1.5 | 1.5 | 2.5 | 0 | 0 | 0 | 0.5 | 1.5 | 2.5 | 72208.502(10) | 0.005 | 0.37(3) | 56 | 22.3(10) |
| 1 | 0 | 1 | 1.5 | 1.5 | 0.5 | 0 | 0 | 0 | 0.5 | 1.5 | 0.5 | 72208.937(10) | 0.002 | 0.41(7) | 26 | 11.3(11) |
| 1 | 0 | 1 | 1.5 | 1.5 | 1.5 | 0 | 0 | 0 | 0.5 | 1.5 | 1.5 | 72209.450(10) | 0.004 | 0.35(2) | 66 | 24.7(10) |
| 1 | 0 | 1 | 1.5 | 2.5 | 2.5 | 0 | 0 | 0 | 0.5 | 1.5 | 1.5 | 72210.947(10) | 0.007 | 0.38(1) | 106 | 42.4(12) |
| 1 | 0 | 1 | 0.5 | 1.5 | 2.5 | 0 | 0 | 0 | 0.5 | 0.5 | 1.5 | 72212.383(10) | 0.007 | 0.33(2) | 53 | 18.2(10) |
| 1 | 0 | 1 | 1.5 | 0.5 | 0.5 | 0 | 0 | 0 | 0.5 | 1.5 | 0.5 | 72217.255(10) | 0.010 | 0.35(8) | 14 | 5.3(15) |
| 1 | 0 | 1 | 0.5 | 1.5 | 1.5 | 0 | 0 | 0 | 0.5 | 0.5 | 0.5 | 72217.855(10) | 0.002 | 0.33(4) | 32 | 11.1(10) |
| 1 | 0 | 1 | 1.5 | 0.5 | 1.5 | 0 | 0 | 0 | 0.5 | 1.5 | 2.5 | 72219.996(10) | 0.005 | 0.35(5) | 23 | 8.6(11) |
| 1 | 0 | 1 | 1.5 | 1.5 | 1.5 | 0 | 0 | 0 | 0.5 | 1.5 | 0.5 | 72220.178(10) | 0.003 | 0.36(8) | 18 | 6.8(12) |
| 1 | 0 | 1 | 0.5 | 0.5 | 0.5 | 0 | 0 | 0 | 0.5 | 0.5 | 1.5 | 72222.854(10) | 0.001 | 0.36(4) | 30 | 11.7(10) |
| 1 | 0 | 1 | 0.5 | 1.5 | 0.5 | 0 | 0 | 0 | 0.5 | 0.5 | 0.5 | 72225.310(10) | 0.003 | 0.44(4) | 36 | 17.2(11) |
| 1 | 0 | 1 | 0.5 | 0.5 | 1.5 | 0 | 0 | 0 | 0.5 | 1.5 | 2.5 | 72228.155(10) | 0.001 | 0.36(3) | 50 | 19.1(12) |
| 1 | 0 | 1 | 0.5 | 1.5 | 1.5 | 0 | 0 | 0 | 0.5 | 0.5 | 1.5 | 72228.583(10) | 0.002 | 0.32(3) | 46 | 15.9(9) |
| 1 | 0 | 1 | 0.5 | 1.5 | 2.5 | 0 | 0 | 0 | 0.5 | 1.5 | 2.5 | 72232.548(10) | 0.001 | 0.37(3) | 50 | 19.8(11) |
| 2 | 1 | 2 | 2.5 | 2.5 | 1 | 1 | 1 | 1.5 | 1.5 | 140234.242(10) | 0.024 | 0.35(3) | 22 | 8.2(10) | ||
| 2 | 1 | 2 | 2.5 | 1.5 | 1 | 1 | 1 | 1.5 | 0.5 | 140234.652(10) | 0.015 | 0.36(6) | 12 | 4.5(11) | ||
| 2 | 1 | 2 | 2.5 | 3.5 | 1 | 1 | 1 | 1.5 | 2.5 | 140236.279(10) | 0.002 | 0.31(2) | 37 | 12.3(10) | ||
| 2 | 0 | 2 | 2.5 | 2.5 | 3.5 | 1 | 0 | 1 | 1.5 | 1.5 | 2.5 | 144361.610(10) | 0.004 | 0.38(3) | 38 | 15.6(9) |
| 2 | 0 | 2 | 2.5 | 1.5 | 2.5 | 1 | 0 | 1 | 1.5 | 0.5 | 1.5 | 144362.101(10) | 0.003 | 0.43(8) | 23 | 10.5(10) |
| 2 | 0 | 2 | 2.5 | 3.5 | 4.5 | 1 | 0 | 1 | 1.5 | 2.5 | 3.5 | 144362.392(10) | 0.010 | 0.35(3) | 54 | 19.9(11) |
| 2 | 0 | 2 | 2.5 | 1.5 | 0.5 | 1 | 0 | 1 | 1.5 | 0.5 | 0.5 | 144366.915(10) | 0.020 | 0.15(3) | 11 | 1.8(6) |
| 2 | 0 | 2 | 1.5 | 0.5 | 1.5 | 1 | 0 | 1 | 0.5 | 0.5 | 0.5 | 144367.795(15) | 0.040 | 0.22(7) | 8 | 1.7(5) |
| 2 | 0 | 2 | 2.5 | 3.5 | 2.5 | 1 | 0 | 1 | 1.5 | 2.5 | 1.5 | 144369.440(10) | 0.024 | 0.27(2) | 40 | 11.4(10) |
| 2 | 0 | 2 | 2.5 | 2.5 | 1.5 | 1 | 0 | 1 | 1.5 | 1.5 | 0.5 | 144369.970(10) | 0.014 | 0.35(5) | 18 | 7.0(11) |
| 2 | 0 | 2 | 2.5 | 1.5 | 2.5 | 1 | 0 | 1 | 1.5 | 1.5 | 2.5 | 144373.607(15) | 0.010 | 0.33(5) | 11 | 3.7(8) |
| 2 | 0 | 2 | 2.5 | 2.5 | 3.5 | 1 | 0 | 1 | 1.5 | 2.5 | 3.5 | 144375.925(15) | 0.016 | 0.36(7) | 8 | 3.0(7) |
| 2 | 0 | 2 | 2.5 | 2.5 | 1.5 | 1 | 0 | 1 | 1.5 | 2.5 | 1.5 | } 144376.393(10) | 0.013 | 0.45(4) | 16 | 7.7(11) |
| 2 | 0 | 2 | 1.5 | 1.5 | 2.5 | 1 | 0 | 1 | 0.5 | 1.5 | 2.5 | |||||
| 2 | 0 | 2 | 2.5 | 3.5 | 3.5 | 1 | 0 | 1 | 1.5 | 2.5 | 2.5 | } 144377.058(10) | 0.008 | 0.39(1) | 85 | 35.8(13) |
| 2 | 0 | 2 | 1.5 | 2.5 | 3.5 | 1 | 0 | 1 | 0.5 | 1.5 | 2.5 | |||||
| 2 | 0 | 2 | 2.5 | 2.5 | 2.5 | 1 | 0 | 1 | 1.5 | 1.5 | 1.5 | 144378.508(10) | 0.004 | 0.56(6) | 24 | 14.4(10) |
| 2 | 0 | 2 | 2.5 | 1.5 | 1.5 | 1 | 0 | 1 | 1.5 | 0.5 | 0.5 | 144379.862(15) | 0.020 | 0.46(10) | 17 | 8.2(10) |
| 2 | 0 | 2 | 1.5 | 1.5 | 2.5 | 1 | 0 | 1 | 0.5 | 0.5 | 1.5 | 144380.762(15) | 0.022 | 0.40(8) | 14 | 6.1(9) |
| 2 | 0 | 2 | 1.5 | 1.5 | 1.5 | 1 | 0 | 1 | 0.5 | 0.5 | 0.5 | 144383.214(20) | 0.049 | 0.29(9) | 7 | 2.1(8) |
| 2 | 0 | 2 | 1.5 | 2.5 | 2.5 | 1 | 0 | 1 | 0.5 | 1.5 | 1.5 | 144385.268(10) | 0.010 | 0.34(3) | 26 | 9.5(9) |
| 2 | 0 | 2 | 1.5 | 0.5 | 1.5 | 1 | 0 | 1 | 1.5 | 0.5 | 1.5 | 144390.759(10) | 0.022 | 0.31(5) | 13 | 4.2(9) |
| 2 | 0 | 2 | 1.5 | 2.5 | 1.5 | 1 | 0 | 1 | 0.5 | 1.5 | 0.5 | } 144391.233(10) | 0.002 | 0.36(3) | 25 | 9.6(11) |
| 2 | 0 | 2 | 1.5 | 0.5 | 0.5 | 1 | 0 | 1 | 0.5 | 0.5 | 1.5 | |||||
| 2 | 0 | 2 | 1.5 | 1.5 | 0.5 | 1 | 0 | 1 | 0.5 | 0.5 | 0.5 | 144392.039(10) | 0.005 | 0.28(6) | 10 | 3.2(8) |
| 2 | 0 | 2 | 1.5 | 1.5 | 1.5 | 1 | 0 | 1 | 0.5 | 0.5 | 1.5 | 144398.146(10) | 0.014 | 0.31(3) | 12 | 3.8(7) |
| 2 | 0 | 2 | 1.5 | 2.5 | 1.5 | 1 | 0 | 1 | 0.5 | 1.5 | 1.5 | 144398.681(20) | 0.007 | 0.38(7) | 6 | 2.5(6) |
| 2 | 0 | 2 | 1.5 | 0.5 | 0.5 | 1 | 0 | 1 | 1.5 | 0.5 | 1.5 | 144399.434(15) | 0.006 | 0.20(10) | 7 | 1.4(4) |
| 2 | 0 | 2 | 1.5 | 1.5 | 2.5 | 1 | 0 | 1 | 1.5 | 1.5 | 2.5 | 144400.428(15) | 0.005 | 0.32(6) | 8 | 2.7(6) |
| 2 | 0 | 2 | 1.5 | 2.5 | 2.5 | 1 | 0 | 1 | 0.5 | 1.5 | 2.5 | 144401.458(15) | 0.008 | 0.32(7) | 7 | 2.5(5) |
| 2 | 0 | 2 | 1.5 | 2.5 | 3.5 | 1 | 0 | 1 | 1.5 | 2.5 | 3.5 | 144415.423(10) | 0.008 | 0.37(6) | 11 | 4.2(6) |
| 3 | 0 | 3 | 3.5 | 3.5 | 4.5 | 2 | 0 | 2 | 2.5 | 2.5 | 3.5 | }216446.230(15) | 0.003 | 0.20(3) | 40 | 8.3(7) |
| 3 | 0 | 3 | 3.5 | 2.5 | 3.5 | 2 | 0 | 2 | 2.5 | 1.5 | 2.5 | |||||
| 3 | 0 | 3 | 3.5 | 4.5 | 5.5 | 2 | 0 | 2 | 2.5 | 3.5 | 4.5 | 216446.512(15) | 0.021 | 0.27(5) | 22 | 6.4(8) |
| 3 | 0 | 3 | 3.5 | 4.5 | 4.5 | 2 | 0 | 2 | 2.5 | 3.5 | 3.5 | 216459.686(20) | 0.010 | 0.16(6) | 18 | 3.0(6) |
| 3 | 0 | 3 | 3.5 | 2.5 | 2.5 | 2 | 0 | 2 | 2.5 | 1.5 | 1.5 | 216462.452(20) | 0.018 | 0.14(4) | 19 | 2.9(6) |
| 3 | 0 | 3 | 2.5 | 3.5 | 4.5 | 2 | 0 | 2 | 1.5 | 2.5 | 3.5 | 216462.639(20) | 0.028 | 0.15(6) | 21 | 3.4(7) |
| 3 | 0 | 3 | 2.5 | 2.5 | 2.5 | 2 | 0 | 2 | 1.5 | 1.5 | 1.5 | }216470.144(20) | 0.037 | 0.22(5) | 22 | 5.8(2) |
| 3 | 0 | 3 | 2.5 | 3.5 | 3.5 | 2 | 0 | 2 | 1.5 | 2.5 | 2.5 |
Numbers in parentheses are 1 uncertainties in units of the last digits. Line parameters were derived from a Gaussian fit to the line profile. Observed frequencies are derived adopting = 5.30 km s-1 (Agúndez et al., 2019). Errors in the observed frequencies are estimated from the Gaussian fit and range between 10 kHz, for the lines detected with high signal-to-noise ratios, and 20 kHz, for the weakest lines. is the observed minus calculated frequency, where the calculated frequency comes from the fit described in Sect. 3. is the full width at half maximum.
In order to confirm our hypothesis we requested IRAM 30m telescope time to search for the two immediately higher transitions. Observations were carried out in June 2019 and we detected unidentified lines at the expected positions of the = 2-1 and = 3-2 transitions, 144 GHz and 216 GHz, respectively, thus confirming our initial hypothesis. Moreover, we also detected unidentified lines around 140 GHz, which were later on assigned to the para species of H2NC. These observations, and the ones performed before, were done using the frequency-switching technique with a frequency throw of 7.2 MHz. To be sure that no line is missing due to the potential cancellation with negative artifacts, at 7.2 MHz of each line, caused by this procedure, we carried out new observations around 72.2 GHz, 140 GHz, 144 GHz, and 216 GHz in November 2019, June 2020, and February and April 2021, using the wobbler-switching technique, with the secondary mirror nutating by 220′′ at a rate of 0.5 Hz. All observations were done using the EMIR receivers connected to a fast Fourier transform spectrometer providing a spectral resolution of 50 kHz (Klein et al., 2012). Line intensities are expressed in terms of the antenna temperature, , which can be converted to main beam brightness temperature, , by dividing by /. IRAM 30m beam efficiencies, forward efficiencies, and half power beam widths are given on the IRAM website444http://www.iram.es/IRAMES/mainWiki/Iram30mEfficiencies. Further details on the IRAM 30m observations of L483 can be found in Agúndez et al. (2019) and Agúndez et al. (2021). The observed lines are shown in Fig. 1 and the frequencies and line parameters derived are given in Table 1.
We note that the frequencies of some of the hyperfine components of the = 1-0 transition of CCD observed in L483 differ significantly from those given in the CDMS catalogue (Müller et al., 2005). This was already noticed by Yoshida et al. (2019) in their observations of L1527. We therefore used the new frequencies to improve the spectroscopic parameters of CCD (see Appendix A).
We also make use of observations of the cold dark clouds B1-b and TMC-1, and of the = 0.89 galaxy in front of the quasar PKS 1830211. The observations of B1-b and TMC-1 were carried out with the IRAM 30m telescope in the 72-74 GHz range in August 2018 and are part of a 3 mm line survey of these two sources (see Cernicharo et al. 2012 for more details), while those of PKS 1830211 were done using the Yebes 40m telescope in the Q band in a monitoring campaign of this source from April 2019 to July 2020 (see Tercero et al. 2020 for more details). Here we added data taken during 8 observing sessions from October 2019 to the data presented in Tercero et al. (2020). All data were reduced using the program CLASS of the GILDAS software555http://www.iram.fr/IRAMFR/GILDAS.
3 Spectroscopic assignment to H2NC
Potential carriers of the unidentified lines observed in L483 are N2Hx, CNHx, COHx, NOHx, C2Hx, and O2Hx, either neutral or ionic. To obtain precise spectroscopic parameters that help in the assignment of the observed lines, we carried out high-level ab initio calculations for all plausible candidates. The geometry optimization calculations for all the candidates considered were done using the spin-restricted coupled cluster method with single, double, and perturbative triple excitations (RCCSD(T); Raghavachari et al. 1989), with all electrons (valence and core) correlated and the Dunning’s correlation consistent basis sets with polarized core-valence correlation quadruple- (cc-pCVQZ; Woon & Dunning 1995). These calculations were carried out using the Molpro 2020.2 program (Werner et al., 2020). In addition to the rotational constants, we calculated other parameters necessary to interpret the rotational spectrum. At the optimized geometries of each species we calculated the fine and hyperfine constants. They are the three spin-rotation coupling constants (, , and ), the magnetic hyperfine constants for the non zero nuclear spin nuclei (, , and ), and the nuclear electric quadrupole constants for the nitrogen nucleus ( and ), if the molecule contains any. The spin-rotation coupling constants were calculated using the second order Møller-Plesset perturbation (MP2; Møller & Plesset 1934) with the aug-cc-pVQZ basis set. On the other hand, the other hyperfine constants were calculated at the quadratic configuration interaction with single and double excitations (QCISD; Pople et al. 1987) level of calculation with the aug-cc-pVQZ basis set. Harmonic frequencies were computed at UCCSD/aug-cc-pVQZ level of theory (Čížek, 1969) to estimate the centrifugal distortion constants. These calculations were done using the Gaussian16 program (Frisch et al., 2016). Table 2 summarizes the results of these calculations.
Given the observed splitting of 45 MHz, it is very unlikely that the carrier is a closed-shell species. Even if the molecule has two N nuclei, the hyperfine splitting would be of a few MHz and the number of lines would be smaller than the observed ones. Hence, the carrier should be an open-shell species containing at least two nuclei with a non zero nuclear spin, so that rotational transitions have fine and hyperfine structure. Taking this into account, closed-shell species such as -HNNH, H2NN, H2CN-, H2NC+, H2NO+, -HNOH+, and -HNOH+ are discarded. The value of (+)/2 derived from astronomical observations is 36.1 GHz, and thus the rotational constants calculated for NNH, HCN+, HCN-, H2CN+, -HCNH+, -HCNH+, and H2NC+ clearly exclude them as carriers. In the cases of NNH-, H2NN+, -HCNH, and -HCNH, the calculated (+)/2 are closer to the astronomical value, although the differences are larger than 2.5 %. These four candidates can be discarded because the level of calculation used provides errors not larger than 1 %. In addition, their predicted splitting does not agree with the observed one. For NNH-, H2NN+, and -HCNH, the hyperfine components of the 10,1-00,0 transition span over 100-200 MHz, while for -HCNH, the splitting is very small, around 10 MHz. At this point, only three species show a (+)/2 value compatible with the observed one, 36.1 GHz. H2NC has the closest (+)/2 value, while -HCOH+ and -HCOH+ have values a bit larger, but also compatible taking into account the accuracy of the calculations. However, -HCOH+ and -HCOH+ have only two nuclei with non zero nuclear spin, and thus, the number of hyperfine components and their splitting pattern cannot explain all the unidentified lines observed in L483. In contrast, H2NC has three nuclei with non zero nuclear spin and its predicted splitting is consistent with the observed one. To obtain accurate spectroscopic parameters for our best candidate, H2NC, we scaled the calculated values using experimental/theoretical ratios derived for the isoelectronic species H2CN, for which experimental rotational parameters are known (Yamamoto & Saito, 1992). This procedure has been found to provide rotational constants with an accuracy better than 0.1 % (e.g., Cabezas et al. 2021). The theoretical rotational constants , , and obtained by this way are given in Table 3. It is seen that the calculated (+)/2, 36.092 GHz, is very similar to the observed value, which prompted us to consider H2NC as the starting point in our data analysis.
| Species | (+)/2 | G.S. | Species | (+)/2 | G.S. |
|---|---|---|---|---|---|
| NNH | 44.968 | H2CN+ | 31.626 | ||
| NNH- | 37.605 | H2CN- | 35.117 | ||
| -HNNH | 36.763 | -HCNH+ | 34.271 | ||
| H2NN | 36.558 | -HCNH+ | 33.004 | ||
| H2NN+ | 37.971 | H2NC+ | 38.369 | ||
| HCN+ | 40.073 a | -HCOH+ | 36.654 | ||
| HCN- | 44.432 a | -HCOH+ | 36.534 | ||
| -HCNH | 37.125 | H2NO+ | 36.815 | ||
| -HCNH | 37.330 | -HNOH+ | 35.312 | ||
| H2NC | 36.214 | -HNOH+ | 35.591 |
The observed frequencies (see Table 1) were analyzed with the SPFIT program (Pickett, 1991) using an appropriate Hamiltonian for an asymmetric top with a doublet electronic state () and C2v symmetry. The employed Hamiltonian has the following form:
| (1) |
where Hrot contains rotational and centrifugal distortion parameters, is the spin-rotation term, represents the magnetic hyperfine coupling interaction term due to the N and H nuclei, and represent the nuclear electric quadrupole interaction due to the N nucleus. The coupling scheme used is J = N + S, F1 = J + I1, and F = F1 + I2, where I1 = I(N) and I2 = I(H1) + I(H2). H2NC has two equivalent H nuclei and it is thus necessary to discern between and species. The levels are described by + even while the levels by + odd. The hyperfine interaction term Hmhf is thus written explicitly as a two spin system:
| (2) |
where and T(N) stand for the Fermi contact constant and the dipole-dipole interaction tensor for the N nucleus, respectively, and and T are averages of the coupling constants for the two H nuclei. There is a term proportional to the difference of the coupling constants for the dipole-dipole interaction. However, the term connects levels only off–diagonal in , and thus it can be ignored, treating the two H nuclei as if they are equivalent. In this manner, each energy level is denoted by six quantum numbers: , , , , , and .
The results obtained from the fit are shown in Table 3. We experimentally determined the values for a total of thirteen molecular parameters, considering the two equivalent H nuclei. These parameters are the rotational constants and , the centrifugal distortion constant , the electron spin-rotation coupling constants and , the magnetic hyperfine constants for the nitrogen and hydrogen nuclei and , and the nuclear electric quadrupole constant for the nitrogen nucleus . Other constants were kept fixed to the theoretical values calculated in this work. The standard deviation of the fit is 15.2 kHz.
| Parameter | Astronomical (L483) fit a | Theoretical b |
|---|---|---|
| 339669.82 | 339669.82 | |
| 38085.559(74) | 38102.01 | |
| 34124.301(74) | 34082.34 | |
| 0.13463(16) | 0.101 | |
| 2.367 | 2.367 | |
| 26.907 | 26.907 | |
| 0.012 | 0.012 | |
| 1.758 | 1.758 | |
| 2319.573 | 2319.573 | |
| 1.88(59) | 9.221 | |
| 57.17(58) | 54.056 | |
| (N) | 22.8656(59) | 21.248 |
| (N) | 3.417(14) | 3.464 |
| (N) | 0.581 | 0.581 |
| (N) | 0.2125(83) | 0.212 |
| (N) | 1.594 | 1.594 |
| 169.90(23) | 170.360 | |
| 9.345(13) | 8.648 | |
| 2.675 | 2.675 | |
| 3.83 c |
a Numbers in parentheses are 1 uncertainties in units of the last digits. Parameters without uncertainties were fixed to the theoretical values. b The values of the rotational constants , , and were corrected using the experimental and theoretical constants of H2CN. c Calculated at the RCCSD(T)/cc-pCVQZ level of theory, in units of Debye.
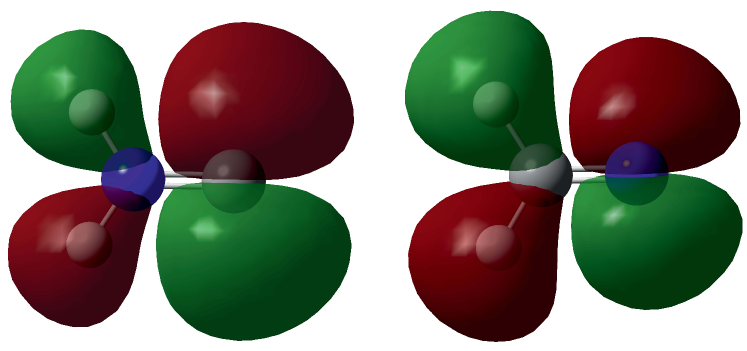
The results in Table 3 show an excellent agreement between the theoretical and astronomical values of the rotational constants and . The relative errors are 0.01 % and 0.06 % for and , respectively. These errors are slightly larger if we compare with the unscaled theoretical values of and , 0.04 % and 0.58 %, respectively. The rotational constants provide information on the mass distribution of the molecular species and, thus, the good accordance between observed and calculated values could serve by itself to identify the spectral carrier. Moreover, the high resolution of our survey allows us to completely scrutinize the fine and hyperfine structure of the rotational transitions. This structure depends strongly on the electronic environment of the molecular species, which is related to the number of nuclei with a non zero nuclear spin and their relative positions. Hence, the fine and hyperfine coupling constants determined are ideal fingerprints of the spectral carrier, providing key information for its identification. The results from our fit indicate that our carrier must have two equivalent hydrogen nuclei and one nitrogen nucleus, whose and constants are in very good agreement with those predicted for H2NC. The and values for the two H nuclei are comparable to those of H2CN, 233.152 MHz and 8.294 MHz, respectively (Yamamoto & Saito, 1992), which is reasonable since their electronic environment is almost similar in both molecules. However, the and for the N nucleus are very different in H2NC and H2CN. First, the values for H2NC and H2CN are 3.413 MHz and 45.143 MHz, respectively, which indicates that the spin density on the N nucleus is much smaller in H2NC. Secondly, the Fermi constants have opposite signs, 22.8660 MHz for H2NC and 25.916 MHz for H2CN. This is explained by the different mechanisms for spin polarization due to the unpaired electron on both systems. Figure 2 shows the molecular orbital of the unpaired electron in the two species. In the case of H2NC, the orbital has a node at the location of the N atom, while for H2CN the N atom is completely covered by this orbital. The rest of parameters determined from our fit, , , and , agree reasonably well with the values calculated theoretically for H2NC. However, it should be mentioned that the accuracy of the prediction of the constants , , and is usually much smaller than for the rotational or hyperfine constants. In the light of all these arguments we definitively conclude that the carrier of the unidentified lines observed in L483 is H2NC.
4 Discussion
4.1 The H2NC/H2CN ratio in the interstellar medium
We computed synthetic spectra assuming local thermodynamic equilibrium to derive the column density of H2NC in L483. The relative intensities of the various rotational transitions observed constrain the rotational temperature to a low value, 4.0 0.2 K, which is consistent with a highly polar carrier like H2NC. The calculated dipole moment of H2NC is 3.83 D (see Table 3). As full width at half maximum we adopt the average of the observed values, 0.19 km s-1 for the 30,3-20,2 lines and 0.35 km s-1 for the rest (see Table 1). We derive a beam-averaged column density of (1.0 0.2) 1012 cm-2 for H2NC in L483 (see synthetic spectrum in Fig. 1). The ortho-to-para ratio is fully consistent with the statistical value of three.
H2NC is the highest energy member of the isomeric family composed of H2CN, -HCNH, -HCNH, and H2NC. Our calculations predict that H2CN is the most stable isomer, with -HCNH and -HCNH lying above by 7.9 kcal mol-1 and 12.8 kcal mol-1, respectively, while H2NC lies 29.9 kcal mol-1 higher in energy with respect to H2CN. These results are in agreement with those reported by Puzzarini (2010).
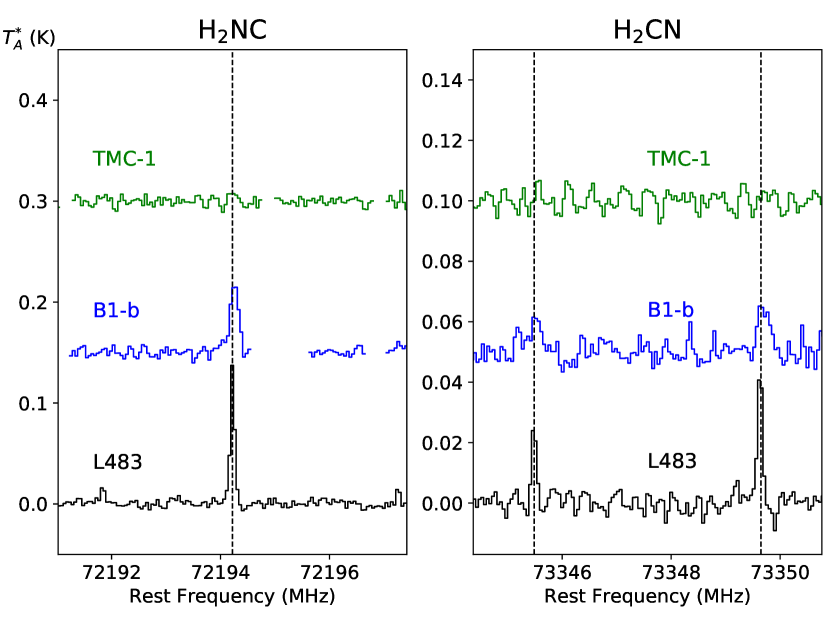
A further argument in support of the assignment to H2NC comes from astronomical observations, which indicate that the carrier is related to H2CN. This radical is also observed in L483 (see Agúndez et al. 2019 and Fig. 3). From the observed intensities of the 10,1-00,0 and 20,2-10,1 lines of H2CN in L483 we derive a rotational temperature of 4 K and a column density of (8 2) 1011 cm-2. This value is somewhat lower than that given by Agúndez et al. (2019) because at that time line strengths were incorrectly computed downward by a factor of three and now we also include the 20,2-10,1 transition. The H2NC/H2CN abundance ratio in L483 is thus 1.25 0.30. Our carrier, H2NC, is also observed in B1-b, where H2CN is detected as well. In B1-b we derive (H2NC) = (1.0 0.2) 1012 cm-2 and (H2CN) =(1.0 0.2) 1012 cm-2, which results in a H2NC/H2CN abundance ratio of 1.0 0.3, similar to the value found in L483. Moreover, in the well known cold dark cloud TMC-1, which harbors a rich variety of molecules, neither H2NC nor H2CN are detected in our data. We derive 3 upper limits to their column densities of 3.2 1011 cm-2 and 4.8 1011 cm-2, respectively. Ohishi et al. (1994) reported the discovery of H2CN in TMC-1. Although the column density derived by these authors, 1.5 1011 cm-2, is consistent with our 3 upper limit, the identification of Ohishi et al. (1994) is questionable because the two lines detected are only marginally seen above their noise level and they should result in antenna temperatures above 20 mK at IRAM 30m, which is not consistent with our data (see Fig. 3). Therefore, both our carrier and H2CN are seen in L483 and B1-b with a similar abundance ratio, while none of them are seen in TMC-1. This fact strengthens the idea that our carrier is related to H2CN.
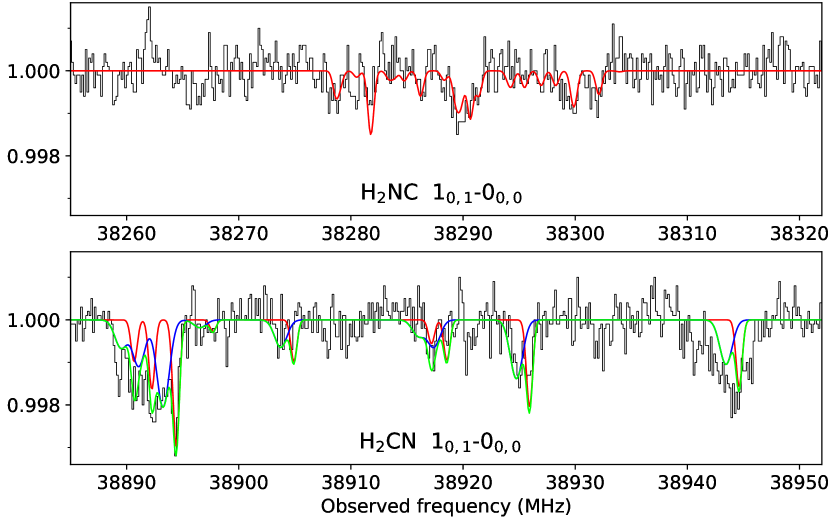
The fact that the strongest hyperfine component of H2NC is 3-4 times more intense that the strongest one of H2CN in L483 and B1-b suggests that H2NC could be easily found in those sources where H2CN is detected. H2CN has been reported toward L1544 (Vastel et al., 2019) and the = 0.89 galaxy in front of the quasar PKS 1830211 (Tercero et al., 2020). We examined our Yebes 40m data of PKS 1830211 and we find significant absorption at the position of the strongest hyperfine components of H2NC 10,1-00,0 (see Fig. 4). We computed synthetic spectra for H2NC and H2CN (red curves in Fig. 4) assuming the same physical parameters of the source reported by Tercero et al. (2020). We derive a H2NC/H2CN abundance ratio of 0.27 0.08. The new data added to the PKS 1830211 spectrum allow us to clearly distinguish an additional component for H2CN (blue curve; see Tercero et al. 2020. The fact that the H2NC/H2CN ratio is significantly lower than the values found in L483 and B1-b points to a chemical differentiation between this high-redshift galaxy and galactic cold interstellar clouds. In fact, the chemical composition in this lensing galaxy is more characteristic of diffuse or translucent clouds rather than of cold dense clouds, as indicated by the presence of ions such as C3H+ (Tercero et al., 2020). The case of H2NC and H2CN isomers reminds that of HNC and HCN. The HNC/HCN abundance ratio is 1 in cold dense clouds (Hirota et al., 1998; Sarrasin et al., 2010) and 1 in diffuse clouds (Liszt & Lucas, 2001). In the gravitational lens of PKS 1830211 the abundance ratio HNC/HCN is 0.4 (Muller et al., 2006), in line with expectations if the source has a diffuse cloud character. Thus, similarly to the case of HNC and HCN, it is likely that in general cold dense clouds show H2NC/H2CN ratios around one and diffuse clouds H2NC/H2CN ratios below one. The presence of H2NC is therefore a further example of how chemical kinetics, rather than thermodynamics, regulate the chemical composition of interstellar clouds.
4.2 The chemistry of H2NC and H2CN
The isomer H2NC is missing in chemical kinetics databases used in astrochemistry, such as UMIST (McElroy et al., 2013) or KIDA (Wakelam et al., 2015). However, the more stable isomer H2CN is included and it is thus interesting to look at its main formation reactions. To this purpose, we run a pseudo time-dependent gas-phase chemical model with typical parameters of cold dark clouds (see, e.g., Agúndez & Wakelam 2013). We used the chemical network RATE12 from the UMIST database (McElroy et al., 2013), with updates relevant for the chemistry of H2CN from Loison et al. (2015) and Hickson et al. (2015). According to our calculations, H2CN is formed with a peak abundance relative to H2 of 10-10. The main formation reactions are C + NH3, N + CH3, and N + CH2CN, while it is mainly destroyed through reactions with neutral H, C, N, and O atoms. Taking into account that H2NC and H2CN are observed with similar abundances in L483 and B1-b, it is likely that both isomers share a common formation route.
The reaction between N and CH3 has been studied experimentally and theoretically. Experimental studies in the temperature range 200-423 K reveal a rate coefficient around 10-10 cm3 s-1, with a positive temperature dependence, and a branching ratio of 0.9 for production of H atoms (Marston et al., 1989a, b). Computational studies point to H2CN + H as main channel (Cimas & Largo, 2006; Alves et al., 2008). The study of Alves et al. (2008) does not consider H2NC as product, but that of Cimas & Largo (2006) considers H2NC and -HCNH. Cimas & Largo (2006) show how the reactants N and CH3 approach through an attractive potential surface leading to an intermediate, H3CN, whose formation does not involve any barrier. This intermediate has two different possibilities for its further evolution. In the first place, elimination of a hydrogen atom would lead to H2CN + H, the most exothermic channel. This process involves a transition state which lies well below the reactants. A second possibility is isomerization into H2CNH, through hydrogen migration from carbon to nitrogen, which proceeds through a transition state also located well below the reactants. H2CNH may lead to -HCNH + H involving a lower barrier and a further isomerization into HCNH2 would produce the H2NC + H channel as final product. Although the three isomers, H2CN, -HCNH and H2NC can be formed without barrier (all the transition states are submerged below the reactants), elimination of a hydrogen atom from the initially formed intermediate, H3CN, leading to H2CN + H is the preferred reaction path. Cimas & Largo (2006) state that residual quantities of -HCNH can be formed, whereas for H2NC the branching ratio is negligible.
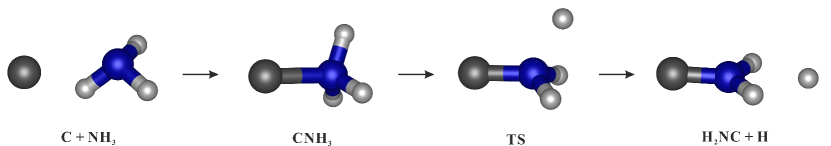
The reaction C + NH3 has been studied more recently, and it has been found that it is rapid at 50 K, with a rate coefficient of 1.8 10-10 cm3 s-1 (Hickson et al., 2015). In a related study, Bourgalais et al. (2015) combined photoionization and LIF experiments supported by theoretical calculations and showed that the H2CN + H channel represents 100% of the product yield for this reaction. These authors rule out that -HCNH or -HCNH are formed, but do not discuss whether H2NC can be produced. The theoretical calculations reported by Bourgalais et al. (2015) show that the first step is the formation of a reaction intermediate, CNH3, in a process without any barrier. As in the case of the H3CN intermediate in the N + CH3 reaction discussed above, CNH3 can proceed through two different pathways. The first one, the elimination of a hydrogen atom, would lead to H2NC + H, through a transition state which lies below the reactants. This reaction path is illustrated in Fig. 5. On the other hand, the isomerization of the CNH3 intermediate through hydrogen migration from nitrogen to carbon can lead to HCNH2. This isomerization proceeds through a transition state also located below the reactants. HCNH2 can further evolve to form H2NC + H or -HNCH. A second hydrogen migration from nitrogen to carbon in HCNH2 produces H2CNH, which ultimately leads H2CN + H, that is the most exothermic channel. Although H2NC + H is not the most exothermic product channel, it could be the most favored channel if we consider the elimination of a hydrogen atom from CNH3 as the preferred reaction path, in analogy to the N + CH3 results of Cimas & Largo (2006).
Another fact that reinforces the previous statement is that the identification of H2CN as main product in the C + NH3 reaction by Bourgalais et al. (2015) is based exclusively in the agreement between their measured photoionization spectrum and that measured and attributed to H2CN by Nesbitt et al. (1991). However, as discussed by Holzmeier et al. (2013), the ionization energy measured by Nesbitt et al. (1991) is derived from an ion yield curve and it is therefore afflicted with a rather large uncertainty. In fact, Holzmeier et al. (2013) measured an excitation energy of 12.32 eV for H2CN, very different from the value derived by Nesbitt et al. (1991), 10.8 eV. This can be attributed to the fact that the method used by Nesbitt et al. (1991) contains less information than the threshold photoelectron spectra of Holzmeier et al. (2013), which precluded Nesbitt et al. (1991) from distinguishing between isomers. Since the experimental methods employed by Bourgalais et al. (2015) and Nesbitt et al. (1991) are quite similar, it is reasonable to think that both have the same limitations. Hence, if H2NC is formed in the experiment of Bourgalais et al. (2015), it could have escaped detection with their experimental setup.
The reaction between N and CH2CN was considered by Loison et al. (2015) to yield H2CN with a moderately high rate coefficient by analogy to the reaction N + CH3. However, no dedicated studies have been carried out on this particular reaction and thus it is uncertain whether H2CN or any of its metastable isomers are formed. Other plausible routes to H2CN and H2NC are the reactions between radicals NH + CH2 and NH2 + CH, although they are probably less efficient than N + CH3 and C + NH3 because the reactants are expected to have lower abundances. Formation routes involving ions are also possible, in particular those leading to the various possible isomers HxCNH3-x+ ( = 0-3), which upon dissociative recombination with electrons can form H2CN and H2NC. A plausible such route could involve the reaction NH + C, although its rate coefficient and products are not known.
In summary, the two isomers H2CN and H2NC can be produced in a barrierless process in the reactions N + CH3 and C + NH3, with H2NC being a more likely product of the latter reaction. In the light of our results, it would be interesting to revisit these two reactions and evaluate the yields of the different isomers H2CN, - and -HCNH, and H2NC. Other routes are also possible, although theoretical or experimental information is missing.
5 Conclusions
We observed various sets of unidentified lines in the cold dark cloud L483, which we confidently assign to H2NC, a high-energy metastable isomer of H2CN. The astronomical lines are used to precisely characterize the rotational spectrum of H2NC. Both H2NC and H2CN are detected, in addition to L483, in the cold dark cloud B1-b and the high redshift lensing galaxy in front of the quasar PKS 1830211. Neither H2NC nor H2CN are detected in the dark cloud TMC-1, which puts in question a previous claim of detection of H2CN in this source. We derive H2NC/H2CN abundance ratios 1 in the cold dense clouds L483 and B1-b and 0.27 in the high redshift galaxy. It is suggested that the H2NC/H2CN ratio behaves as the HNC/HCN ratio, with values around one in cold dense clouds and below one in diffuse and translucent media. The most obvious formation routes to H2CN and H2NC are the reactions N + CH3 and C + NH3. The latter is particularly favorable for production of H2NC. Further studies on these reactions, able to constrain the yield of each isomer, should allow to reach a good understanding of the chemistry behind H2NC and H2CN. This could open the door to use the H2NC/H2CN ratio as a proxy of chemical or physical parameters of interstellar clouds.
Acknowledgements.
We acknowledge funding support from Spanish Ministerio de Ciencia e Innovación through grants AYA2016-75066-C2-1-P, PID2019-106110GB-I00, and PID2019-107115GB-C21, and from the European Research Council (ERC Grant 610256: NANOCOSMOS). M.A. also acknowledges funding support from the Ramón y Cajal programme of Spanish Ministerio de Ciencia e Innovación (grant RyC-2014-16277). We thank Prof. Ingo Fischer for his comments on the photoionization spectrum of the methylene amidogen radical.References
- Agúndez & Wakelam (2013) Agúndez, M. & Wakelam, V. 2013, Chem. Rev., 113, 8710
- Agúndez et al. (2019) Agúndez, M., Marcelino, N., Cernicharo, J. et al. 2019, A&A, 625, A147
- Agúndez et al. (2021) Agúndez, M., Roueff, E., Cabezas, C., et al. 2021, A&A, 649, A171
- Alves et al. (2008) Alves, T. V., de Oliveira Filho, A. G. S., & Ornellas, F. R. 2008, Chem. Phys. Lett., 457, 36
- Bogey et al. (1985) Bogey, M., Demuynck, C., & Destombes, J. L., 1985, A&A, 144, L15
- Bourgalais et al. (2015) Bourgalais, J., Capron, M., Kailasanathan, R. K. A., et al. 2015, ApJ, 812, 106
- Buhl & Snyder (1970) Buhl, D. & Snyder, L. E. 1970, Nature, 228, 267
- Cabezas et al. (2021) Cabezas, C., Endo, Y., Roueff, E., et al. 2021, A&A, 646, L1
- Cernicharo (2012) Cernicharo, J. 2012, in European Conference on Laboratory Astrophysics, eds. C. Stehlé, C. Joblin, & L. d’Hendecourt, EAS Publication Series, 58, 251
- Cernicharo et al. (1987) Cernicharo, J., Guélin, M., & Walmsley, C. M. 1987, A&A, 172, L5
- Cernicharo et al. (2008) Cernicharo, J., Guélin, M., Agúndez, M., et al. 2008, ApJ, 688, L83
- Cernicharo et al. (2012) Cernicharo, J., Marcelino, N., Roueff, E., et al. 2012, ApJ, 759, L43
- Cernicharo et al. (2019) Cernicharo, J., Cabezas, C., Pardo, J. R., et al. 2019, A&A, 630, L2
- Cimas & Largo (2006) Cimas, A. & Largo, A. 2006, J. Phys. Chem. A, 110, 10912
- Čížek (1969) Čížek, J. 1969, Adv. Chem. Phys., 14, 35
- Frisch et al. (2016) Frisch, M. J., Trucks, G. W., Schlegel, H. B., et al. 2016, Gaussian 16 Revision A.03
- Gúelin et al. (1978) Guélin, M., Green, S., & Thaddeus, P. 1978, ApJ, 224, L27
- Hickson et al. (2015) Hickson, K. M., Loison, J.-C., Bourgalais, J., et al. 2015, ApJ, 812, 107
- Hirota et al. (1998) Hirota, T., Yamamoto, S., Mikami, H., & Ohishi, M. 1998, ApJ, 503, 717
- Holzmeier et al. (2013) Holzmeier, F., Lang, M., Hader, K., et al. 2013, J. Chem. Phys., 138, 214310
- Klein et al. (2012) Klein, B., Hochgürtel, S., Krämer, I., et al. 2012, A&A, 542, L3
- Lattelais et al. (2009) Lattelais, M., Pauzat, F., Ellinger, Y., & Ceccarelli, C. 2009, ApJ, 696, L133
- Liszt & Lucas (2001) Liszt, H. & Lucas, R. 2001, A&A, 370, 576
- Loison et al. (2015) Loison, J. C., Hébrard, E., Dobrijevic, M., et al. 2015, Icarus, 247, 218
- Marcelino et al. (2020) Marcelino, N., Agúndez, M., Tercero, B., et al. 2020, A&A, 643, L6
- Marston et al. (1989a) Marston, G., Nesbitt, F. L., Nava, D. F., et al. 1989a, J. Phys. Chem., 93, 5769
- Marston et al. (1989b) Marston, G., Nesbitt, F. L., & Stief, L. J. 1989b, J. Chem. Phys., 91, 3483
- McElroy et al. (2013) McElroy, D., Walsh, C., Markwick, A. J., et al. 2013, A&A, 550, A36
- Møller & Plesset (1934) Møller, C., & Plesset, M. S. 1934, Phys. Rev., 46, 618
- Muller et al. (2006) Muller, S., Guélin, M., Dumke, M., et al. 2006, A&A, 458, 417
- Müller et al. (2005) Müller, H. S. P., Schlöder, F., Stutzki, J., & Winnewisser, G. 2005, J. Mol. Struct., 742, 215
- Nesbitt et al. (1991) Nesbitt, F. L., Marston, G., Stief, L. J., et al. 1991, J. Phys. Chem., 95, 7613
- Ohishi et al. (1994) Ohishi, M., McGonagle, D., Irvine, W. M., et al. 1994, ApJ, 427, L51
- Pety et al. (2012) Pety, J., Gratier, P., Guzmán, V., et al. 2012, A&A, 548, A68
- Pickett (1991) Pickett, H. M. 1991, J. Mol. Spectr., 148, 371
- Pickett et al. (1998) Pickett, H. M., Poynter, R. L., Cohen, E. A., et al. 1998, J. Quant. Spectr. Rad. Transfer, 60, 883
- Pombeiro et al. (2001) Pombeiro, A. J. L., Fátima, M., & Guedes da Silva, C. 2001, J. Organomet. Chem., 617, 65
- Pople et al. (1987) Pople, J. A., Head-Gordon, M., & Raghavachari, K. 1987, J. Chem. Phys., 87, 5968
- Puzzarini (2010) Puzzarini, C. 2010, Int. J. Quantum Chem., 110, 2483
- Raghavachari et al. (1989) Raghavachari, K., Trucks, G. W., Pople, J. A., Head-Gordon, M., 1989, Chem. Phys. Lett., 157, 479
- Sarrasin et al. (2010) Sarrasin, E., Ben Abdallah, D., Wernli, M., et al. 2010, MNRAS, 404, 518
- Suzuki et al. (1986) Suzuki, H., Ohishi, M., Kaifu, N., et al. 1986, PASJ, 38, 911
- Tercero et al. (2020) Tercero, B., Cernicharo, J., Cuadrado, S., et al. 2020, A&A, 636, L7
- Thaddeus et al. (1981) Thaddeus, P., Guélin, M., & Linke, R. A. 1981, ApJ, 246, L41
- Vastel et al. (2019) Vastel, C., Loison, J.-C., Wakelam, V., & Lefloch, B. 2019, A&A, 625, A91
- Vrtilek et al. (1985) Vrtilek, J. M., Gottlieb, C. A., Langer, W. D., et al., 1985, ApJ, 296, L35
- Wahlgren et al. (1973) Wahlgren, U., Liu, B., Pearson, P. K., & Schaefer, H. F. 1973, Nature Phys. Sci., 246, 4
- Wakelam et al. (2015) Wakelam, V., Loison, J.-C., Herbst, E., et al. 2015, ApJS, 217, 20
- Werner et al. (2020) Werner, H.-J., Knowles, P. J., Knizia, G., et al., 2020, MOLPRO, version 2020.2
- Woods et al. (1975) Woods, R. C., Dixon, T. A., Saykally, R. J., & Szanto, P. G. 1975, Phys. Rev. Lett., 35, 1269
- Woon & Dunning (1995) Woon, D. E., & Dunning, T. H., Jr., 1995, J. Chem. Phys., 103, 4572
- Yamamoto & Saito (1992) Yamamoto, S. & Saito, S. 1992, J. Chem. Phys., 96, 4157
- Yoshida et al. (2019) Yoshida, K., Sakai, N., Nishimura, Y., et al. 2019, PASJ, 71, S18
Appendix A New frequencies and spectroscopic parameters for CCD
Yoshida et al. (2019) pointed out that the frequencies of some of the hyperfine components of the = 1-0 transition of CCD, as observed in L1527, are significantly different from those reported in the CDMS catalogue (Müller et al., 2005). The predictions from the CDMS catalogue are based in the experimental data reported by Bogey et al. (1985) and Vrtilek et al. (1985), who observed the = 2-1, 3-2, 4-3, and 5-4 transitions, but only one hyperfine component of the = 1-0 transition. Yoshida et al. (2019) reported observed frequencies in L1527 for seven hyperfine components of the = 1-0 transition, with discrepancies with respect to the CDMS ones of up to 224 kHz. The inaccuracy of the = 1-0 frequencies reported in the CDMS catalogue is due to the fact that they are calculated based on the laboratory measurements of higher transitions with a limited spectral resolution, which makes it difficult to discern between close hyperfine components.
In the analysis of our IRAM 30m data of L483 we also noticed that the observed frequencies of the hyperfine components of the = 1-0 and 2-1 transitions of CCD differ from those reported in the CDMS catalogue. In order to provide more accurate predictions of the rotational spectrum of CCD we carried out a fit in which we only include the astronomical frequencies for the = 1-0 and 2-1 transitions and another fit in which we also include the laboratory frequencies for the = 3-2, 4-3, and 5-4 transitions. The spectroscopic parameters resulting from our fits are given in Table 4, where they are compared with the original values reported by Bogey et al. (1985) and Vrtilek et al. (1985). The frequencies used in the fits are given in Table 5.
The spectroscopic parameters derived in our two fits are very similar. The main difference is found in the distortion constant , which is affected by the inclusion of higher transitions when moving from the astronomical fit to the astronomical + laboratory fit. There is a notable change in the new value of derived in our fits compared to those derived by Bogey et al. (1985) and Vrtilek et al. (1985), while the value of obtained in our combined fit agrees with those reported by Bogey et al. (1985) and Vrtilek et al. (1985). The new value for is determined more accurately and also agrees with those reported before. The larger differences are found for the hyperfine constants and , whose previous values also differ between the two laboratory studies. The high resolution of our measurements is reflected in a higher accuracy determination for these hyperfine constants. The nuclear quadrupole coupling constant is also determined more precisely than before, but the previous values agree with the new one. We recommend the spectroscopic parameters derived in our combined, astronomical + laboratory, fit to predict the rotational spectrum of CCD.
| Parameter | Astronomical | Astronomical + Laboratory | Vrtilek et al. (1985) | Bogey et al. (1985) |
|---|---|---|---|---|
| 36068.01625(297) | 36068.02145(153) | 36068.035(14) | 36068.0310(96) | |
| 0.06709(40) | 0.067892(126) | 0.0687(7) | 0.06764(40) | |
| 55.8334(34) | 55.8349(32) | 55.84(3) | 55.880(46) | |
| (D) | 6.9918(51) | 6.9912(49) | 6.35(7) | 7.159(85) |
| (D) | 1.8893(133) | 1.8898(127) | 1.59(26) | 0.712(73) a |
| (D) | 0.2145(142) | 0.2166(134) | 0.21(9) | 0.23(11) |
| rms(kHz) | 14.99 | 31.61 | – | – |
a The parameter is denoted as in Bogey et al. (1985).
| Ref. | ||||||||
|---|---|---|---|---|---|---|---|---|
| 1 | 2 | 1 | 0 | 1 | 2 | 72098.573 0.010 | 0.009 | (1) |
| 1 | 2 | 2 | 0 | 1 | 2 | 72101.780 0.015 | 0.025 | (2) |
| 1 | 2 | 3 | 0 | 1 | 2 | 72107.716 0.010 | 0.001 | (1) |
| 1 | 2 | 1 | 0 | 1 | 1 | 72109.017 0.015 | 0.033 | (2) |
| 1 | 2 | 2 | 0 | 1 | 1 | 72112.290 0.010 | 0.002 | (1) |
| 1 | 1 | 2 | 0 | 1 | 2 | 72187.707 0.010 | 0.008 | (1) |
| 1 | 1 | 1 | 0 | 1 | 2 | 72189.711 0.010 | 0.014 | (1) |
| 1 | 1 | 2 | 0 | 1 | 1 | 72198.190 0.010 | 0.011 | (1) |
| 1 | 1 | 1 | 0 | 1 | 1 | 72200.208 0.010 | 0.004 | (1) |
| 2 | 3 | 3 | 1 | 2 | 3 | 144237.146 0.010 | 0.001 | (1) |
| 2 | 3 | 2 | 1 | 2 | 2 | 144239.737 0.010 | 0.003 | (1) |
| 2 | 3 | 4 | 1 | 2 | 3 | 144241.937 0.010 | 0.000 | (1) |
| 2 | 3 | 2 | 1 | 2 | 1 | 144243.028 0.020 | 0.052 | (1) |
| 2 | 3 | 3 | 1 | 2 | 2 | 144243.028 0.020 | 0.027 | (1) |
| 2 | 2 | 3 | 1 | 1 | 2 | 144296.719 0.010 | 0.007 | (1) |
| 2 | 2 | 2 | 1 | 1 | 1 | 144297.544 0.010 | 0.008 | (1) |
| 2 | 2 | 1 | 1 | 1 | 1 | 144299.042 0.010 | 0.014 | (1) |
| 2 | 2 | 2 | 1 | 1 | 2 | 144299.548 0.010 | 0.002 | (1) |
| 2 | 2 | 1 | 1 | 1 | 2 | 144301.017 0.020 | 0.020 | (1) |
| 2 | 2 | 3 | 1 | 2 | 3 | 144376.713 0.010 | 0.003 | (1) |
| 2 | 2 | 3 | 1 | 2 | 2 | 144382.614 0.010 | 0.007 | (1) |
| 2 | 2 | 1 | 1 | 2 | 2 | 144386.909 0.020 | 0.038 | (1) |
| 2 | 2 | 2 | 1 | 2 | 1 | 144388.688 0.010 | 0.009 | (1) |
| 2 | 2 | 1 | 1 | 2 | 1 | 144390.221 0.010 | 0.031 | (1) |
| 3 | 4 | 4 | 2 | 3 | 4 | 216368.560 0.050 | 0.020 | (3) |
| 3 | 4 | 3 | 2 | 3 | 3 | 216369.990 0.070 | 0.010 | (3) |
| 3 | 4 | 5 | 2 | 3 | 4 | 216372.830 0.020 | 0.016 | (3) |
| 3 | 4 | 3 | 2 | 3 | 2 | 216373.320 0.020 | 0.003 | (3) |
| 3 | 4 | 4 | 2 | 3 | 3 | 216373.320 0.020 | 0.012 | (3) |
| 3 | 3 | 4 | 2 | 2 | 3 | 216428.320 0.020 | 0.092 | (3) |
| 3 | 3 | 3 | 2 | 2 | 2 | 216428.320 0.020 | 0.086 | (3) |
| 3 | 3 | 2 | 2 | 2 | 1 | 216428.760 0.040 | 0.090 | (3) |
| 3 | 3 | 2 | 2 | 2 | 2 | 216430.340 0.060 | 0.002 | (3) |
| 3 | 3 | 3 | 2 | 2 | 3 | 216431.260 0.050 | 0.020 | (3) |
| 4 | 5 | 6 | 3 | 4 | 5 | 288499.000 0.050 | 0.147 | (4) |
| 4 | 5 | 5 | 3 | 4 | 4 | 288499.000 0.050 | 0.123 | (4) |
| 4 | 5 | 4 | 3 | 4 | 3 | 288499.000 0.050 | 0.126 | (4) |
| 4 | 4 | 5 | 3 | 3 | 4 | 288554.590 0.050 | 0.151 | (4) |
| 4 | 4 | 4 | 3 | 3 | 3 | 288554.590 0.050 | 0.075 | (4) |
| 4 | 4 | 3 | 3 | 3 | 2 | 288554.590 0.050 | 0.177 | (4) |
| 5 | 6 | 7 | 4 | 5 | 6 | 360618.340 0.150 | 0.003 | (4) |
| 5 | 6 | 6 | 4 | 5 | 5 | 360618.340 0.150 | 0.168 | (4) |
| 5 | 6 | 5 | 4 | 5 | 4 | 360618.340 0.150 | 0.173 | (4) |
| 5 | 5 | 6 | 4 | 4 | 5 | 360674.170 0.150 | 0.155 | (4) |
| 5 | 5 | 5 | 4 | 4 | 4 | 360674.170 0.150 | 0.114 | (4) |
| 5 | 5 | 4 | 4 | 4 | 3 | 360674.170 0.150 | 0.048 | (4) |
References: (1) Frequencies derived in this work from Gaussian fits to the lines observed in L483, adopting = 5.30 km s-1 (Agúndez et al., 2019). (2) These two lines are affected by a negative frequency-switching artifact in our L483 data and thus frequencies are taken from the L1527 data of Yoshida et al. (2019). (3) Laboratory data of Vrtilek et al. (1985). (4) Laboratory data of Bogey et al. (1985).