Predictable Bandwidth Slicing with Open vSwitch
Abstract
Software switching, a.k.a virtual switching, plays a vital role in network virtualization and network function virtualization, enhances configurability, and reduces deployment and operational costs. Software switching also facilitates the development of edge and fog computing networks by allowing the use of commodity hardware for both data processing and packet switching. Despite these benefits, characterizing and ensuring deterministic performance with software switches is harder, compared to physical switching appliances. In particular, achieving deterministic performance is essential to adopt software switching in mission-critical applications, especially those deployed in edge and fog computing architectures. In this paper, we study the impact of switch configurations on bandwidth slicing and predictable packet latency. We demonstrate that latency and predictability are dependent on the implementation of the bandwidth slicing mechanism and that the packet schedulers used in OVS Kernel-Path and OVS-DPDK each focus on different aspects of switching performance.
Index Terms:
Software Switching, Deterministic Performance, Latency Prediction, Edge Computing, Fog ComputingI Introduction
With the arrival of new paradigms such as edge and fog computing, the necessity for comprehensive understanding of network behavior becomes increasingly important as tasks often have a multitude of requirements that depend on network performance guarantees, such as minimum flow bandwidth or packet latency constraints. Some requirements are easy to fulfill. For example, it is straightforward to track the available processing and memory resources of edge and fog nodes. However, the prediction of network parameters such as end-to-end packet latency is dependent on a variety of factors and requires a comprehensive understanding of network configuration and topology [1, 2]. An essential step towards this understanding is the characterization of packet switching behaviors.
In this paper, we focus on software switching considering its high applicability in edge and fog computing scenarios [3]. For example, software switches are utilized to build multi-function nodes in edge and fog systems, where each node performs both networking and computation tasks. Specifically, with commodity hardware that is capable of computation, software switches are used to add switching capability to a network, resulting in lower costs for deployment, maintenance, and upgrades. Software switches also offer greater configuration flexibility, making them more suitable for edge and fog networks which need to handle highly-dynamic workloads. In contrast, traditional hardware switches, even when enabled with Software Defined Networking (SDN) protocols such as OpenFlow and NETCONF, are limited in their ability to accomplish effective bandwidth slicing because of queue limitations. While hardware switches are usually limited to eight queues per port, software switches do not impose this limitation [4]. Furthermore, the size of software switches’ flow tables is flexible and can be extended in ways that hardware switches’ can not. Software switches open up the possibility of efficient bandwidth isolation for each task’s data flows and simplify the process of developing and applying new network policies [3, 5].
Although one of the main benefits of software switches when compared to traditional hardware switches is the high degree of flexibility offered, there remains areas of study that have largely been neglected in existing analyses. Specifically, existing studies overwhelmingly focus on the switches’ maximum throughput capabilities [6, 7, 8] or latency measurements in best-case, non-realistic scenarios [9, 1, 10, 11, 12, 2, 13]. These studies are important to understand the performance limitations of software switches, but they provide very little to characterize performance in real-world scenarios. In particular, these studies fail to provide relevant analysis of packet latency in edge and fog networking scenarios where the bandwidth is sliced to provide queue rate guarantees.
In this work, we fill the gap in existing literature by studying how the various aspects of bandwidth slicing such as packet scheduling and queue rate affect latency. We study and evaluate bandwidth slicing using OVS-Kernel Path (OVS-KP) and OVS-DPDK and identify their strengths and weaknesses in terms of latency and resource efficiency. In addition to characterizing the latency patterns in bandwidth slicing scenarios, we also identify and analyze the underlying causes of these latency patterns. We observe that although the packet latency of OVS-DPDK is considerably lower than that of OVS-KP, the latency of OVS-KP is stable and predictable using M/M/1 queuing. This is because OVS-KP is able to efficiently utilize the available queue buffers. OVS-DPDK achieves its lower latency by minimizing the time spent by the packets in the packet scheduler queue; however, this comes at the cost of inefficient resource utilization. To keep the queue length short, it drops all packets that are in excess of the allocated queue rate, which results in high TCP retransmsission rates and the need for excess ingress bandwidth in order to maintain the target throughput. The observations of this paper can be leveraged to employ software switching in various scenarios, such as for building edge and fog computing systems that need to handle the diverse latency and throughput requirements of IoT applications.
The rest of this paper is organized as follows. We present the related work in Section II. In Section III, we overview the two software switches used in this work. In Section IV, we discuss the importance and extraction of effective queue rate. In Section V, we show that the latency of OVS-KP is predictable using the M/M/1 queueing model. We discuss the latency of software switching with a user-space data plane in Section VI. In Section VII, we discuss the resource efficiency tradeoffs between different variants of the Open vSwitch. In Section VIII, we present discussions on the current and future applicability of this work, highlight its significance, and conclude the paper.
II Related Work
Existing works on the performance evaluation of software switches are either limited in scope and ignore latency as a performance parameter, or present an evaluation of oversimplified use-cases that are not representative of real-world network configurations.
Fang et al. [6] evaluate a broad spectrum of the available software switching solutions and present a direct comparison of the maximum throughput values of each of the evaluated switches. Their evaluation of software switches remains surface-level as they focus on the intricacies of inter-switch comparability, leaving much to be desired in terms of performance analysis. McGuinness et al. [7] focus on performance evaluations of the BESS software switch in the context of high throughput datacenter use-cases. Although they evaluate the throughput accuracy of the rate limiter, its effect on latency has been neglected. Furthermore, datacenters cannot be compared to edge and fog networking scenarios, as the two types of networks have different hardware and applications. Meyer et al. [8] present a model for software switch performance, but limit the scope of their model to only include throughput measurements. Overall, these studies evaluate the performance of software switches primarily in terms of throughput and neglect to include any measurements of latency.
In [9], Zhang et al. perform evaluations across various state-of-the-art software switching solutions. They analyze performance of the OVS-DPDK, snabb, BESS, FastClick, VPP, and netmap VALE software switches and present comparisons of their maximum throughput and packet latency. Despite the breadth of comparisons, their performance analysis is narrow and only encompasses the most basic of configurations and measurements. Emmerich et al. [1] present an in-depth performance evaluation of Open vSwitch (OVS). However, their work primarily focuses on throughput, and the analysis of latency is for very simple scenarios that are insufficient to model edge and fog networking use-cases. They evaluate latency only as a function of flow throughput and ignore the performance impacts of bandwidth slicing in multi-queue scenarios. He et al. [14] evaluate a software switch bandwidth slicing mechanism; however, their tests were performed in simple scenarios and their results are presented without a thorough analysis of the latency values. The same shortcoming is exhibited in [10, 11, 12, 13] in terms of latency evaluation: their models of packet latency are for simple, synthetic testing scenarios. The latency of a single flow has been evaluated in [10, 11, 12], while [13] only evaluates the latency of a single packet. These scenarios are rudimentary and cannot be used to accurately generate models of bandwidth-sliced software switch behaviors.
III Methodology and Background
III-A Testbed Setup
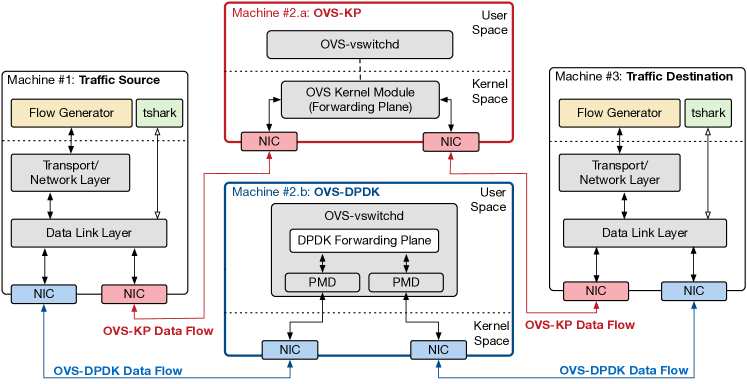
Figure 1 presents the testbed architecture. To measure the latency of OVS packet switching, we ran experiments on a testbed consisting of three machines: a traffic source, a software switch, and a traffic destination. We used Intel 82580 1GbE and Intel X550T 10GbE NICs. The traffic source sends UDP and TCP traffic to the traffic destination through the OVS. For the UDP flows with fixed bandwidth, we used iPerf, which supports specification of UDP flow bandwidth. In the tests, we modified the number of queues, the allocated throughput of each queue, and the type of data flows in each queue. We will further discuss the details of each test in their relevant sections.
Packets are captured using tshark at the egress and ingress ports of the traffic source and traffic destination, respectively. To ensure the synchronization of timestamp values, the traffic source and traffic destination are two VMs running on a single machine, and the clocks of these two VMs are synchronized with that of the hypervisor. This configuration allows us to accurately measure and analyze latency values.
III-B Open vSwitch
Open vSwitch (OVS) [15, 16, 17] is an open source, production quality software switch that is compatible with various hypervisors and container systems. OVS is highly programmable and is configured using the OpenFlow and OVSDB protocols [18]. We consider the two main variants of OVS: (i) OVS Kernel-Path (OVS-KP), which implements its data path via a kernel module, and (ii) OVS with the Data Plane Development Kit (OVS-DPDK), which implements its data path through Poll Mode Drivers (PMDs) in the user-space. We use OVS 2.15.0 and DPDK 20.11.1.
We perform bandwidth slicing on the switches by using their packet schedulers. The packet schedulers that we utilize are configured to shape flows via minimum guaranteed rate and/or maximum limited rate parameters. When combined with flow rules that direct packets to the queues, data flows are shaped to specific minimum and maximum rates.
For OVS-KP, we use the Hierarchical Token Bucket (HTB) packet scheduler since it is widely used and available in the Linux traffic control module. HTB is a classful queuing discipline that supports hierarchical traffic shaping. Its rate control mechanisms are implemented with the token bucket filter algorithm, and its hierarchical token borrowing system allows parent classes to share tokens with their child classes. This token sharing system allows each child class to enforce a guaranteed minimum rate, while also sharing excess available bandwidth with their sibling classes.
OVS-DPDK uses a different packet scheduler based on the Two-Rate, Three Color Marker (TRTCM) algorithm. Similar to HTB, TRTCM also uses a token bucket for rate control and provides traffic shaping abilities such as guaranteed minimum and maximum queue rates.
Although HTB and TRTCM are very similar on the surface, their rate control mechanisms are significantly different, which results in different latency and throughput behaviors for queues with the same allocated rate. HTB is a hierarchical implementation of the token bucket filter algorithm, meaning that when a packet arrives at the head of the queue and there are no tokens available, the packet waits in the queue until tokens become available, at which time the packet is dequeued and sent to the NIC. On the other hand, for OVS-DPDK, when a packet arrives at the head of the queue, the TRTCM token buckets are checked for tokens, and if there are not enough tokens for the packet, the packet is dropped. Most significantly, this difference in behavior results in different dequeue rates from the queues; as we will discuss in Sections IV and VI, the dequeue rate impacts flow latency and throughput.
IV Extracting Effective Queue Rate
In a switching system, a packet experiences three types of latency: transmission latency, processing latency, and queueing latency. Transmission latency is directly related to NIC’s transmission rate and can be easily calculated. Processing latency is caused by various factors, including copying a packet to and from different queues, looking up a packet’s forwarding decision in the tables, or waiting for hardware I/O operations. Since hardware switches are solely dedicated to one function, packet processing delay in a hardware switch is consistently low. On the other hand, the processing delay of software switches is usually higher and with greater statistical variation. Choice of packet scheduler also affects processing delay. Software switches sacrifice processing latency in exchange for greater flexibility. Last, and the focus of this section, is queueing latency (), which is defined as the time spent by a packet in the switch’s queue, waiting to be transmitted. This latency depends on the queue rate, flow rate, and packet scheduler.
In every software switch, each packet must traverse three queues: the ingress NIC queue, the egress NIC queue, and the packet scheduler’s queue. In this system, throughput is limited by the lowest-rate queue, which is usually the user-allocated packet scheduler queue. As a result, a packet spends the most time waiting in the packet scheduler queue because queueing latency experienced by a packet increases exponentially as the queue input rate approaches the queue service rate. We show that this queueing latency follows an M/M/1 queue trend and that with enough knowledge of the system, the latency can be predicted when using OVS-KP.
IV-A Observing Packet Scheduler Behavior
An important factor in predicting packet latency through any queueing system is the queue’s dequeue behavior. In our case, we need to understand how the packet schedulers dequeue traffic from their rate-limited queues. Although rate-limited queues are allocated with bits/s or bytes/s values, the packet scheduler is not actually dequeueing in such small increments. The dequeue behavior varies, depending on how the packet scheduler is implemented, and even different packet schedulers with similar queue parameters behave differently. This often-overlooked variable causes packets to experience different queueing latency values, even if the allocated queue rates are identical.
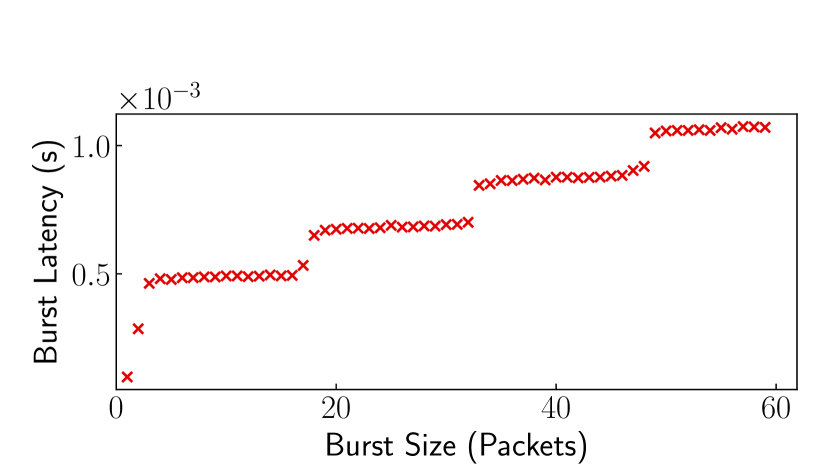
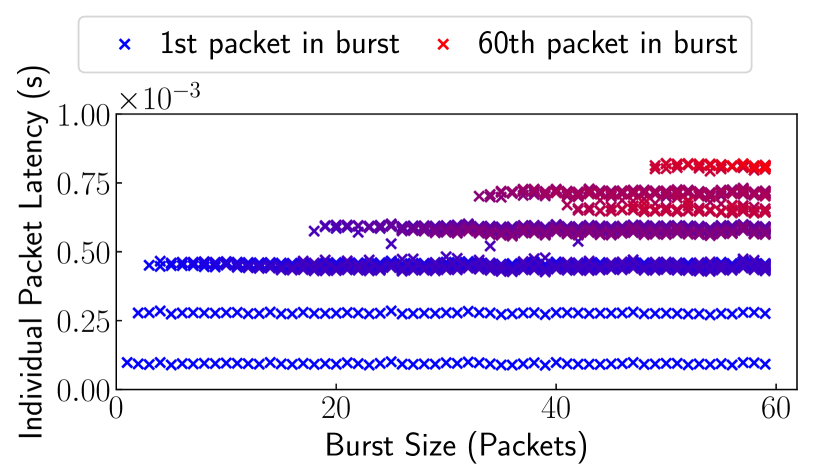
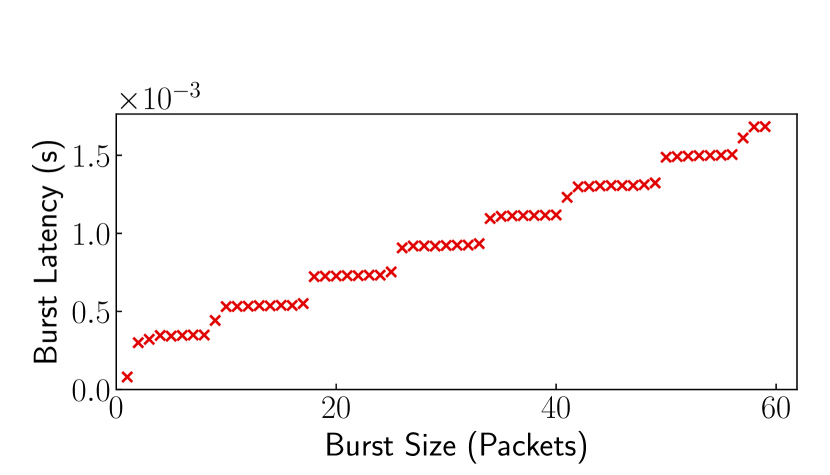
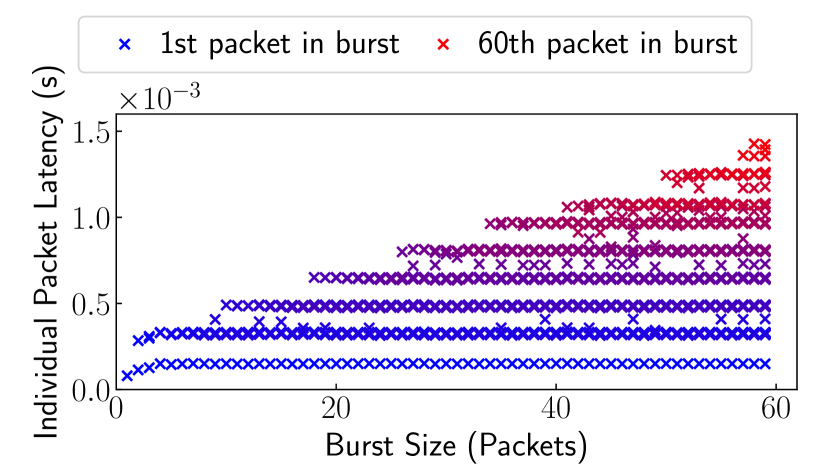
In these experiments, we generate UDP flows with various packet burst sizes, then we track the individual packet latencies and the latency of each burst as a whole. Figure 2 presents the results. As Figures 2(a) and 2(c) demonstrate, when we increase the number of packets in each burst, the latency of the whole burst increases in a stepped pattern. This indicates that both HTB and TRTCM dequeue packets from their queues in bursts of packets, instead of one at a time. To further support this, the analysis of individual packet latencies in Figures 2(b) and 2(d) show that the latencies of each packet in the bursts are grouped in segments of about 16 and 8 packets each, although there exist small variation in grouping sizes for each dequeue segment. Figure 2(b) and 2(d) also highlight that the grouping pattern holds true for bursts of all sizes: no matter how big the burst, packets are always dequeued in fixed size groups. Using this information, we extrapolate that the effective rate of HTB queues must be calculated in units of 16 packets, and the effective rate of TRTCM queues must be calculated in units of 8 packets.
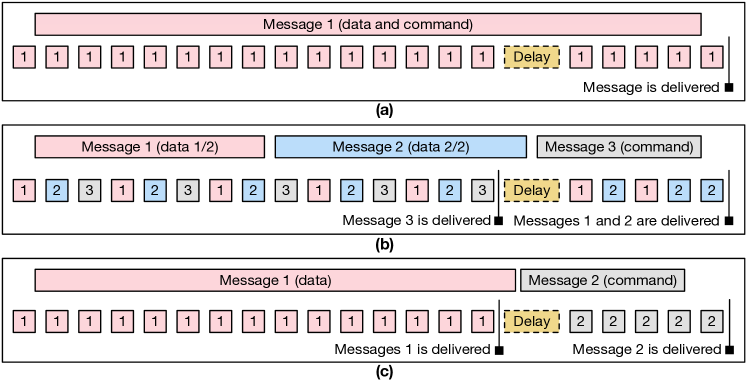
These observations can be leveraged to enhance communication determinism and performance in various contexts. For example, this knowledge of burst latency behaviors provides devices with the ability to send messages that take advantage of the fact that the latency of a 5-packet message is equal to that of a 15-packet message. For example, assume an IoT edge device needs to send data and command to a server. In the first scenario, data and command are sent as a single message, which is segmented into 20 packets, as Figure 3a shows. This results in the delivery of data and command at once. In the second scenario, two messages are generated for data and one message for command. Assume the first message is segmented into 7 packets, the second into 8 packets, and the third into 5 packets. Once these messages are received by the transport layer of the device, the packets are sent in an interleaved manner. As it can be observed in Figure 3b, the command message is delivered first, which cannot be used because the data messages have not been received yet. In the third scenario we rely on the behavior of software switches and generate two messages: one for data, which is transmitted first, and one for command, transmitted second. As Figure 3c shows, once the data is received by the server, it can start processing the data, and when the command arrives, the server can perform the action immediately. Therefore, the third solution provides the minimum latency and better utilization of resources. A similar method can be used regarding controller-switch communication in SDNs. To ensure timely delivery and execution of commands, the controller can manage the ordering of sent packets based on the command type and size.
V Delay Prediction of OVS-KP Bandwidth Slicing
We confirm that the queuing latency of OVS-KP switching follows an M/M/1 trend. We set up an experiment to measure the relationship between the latency of packets in a TCP flow and the queue rate. We generate and route a TCP flow through a rate-limited queue in the switch. We do not set any flow rate at the traffic source because the TCP flow rate naturally increases until it detects packet loss caused by the rate-limiter in the software switch.
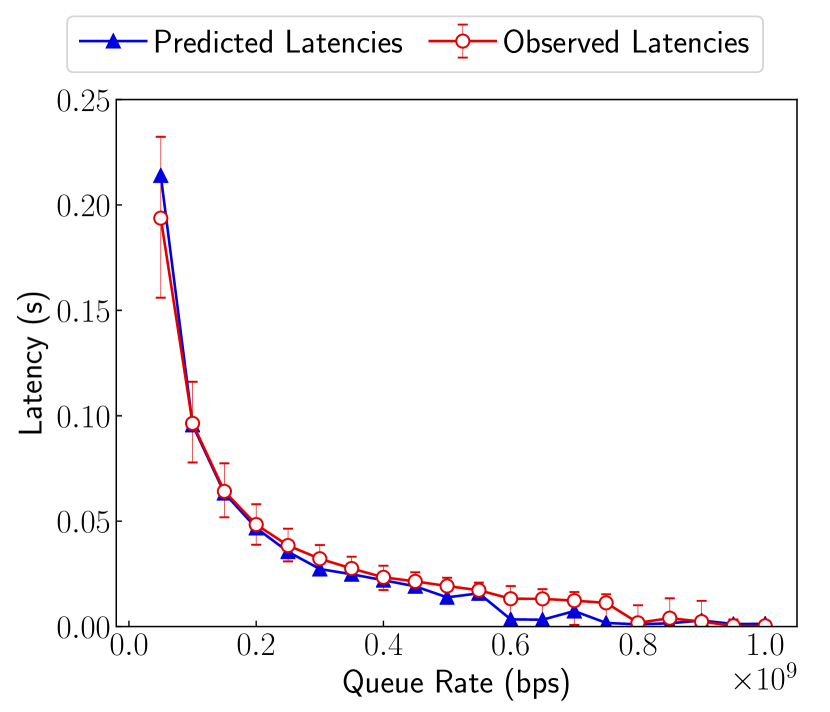

We present the results in Figure 4. This figure demonstrates that (i) queue rates are the determining factor for rate-limited TCP packet latencies, and (ii) the pattern of observed latencies align with the latency values that one would expect when modeling each queue as an M/M/1 queue. The results for 1GbE (Figure 4(a)) and 10GbE (Figure 4(b)) NICs are presented side-by-side to show that NIC line-rate is not a significant factor in this experiment.
It is important to note that when calculating the expected latency, the queue rate must be represented via the amount of data that is dequeued in one instance, i.e., the effective queue rate. In Section IV-A, we showed that HTB dequeues 16 packets at a time. Thus, instead of calculating expected latency using the queue’s bit-rate value, we calculate the expected latency using queue rate in units of 16 packets. This is where knowledge of average packet size is important, as we now combine average packet size, queue bit rate, and packet scheduler dequeue behavior to generate effective queue rate values. We calculate the expected latency via: (1) where is the effective queue rate, and is the queue utilization ratio [19]. We include the latency predictions in Figure 4 for comparison against the observed values. The relationship between queue rate and observed latency is what is expected from an M/M/1 queueing system. In Figure 4, we validate that predictions based off of observed throughput () and packet scheduler knowledge () are accurate. We generate values for by comparing the observed throughput at the traffic source’s egress port and the allocated queue rates. The observed throughput is extracted from the wireshark captures at the traffic source’s egress port. is calculated by converting the units of each queue rate from bits per second to packet groupings per second. Given that small variations as low as 0.5% in queue utilization ratio significantly affect latency prediction, the results confirm that this latency prediction methodology is valid and accurate.
We showed that for bandwidth-sliced flows, queueing latency is the most significant portion of end-to-end latency and that it overshadows transmission latencies; transmission latency on a 1GbE link for a single packet is on the order of microseconds, while the observed switching latencies are up to four orders of magnitude greater. Current task allocation schemes either ignore latency as a task request parameter, or assume that network latencies consist only of trivially calculated transmission latencies. In contrast, our method allows the prediction of communication latency, which can be leveraged to address the requirements of various tasks in edge and fog computing systems. As another example of leveraging this method, a SDN controller can accurately enforce bandwidth slicing schemes that satisfy the expected communication latency between edge devices and switches. Also, to configure switches with latency bounds, the controller can enforce bandwidth slicing methods along all the controller-switch paths.
VI OVS-DPDK Bandwidth Slicing
In this section, we focus on OVS-DPDK and the effect of the TRTCM packet scheduler on packet latency, in comparison to OVS-KP’s HTB.
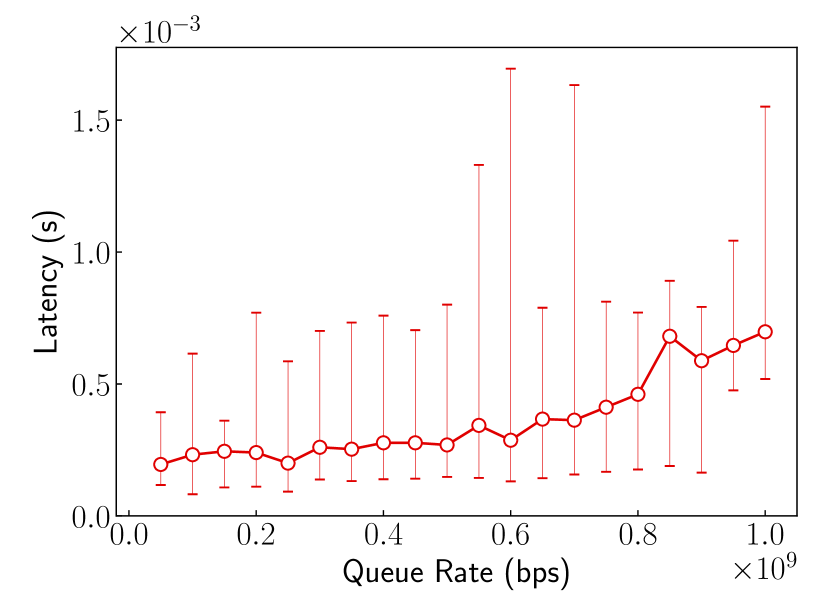
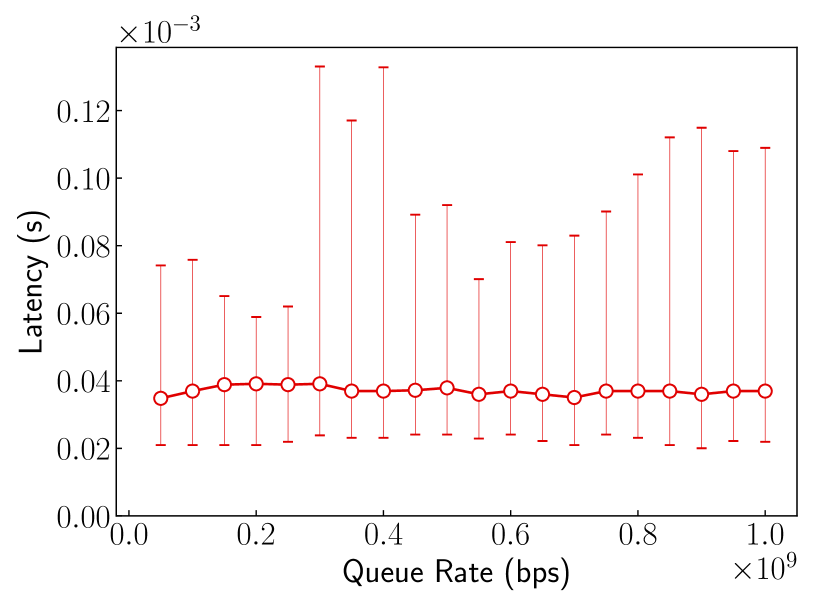
For a direct comparison between the two variants of OVS, this time we use OVS-DPDK and run an experiment similar to that of Section V. We present the results in Figure 5. The results show that the latency behaviors are not similar at all to that of Figure 4. OVS-DPDK queues that are rate-limited with TRTCM cannot be modeled as an M/M/1 queueing system because the queues are not being dequeued at the allocated queue rate. Although the rate of data sent to the egress NIC matches the allocated rate, the rate at which packets are removed from the queue depends on the CPU frequency and OVS-DPDK’s tick rate. Unlike HTB, which uses the availability of tokens to limit the rate at which packets are removed from the queue, TRTCM uses the availability of tokens to decide which actions to take. If there are tokens available in the bucket when a packet is dequeued, the packet is passed on to the NIC. If there are not enough tokens for the packet, the packet is dropped. The token bucket is refilled at the allocated queue rate, hence, the amount of data sent to the NIC is limited by that value. This approach results in a very high dequeue rate for all TRTCM queues, and the effective dequeue rate is on the order of several Gbps. For OVS-KP, the value of in Equation (4) is close to 1 because the flow rate is approaching the effective queue rate, whereas for OVS-DPDK, that value is now much closer to 0 because the effective queue rate is much higher than the flow rate. This results in packets spending significantly less time waiting in the packet scheduler’s queues. As we can see from a direct comparison of Figures 4(a) and 5(a), for TCP flows that are rate limited to 500 Mbps, the latency is reduced from 19.22 ms with HTB to 0.27 ms with TRTCM, a 70x reduction. Although the magnitude of latency reduction varies depending on the allocated queue rate and NIC line rate, this shows that a significant portion of the latency experienced by the packets that traverse OVS-KP’s rate-limited queues is the time spent waiting in the packet scheduler’s queue. OVS-DPDK’s rate control mechanism is able to avoid these long queueing latencies, while still being able to accurately rate-limit the traffic to the egress NIC.
VII Resource Efficiency Comparisons
On the surface, OVS-KP and OVS-DPDK’s rate control mechanisms accomplish the same goal: limit the rate of traffic that is sent to the egress NIC. Although differences in implementation have significant implications for latency, another implication that is just as important is the effect of the packet scheduler on resource utilization efficiency. One of the main goals in edge/fog task allocation is to utilize resources effectively and efficiently, which, for network resources, is usually accomplished through bandwidth slicing and rate control mechanisms. We have observed that the HTB and TRTCM packet schedulers are capable of accurately rate-limiting a queue; however, our observations also show that OVS-DPDK’s choice to drop all packets that are in excess of the allocated queue rate is a tradeoff between latency and effective bandwidth utilization.
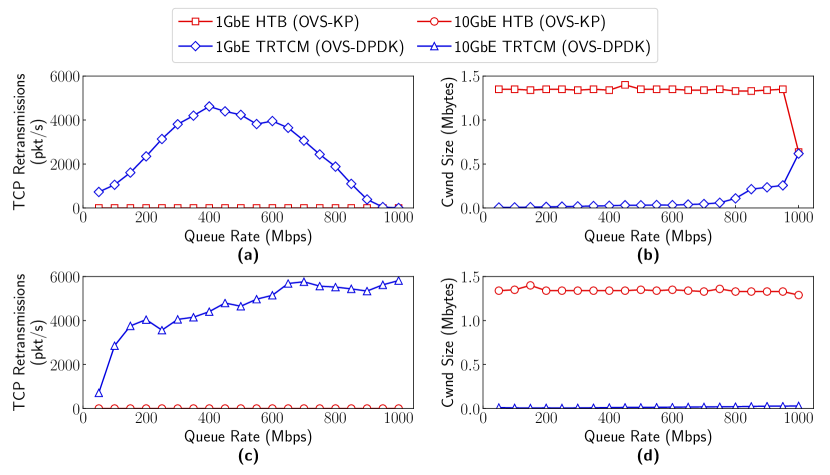
We run experiments with the same setup as Figure 4 and 5, and we use iperf3 to capture data for TCP retransmission rate and TCP congestion window size. Figures 6a and 6c present the results for TCP retransmission rate. We observe that rate-limiting with TRTCM causes significantly more TCP retransmissions compared to HTB. Rate-limiting to 500 Mbps with TRTCM results in 4233 and 4652 TCP retransmissions per second for 1GbE and 10GbE NICs, respectively. This indicates that for TCP traffic, maintaining an egress throughput of 500 Mbps out of the switch requires an additional 50.8 Mbps and 55.8 Mbps of retransmission traffic, due to the large number of packets that TRTCM drops. More importantly, although OVS-DPDK is able to switch individual packets with lower latency than OVS-KP, the high rate of packet drops/retransmissions has an adverse effect on application message latency. The application layer is not dependent on individual packet latency, rather, is dependent on the latency of messages which can be composed of multiple packets. In a situation with a 10% retransmission rate, large application layer messages are very likely to experience retransmissions and slowdowns due to the inefficiencies of TRTCM.
Figures 6b and 6d show that rate-limited flows with TRTCM have much smaller congestion window sizes than flows that are rate-limited with HTB. Once again, this is related to TRTCM—dropping all packets that are over the allocated queue rate is extremely limiting for TCP congestion window size. Each time a packet is dropped and retransmitted, the congestion window of that TCP connection is halved. For TCP flows with high retransmission rates like those we observed with TRTCM, the congestion windows are severely limited and are unable to grow due to the constant packet drops and subsequent window size adjustments. The frequent congestion window size adjustments also results in spikes and dips in flow throughput, which have a detrimental effect on latency predictability. As such, application layer messages that are sent through OVS-DPDK always have an element of unpredictability due to high retransmission rates while messages sent through OVS-KP do not.
Since OVS-DPDK operates completely in user-space, it achieves its high performance by constantly consuming 100% of at least one processor core. For high performance use-cases, a separate core is used for each port, resulting in several processor cores being dedicated entirely to running the DPDK user-space data path. In low-cost and low-energy edge and fog computing scenarios, this is not desirable, especially when compared to OVS-KP, which consumes less than 5% of a single processor core with HTB while switching 10Gbps traffic with hundreds of flow rules and queues.
VIII Conclusion and Future Work
In this paper, we studied how packet schedulers affect switching latency and resource efficiency. We first developed models to predict the latency of the M/M/1 queueing system that can be found in the HTB packet scheduler. Specifically, we analyzed the behavior of the packet scheduler, then used these observations to predict packet latency of TCP flows. We then discussed the design differences between OVS-KP and OVS-DPDK packet schedulers and showed how each achieves either low latency or resource utilization efficiency at the cost of the other. The results presented in this work provide a foundation from which we can begin to build deterministic software switching systems that can be specifically used to build low-cost processing and packet switching systems using commodity hardware.
The design decisions that allow OVS-DPDK’s TRTCM to achieve low latency in comparison to OVS-KP’s HTB come at the cost of inefficient bandwidth usage, throughput instability, and reduced latency predictability. This information is especially important to design networks with specific performance metrics in mind. Besides, this information can be leveraged to design packet schedulers that combine the desired properties of HTB and TRTCM. For example, a new packet scheduler that seeks to enforce latency bounds while also achieving flow reliability could dequeue packets according to the queue rate similar to HTB, and also dynamically adjust queue length so that packets that do not meet the packet latency requirements are dropped, similar to TRTCM. This way, the benefits of using the queue buffers can be realized, while also keeping queueing latency within established bounds.
References
- [1] P. Emmerich, D. Raumer, S. Gallenmüller, F. Wohlfart, and G. Carle, “Throughput and latency of virtual switching with Open vSwitch: A quantitative analysis,” Journal of Network and Systems Management, vol. 26, no. 2, pp. 314–338, 2018.
- [2] U. Javed, A. Iqbal, S. Saleh, S. A. Haider, and M. U. Ilyas, “A stochastic model for transit latency in OpenFlow SDNs,” Computer Networks, vol. 113, pp. 218–229, 2017.
- [3] C. Powell, C. Desiniotis, and B. Dezfouli, “The fog development kit: A platform for the development and management of fog systems,” IEEE Internet of Things Journal, vol. 7, no. 4, pp. 3198–3213, 2020.
- [4] P. Heise, F. Geyer, and R. Obermaisser, “Deterministic OpenFlow: Performance evaluation of SDN hardware for avionic networks,” in 11th International Conference on Network and Service Management (CNSM). IEEE, 2015, pp. 372–377.
- [5] J. Sheth and B. Dezfouli, “Enhancing the energy-efficiency and timeliness of IoT communication in WiFi networks,” IEEE Internet of Things Journal, vol. 6, no. 5, pp. 9085–9097, 2019.
- [6] V. Fang, T. Lvai, S. Han, S. Ratnasamy, B. Raghavan, and J. Sherry, “Evaluating software switches: hard or hopeless?” EECS Department, University of California, Berkeley, Tech. Rep. UCB/EECS-2018-136, 2018.
- [7] R. McGuinness and G. Porter, “Evaluating the performance of software NICs for 100-gb/s datacenter traffic control,” in Symposium on Architectures for Networking and Communications Systems, 2018, pp. 74–88.
- [8] T. Meyer, F. Wohlfart, D. Raumer, B. E. Wolfinger, and G. Carle, “Validated model-based performance prediction of multi-core software routers.” Praxis der Informationsverarbeitung und Kommunikation, vol. 37, no. 2, pp. 93–107, 2014.
- [9] T. Zhang, L. Linguaglossa, J. Roberts, L. Iannone, M. Gallo, and P. Giaccone, “A benchmarking methodology for evaluating software switch performance for NFV,” in IEEE Conference on Network Softwarization (NetSoft). IEEE, 2019, pp. 251–253.
- [10] S. Shanmugalingam, A. Ksentini, and P. Bertin, “DPDK Open vSwitch performance validation with mirroring feature,” in 23rd International Conference on Telecommunications (ICT). IEEE, 2016, pp. 1–6.
- [11] T. Begin, B. Baynat, G. A. Gallardo, and V. Jardin, “An accurate and efficient modeling framework for the performance evaluation of DPDK-based virtual switches,” IEEE Transactions on Network and Service Management, vol. 15, no. 4, pp. 1407–1421, 2018.
- [12] D. Sattar and A. Matrawy, “An empirical model of packet processing delay of the Open vSwitch,” in IEEE 25th International Conference on Network Protocols (ICNP), 2017, pp. 1–6.
- [13] A. W. Manggala, A. Tanwidjaja et al., “Performance analysis of white box switch on software defined networking using Open vSwitch,” in International Conference on Wireless and Telematics (ICWT). IEEE, 2015, pp. 1–7.
- [14] K. He, W. Qin, Q. Zhang, W. Wu, J. Yang, T. Pan, C. Hu, J. Zhang, B. Stephens, A. Akella et al., “Low latency software rate limiters for cloud networks,” in Proceedings of the First Asia-Pacific Workshop on Networking, 2017, pp. 78–84.
- [15] B. Pfaff, J. Pettit, K. Amidon, M. Casado, T. Koponen, and S. Shenker, “Extending networking into the virtualization layer.” in Hotnets, 2009.
- [16] J. Pettit, J. Gross, B. Pfaff, M. Casado, and S. Crosby, “Virtual switching in an era of advanced edges,” 2010.
- [17] B. Pfaff, J. Pettit, T. Koponen, E. Jackson, A. Zhou, J. Rajahalme, J. Gross, A. Wang, J. Stringer, P. Shelar et al., “The design and implementation of Open vSwitch,” in 12th USENIX Symposium on Networked Systems Design and Implementation (NSDI), 2015, pp. 117–130.
- [18] J. Chen and B. Dezfouli, “Modeling control traffic in software-defined networks,” in 7th IEEE International Conference on Network Softwarization (NefSoft), 2021.
- [19] J. Abate and W. Whitt, “Transient behavior of the M/M/l queue: starting at the origin,” Queueing systems, vol. 2, no. 1, pp. 41–65, 1987.