XMM-Newton Observes the Intrabinary Shock of PSR J1959+2048
Abstract
In a multi-orbit (100 ks) XMM-Newton exposure of the original black widow pulsar, PSR J1959+2048, we measure the strong orbital modulation caused by intrabinary shock (IBS) emission. The IBS light curve peak appears asymmetric, which we attribute to sweep-back effects in the companion wind. We also see evidence for an X-ray eclipse by the companion and its wind. Together with the IBS fit, this supports an edge-on view of the system and a modest mass for the recycled pulsar. Our IBS fit parameters imply a wind flux that, if persistent, would evaporated the companion within a few Gyr.
1 Introduction
The millisecond pulsar PSR J1959+2048 (hereafter J1959) was discovered at 1.4 GHz Arecibo by Fruchter et al. (1988b) with a ms spin period and a 9.16 hr orbit with a low mass companion. The Shklovskii (1970)-corrected spindown luminosity is , for a neutron star (NS) moment of inertia and a distance of kpc. J1959’s optical counterpart was detected by Fruchter et al. (1988a) and van Paradijs et al. (1988) and orbital brightness modulation showed it to be tidally locked, being irradiated and evaporated by the pulsar. This evaporation inspired the moniker black widow, and it is the archetype of the companion-evaporating “spider” pulsars.
Subsequent analysis of photometric data from the William Herschel Telescope (WHT) and Hubble Space Telescope (HST) by Reynolds et al. (2007) implied a binary inclination , for a simple direct heating model. With this inclination, the radial velocity study of van Kerkwijk et al. (2011) implies a companion center-of-mass (CoM) velocity km s-1, giving a NS mass of . This large value is of substantial significance for NS Equation of State (EoS) studies.
X-ray studies of J1959 have been carried out using ROSAT (Kulkarni et al., 1992); Chandra (Stappers et al., 2003; Huang et al., 2012) and XMM-Newton (Huang & Becker, 2007), and show that the X-ray emission of J1959 is mostly non-thermal, best described by a power-law spectrum. The CXO observation resolves some of the emission into a Pulsar Wind Nebula (PWN) lying inside an H bow shock. However, the compact X-ray emission presents orbital modulation, with a double-peaked lightcurve, which can be interpreted as Doppler-beamed synchrotron radiation from an intrabinary shock (IBS) between the relativistic pulsar wind and a massive wind driven from the companion (Kandel et al., 2019). Fits with this model implied an inclination , in some tension with the value determined from the optical light curve.
In this paper, we report on a new XMM-Newton observation of J1959. Combined with archival data sets, the improved light curve offers some potentially important clues about the binary system. In Section 2, we briefly describe the observation and data reduction process. The spectrum and light curve analysis are presented in Section 3 and 4, respectively. We discuss the physical implications of the results in Section 5.
2 Observations
An XMM-Newton observation of J1959 in imaging mode with the medium filter was performed on May 15-16 2020 for continuous exposure of 100 ks (ObsID 0860460101). The observation was analyzed using the XMM-Newton Science Analysis System (SAS) (Jansen et al., 2001). The EPIC data were processed using the epproc and the emproc tools, and standard pipeline processing was performed to screen particle flaring, and the events were barycentered using the barycen tool. After screening the total live time for MOS1, MOS2 and PN were 96.9 ks, 98.6 ks and 93.4 ks, respectively. For timing and spectral analysis, a 30′′-radius circular source extraction region centered at the position of the pulsar was used. Note that this includes extended emission from the PWN, unresolved to XMM-Newton. For background, a source-free region of approximately three times the source aperture was chosen.
To supplement our analysis, we also use a 160 ks archival Chandra Observation (ObsID 9088) and 31.5 ks archival XMM-Newton observation (ObsID 0204910201). That XMM observation used PN timing mode, which results in high background, so only the MOS data are useful in our study. Unfortunately, that observation did not completely cover the orbit, missing the phase between the two peaks. Still, these data are helpful in our light curve and spectral analyses.
3 Spectral Analysis
We used the SAS tool evselect to extract spectra of the source and the background. Response files were constructed using the SAS tools rmfgen and arfgen. The extracted spectra were binned with at least 25 source counts per bin. The final background-subtracted spectral modeling was performed with XSPEC in the energy range keV.
Past X-ray analysis (Kandel et al., 2019) suggested orbital variability of the spectrum of J1959, with spectrum at phases corresponding to the two IBS peaks being particularly hard, . To study this variability, we extract spectra for three different orbital phase regions: i) P1 (first peak, phase , with at the ascending node of the pulsar), ii) P2 (second peak, ) and iii) Off-peak (). At all phases (except for possibly a narrow window at if there is companion eclipse), we expect a phase-independent thermal contribution from the NS surface, plus non-thermal flux from the pulsar magnetosphere and the CXO-resolved PWN. Since the IBS emission is negligible at the off-peak region, we model the off-peak spectrum as a sum of blackbody and power-law components, .
Our new XMM observation spanned three complete binary orbits. During the second orbit, the flux in all cameras appears to increase substantially in the phase range , reaching as high as erg/cm2/s; over the quiescent level. Since other black widow systems (e.g. Romani et al. 2015) are seen to have strong non-thermal flares at various orbital phases, we excise this interval in computing the typical off-peak spectrum. The best-fit for the power law in this flaring interval has ; this is nominally harder than the rest of the off-peak interval, although with limited counts the difference is not significant ().
At P1 and P2, additional power-law emission from the IBS contributes, thus the model is taken to be , with , respectively for P1 and P2. We simultaneously fit all three phase intervals (with and parameters, and a global , the same for all three intervals) to the MOS1, MOS2, and PN data.
| Parameter | P1 | P2 | Off-peak |
|---|---|---|---|
| (cm | |||
| (keV) | |||
| erg/cm2/s) | |||
| erg/cm2/s) | |||
Since and are consistent, we also made a direct test of the spectral index variation by holding the BB and absorption fixed and simply fitting the off IBS-peak and (extra) IBS-peak power laws. The fit results are shown in Table 1.
4 Lightcurve Analysis
To form our quiescent light curve (LC) we again excise the second orbit flaring interval. The resulting LC then appears fairly consistent between our new data and the archival observations. It is of course possible that lower amplitude flaring exists at other phases. Binned LCs from the MOS and PN cameras are shown in Figure 1. They show prominent double-peaked structure at phases and . Between the peaks, the flux drops to the background level or below (especially in the MOS data).
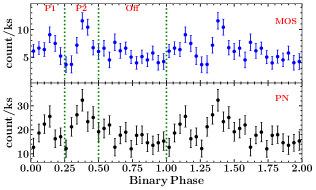
While the two bright peaks are due to IBS emission, the substantial off-peak flux is dominated by non-thermal emission from the PWN and pulsar magnetosphere and thermal emission from the NS surface. Guillemot et al. (2011) showed a detection of X-ray pulsation from J1959 and estimated that of the total XMM X-ray flux is pulsed. We have measured the CXO emission in the XMM aperture, excluding a -radius region around the point source. Fitting a PL spectrum (with fixed at the global value of §3) we find and . Thus we infer that the the blackbody emission is pulsed (as expected for a hot polar cap) and that a fraction of the PL component should also be pulsed (magnetospheric) emission. A small 10-25% fraction of the off-peak emission appears unresolved and unpulsed; this can either be a sub-arcsec PWN component or unpulsed point source emission.
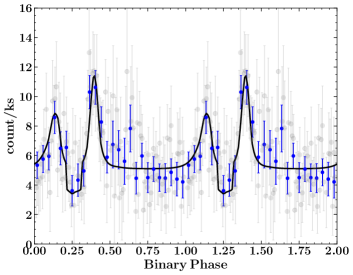
The LC also shows evidence of peak asymmetry, a feature that was hinted in Kandel et al. (2019), suggesting IBS sweepback distortion due to the finite speed of the companion baryonic wind; this tends to enhance and delay the second peak as seen on our LCs. Such asymmetry is characterized by the ratio between the companion’s wind speed and its orbital velocity , , with lower resulting in larger LC asymmetry. Accordingly, we perform a Markov Chain Monte Carlo fit to the combined LC with the model described in Kandel et al. (2019). For the IBS magnetic field strength, we compute the light cylinder magnetic field and assume a decrease (toroidal field structure) from light cylinder at to the termination shock, giving G for magnetic field at the nose of the IBS. We fit the shock injection power , the phase-independent flux and the IBS parameters (Table 2). Note that the inclination is again larger than indicated by past optical fits, although inclusion of allows substantial uncertainty.
Recently, evidence has been presented (Clark et al., 2021) for an eclipse of the pulsed ray emission in J1959. With a small companion, this requires a binary inclination , far from the result of past optical LC modeling of this object. New optical modeling, likely including the important effects of surface heat transport and gravitational darkening (Kandel & Romani, 2020; Voisin et al., 2020; Romani et al., 2021) is needed to reconcile this tension. Such modeling will alter the heating pattern, but naively scaling the direct heating result of van Kerkwijk et al. (2011) one would then expect a neutron star mass . With an orbit close to edge-on, we also expect the point source X-ray flux (thermal and magnetospheric) to be eclipsed near . In addition, the IBS emission will be eclipsed. The X-ray eclipse can in fact be wider than the -ray event since the baryonic evaporative wind can produce significant absorption beyond the radius of the companion surface. As noted above, our data do show a flux deficit near phase .
A simple companion photosphere eclipse of the point source would produce an X-ray eclipse width comparable to that of the -rays, i.e. . However, eclipsing X-ray flux from the extended IBS apex will produce a shallow broader modulation. More importantly, if the companion wind absorbs pulsar and IBS flux, this gives an even broader eclipse. This wind is swept back, so if the absorption takes place over a distance comparable to that of the termination shock, the absorption profile will be delayed from and be asymmetric. We lack the eclipse signal-to-noise ratio for a true fit, but as a first approximation to the eclipse asymmetry, we can adopt the wind column density pattern computed in An et al. (2020), assuming an equatorial wind, for the azimuthal distribution around the companion. We simplify to an asymmetric eclipser with a surface at a fixed column density in this wind pattern, so the eclipsing surface is scaled by a single parameter (here the minimum radius, at the azimuth of minimum column density). This surface eclipses the point source flux and the IBS.
| Parameter | Free , no eclipse | , eclipse |
|---|---|---|
| – | ||
| – | ||
| 108/92 | 97/92 |
Fixing , and fitting and the other IBS parameters, gives values shown in Table 2 and the LC shown in Figure 2. The inferred eclipsing wind is extended with , at the smallest, extending to nearly , the orbit semi-major axis, in the swept-back direction. The dip centered at phase is clearly captured by the model; so is the peak asymmetry. The decrease in by adding an eclipse is (see Table 2), thus the eclipse model is statistically preferred: the non-eclipse model’s relative likelihood is about 0.5% according to the Akaike Information Criterion.
5 Discussion and Conclusions
The spectral results are in good accord with prior fits. The off-peak power law emission includes flux from the inner nebula and our is consistent with the value for the inner nebula, resolved with CXO, as found here and in Huang et al. (2012). The peak emission appears harder than off-peak, but the significance remains marginal. Even holding the thermal emission and fixed, the mean index of the peak region, , differs by only from the off-peak power law, or from the extended CXO PWN spectral index. We are however able to separate a thermal component in the off-peak phase, which is consistent with a heated polar cap of radius 0.4 km and temperature K; this flux should be pulsed and may be eclipsed by the companion.
The fixed- fit to the IBS peak, Table 2, provides substantially improved constraints on the shock properties. First, , the isotropic equivalent power required to explain the IBS luminosity at kpc is quite close to the spindown power. Even with or an expected equatorial concentration of the pulsar wind, the efficiency will be high; we can see this agreement as a crude confirmation of the source distance. The wind speed parameter is now measured with some confidence. Combined with the model parameter , which describes the momentum ratio of the companion and pulsar winds, and from the pulsar spindown we can estimate the companion mass loss rate as
| (1) |
With a companion orbital velocity km s-1, our best-fit results gives a mass-loss rate of . This mass loss rate is at least higher than the inferred from radio eclipse by Polzin et al. (2020). The difference may not be too surprising since our method relies on the global structure of the wind shock, which is directly sensitive to the mass flux, rather than the less direct inference from the radio eclipse provided by the ionized component. This instantaneous mass loss rate is interesting as, even at the 1– lower limit, complete evaporation would take yr, assuming a companion mass of . Of course, the mass loss may decrease as the system evolves, but the present few-Gyr timescale implies that while we are observing J1959 in a long-lived phase, complete evaporation to an isolated millisecond pulsar could be possible in the spindown lifetime.
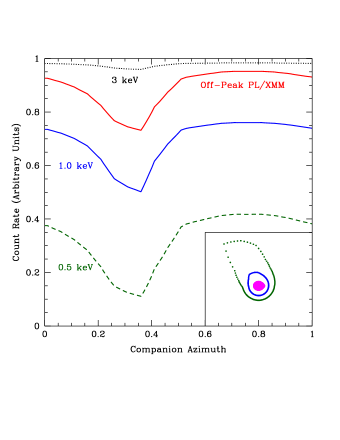
This X-ray eclipse provides an opportunity to constrain the companion wind structure and mass flux. At high energies (hard X-ray to -ray), only the dense companion photosphere at radius will eclipse. At progressively lower X-ray energies the extended, swept-back companion wind will provide more absorption, with increasing optical depth and increasing distortion (Figure 3). We defer such detailed computation to a future publication; next-generation X-ray sensitivities will likely be required to take advantage of the energy-dependent eclipse to probe the wind structure. We do, however, note a basic inference from the apparently extended eclipse. An eclipse with characteristic scale will have a column density for a near-equatorial wind ( for an approximately spherical outflow). This corresponds to a hydrogen column density . Since we typically infer an interstellar column density for an absorption optical depth at 1 keV, the wind seems too thin to give a strong absorption eclipse. More detailed sums, e.g. including pile-up at the termination shock, may address this. But it also seems important to note that spectroscopic studies of J1959 (van Kerkwijk et al., 2011) and other black widows (Romani et al., 2014, 2015) companions infer metallicities substantially higher than Solar. This reduces the required column for keV absorption, providing appropriate columns for . In the Athena/Lynx future, one might use detailed-energy dependent eclipse curves to probe the wind composition, in addition to its density structure.
References
- An et al. (2020) An, H., Romani, R. W., Kerr, M., Collaboration, F.-L., et al. 2020, The Astrophysical Journal, 897, 52
- Clark et al. (2021) Clark, C., M., K., & Breton, R. P. 2021, in 9th International Fermi Symposium
- Fruchter et al. (1988a) Fruchter, A., Gunn, J., Lauer, T., & Dressler, A. 1988a, Nature, 334, 686
- Fruchter et al. (1988b) Fruchter, A., Stinebring, D., & Taylor, J. 1988b, Nature, 333, 237
- Guillemot et al. (2011) Guillemot, L., Johnson, T., Venter, C., et al. 2011, The Astrophysical Journal, 744, 33
- Huang & Becker (2007) Huang, H.-H., & Becker, W. 2007, Astronomy & Astrophysics, 463, L5
- Huang et al. (2012) Huang, R., Kong, A., Takata, J., et al. 2012, The Astrophysical Journal, 760, 92
- Jansen et al. (2001) Jansen, F., Lumb, D., Altieri, B., et al. 2001, Astronomy & Astrophysics, 365, L1
- Kandel & Romani (2020) Kandel, D., & Romani, R. W. 2020, The Astrophysical Journal, 892, 101
- Kandel et al. (2019) Kandel, D., Romani, R. W., & An, H. 2019, The Astrophysical Journal, 879, 73
- Kulkarni et al. (1992) Kulkarni, S., Phinney, E., Evans, C., & Hasinger, G. 1992, Nature, 359, 300
- Polzin et al. (2020) Polzin, E. J., Breton, R. P., Bhattacharyya, B., et al. 2020, MNRAS, 494, 2948
- Reynolds et al. (2007) Reynolds, M. T., Callanan, P. J., Fruchter, A. S., et al. 2007, Monthly Notices of the Royal Astronomical Society, 379, 1117
- Romani et al. (2014) Romani, R. W., Filippenko, A. V., & Cenko, S. B. 2014, The Astrophysical Journal Letters, 793, L20
- Romani et al. (2015) —. 2015, The Astrophysical Journal, 804, 115
- Romani et al. (2021) Romani, R. W., Kandel, D., Filippenko, A. V., Brink, T. G., & Zheng, W. 2021, The Astrophysical Journal Letters, 908, L46
- Shklovskii (1970) Shklovskii, I. 1970, Soviet Astronomy, 13, 562
- Stappers et al. (2003) Stappers, B. W., Gaensler, B., Kaspi, V., Van Der Klis, M., & Lewin, W. 2003, Science, 299, 1372
- van Kerkwijk et al. (2011) van Kerkwijk, M., Breton, R., & Kulkarni, S. 2011, The Astrophysical Journal, 728, 95
- van Paradijs et al. (1988) van Paradijs, J., Allington-Smith, J., Callanan, P., et al. 1988, Nature, 334, 684
- Voisin et al. (2020) Voisin, G., Kennedy, M., Breton, R., Clark, C., & Mata-Sánchez, D. 2020, MNRAS, 499, 1758