Lack of evidence for correlation between COVID-19 infodemic and vaccine acceptance
Abstract
How information consumption affects behaviour is an open and widely debated research question. A popular hypothesis states that the so-called infodemic has a substantial impact on orienting individual decisions [1, 2]. A competing hypothesis stresses that exposure to vast amounts of even contradictory information has little effect on personal choices [3, 4]. The COVID-19 pandemic offered an opportunity to investigate this relationship, analysing the interplay between COVID-19 related information circulation and the propensity of users to get vaccinated. We analyse the vaccine infodemics on Twitter and Facebook by looking at 146M contents produced by 20M accounts between 1 January 2020 and 30 April 2021. We find that vaccine-related news triggered huge interest through social media, affecting attention patterns and the modality in which information was spreading. However, we observe that such a tumultuous information landscape translated only in minimal variations in overall vaccine acceptance as measured by Facebook’s daily COVID-19 Trends and Impact Survey [5] (previously known as COVID-19 World Symptoms Survey) on a sample of 1.6M users. Notably, the observation period includes the European Medicines Agency (EMA) investigations over blood clots cases potentially related to vaccinations, a series of events that could have eroded trust in vaccination campaigns. We conclude the paper by investigating the numerical correlation between various infodemics indices and vaccine acceptance, observing strong compatibility with a null model. This finding supports the hypothesis that altered information consumption patterns are not a reliable predictor of collective behavioural change. Instead, wider attention on social media seems to resolve in polarisation, with the vaccine-prone and the vaccine-hesitant maintaining their positions.
Main
Social media platforms have radically changed how we access information and are often used as a proxy to understand social mood and opinion trends. Users online tend to acquire information adhering to their beliefs and ignore information dissenting from their views [6, 7, 8]. This process, combined with the unprecedented amount of information available online, has fostered the emergence of groups of like-minded individuals framing and reinforcing a shared narrative (i.e., echo chambers) [9, 10, 11, 12, 13]. Furthermore, recent studies provided evidence for the effect of feed algorithms in bursting polarisation of social dynamics [14, 15]. Such a scenario may be considered a fertile environment for misinformation spreading, and an eventual threat for democracies [16, 17].
However, the effect of the interplay between online information diffusion and offline user behaviour is still an open scientific question, with fundamental societal implications especially during a crisis like the ongoing pandemic [1, 18, 19, 20]. Indeed, the World Health Organisation raised concerns about the effects of the so-called “infodemic”, defined as “overabundance of information - some accurate and some not - that occurs during an epidemic” [21, 22], on global health. Two main hypotheses compete in accounting for the impact of information consumption on human behaviour. The first states that infodemic has a substantial impact on orienting individual decisions [1, 2]. The second view stresses that exposure to vast amounts of even contradictory information has little effect on personal choices [3, 4].
In this work we investigate the possible connection between online information and offline behaviour, by looking at possible correlation between the COVID-19 infodemic and vaccine acceptance as measured by intention to getting a vaccine. First, we analyse the news diet of 20M unique users on Facebook and Twitter over 16 months (from 1 January 2020 to 30 April 2021) to investigate the relationship between online discussions about COVID-19 vaccines and offline vaccine acceptance rate, in the six European countries (Denmark, France, Germany, Italy, Spain, and United Kingdom) that were mostly involved in the investigation performed by European Medicines Agency (EMA) about cases of blood clots occurred after some vaccinations To measure how the online debate may reverberate in offline intentions, we consider Facebook’s daily COVID-19 Trends and Impact Survey [5] on a sample of 1.6M users. Considering the overall observation period, we find that vaccine announcements triggered users’ engagement on social media massively. However, we do not observe significant variations in the vaccine acceptance rate during the same period.Second, to further investigate this lack of evidence for a correlation between infodemic and vaccine acceptance, we focus on the effects of the temporary suspension of the AstraZeneca (now Vaxzevria) vaccine issued by several EU countries and EMA. Also in this case minimal variation in the vaccine acceptance curves was observed after the information related to this event started circulating. Finally, we extend our analysis to 43 countries worldwide and corroborate our findings by testing correlation between vaccine acceptance curves and several infodemic indices, as measured by the COVID-19 Infodemic observatory [23].
Evolution of the Vaccine Debate
We analyse the social media debate around vaccine-related topics on Facebook and Twitter, collecting a large corpus of posts selected via keyword search (see Methods). First, we perform topic modelling on the dataset, employing a Deep Learning based approach (see Methods). In this way, we can assign posts to different arguments while studying their evolution over time. Figure 1 reports the most debated topics.
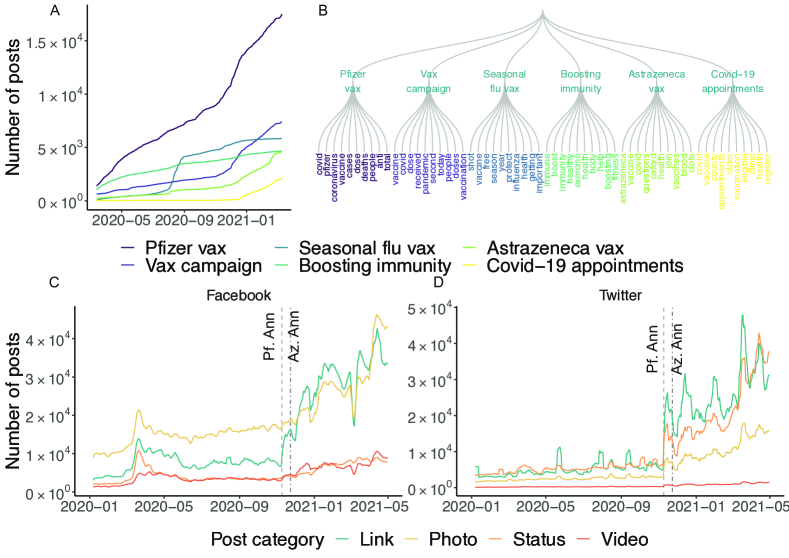
Consistently with the search, most of the keywords are related to the vaccines and the general vaccination campaign. “Pfizer vax,” “Vax campaign,” “AstraZeneca Vax” and “COVID-19 appointments” share a similar trend as they all start increasing around November 2020, which coincides with the disclosure of Pfizer [24] and AstraZeneca [25] vaccine efficacy statistics. The debate about “Seasonal flu vax” peaked around autumn 2020 while “Boosting immunity” shows a roughly constant growth rate.
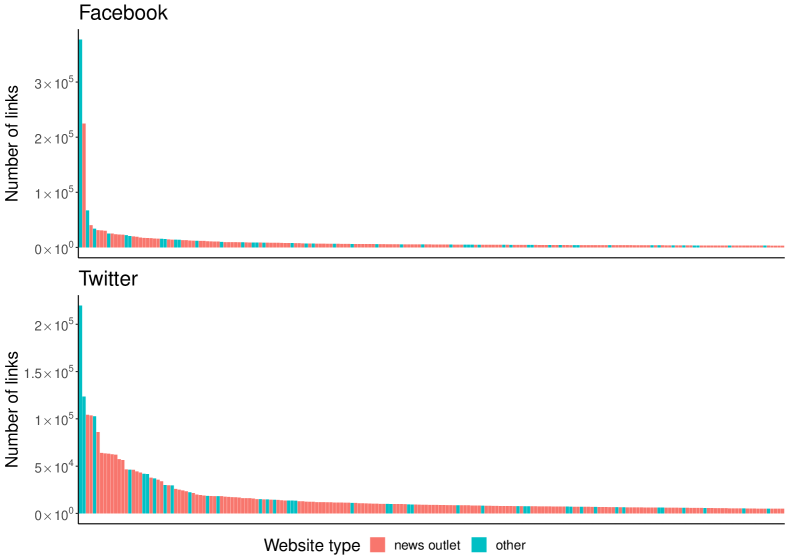
Next, we consider the social media traffic of different post categories: Link, Photo, Status, Video. In the case of Facebook (Figure 1C), we observe an increase in the number of links after the announcement of Pfizer’s efficacy on 18 November 2020. This increase unfolded into a surpass of the Link category over Photo after the AstraZeneca efficacy announcement on 23 November 2020, which marked a shift in the most frequent type of content posted. A similar dynamic can be observed on Twitter (Figure 1D). Since external links usually point to news or scientific articles (see Figure 6 of SI), we may argue that the increase of links circulation on social media right after vaccines announcement is a signal of a sudden information void that was promptly fulfilled [22]. This behaviour may reflect the urge of people to inform themselves about vaccines, whose safety has always been a matter of discussion and one of the main arguments used by the anti-vax community [26].
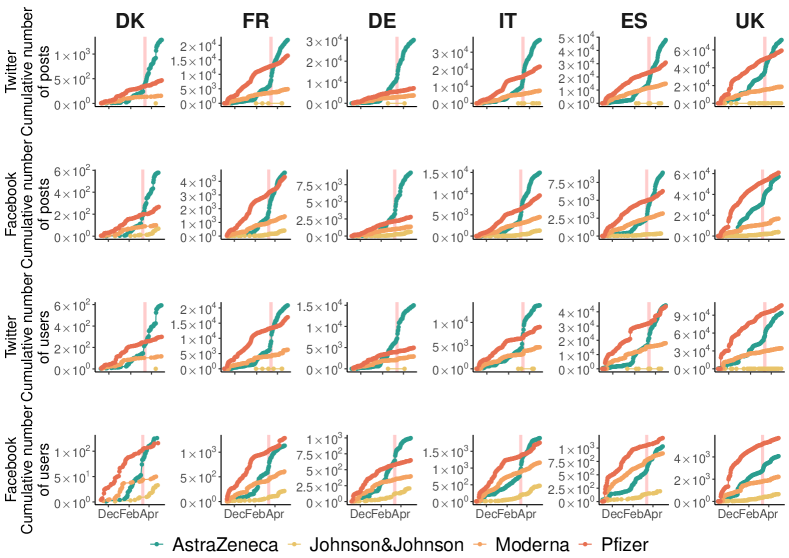
We now focus on a specific event of paramount relevance during the general European vaccination. On 10 March 2021, the European Medicines Agency (EMA) reported a rare incidence of blood clots after the vaccine inoculation that induced many European countries to implement a temporal suspension of AstraZeneca [27, 28]. The event triggered a relevant increase of traffic on social media, as shown in Figure 2. Specifically, we report the temporal evolution of the social debate – measured through the cumulative number of posts – for the first four officially approved vaccines (Pfizer, AstraZeneca, Moderna, and Johnson&Johnson) on Twitter (first row) and Facebook (second row). The social debate around the selected COVID-19 vaccines reaches an increasingly wide audience as shown by the number of unique users involved on Twitter (third row) and Facebook (fourth row). The volume of posts and users sharply increases in correspondence with the suspension date of the AstraZeneca vaccine for every nation and on both platforms. In contrast, the other three types of vaccines show only a moderate growth.
Evolution of Vaccine Acceptance
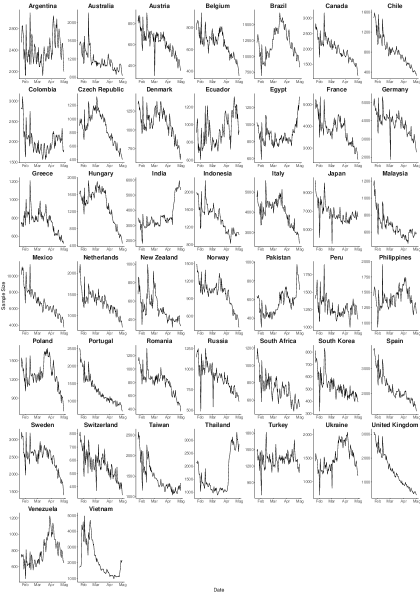
We now investigate the effect of these intense online debates on people’s actual intentions, as measured by proxies of vaccine acceptance. To do so, we leverage data from the COVID-19 Trends and Impact Survey [5, 29], part of the broader Facebook Data for Good project. In this survey, a sample of Facebook users is asked several questions about behaviours and concerns related to COVID-19 on a daily basis. We consider positive answers about vaccination intention from 44 countries (see Figure 8 of SI). The average number of daily respondents is 1954 (10th and 90th percentile 635, 3854, respectively) with a maximum of 12053 (9172, 15196) respondents per day for Brazil and a minimum of 525 (427, 663) respondents per day for South Korea. The response to this survey is a valid proxy of the offline users’ behaviour [30, 31] and a good indicator of vaccine acceptance at the country level.
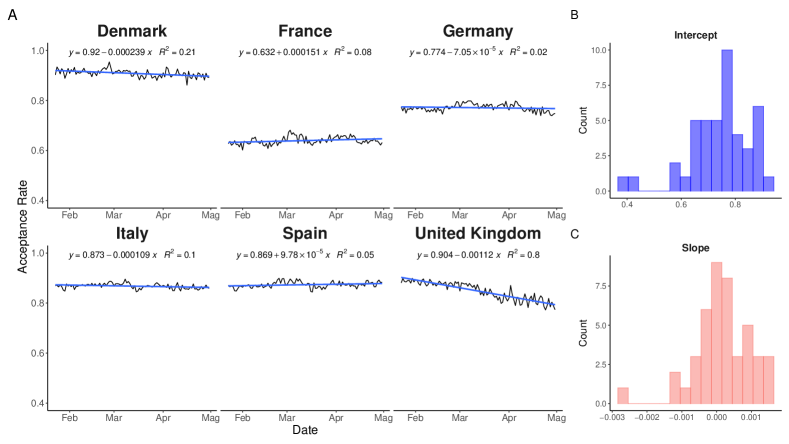
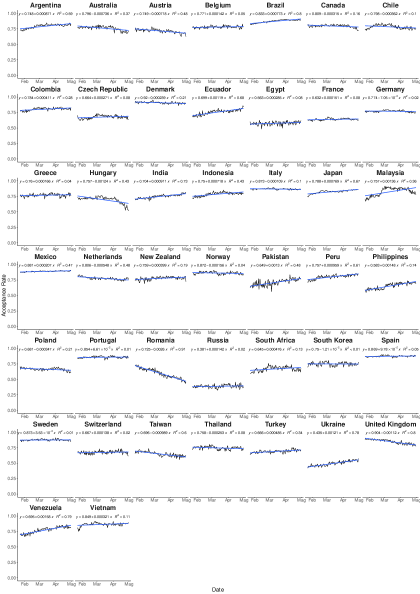
For each country, we perform a linear fit of the vaccine acceptance rate time series (from 23 January to 30 April 2021), i.e. the percentage of users willing to get vaccinated. Relatively flat trends results for Denmark, France, Germany, Italy, Spain, while United Kingdom shows a slightly decreasing trend (see Figure 3A). In general, the average slope computed for the whole set of 44 countries (see Figure 3C) is [%/day], thus being compatible with close-to-zero values. Furthermore, by performing a t-test on the distribution of slopes we fail to reject the (null) hypothesis that the average slope is zero ().
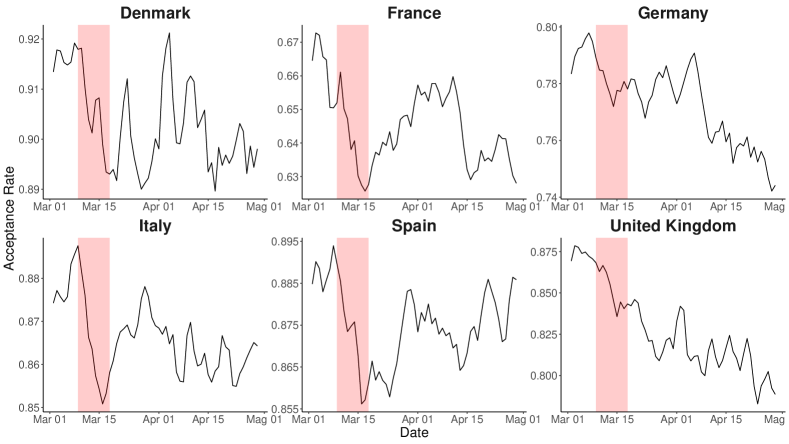
In Figure 4 we report a focus on the vaccine acceptance rate in correspondence of the EMA announcement (9 March 2021) about blood clots cases initially occurred in certain EU countries [27]. The empasse occurred after 9 March and lasted until 18 March 2021 when EMA declared that the benefits of AstraZeneca vaccination outweigh risks [28]. In the six considered countries the uncertainty about the side effects of vaccinations translated into a sudden drop of a few percentage points (3-4%). Thus, despite the great echo generated over the web (see Figure 2) by the news about AstraZeneca vaccinations, we do not observe any relevant variation in vaccination intentions.
Correlation between infodemic and vaccine intentions
To further investigate the possible link between online infodemics and vaccine intentions, we consider the quantitative infodemic indices developed and measured by the COVID-19 Infodemics Observatory [23], and quantify the correlation with vaccine acceptance rates described earlier.
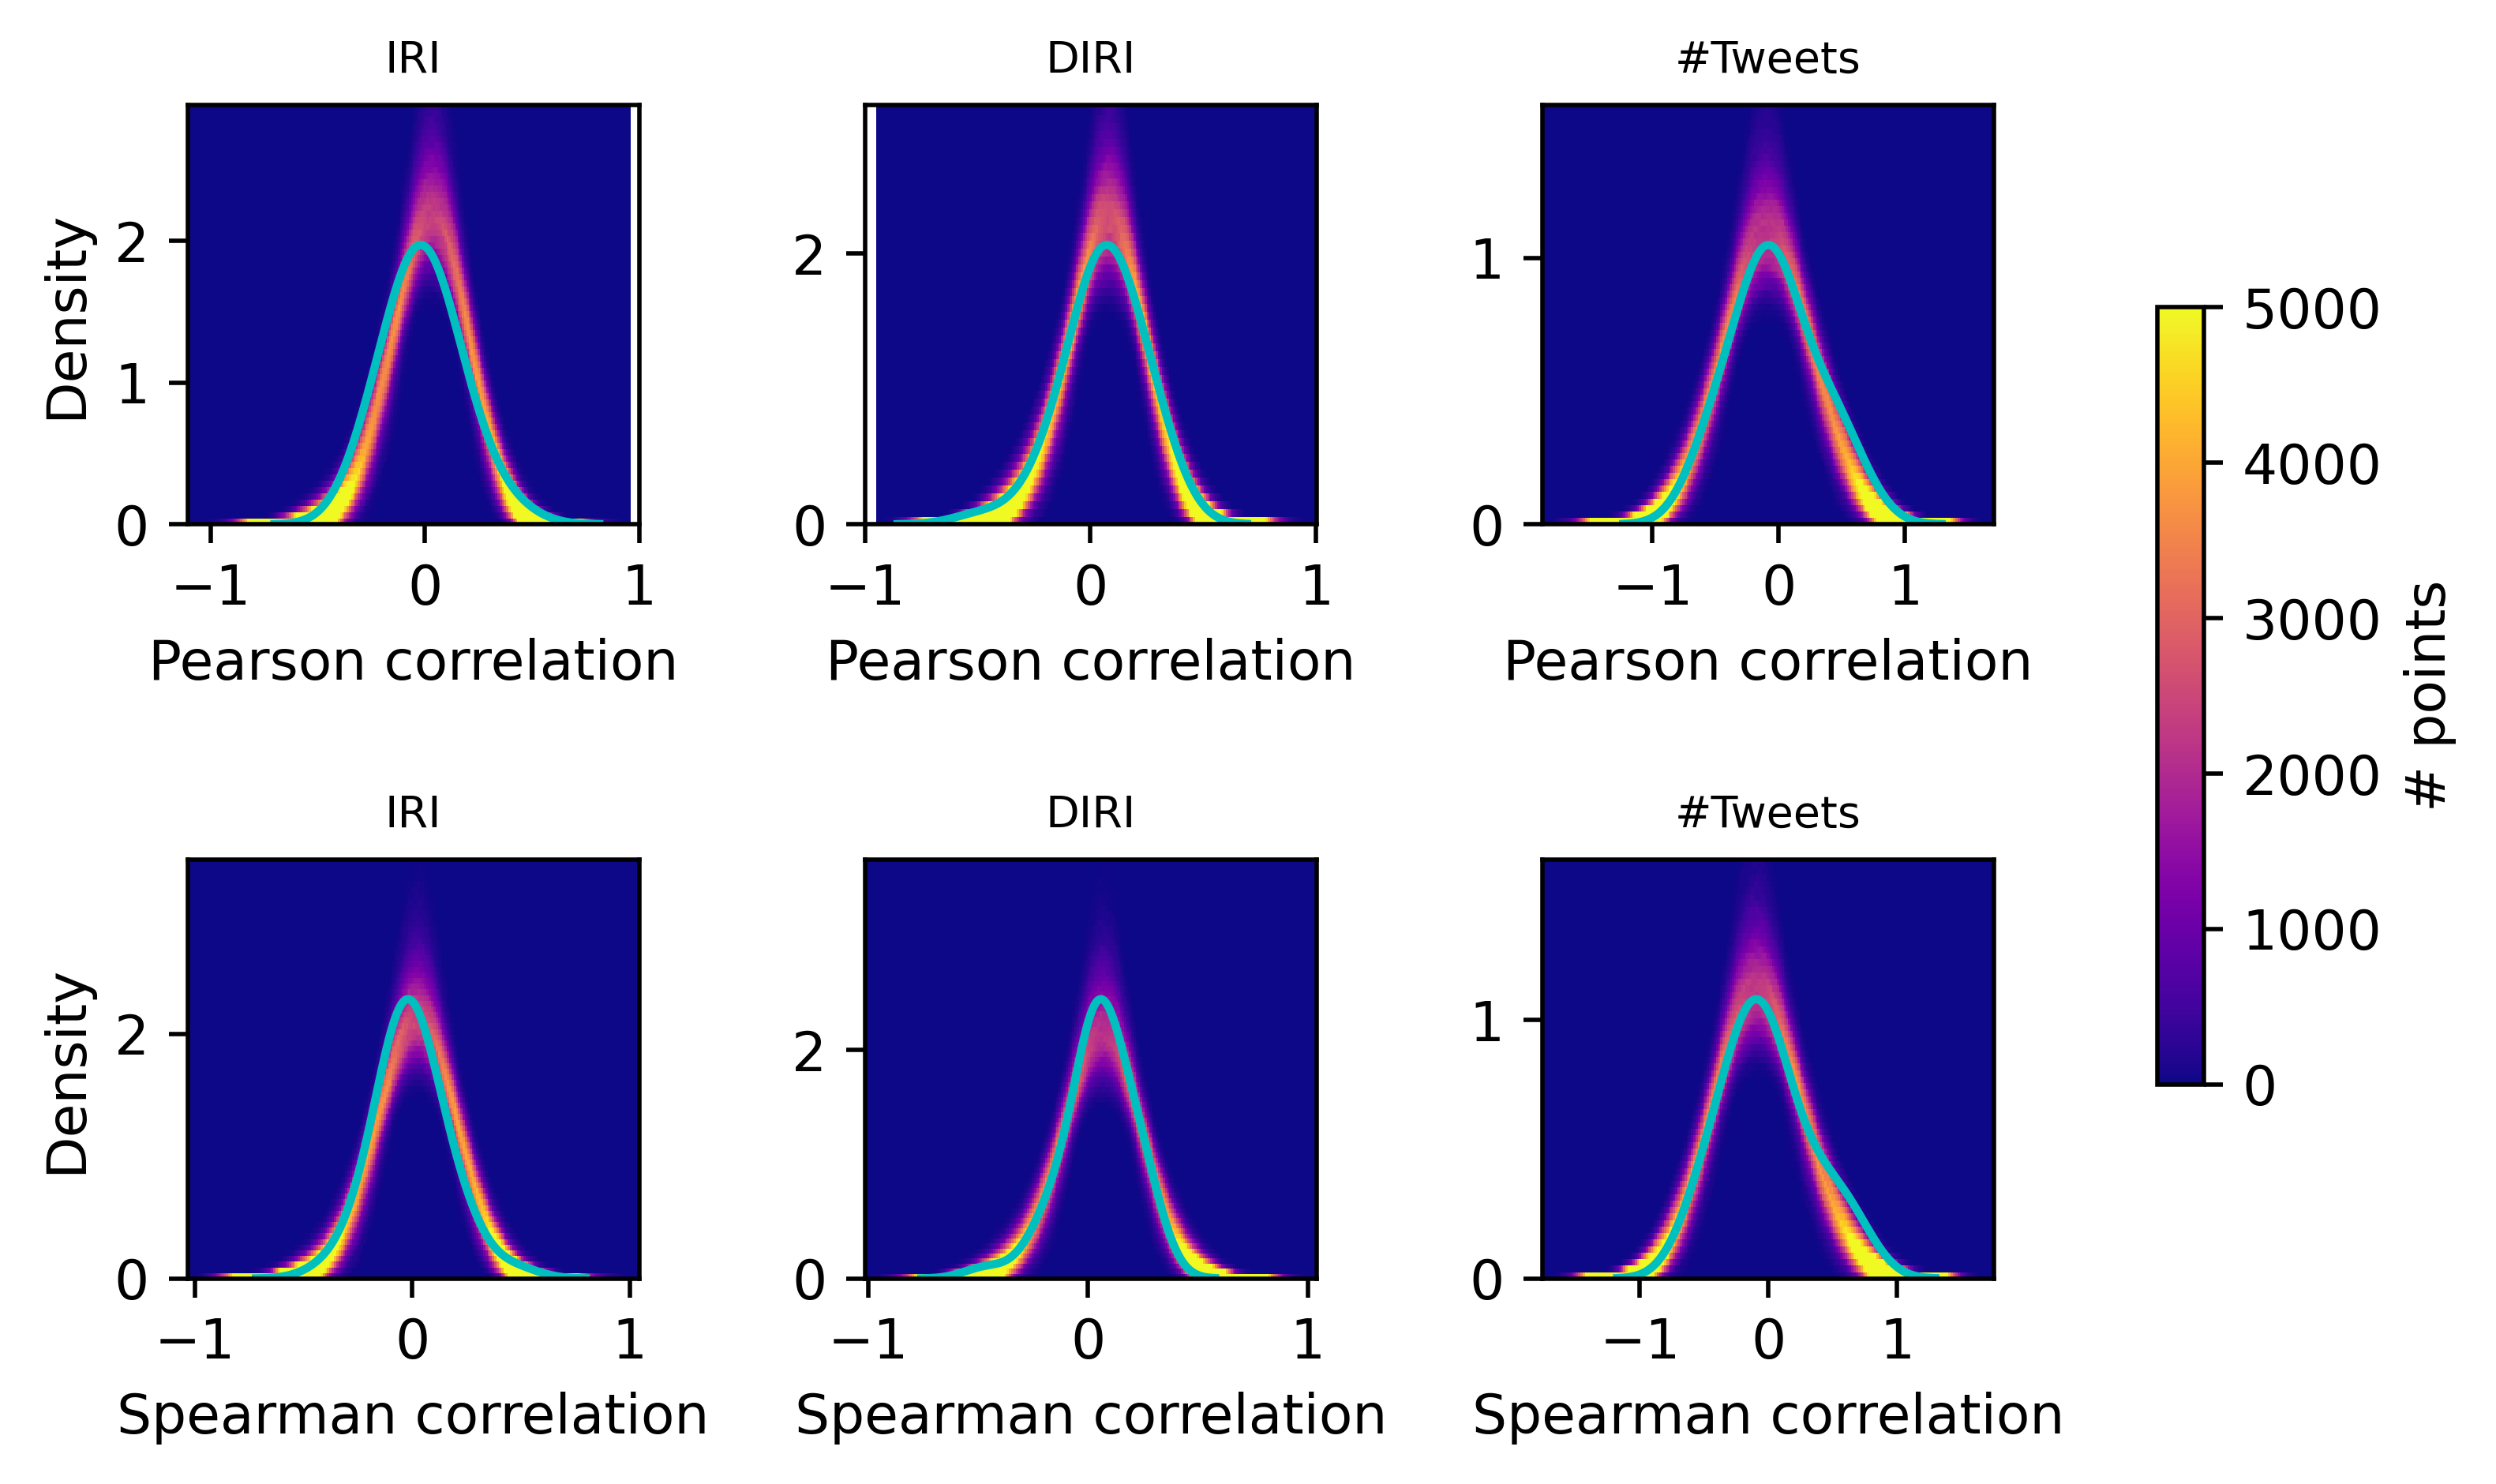
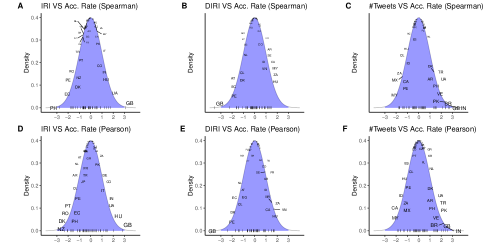
We consider the Infodemic Risk Index (IRI), the Dynamic Infodemic Risk Index (DIRI), and the number of Tweets. In particular, the IRI is “estimated indirectly on the basis of the number of followers of users who tweeted, retweeted or quoted unreliable news about COVID-19”, the DIRI is “estimated directly from users’ online endorsement and engagement to evaluate at which rate an user interacts with online messages pointing to potentially unreliable sources of misinformation or disinformation about COVID-19” [23] while the number of Tweets is a simple count.
As shown in Figure 5, we find that the observed correlations are compatible with a null model in which the relationship between infodemics indices and vaccine acceptance rates is randomised (i.e., the infodemic index of country X is paired with the curve concerning vaccine acceptance of a randomly extracted country Y, and then the correlation between these two signals is measured, see Methods). In fact, we note that (on average) 66%, 93% and 99% of the observed correlations fall within one, two and three standard deviations of the normal distributions deriving from the null model (further details are reported in Table 4 and Figure 9 of SI). This finding corroborates the hypothesis of a weak or absent link between the exposure to an overabundance of information on social media platforms and offline behaviours.
Discussion
Our investigation shows that vaccine acceptance has been mostly stable since vaccines were first released, in stark contrast with the major changes in vaccine-related information production and consumption observed on social media platforms over the same period.
Vaccines for COVID-19 were approved for emergency use. The information landscape became unavoidably turbulent and subject to continuous updates of scientific evidence from many information providers. Great concern was expressed towards the possible impact of misinformation that, leveraging the absence of an established and scientifically shared consensus about vaccines, could limit the effectiveness of vaccination campaigns. More generally, an open research question is whether infodemics might orient people’s intention of behaviours. Our results suggest that, at least for COVID-19 vaccinations, this may not be the case, at the aggregated level, and that the evidence is more consistent with the concept of echo chambers enhancing conservatism of opinions. This result highlights a crucial methodological aspect, namely that studying the phenomenon only through the lenses of online social media might lead to misleading conclusions. Indeed, the abrupt increase in information consumption does not seem to pair with the almost steady longitudinal behaviour of the acceptance rates.
It is important to highlight the limitations of our study. First, we considered only two social media platforms (Facebook and Twitter) to measure information spreading. As social media platforms widely differ with respect to their structure, audience and content moderation policy, further investigations are required to reveal possibly different correlation scenarios. Second, we considered only some - albeit prominent - definitions of infodemics. Further possibilities exist, and future studies will be able to assess the consistence of our findings across definitions [32]. Third, we considered a single survey about vaccine acceptance. However, to the best of our knowledge, the COVID-19 Trends and Impact Survey is the only one that has enough granularity to observe immediate reactions to EMA’s investigation. For instance, publicly accessible data from the MIT COVID-19 survey [33] provide only 19 data points over nine months while another available survey involves only low and medium income countries [34]. Finally, another potential limitation comes from the timescale of our investigation. Since building cognitive frames and vaccine hesitancy could be slow processes, the analysis of short time periods might be unable to capture long term effects. However, COVID-19 vaccines were announced in late 2020 and by mid 2021 the vaccination campaign was mature in the considered countries, hence short time effects (or lack thereof) are crucial in this case. On a broader perspective, it is clear that further studies should investigate under which circumstances the link between online information consumption and offline behaviour weakens or strengthens.
Methods
Data Collection
Data from Facebook and Twitter were collected covering the period going from 1 January 2020 to 30 April 2021.
Posts from Facebook were collected using Crowdtangle [35], a Facebook-owned tool that tracks interactions on public content from Facebook pages and groups, verified profiles, not including paid advertising. The keyword search was performed by searching for all the possible inflections of the following terms: “immune”, “dose”, “vaccine”, and “pharma”. The search was then extended in order to include vaccines and relative brands. The aforementioned keywords and their inflections were then translated into native languages of the six countries that were taken into account.
Topic Modelling
To perform topic modelling we followed the procedure illustrated in [36]. For each element of a corpus comprising several posts (including tweets and Facebook posts) we computed an embedding, i.e. a vector representation, through BERT [37], a state-of-the-art Natural Language Processing engine. After encoding the corpus (with a number of elements) we obtain a matrix representing our corpus of size , where is the dimension of the embedding representation. We leveraged the pre-trained model “paraphrase-mpnet-base-v2”, yielding an embedding of size . The encoding of the sentences was obtained through the sBERT package [38]. Next, to extract the leading topics from the encoded corpus, we applied the HDBSCAN [39] clustering algorithm to the rows of matrix (after reducing the dimension of the embedding space to 5, via the UMAP algorithm [40]). Once all the posts were clustered, we obtained a collection of documents each corresponding to a given topic. To extract the most relevant words, we computed the tf-idf statistics and selected the words with the highest score. The described procedure was applied to 500000 randomly sampled posts, so to fit our computational resources.
Null model
We performed the following statistical analysis to assess the significance of the correlations observed in real data. For countries (we excluded Taiwan from the analysis since infodemic indicators were unavailable for this country) we consider time series of IRI, DIRI and #Tweets and the vaccine acceptance rate; each time series spans from 23 January to 30 April 2021. Let us consider the case of IRI for simplicity. First, we compute Spearman correlation coefficient for each country, obtaining an empirical distribution with average and standard deviation . Next, we compute the correlation for all possible country pairs, obtaining correlation values. For instance, while in the empirical case the IRI of Denmark is compared against the vaccine acceptance rate of Denmark, in the randomisation process we compare the IRI of Denmark with that of all the other countries except Denmark and we iterate this comparison over all countries. We obtain a null gaussian-like distribution parametrised by , . Next, we standardise correlation values (both randomised and empirical) computing
We also repeat the same procedure computing the Pearson correlation coefficient between the three infodemic indicators and the vaccine acceptance rate. The distribution of is reported in Figure 5.
Acknowledgements
The authors acknowledge the 100683EPID Project “Global Health Security Academic Research Coalition” SCH-00001-3391. Walter Quattrociocchi wants to thank Michele Secci for advice and inspiration.
References
- [1] Sahil Loomba, Alexandre de Figueiredo, Simon J. Piatek, Kristen de Graaf, and Heidi J. Larson. Measuring the impact of COVID-19 vaccine misinformation on vaccination intent in the UK and USA. Nature Human Behaviour, 5(3):337–348, 2021.
- [2] Talha Burki. Vaccine misinformation and social media. The Lancet Digital Health, 1(6):e258–e259, 2019.
- [3] Gordon Pennycook, Jonathon McPhetres, Yunhao Zhang, Jackson G Lu, and David G Rand. Fighting COVID-19 misinformation on social media: Experimental evidence for a scalable accuracy-nudge intervention. Psychological Science, 31(7):770–780, 2020.
- [4] Katrin Schmelz. Enforcement may crowd out voluntary support for COVID-19 policies, especially where trust in government is weak and in a liberal society. Proceedings of the National Academy of Sciences, 118(1):e2016385118, 2020.
- [5] Junchuan Fan, Yao Li, Kathleen Stewart, Anil R. Kommareddy, Andres Garcia, Jinyi Ma, Zheng Liu, Joe O’Brien, Adrianne Bradford, Xiaoyi Deng, Samantha Chiu, Frauke Kreuter, Neta Barkay, Alyssa Bilinski, Brian Kim, Tal Galili, Daniel Haimovich, Sarah LaRocca, Stanley Presser, Katherine Morris, Joshua A Salomon, Elizabeth A. Stuart, Ryan Tibshirani, Tali Alterman Barash, Curtiss Cobb, Andi Gros, Ahmed Isa, Alex Kaess, Faisal Karim, Roee Eliat, Ofir Eretz Kedosha, Shelly Matskel, Roee Melamed, Amey Patankar, Irit Rutenberg, Tal Salmona, and David Vannette. COVID-19 world symptom survey data API., 2020. Carnegie Mellon University, Pennsylvania, United States.
- [6] Eytan Bakshy, Solomon Messing, and Lada A Adamic. Exposure to ideologically diverse news and opinion on Facebook. Science, 348(6239):1130–1132, 2015.
- [7] Michela Del Vicario, Alessandro Bessi, Fabiana Zollo, Fabio Petroni, Antonio Scala, Guido Caldarelli, H. Eugene Stanley, and Walter Quattrociocchi. The spreading of misinformation online. Proceedings of the National Academy of Sciences, 113(3):554–559, 2016.
- [8] Cass R Sunstein. #Republic. Princeton University Press, 2017.
- [9] Lada A Adamic and Natalie Glance. The political blogosphere and the 2004 US election: divided they blog. In Proceedings of the 3rd International Workshop on Link Discovery, pages 36–43, 2005.
- [10] Seth Flaxman, Sharad Goel, and Justin M Rao. Filter bubbles, echo chambers, and online news consumption. Public Opinion Quarterly, 80(S1):298–320, 2016.
- [11] Michela Del Vicario, Gianna Vivaldo, Alessandro Bessi, Fabiana Zollo, Antonio Scala, Guido Caldarelli, and Walter Quattrociocchi. Echo chambers: Emotional contagion and group polarization on Facebook. Scientific Reports, 6(1), 2016.
- [12] Alexander J Stewart, Mohsen Mosleh, Marina Diakonova, Antonio A Arechar, David G Rand, and Joshua B Plotkin. Information gerrymandering and undemocratic decisions. Nature, 573(7772):117–121, 2019.
- [13] Ludovic Terren and Rosa Borge-Bravo. Echo chambers on social media: A systematic review of the literature. Review of Communication Research, 9:99–118, 2021.
- [14] Chris Blex and Taha Yasseri. Positive algorithmic bias cannot stop fragmentation in homophilic networks. The Journal of Mathematical Sociology, pages 1–18, 2020.
- [15] Matteo Cinelli, Gianmarco De Francisci Morales, Alessandro Galeazzi, Walter Quattrociocchi, and Michele Starnini. The echo chamber effect on social media. Proceedings of the National Academy of Sciences, 118(9):e2023301118, 2021.
- [16] Soroush Vosoughi, Deb Roy, and Sinan Aral. The spread of true and false news online. Science, 359(6380):1146–1151, 2018.
- [17] Gordon Pennycook and David G Rand. The psychology of fake news. Trends in Cognitive Sciences, 2021.
- [18] John Zarocostas. How to fight an infodemic. The Lancet, 395(10225):676, 2020.
- [19] Matteo Cinelli, Walter Quattrociocchi, Alessandro Galeazzi, Carlo Michele Valensise, Emanuele Brugnoli, Ana Lucia Schmidt, Paola Zola, Fabiana Zollo, and Antonio Scala. The covid-19 social media infodemic. Scientific Reports, 10(1):1–10, 2020.
- [20] Kai-Cheng Yang, Francesco Pierri, Pik-Mai Hui, David Axelrod, Christopher Torres-Lugo, John Bryden, and Filippo Menczer. The covid-19 infodemic: Twitter versus facebook. Big Data & Society, 8(1):20539517211013861, 2021.
- [21] https://www.who.int/teams/risk-communication/infodemic-management.
- [22] Viroj Tangcharoensathien, Neville Calleja, Tim Nguyen, Tina Purnat, Marcelo D’Agostino, Sebastian Garcia-Saiso, Mark Landry, Arash Rashidian, Clayton Hamilton, Abdelhalim AbdAllah, et al. Framework for managing the COVID-19 infodemic: methods and results of an online, crowdsourced who technical consultation. Journal of Medical Internet Research, 22(6):e19659, 2020.
- [23] The covid-19 infodemics observatory. https://covid19obs.fbk.eu/#/.
- [24] Pfizer Team. Pfizer and Biontech conclude phase 3 study of COVID-19 vaccine candidate, meeting all primary efficacy endpoints. https://www.pfizer.com/news/press-release/press-release-detail/pfizer-and-biontech-conclude-phase-3-study-covid-19-vaccine, 2020. Pfizer and BioNTech, United States.
- [25] AZD1222 vaccine met primary efficacy endpoint in preventing COVID-19. https://www.astrazeneca.com/media-centre/press-releases/2020/azd1222hlr.html, 2020. AstraZeneca, London, England.
- [26] Neil F Johnson, Nicolas Velásquez, Nicholas Johnson Restrepo, Rhys Leahy, Nicholas Gabriel, Sara El Oud, Minzhang Zheng, Pedro Manrique, Stefan Wuchty, and Yonatan Lupu. The online competition between pro-and anti-vaccination views. Nature, 582(7811):230–233, 2020.
- [27] COVID-19 vaccine Astrazeneca: PRAC preliminary view suggests no specific issue with batch used in Austria. https://www.ema.europa.eu/en/news/covid-19-vaccine-astrazeneca-prac-preliminary-view-suggests-no-specific-issue-batch-used-austria, 2021. EMA, Amsterdam, The Netherlands.
- [28] COVID-19 vaccine Astrazeneca: PRAC investigating cases of thromboembolic events - vaccine’s benefits currently still outweigh risks. https://www.ema.europa.eu/en/news/covid-19-vaccine-astrazeneca-prac-investigating-cases-thromboembolic-events-vaccines-benefits, 2021. EMA, Amsterdam, The Netherlands.
- [29] Neta Barkay, Curtiss Cobb, Roee Eilat, Tal Galili, Daniel Haimovich, Sarah LaRocca, Katherine Morris, and Tal Sarig. Weights and methodology brief for the COVID-19 symptom survey by University of Maryland and Carnegie Mellon University, in partnership with Facebook. arXiv preprint arXiv:2009.14675, 2020.
- [30] Casey M. Zipfel, Vittoria Colizza, and Shweta Bansal. The missing season: The impacts of the COVID-19 pandemic on influenza. Vaccine, 39(28):3645–3648, 2021.
- [31] Justin Lessler, M. Kate Grabowski, Kyra H. Grantz, Elena Badillo-Goicoechea, C. Jessica E. Metcalf, Carly Lupton-Smith, Andrew S. Azman, and Elizabeth A. Stuart. Household COVID-19 risk and in-person schooling. Science, 372(6546):1092–1097, 2021.
- [32] Felix M Simon and Chico Q Camargo. Autopsy of a metaphor: The origins, use and blind spots of the ‘infodemic’. New Media & Society, page 14614448211031908, 2021.
- [33] Collis A., Garimella K., Rahimian M.A. Moehring A., Babalola S., Gobat N., Shattuck D., J. Stolow, Eckles D., and Aral S. Global survey on covid-19 beliefs, behaviors, and norms. Technical report, MIT Sloan School of Management, 2020.
- [34] Julio S Solís Arce, Shana S Warren, Niccolò F Meriggi, Alexandra Scacco, Nina McMurry, Maarten Voors, Georgiy Syunyaev, Amyn Abdul Malik, Samya Aboutajdine, Opeyemi Adeojo, et al. Covid-19 vaccine acceptance and hesitancy in low-and middle-income countries. Nature medicine, 27(8):1385–1394, 2021.
- [35] CrowdTangle Team. Crowdtangle. 2020. Facebook, Menlo Park, California, United States.
- [36] Maarten Grootendorst. BERTopic: Leveraging BERT and c-TF-IDF to create easily interpretable topics. https://github.com/MaartenGr/BERTopic, 2020.
- [37] Jacob Devlin, Ming-Wei Chang, Kenton Lee, and Kristina Toutanova. BERT: Pre-training of deep bidirectional transformers for language understanding. arXiv preprint arXiv:1810.04805, 2019.
- [38] Nils Reimers and Iryna Gurevych. Sentence-BERT: Sentence embeddings using siamese BERT-networks. In Proceedings of the 2019 Conference on Empirical Methods in Natural Language Processing. Association for Computational Linguistics, 2019.
- [39] Leland McInnes, John Healy, and Steve Astels. hdbscan: Hierarchical density based clustering. The Journal of Open Source Software, 2(11), 2017.
- [40] Leland McInnes, John Healy, and James Melville. UMAP: Uniform manifold approximation and projection for dimension reduction. arXiv preprint arXiv:1802.03426, 2020.
Supplementary Information
| Country | Vaccine keywords | Brand Keywords | |||
|---|---|---|---|---|---|
| Denmark |
|
AstraZeneca, BioNTech, CanSino, CureVac, Jassen, Johnson & Johnson, Moderna, Novavax, Pfizer, Sinopharm, Sputnik | |||
| France |
|
||||
| Germany |
|
||||
| Italy |
|
||||
| Spain |
|
||||
| United Kingdom |
|
| Astrazeneca |
|
|||
|---|---|---|---|---|
| Moderna | mRNA-1273, moderna, Moderna | |||
| Pfizer |
|
|||
| J&J |
|
|||
| Sputnik |
|
| Country | SampleSize | Daily Avg. Sample Size | Sd Sample Size | Median | Intercept | Slope | (sd) | (p-value) |
|---|---|---|---|---|---|---|---|---|
| Argentina | 236533 | 2413.602 | 253.5509 | 0.802 | 0.748 | 0.00087 | 0.00007 | 0 |
| Australia | 114623 | 1169.622 | 214.7617 | 0.769 | 0.796 | -0.00074 | 0.0001 | 0 |
| Austria | 61308 | 624.3724 | 122.0722 | 0.716 | 0.749 | -0.00072 | 0.00008 | 0 |
| Belgium | 64553 | 659.3214 | 113.5003 | 0.777 | 0.771 | 0.00014 | 0.00007 | 0.03299 |
| Brazil | 1181246 | 12053.53 | 2249.532 | 0.882 | 0.833 | 0.00077 | 0.00004 | 0 |
| Canada | 195665 | 1996.582 | 361.9683 | 0.797 | 0.809 | -0.00031 | 0.00007 | 0.00003 |
| Chile | 81302 | 829.6122 | 301.6523 | 0.781 | 0.798 | -0.00036 | 0.00011 | 0.00126 |
| Colombia | 197117 | 2011.398 | 296.741 | 0.808 | 0.784 | 0.00041 | 0.00007 | 0 |
| Czech Republic | 85395 | 874.1122 | 224.2357 | 0.68 | 0.664 | 0.00027 | 0.00009 | 0.00438 |
| Denmark | 106951 | 1092.735 | 183.234 | 0.908 | 0.92 | -0.00024 | 0.00005 | 0 |
| Ecuador | 90684 | 925.3469 | 163.4877 | 0.768 | 0.699 | 0.00119 | 0.00008 | 0 |
| Egypt | 85953 | 877.0714 | 123.646 | 0.58 | 0.563 | 0.00028 | 0.0001 | 0.00444 |
| France | 376513 | 3839.378 | 616.8985 | 0.637 | 0.632 | 0.00015 | 0.00005 | 0.0049 |
| Germany | 378931 | 3860.291 | 631.6381 | 0.772 | 0.774 | -0.00007 | 0.00005 | 0.17489 |
| Greece | 74656 | 761.8214 | 121.8735 | 0.768 | 0.76 | 0.00017 | 0.00008 | 0.03889 |
| Hungary | 133041 | 1361.408 | 389.105 | 0.713 | 0.757 | -0.00124 | 0.00015 | 0 |
| India | 352456 | 3596.49 | 862.6574 | 0.754 | 0.704 | 0.00091 | 0.00006 | 0 |
| Indonesia | 136795 | 1395.867 | 307.4061 | 0.791 | 0.75 | 0.00072 | 0.00008 | 0 |
| Italy | 392368 | 4006.092 | 643.2691 | 0.869 | 0.873 | -0.00011 | 0.00003 | 0.00184 |
| Japan | 665633 | 6792.173 | 1051.388 | 0.831 | 0.788 | 0.00077 | 0.00005 | 0 |
| Malaysia | 65897 | 672.4184 | 145.6112 | 0.849 | 0.757 | 0.00136 | 0.00019 | 0 |
| Mexico | 672716 | 6864.449 | 1650.531 | 0.892 | 0.881 | 0.00021 | 0.00002 | 0 |
| Netherlands | 129335 | 1320.367 | 259.6571 | 0.778 | 0.806 | -0.00055 | 0.00006 | 0 |
| New Zealand | 51517 | 525.6837 | 146.8149 | 0.783 | 0.759 | 0.0004 | 0.00008 | 0.00001 |
| Norway | 97071 | 990.898 | 229.0561 | 0.866 | 0.872 | -0.00016 | 0.00007 | 0.03644 |
| Pakistan | 55149 | 562.7449 | 127.2885 | 0.723 | 0.649 | 0.0013 | 0.00014 | 0 |
| Peru | 125468 | 1280.286 | 139.5034 | 0.811 | 0.757 | 0.00096 | 0.00008 | 0 |
| Philippines | 137937 | 1407.52 | 160.547 | 0.67 | 0.583 | 0.00148 | 0.00009 | 0 |
| Poland | 124824 | 1273.306 | 219.1616 | 0.665 | 0.681 | -0.00035 | 0.00007 | 0 |
| Portugal | 128440 | 1310.883 | 404.9535 | 0.857 | 0.854 | 0.00007 | 0.00006 | 0.242 |
| Romania | 79672 | 812.7857 | 174.6214 | 0.592 | 0.725 | -0.0026 | 0.00008 | 0 |
| Russia | 88773 | 905.8469 | 159.4271 | 0.387 | 0.381 | 0.00014 | 0.00009 | 0.12256 |
| South Africa | 71884 | 733.5102 | 147.2221 | 0.674 | 0.645 | 0.00048 | 0.00013 | 0.00033 |
| South Korea | 51499 | 525.5 | 97.51164 | 0.754 | 0.75 | -0.00001 | 0.0001 | 0.90549 |
| Spain | 218042 | 2224.699 | 567.5856 | 0.873 | 0.869 | 0.0001 | 0.00004 | 0.02061 |
| Sweden | 242548 | 2474.684 | 376.1167 | 0.874 | 0.873 | 0.00004 | 0.00004 | 0.4292 |
| Switzerland | 55158 | 562.25 | 103.1644 | 0.678 | 0.667 | 0.00014 | 0.00009 | 0.12402 |
| Taiwan | 144199 | 1471.418 | 363.1374 | 0.651 | 0.696 | -0.00099 | 0.00008 | 0 |
| Thailand | 161474 | 1647.694 | 724.6496 | 0.748 | 0.758 | -0.00025 | 0.00009 | 0.00583 |
| Turkey | 129194 | 1318.306 | 145.3587 | 0.69 | 0.666 | 0.00048 | 0.00007 | 0 |
| Ukraine | 147594 | 1506.061 | 277.8563 | 0.498 | 0.435 | 0.00121 | 0.00007 | 0 |
| United Kingdom | 144973 | 1480.821 | 738.6411 | 0.858 | 0.904 | -0.00112 | 0.00006 | 0 |
| Venezuela | 76974 | 785.449 | 162.0155 | 0.790 | 0.695 | 0.00158 | 0.00008 | 0 |
| Vietnam | 213950 | 2183.163 | 1083.191 | 0.870 | 0.849 | 0.00032 | 0.00009 | 0.00072 |
| Spearman | Pearson | |||||
|---|---|---|---|---|---|---|
| IRI | DIRI | #Tweets | IRI | DIRI | #Tweets | |
| 1 | 72.1 | 69.8 | 60.5 | 65.1 | 67.4 | 62.8 |
| 2 | 95.3 | 95.3 | 88.4 | 88.4 | 95.3 | 93.0 |
| 3 | 97.7 | 97.7 | 100.0 | 100.0 | 97.7 | 100.0 |