1010institutetext: Escuela de Ingeniería Industrial, Facultad de Ingeniería y Ciencias, Universidad Diego Portales, Av. Ejercito 441, Santiago, Chile
1111institutetext: SUPA, Institute for Astronomy, The University of Edinburgh, Royal Observatory, Blackford Hill, Edinburgh, EH9 3HJ, UK 1212institutetext: Max-Planck-Institut für Astronomie, Königstuhl 17, D-69117 Heidelberg, Germany 1313institutetext: ETH Zurich, Institute for Astronomy, Wolfgang-Pauli-Str. 27, CH- 8093, Zurich, Switzerland 1414institutetext: Department of Astronomy, University of Michigan, 1085 S. University, Ann Arbor, MI 48109 1515institutetext: Instituto de Física y Astronomía, Facultad de Ciencias, Universidad de Valparaíso, Av. Gran Bretaña 1111, Valparaíso, Chile 1616institutetext: Núcleo Milenio de Formación Planetaria (NPF), Chile 1717institutetext: DOTA, ONERA, Université Paris Saclay, F-91123, Palaiseau France
Investigating point sources in MWC 758 with SPHERE ††thanks: Based on data collected at the European Southern Observatory, Chile under programs 096.C-0241 and 1100.C-0481
Abstract
Context. Spiral arms in protoplanetary disks could be shown to be the manifestation of density waves launched by protoplanets and propagating in the gaseous component of the disk. At least two point sources have been identified in the L band in the MWC 758 system as planetary mass object candidates.
Aims. We used VLT/SPHERE to search for counterparts of these candidates in the H and K bands, and to characterize the morphology of the spiral arms .
Methods. The data were processed with now-standard techniques in high-contrast imaging to determine the limits of detection, and to compare them to the luminosity derived from L band observations.
Results. In considering the evolutionary, atmospheric, and opacity models we were not able to confirm the two former detections of point sources performed in the L band. In addition, the analysis of the spiral arms from a dynamical point of view does not support the hypothesis that these candidates comprise the origin of the spirals.
Conclusions. Deeper observations and longer timescales will be required to identify the actual source of the spiral arms in MWC 758.
Key Words.:
Stars: individual (MWC758) – planetary systems: protoplanetary disks – Techniques: image processing – Techniques: high angular resolution1 Introduction
While studies of the demographics of exoplanets are well underway, the processes leading to planet formation are still poorly constrained. Understanding how planets form is a vast topic which requires theoretical works, but the most compelling facts could be provided by the direct observation of very young systems, of a few Myrs old in age, which is precisely the moment when planets are still in the formation stage. Regardless of the difficulty in determining the ages of young systems, they are still very much embedded in their envelope. Opacity effects are critical and scale inversely with the wavelength, given that long wavelengths in the thermal regime are more appropriate for reaching the midplane of a disk, whereas short wavelengths in the scattered light regime trace the surface of flared protoplanetary disks.
In such conditions, finding evidence of exoplanets could rely on dynamically induced structures, with observable signatures in the disk morphology. One obvious case is the presence of spiral arms, which - in the case of disks that are not especially massive - could be attributed to density waves launched by planets (Goldreich & Tremaine, 1980), but also potentially by other types of perturbations (e.g. vortices). In this context, MWC 758 is of particular interest as a protoplanetay disk with two prominent spiral arms observed in scattered light (Grady et al., 2013; Benisty et al., 2015).
While Benisty et al. (2015) show that reproducing the shape of the spiral arms with planets located within the 50 au cavity would require an unphysical hot disk, Dong et al. (2015) found that outer planets with a few Jupiter masses, orbiting at 100 au, could explain the large pitch angle. More recently, to match the spiral patterns in scattered light, as well as the vortices identified in the submillimeter (Dong et al., 2018), Baruteau et al. (2019) proposed two planets of 1.5 and 5 , located at 35 and 140 au, respectively. Finding objects responsible for the propagation of density waves has been attempted in the L band to benefit from a lower star-planet contrast and lower dust extinction. Two independent studies, using Keck telescope and the Large Binocular Telescope (LBT), respectively, have reported two distinct point source candidates but with a low significance: one located at 20 au from the star (Reggiani et al., 2018) that is residing inside the sub-millimeter cavity, while the second (Wagner et al., 2019) is orbiting at 100 au, thus showing itself to be potentially in line with the Dong et al. (2015) predictions.
The purpose of this letter is to explore the detection limits provided by SPHERE (Beuzit et al., 2019), the high-contrast imaging instrument at the Very Large Telescope, based on two data sets obtained in 2016 and 2018 in the H and Ks bands.
2 Observations and data reduction
| Date UT | Filter | Fov rotation | DIT | Nexp | Texp | seeing | Flux var. | TN | |
|---|---|---|---|---|---|---|---|---|---|
| (∘) | (s) | (s) | (′′) | (ms) | (%) | (∘) | |||
| 2016-01-01 | IRDIS - K1K2 | 24.91 | 64 | 80 | 5120 | 11.2 | |||
| 2016-01-01 | IFS - YH | 23.15 | 64 | 80 | 5120 | 9.6 | |||
| 2018-12-17 | IRDIS - H2H3 | 29.07 | 96 | 64 | 6144 | 4.3 | |||
| 2018-12-17 | IFS - YJ | 29.23 | 96 | 64 | 6144 | 3.9 |
MWC 758 (HIP 25793, V=8.27, H=6.56, K=5.80) was observed as part of the SPHERE survey aimed at the search for planets (SHINE, SpHere INfrared survey for Exoplanets, Desidera et al., 2021). The most recent distance estimate from Gaia DR2 is pc (Gaia Collaboration et al., 2018), which is significantly smaller than the HIPPARCOS distance ( pc) used in Benisty et al. (2015), and slightly larger (but still within the error bars) than the Gaia DR1 value ( pc) used by Reggiani et al. (2018).
We obtained two epochs on 2016-01-01 (096.C-0241) and 2018-12-17 (1100.C-0481), using the IRDIFS-ext mode, which combines IRDIS (Dohlen et al., 2008) in K1K2 (2.110, 2.251 m, R20) and IFS (Claudi et al., 2008) in the YH configuration (0.95-1.55 m, R33), and the IRDIFS mode with IRDIS in H2H3 (1.593, 1.667 m, R30); while the IFS is set in the YJ configuration (0.95-1.35 m, R54). The main parameters of these observations, such as exposure times, atmospheric conditions, and field rotation, are reported in Table 1. In both observations, we used the N_ALC_YJH_S coronagraph (185 mas in diameter), which is designed for wavelengths shorter than the H band. Therefore, the IRDIS 1st epoch observation in K band suffers from a lower contrast.
The observing sequences, and data reduction follow the standard procedure implemented in the SPHERE Data Center as described in Delorme et al. (2017). Further details of the data reduction can be found in several papers, such as Boccaletti et al. (2018). The conditions (seeing, coherence time) were far more appropriate for a high contrast in the second epoch in 2018. The variability of the star’s intensity (as measured during point spread function exposures at the beginning and at the end of the sequence) is an indicator of good stability (4% in 2018 instead of 10% in 2016). Beside, the airmass is rather large (Am1.5) for this target.
We made use of SpeCal (Galicher et al., 2018) to process the data cubes of both IRDIS and IFS with a variety of angular differential imaging (ADI) techniques. In addition, we used custom routines to perform reference differential imaging (RDI) with another star as a calibrator111Other targets observed the same night with the same observing mode, which do not necessarily match the color and magnitude of MWC 758, or an even simpler algorithm to perform spatial filtering.
3 Global description
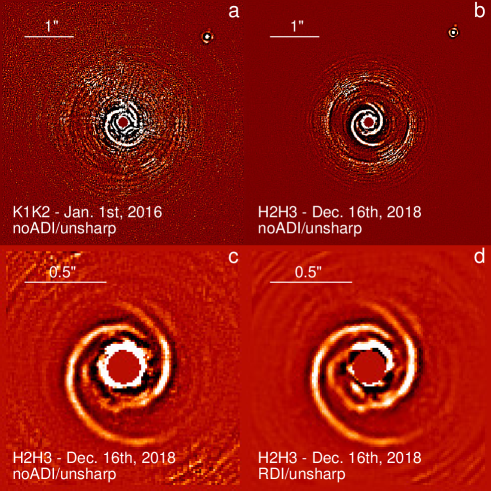
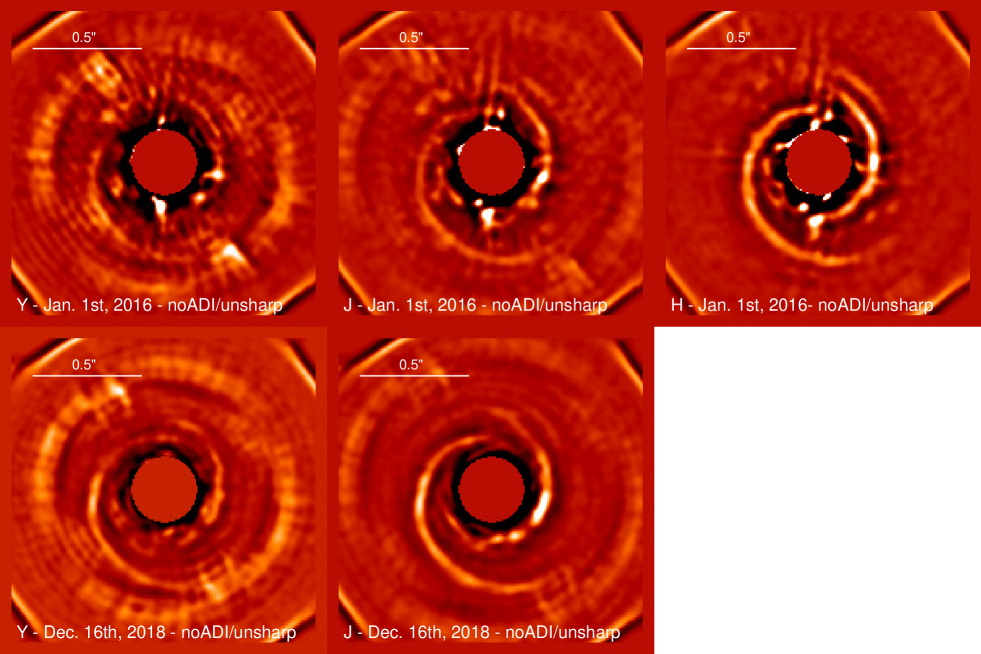
The disk of MWC 758 is quite bright, hence, it is already visible in raw data and stacked images, without any ADI processing (referred as no-ADI). Subtracting the stellar residuals with the coronagraphic images of a reference star (RDI) that were obtained in similar conditions reveals the signal of the disk as close as . Several stars were considered as references observed in the same night in the same configuration, however, here we show the one that provides the best result in terms of the detection of the disk. From these data, we measured in the H2 and H3 filters integrating the disk signal between 0.12′′ and 0.6′′ from the star. Figure 1 displays the noADI and RDI images, further processed with high-pass filtering to enhance the disk structures. The upper panels show a 5′′ field of view, where the previously known background object (Grady et al., 2005) is in fact resolved as two components, with their respective separations and position angles of mas, PA=∘, and mas, PA=∘. The error on the second component is significantly larger because of the brightness ratio (3.7 mag) between the two stars and their proximity (152 mas), which affect the astrometric procedure. The apparent motion between the two epochs is fully consistent with the proper motion of MWC 758.
The images contain several structures that are labeled in Fig. 2, with the spirals S1 and S2 being the most prominent structures. It is relatively difficult to identify precisely where the spirals actually start from the shortest angular separations, but the total intensity data, especially with RDI, definitely provide a higher signal to noise ratio (S/N) of the inner region compared to the DPI image in Benisty et al. (2015) and Ren et al. (2020).
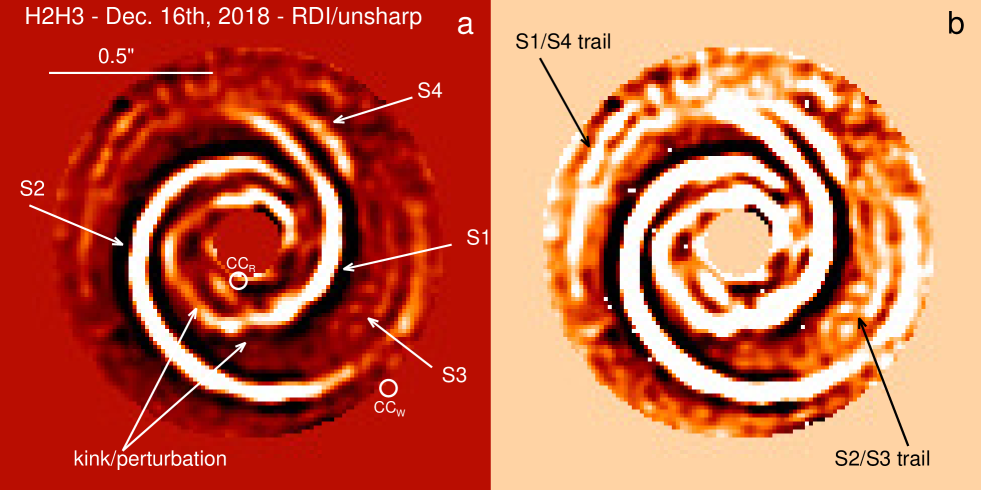
Starting from the shortest separations, S1 visually starts from the northeast (PA=60∘, , although it could even extend as close as the coronagraphic mask) and can be traced over one and a half rotations (Fig. 2a). S2 originates from the northwest (PA=-30∘, ) and can be traced up to the west, covering a full rotation in total. While we note that it is difficult to identify exactly where the spirals start in the interior as there may be confusion with the residual starlight pattern around the coronagraphic mask, there is some evidence that the spirals extend even closer in. Thus, the RDI process (Figure 1d) provides a cleaner vision of the central part than the no-ADI case (Figure 1c). At the other extreme, at low intensity levels, we can also identify the trails of the spirals (Fig. 2b). This is by far the deepest observation of these spiral arms. We also recovered some structures in the southwest of S1 (at ), labeled S3, which could be reminiscent of a feature identified by Reggiani et al. (2018). The SPHERE data presented here convey the possibility that S3 and S4 could be connected (S4 being in the trail of S3). This possible link could have been already posited from the L band data in Reggiani et al. (2018) and has already been established by Calcino et al. (2020) based on hydrodynamical simulations. Thus, S4 could also be considered as the bottom side of the disk in which case the angular separation between S1 and S4, given the inclination of 21∘ is related to the disk opening angle which we estimated to 23∘, indicative of a rather large disk thickness.
While S2 is apparently close to an Archimedean spiral, it is not the case for S1, which appears perturbed in the PA range 60-180∘, with a sort of kink near the location: PA∘, , possibly splitting into two components (Fig. 2b). Although the RDI processing has lower impact on the disk morphology than ADI, the exact distribution of the structures at such stellocentric distances remain to be confirmed. We also present the IFS RDI processed images (Fig. 4) which provide a much lower signal to noise ratio than with IRDIS.
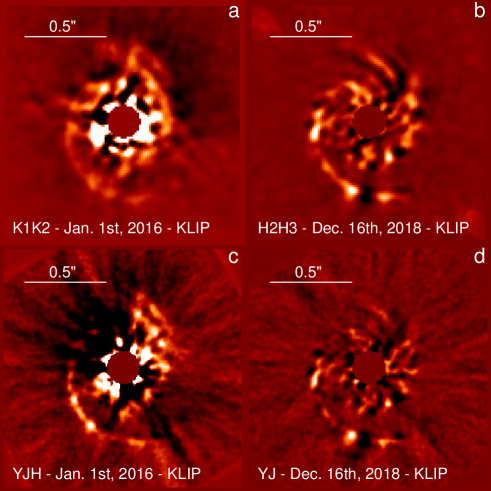
When processed with ADI (Fig. 3), the spirals are no longer visible because of the small field rotation (30∘) which induces a quite strong self-subtraction (Milli et al., 2012). Instead, many structures (consistent with the kink and perturbation seen in RDI) are revealed along the spirals, some of which could be confused with the usual signatures of point sources in ADI. These patterns are consistent across wavelengths between IRDIS and IFS (Fig. 3, b and d for instance). Due to the difference in starlight rejection between the two epochs obtained 3 years apart, it is still difficult to perform a thorough analysis of the evolution of these structures, especially within the sub-millimeter cavity ().
4 Limits of detection to point sources
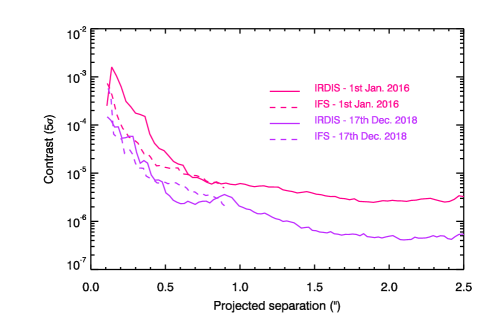
The limits of detection are estimated with SpeCal, as explained in Galicher et al. (2018). Here, we made use of the KLIP algorithm (Soummer et al., 2012) which produces a higher contrast when compared to other types of ADI implementations in this particular case. The contrast at a given radius is calculated from the standard deviation of the signal contained in an annulus of 0.5FWHM in width (about 2 pixels) centered on the star. The self-subtraction induced by ADI is estimated with fake planets injected into the datacube (along a spiral pattern to cover a range of separations and azimuths). The presence of the disk’s spirals and their residuals after ADI processing inevitably corrupts this measurement. Both the self-subtraction and the radial transmission of the coronagraph (as reported in Boccaletti et al., 2018) are taken into account to produce the final contrast plots in Fig 5 (left). The second epoch is significantly better with, for IRDIS, a gain of about one order of magnitude in contrast, in the separation range of (as a result of a sub-optimal coronagraph used in K band and poorer conditions), and a more modest gain of 2 to 4 further out. The gain is less pronounced but still noticeable for the IFS sequences.
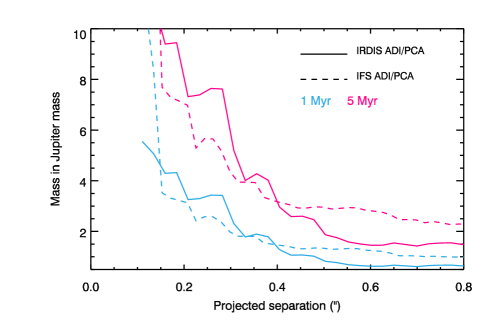
Two point sources were identified from previous L band observations. The first companion candidate (CCR) reported by Reggiani et al. (2018) using Keck is located very close to the star inside the cavity at , , and with a brightness ratio of . The second point source candidate (CCW) was observed with the LBT by Wagner et al. (2019) along the southern spiral at , , and . The locations of these candidate point sources are reported in Fig. 2a and Fig. 6b (not taking into account orbital motions which are presumably small). It is important to note that none of these two observations confirms the other, although this can be a matter related to the signal-to-noise ratio. Indeed, the spiral patterns of the disk are visually better detected in Reggiani et al. (2018) images. Wagner et al. (2019) claimed CCW to be of planetary nature, and its measured band photometry would correspond to a mass of 2 to 5 assuming an age of Myr. Using the COND atmosphere models (Allard et al., 2001), as in Wagner et al. (2019), along with an age estimate of 1 to 5 Myr identical to the one used by Reggiani et al. (2018); Wagner et al. (2019) , the contrast performance of SPHERE at 0.6′′ measured in the H band translates into a mass sensitivity of (Fig. 5, right). The K band data are less constraining as the achieved contrast corresponds to a mass range of . Therefore, the SPHERE observations do not support the presence of a point source at the location of CCW, nor the detection limits are compatible with the expected mass range. Moreover, it is obvious in Fig. 6b that CCW is not located along the trace of the spiral arm with a radial departure of about that is twice the angular resolution of the SPHERE images. Given the level of clumping that is observed from the innermost separations along the spirals and all the way out (Fig. 3), CCW could be a dust feature (although it should be also visible at shorter wavelengths in reflected light), or an artifact given the low signal-to-noise ratio reported in Wagner et al. (2019).
On the contrary, for dynamical reasons, Reggiani et al. (2018) argue that the emission from the closest point source, CCR, cannot originate from its photosphere or it would translate to a mass of 41 to 64 ; hence, in the brown dwarf regime and would have induced a noticeable cavity in the small dust grains distribution. Such a massive companion would have been presumably detected with SPHERE, according to Fig. 5 (right). Instead, the authors postulate that the emission comes for a circumplanetary disk (CPD), the luminosity of which depends on the product of the planet mass () and the accretion rate (). Assuming face-on 1-Myr old disks and constant accretion rate, Zhu (2015) tabulated the absolute magnitudes in near-IR filters for several values of the accretion disk inner radius (from 1 to 4 Jupiter radii). Under this theoretical framework, the photometry of CCR in the L band would correspond to an object of for a moderate accretion rate of /yr (consistent with the limit of detection in H reported by Huélamo et al., 2018). As a comparison, from the L band photometry we can derive the expected absolute magnitude in the H band for such a CPD according to Zhu (2015, Table 1). We found a value ranging from H=7.7 to 10.3 (), while we measured a contrast of , hence, obtaining an absolute magnitude of . Therefore, the non-detection of a point source in SPHERE data at the position of CCR is only marginally consistent with this flux having been produced by a CPD. In fact, this assumption is even less consistent with a non-detection in the K band since () and the L band photometry of a CPD should correspond to .
5 Extinction by the disk
Implicitly, the assessment of detection limits in the previous section assumes the same optical depth at all wavelengths. In a more realistic case, the surrounding disk is expected to produce some extinction and it is necessary to estimate the variation of optical depth between the L band, and the H and Ks bands to derive meaningful conclusions. The optical depth can be assessed using an estimate of the surface density at the position of the companion candidates and a model of the dust opacity. Boehler et al. (2018) considered the disk surface brightness of MWC 758 measured in the continuum with ALMA, and coupled to a radiative transfer model, to derive azimuthally averaged surface density values of the order of ( g/cm2 resp.) at the position of CCW (CCR resp.). Using a dust model in which the composition and the size distribution are consistent with parameters used by Boehler et al. (2018)222The mass fractions are 0.257/0.18/0.563 for silicates, amorphous carbon, and water ice respectively; the size distribution starts from m to mm with a -3.5 power-law exponent, and the dust porosity is 20% (Woitke et al., 2019), we computed dust mass-opacities in the filters of interest, in the H, K, and L’ bands. Combined with the half surface densities estimates (to consider only the amount of dust mass from the disk midplane to the surface) at CCR and CCW locations, we calculated the difference of magnitudes, which are displayed in Tab. 2. However, since water ice is absent from many dust models of protoplanetary disks (Woitke et al., 2019, and this is particularly relevant for the surface layers of disks where most of the opacity in the H/K/L’ bands is produced), we also computed these magnitude differences when the water ice component is removed. The differences of magnitudes (H-L’ and K-L’) can even become negative due to some extinction resonances at specific wavelengths. In the case of the ”standard” particle size distribution starting at m, the magnitude differences between the H/K and L’ bands are small. In the case of a larger minimum size (m), which would correspond to a more evolved/processed dust population, we observe more dispersion in the magnitudes differences. Yet, all the magnitudes extinctions remain below one magnitude, which shows that a large amount of differential extinction is unlikely - an argument with the potential to reconcile present SPHERE observations and previous ones. Furthermore, CCR and CCW inferred companions are massive enough to carve gaps in the disk, which would reduce the dust opacity effects even more.
| Dust min. size | CCR | CCW | ||
|---|---|---|---|---|
| H-L’ | K-L’ | H-L’ | K-L’ | |
| (m) | (mag) | (mag) | (mag) | (mag) |
| silicates+carbon+water ice dust | ||||
| 0.05 | 0.02 | -0.16 | 0.03 | -0.22 |
| 1.0 | -0.42 | 0.39 | -0.57 | 0.51 |
| silicates+carbon dust | ||||
| 0.05 | 0.62 | 0.26 | 0.83 | 0.34 |
| 1.0 | -0.10 | 0.23 | -0.13 | 0.30 |
The detection limits derived in the previous section can be re-visited given the extinctions estimated in Table 2 and in considering the worst-case scenario (one of the two dust compositions). Assuming the H band detection limit would suffer from differential extinction of 0.83 magnitude (resp., 0.34 magnitude in K band) at the location of CCW for the smallest minimum grain size, the mass limit increases to (resp., in K band), which is still lower than (resp., comparable to) the mass inferred by Wagner et al. (2019, ). Larger minimum grain sizes imply either a lower extinctions in H (-0.13 magnitude) or slightly larger in K (0.51 magnitude), which does not, therefore, change drastically the outcome.
In what concerns the object CCR, the extinction moves the limit of sensitivity from , to 9.49 for m, respectively 10.53 for m. In the K band, the sensitivity reaches 8.52 or 8.39 instead of 8.78 depending on the minimum grain size. Comparing with the extrapolated magnitudes of a CPD in the H band () and the K band (), these limits of sensitivity are sufficient to rule out - either partially (H band) or totally (K band) - the presence of a CPD.
We note that at the position of CCW and CCR, the local surface density in sub-micronic/micronic particles could be different from that extrapolated from Boehler et al. (2018), with ALMA measurements tracing the larger ones. Also, additional accretion along planet poles could also make the extinction higher than evaluated, especially in a face-on geometry (Fung & Chiang, 2016).
6 Spirals as tracers of point sources
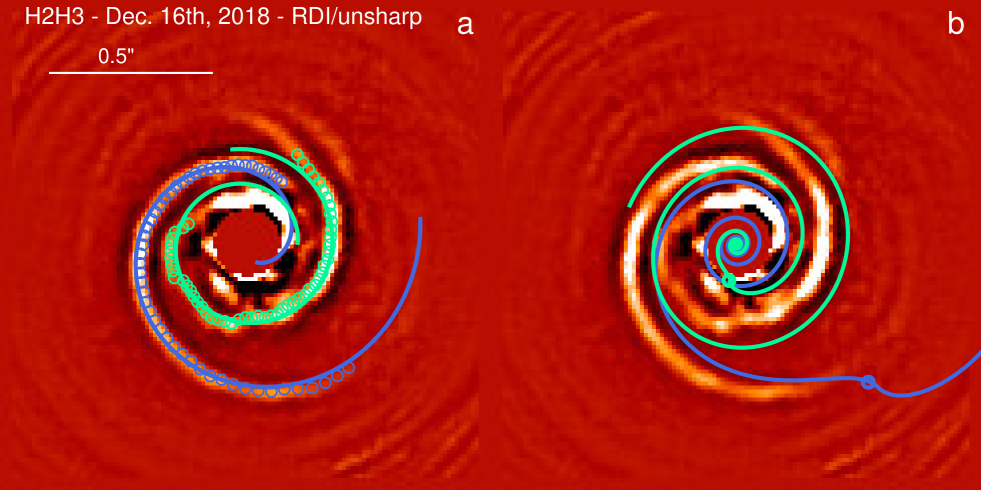
We measured the spine of the two main spirals (S1 and S2) following the method developed in Boccaletti et al. (2013), along with an adequate numerical mask to isolate each spiral (data points are reported in Fig. 6, left). The spirals are relatively well fitted with an archimedean function () in the PA range for S1 (green circles, , , ) and for S2 (blue circles, , , ).
Planetary mass objects in the MWC 758 system can be responsible for the launching of density waves materializing into spiral arms in and out of the planet orbital radius. An obvious test would be to check whether we can associate the spirals S1 and S2 with CCR and CCW. However, a thorough investigation will require dedicated hydrodynamical simulations in 3D which is beyond the scope of this paper. Previous works extensively used the linear approximation to the density waves theory (Rafikov, 2002) to interpret the geometry of spiral arms observed in scattered light (Muto et al., 2012; Boccaletti et al., 2013; Benisty et al., 2015) although this approach has been found unreliable for massive planets and for cases when the spiral wake is localized away from the disk plane, at the disk surface, as in the case for scattered light images (Zhu et al., 2015). Nevertheless, the pitch angle of the outer spiral arm is reduced by the disk 3D structure which compensates for the wake broadening. Hence, the linear theory still provides a decent match for the outer spiral even for a massive planet (several Jupiter masses). With these limitations in mind we performed a qualitative analysis following the prescription of Muto et al. (2012):
| (1) | |||||
where is the disk aspect ratio at the planet location (, ), and are the power-law exponents of the angular frequency and temperature profile dependence with (in the standard case , ). In addition, we assumed the disk inclination and position angle: and , together with (Boehler et al., 2018; Andrews et al., 2011). We also accounted for a standard flaring index . Imposing the locations of the two candidate companions CCR and CCW, we calculated the associated spirals launched from these sites (respectively the green and blue lines in Fig. 6, right).
Focusing on the outer arms of the spirals, beyond the planets orbital radii, we found no obvious match between these spiral models and those observed in the data. This may suggest that the perturber(s) could be much less massive or they could be located at smaller physical distances (or both). Again, we caution that the density wave linear theory does not capture the complexity of this system and cannot be taken as a definitive result in this case. A more elaborate modeling is proposed in Calcino et al. (2020), which qualitatively reproduces the main disk features assuming a 10 MJ planet at 33.5 au (about ) with some eccentricity ().
As long as planet-induced spirals are co-rotating with the planets, we can also consider dynamical arguments to evaluate the amount of expected rotation of the spirals. For an object at the position of , and , we expect an angular motion between the two epochs (2.96 years apart) of , respectively, for a central star with a mass of 1.7M⊙ (average value in the literature). Therefore, we can safely reject as being the source of the spiral arms, as also derived by Ren et al. (2020). To obtain a more precise estimate of the spiral rotation, we isolated the spiral S2 with a numerical mask in the high-pass filtered RDI images from Fig. 1 (we ignore S1 as being significantly contaminated by diffraction residuals in Jan. 2016 data), deprojected the images, multiplied by the square of the stellocentric distance to give more weight to the outer parts of the spiral, and then we solved for the rotation angle which minimizes the difference between the two epochs with a least square metric. While the exact value depends on the image processing (masking and radial weighting, in particular), we can reasonably constrain the rotation to on the 2.96 years time frame, which means we can exclude a planet at a distance shorter than 280 au for being a candidate for the launching of the spirals. Such an upper limit is about four times smaller than the expected rotation induced by . We note that this is slightly lower than the value derived by Ren et al. (2020, /yr), who carefully estimated the error budget (but it is still not compatible with ).
7 Conclusion
We imaged the system MWC 758 with SPHERE as part of the near-IR survey at two epochs in Jan. 2016 and Dec. 2018. The data were processed with angular differential imaging to optimize the sensitivity to point sources, as well as with reference differential imaging to determine the morphology of the spirals. We did not recover the previously detected point sources reported by Reggiani et al. (2018) and Wagner et al. (2019), nor did we detect other potential companions. Since former detections were obtained at longer wavelengths, namely, in the L band, in which the self-luminous objects of interest (planet photospheres or circumplanetary disks) are expected to be brighter than in SPHERE band passes, we extrapolated their magnitudes to the H and K bands and compared them against the SPHERE limits of detection. We also accounted for the extinction arising from the presence of dust based on ALMA observations. Overall, the SPHERE data may rule out the presence of these candidate companions, especially in the K band (and although contrast performance is worse than in the H band). In addition, no satisfactory solution can be found with linear density-wave models of the spirals arms that assume the spiral-driving planets are located at the position of CCR and CCW. Finally, the amount of rotation of the spirals between the two epochs also sets stringent limit on the stellocentric distance of planetary mass companions shaping the spirals. Therefore, at this stage, pending methods than would allow greater contrasts can be reached - or finer dynamical studies, the SPHERE observations based on the near-IR survey fails to identify point sources as the source of the MWC 758 spiral arms.
References
- Allard et al. (2001) Allard, F., Hauschildt, P. H., Alexander, D. R., Tamanai, A., & Schweitzer, A. 2001, The Astrophysical Journal, 556, 357
- Andrews et al. (2011) Andrews, S. M., Wilner, D. J., Espaillat, C., et al. 2011, The Astrophysical Journal, 732, 42
- Baruteau et al. (2019) Baruteau, C., Barraza, M., Pérez, S., et al. 2019, MNRAS, 486, 304
- Benisty et al. (2015) Benisty, M., Juhasz, A., Boccaletti, A., et al. 2015, Astronomy & Astrophysics, 578, L6
- Beuzit et al. (2019) Beuzit, J. L., Vigan, A., Mouillet, D., et al. 2019, Astronomy & Astrophysics, 631, A155
- Boccaletti et al. (2013) Boccaletti, A., Pantin, E., Lagrange, A. M., et al. 2013, Astronomy & Astrophysics, 560, A20
- Boccaletti et al. (2018) Boccaletti, A., Sezestre, E., Lagrange, A.-M., et al. 2018, A&A, 614, A52
- Boehler et al. (2018) Boehler, Y., Ricci, L., Weaver, E., et al. 2018, The Astrophysical Journal, 853, 0
- Calcino et al. (2020) Calcino, J., Christiaens, V., Price, D. J., et al. 2020, MNRAS, 498, 639
- Claudi et al. (2008) Claudi, R., Beuzit, J. L., Feldt, M., et al. 2008, in European Planetary Science Congress 2008, 875
- Delorme et al. (2017) Delorme, P., Meunier, N., Albert, D., et al. 2017, in SF2A-2017: Proceedings of the Annual meeting of the French Society of Astronomy and Astrophysics, ed. C. Reylé, P. Di Matteo, F. Herpin, E. Lagadec, A. Lançon, Z. Meliani, & F. Royer, 347–361
- Desidera et al. (2021) Desidera, S., Chauvin, G., Bonavita, M., et al. 2021, arXiv e-prints, arXiv:2103.04366
- Dohlen et al. (2008) Dohlen, K., Langlois, M., Saisse, M., et al. 2008, in Proc. SPIE, ed. I. S. McLean & M. M. Casali, 118
- Dong et al. (2015) Dong, R., Hall, C., Rice, K., & Chiang, E. 2015, The Astrophysical Journal Letters, 812, L32
- Dong et al. (2018) Dong, R., Liu, S.-y., Eisner, J., et al. 2018, ApJ, 860, 124
- Fung & Chiang (2016) Fung, J. & Chiang, E. 2016, ApJ, 832, 105
- Gaia Collaboration et al. (2018) Gaia Collaboration, Brown, A. G. A., Vallenari, A., et al. 2018, A&A, 616, A1
- Galicher et al. (2018) Galicher, R., Boccaletti, A., Mesa, D., et al. 2018, A&A, 615, A92
- Goldreich & Tremaine (1980) Goldreich, P. & Tremaine, S. 1980, ApJ, 241, 425
- Grady et al. (2013) Grady, C. A., Muto, T., Hashimoto, J., et al. 2013, The Astrophysical Journal, 762, 48
- Grady et al. (2005) Grady, C. A., Woodgate, B. E., Bowers, C. W., et al. 2005, The Astrophysical Journal, 630, 958
- Huélamo et al. (2018) Huélamo, N., Chauvin, G., Schmid, H. M., et al. 2018, A&A, 613, L5
- Milli et al. (2012) Milli, J., Mouillet, D., Lagrange, A. M., et al. 2012, Astronomy & Astrophysics, 545, A111
- Muto et al. (2012) Muto, T., Grady, C. A., Hashimoto, J., et al. 2012, ApJ, 748, L22
- Rafikov (2002) Rafikov, R. R. 2002, ApJ, 569, 997
- Reggiani et al. (2018) Reggiani, M., Christiaens, V., Absil, O., et al. 2018, Astronomy & Astrophysics, 611, A74
- Ren et al. (2020) Ren, B., Dong, R., van Holstein, R. G., et al. 2020, The Astrophysical Journal Letters, 898, 0
- Soummer et al. (2012) Soummer, R., Pueyo, L., & Larkin, J. 2012, The Astrophysical Journal Letters, 755, L28
- Wagner et al. (2019) Wagner, K., Stone, J. M., Spalding, E., et al. 2019, The Astrophysical Journal, 882, 0
- Woitke et al. (2019) Woitke, P., Kamp, I., Antonellini, S., et al. 2019, Publications of the Astronomical Society of the Pacific, 131, 064301
- Zhu (2015) Zhu, Z. 2015, The Astrophysical Journal, 799, 16
- Zhu et al. (2015) Zhu, Z., Dong, R., Stone, J. M., & Rafikov, R. R. 2015, The Astrophysical Journal, 813, 88
Appendix A IFS RDI images
Appendix B Limits of detection
Appendix C Models of spiral arms