Intra-unitcell cluster-cluster magnetic compensation and large exchange bias in cubic alloys
Abstract
Composite quantum materials are the ideal examples of multifunctional systems which simultaneously host more than one novel quantum phenomenon in physics. Here, we present a combined theoretical and experimental study to demonstrate the presence of an extremely large exchange bias in the range 0.8 T-2.7 T and a fully compensated magnetic state (FCF) in a special type of Pt and Ni doped Mn3In cubic alloy. Here, oppositely aligned uncompensated moments in two different atomic clusters sum up to zero which are responsible for the FCF state. Our dDensity functional theory (DFT) calculations show the existence of several possible ferrimagnetic configurations with the FCF as the energetically most stable one. The microscopic origin of the large exchange bias can be interpreted in terms of the exchange interaction between the FCF background and the uncompensated ferrimagnetic clusters stabilized due to its negligible energy difference with respect to the FCF phase. We utilize pulsed magnetic field up to 60 T and 30 T static field magnetization measurements to confirm the intrinsic nature of exchange bias in our system. Finally, our Hall effect measurements demonstrate the importance of uncompensated noncoplanar interfacial moments for the realization of large EB. The present finding of gigantic exchange bias in a unique compensated ferrimagnetic system opens up a direction for the design of novel quantum phenomena for the technological applications.
I Introduction
Coexistence of two or more complimentary quantum phenomena in a single material often provides a fertile ground to explore the fundamental correlation between these different events in physics. Apart from basic science, such materials displaying conjugation of different quantum properties, called the composite quantum materials, can also open the door for potential technological applications [1]. Large exchange bias (EB) and fully compensated ferrimagnets (FCF) are two distinct quantum phenomena which can be connected via the common prerequisite of a special type of exchange interaction. EB, which is represented by an asymmetrical offset in the magnetic hysteresis loop, is a measure of unidirectional exchange anisotropy in an exchange coupled magnetic system [2, 3, 4, 5, 6]. EB effect has been studied extensively due to its utmost importance in the field of spintronics, e.g. setting up pinning layer in the giant magnetoresistance (GMR) based devices [7, 8, 9, 10], beating the super-paramagnetic limit in magnetic nano-particle based ultra–high density recording media [11] etc. The EB phenomenon has been studied ubiquitously in the ferromagnetic(FM)-ferrimagnet(FiM) [12], FM-spin glass (SG) [13], antiferromagnetic (AFM)-FiM [14], and AFM-SG [15] systems. Although various models have been proposed to understand the origin of EB [16, 17, 18, 19], an essential requirement of most of the microscopic models is the presence of uncompensated AFM moment at the interface. Hence, the AFM layer plays a crucial role to induce the interface exchange field (HE) and causes the asymmetry in the hysteresis loop. The HE, which is in general inversely proportional to the magnetization(MFM) of the ferromagnet, can be controlled by tuning MFM and the nature of interface.
Although EB effects have been studied in few systems, the phenomenon is rarely observed in FCF materials. The EB phenomenon can be integrated with the FCF to realize a thorough control over the interfacial exchange interactions. FCF are a unique class of materials where the properties of both antiferromagnets (e.g. vanishing net moment) and ferromagnets (e.g. large spin polarization) can be realized in a single system. The magnetic moment at different inequivalent sublattices adds up to give a vanishing net moment in FCF [20, 21, 22, 23, 24]. The fully compensated magnetic state categorically differs from the AFM one, as the latter possesses a magnetic inversion symmetry in contrast to the former. Some of the unique properties and advantages of FCF materials are (i) the presence of nearly zero magnetic moment, which creates no external stray fields, (ii) spin sensitivity without stray magnetic fields, which allows them not to disturb the spin character and makes them ideal for spin-polarized scanning tunneling microscope tips and improved density of circuit integration in a chip, (iii) the low shape anisotropy, which helps in applications in spin injection, etc. In the present study, we have considered a special type of FCF system Mn3In, where the magnetic compensation is achieved by AFM alignment of two atomic clusters (as opposed to individual atomic moment in conventional AFM) in a single unit cell. The presence of a long range FiM/AFM ordering with Neel temperature TN75 K has been reported earlier [25, 26]. We take advantage of the complex/unique atomic arrangement and the presence of intra-unit cell clusters to tune the EB in the system. Our assessment is based on the fact that the magnitude of antisite disorder can be readily modified by the substitution of non-magnetic/magnetic atoms, thereby, tailoring the long range magnetic order to formulate an inhomogeneous magnetic ground state. Interestingly, doping with non-magnetic heavy metals with strong spin-orbit coupling gives us the luxury to play with local crystalline symmetry to induce Dzyaloshinskii-Moriya interaction (DMI). We propose a material platform [Pt and Ni doped cubic Mn3In alloys] that can simultaneously host the existence of large EB and FCF behavior.
| Config. | 4e1 | 4e2 | 4e3 | 4e4 | 6f | 12i | 12i | 6g | E | |
| A | B | A | B | A | A | B | B | in | in | |
| IT | IT | OT | OT | OH | CO | CO | OH | /f.u. | eV/f.u. | |
| NM | - | - | - | - | - | - | - | - | - | 1.68 |
| FiM-1 | 6.26 | 0.147 | ||||||||
| FiM-2 | 0.09 | 0.119 | ||||||||
| FiM-3 | 2.49 | 0.95 | ||||||||
| FiM-4 | 2.94 | 0.121 | ||||||||
| FiM-5 | 0.34 | 0.121 | ||||||||
| FiM-6 | 1.84 | 0.066 | ||||||||
| FiM-7 | 0.05 | 0.052 | ||||||||
| FiM-8 | 4.89 | 0.108 | ||||||||
| FiM-9 | 0.13 | 0 | ||||||||
| FiM-10 | 1.84 | 0.065 | ||||||||
| FiM-11 | 2.37 | 0.113 | ||||||||
| FiM-12 | 4.06 | 0.127 | ||||||||
| FiM-13 | 3.74 | 0.100 |
II Methods
Density functional theory (DFT) [27] calculation was carried out using Viennna simulation pPackage (VASP) [28, 29, 30] with a projected augmented wave basis [31] and the generalized gradient approximated (GGA) exchange-correlation functional of Perdew-Burke-Ernzerhof (PBE) [32]. A plane wave energy cutoff of 400 eV was used. The Brillouin zone integration was done using a 666 -centered k-mesh. Polycrystalline ingots of Mn3-xPtxIn for 0.1, 0.2 and 0.3, and Mn3-yNiyIn with 0.1 and 0.2 were prepared by arc-melting technique. The appropriate ratio of the respective elements were taken and melt under Ar gas atmosphere within the arc melt chamber. As prepared samples were enclosed within a quartz tube under Ar atmosphere. After that, a heat treatment for 8 days at 1073 K temperature was completed and subsequently quenched in the ice water mixture. Room temperature x-ray powder diffraction measurements were performed using a Rigaku SmartLab x-ray diffractometer with a Cu-Kα source to characterize the structural phase. To probe the compositional homogeneity, field emission scanning electron microscope (FESEM) equipped with energy dispersive x-ray (EDX) analysis was utilized. Low field magnetic measurements were carried out using SQUID vibrating sample magnetometer (MPMS-3, Quantum Design) and VSM option in Quantum Design physical property measurement system (PPMS). Transport measurements were performed using Quantum Design PPMS. Pulsed field magnetization measurements up to 60 T were carried out at the Dresden High Magnetic Field Laboratory HLD-HZDR. The 30 T static magnetic field measurements were performed using a vibrating sample magnetometer at the High Field Magnet Laboratory HFML-RU/FOM in Nijmegen.
III THEORETICAL CALCULATION
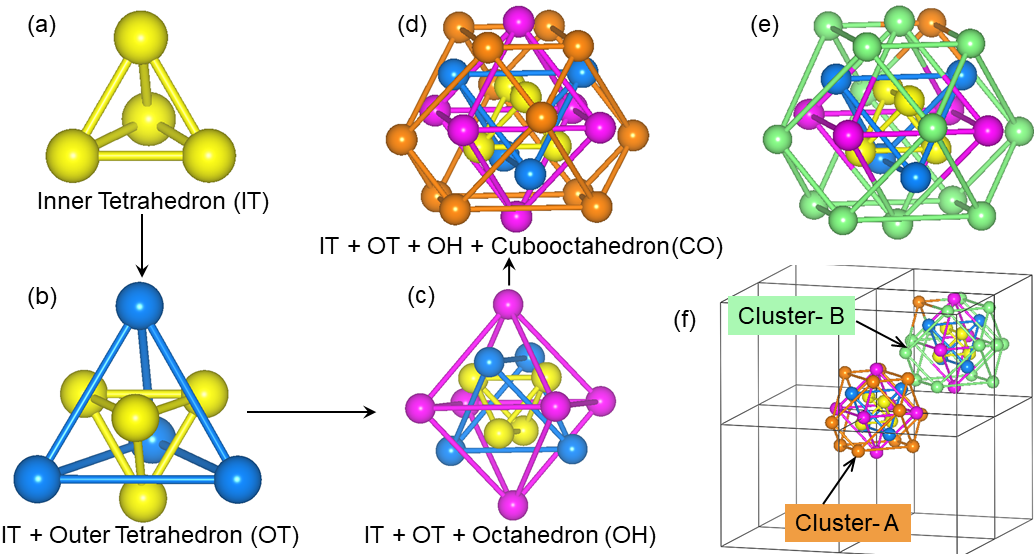
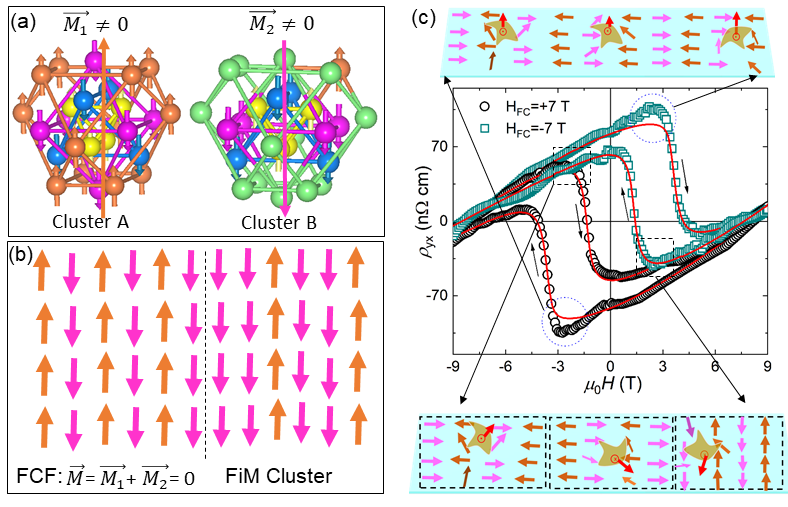
Mn3In crystallizes in a cubic structure with 52 atoms in a unit cell, which comprises of two atomic clusters, each containing 26 atoms and centered at (0, 0, 0) and (0.5, 0.5, 0.5) [33]. To understand the exact nature of atomic arrangement we have decomposed the crystal structure based on the general symmetry analysis as depicted in Fig. 1(a)-(f). Each cluster (labeled A and B) consists of an inner tetrahedron (IT), outer tetrahedron (OT), octahedron (OH) and cubo-octahedron (CO). In case of cluster-A, all the sites are occupied by Mn atoms only [Fig. 1(d)]. For cluster-B, IT and OT are fully occupied by Mn atoms, while OH and CO positions are mostly filled by the Mn and In atoms, respectively (with OH containing two In and rest Mn while CO invloves one Mn and rest In atoms), as shown in Fig. 1(e). The mixed occupancy between Mn and In atoms at the OH and CO sites of cluster-B intrinsically induces antisite disorder in the system. In our study, we mostly concentrate on the Ni and Pt doped Mn3In alloys to facilitate tunable magnetic ordering.
| Conc. | 4e1 | 4e2 | 4e3 | 4e4 | 6f | 6g | 12i | 12i | |||
|---|---|---|---|---|---|---|---|---|---|---|---|
| A | B | A | B | A | B | A | B | ||||
| Mn3In | 0.6 | 1.7 | -2.4 | -2.4 | -2.8 | -3.5 | 3.3 | 3.6 | 14.8 | -13.4 | 0.1 |
| =0.15 | 0.6 | 1.8 | -2.4 | -2.6 | -2.9 | -2.7 | 2.9 | 3.6 | 11.4 | -10.2 | 0.1 |
| =0.15 | 0.6 | 1.8 | -2.4 | -2.9 | -2.7 | -2.7 | 2.9 | 3.6 | 12.3 | -11.2 | 0.1 |
| =0.3 | 0.6 | 2.0 | -2.5 | -2.6 | -2.9 | -1.8 | 2.7 | 3.7 | 8.1 | -5.5 | 0.2 |
| =0.3 | 0.6 | 2.0 | -2.5 | -2.6 | -2.9 | -1.7 | 2.7 | 3.7 | 7.2 | -5.6 | 0.1 |
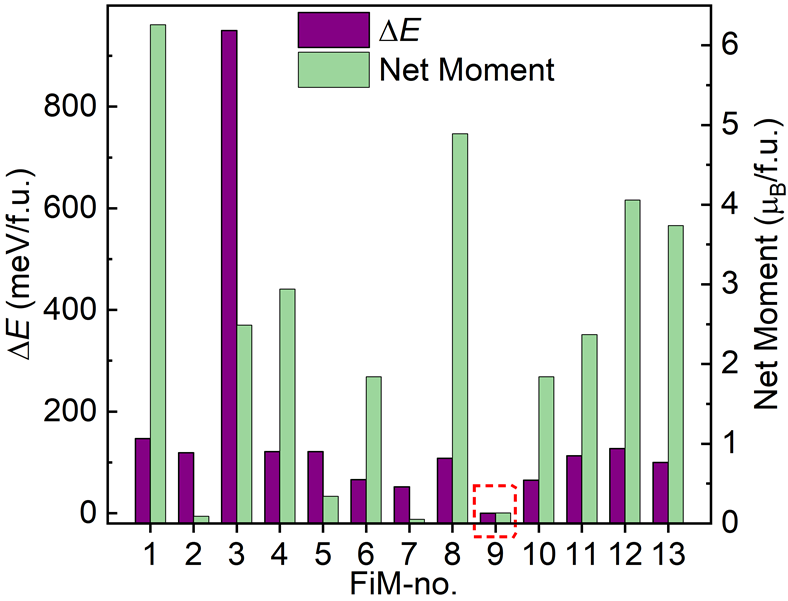
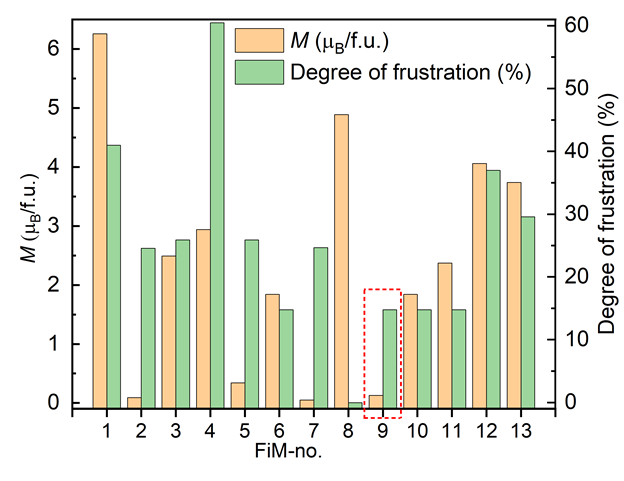
To understand the magnetic ground state of the present systems, we have simulated different spin configurations by varying the spin alignment at various Wyckoff positions of the Mn sublattices within density functional theory (DFT). Figure 2 shows the relative formation energies (E) and net cell moments () of 13 different spin configurations (labelled FiM). The structures of each of these configurations were fully optimized to reach their minimum energy. As evident, FiM-9 turns out to be energetically the most favourable, with negligibly small net moment. The relaxed lattice constant for this configuration is 9.25Å. The exact form of the 13 different spin configurations and their respective E and are given in Table 1. A perfect FM phase could not be stabilized [34]. Keeping in mind the complex nature of magnetic ordering in Mn3In, the degree of frustration around each Mn-sites is quite obvious. We have calculated the total degree of frustration (summing up the frustration at each inequivalent Mn-sites) for all the 13 configurations (see Fig. 18 within the Supplemental Material [35] for details).
The magnetic ground state for the Pt and Ni doped samples are calculated by considering energetically the most stable Mn3In configuration (FiM-9) and then simulating the magnetic structure for Mn2.85(Pt, Ni)0.15In and Mn2.7(Pt, Ni)0.3In. The resulting net cell moments are listed in Table 2 . It is evident that the substitution of Pt in Mn3In does not alter the fully compensated ferrimagnetic behavior of the host material. Most importantly, for all the cases, each individual cluster consists of a large net magnetic moment. The net magnetic moment in cluster-A is almost equal and opposite to that of cluster-B, resulting in a nearly fully compensated magnetic state. One can notice that although FiM-9, with a fully compensated magnetic configuration, is the ground state, a net uncompensated magnetic moment of 1.84 /f.u. can also be found in case of FiM-6 and FiM-10 arrangements with a very small energy difference and almost same degree of frustration to that of FiM-9. Hence, it might be possible to stabilize some uncompensated FiM magnetic clusters within the fully compensated ferrimagnetic host. Therefore, the exchange interaction between the fully compensated FiM host and the uncompensated magnetic clusters can give rise to possible EB effect.
IV STRUCTURAL ANALYSIS
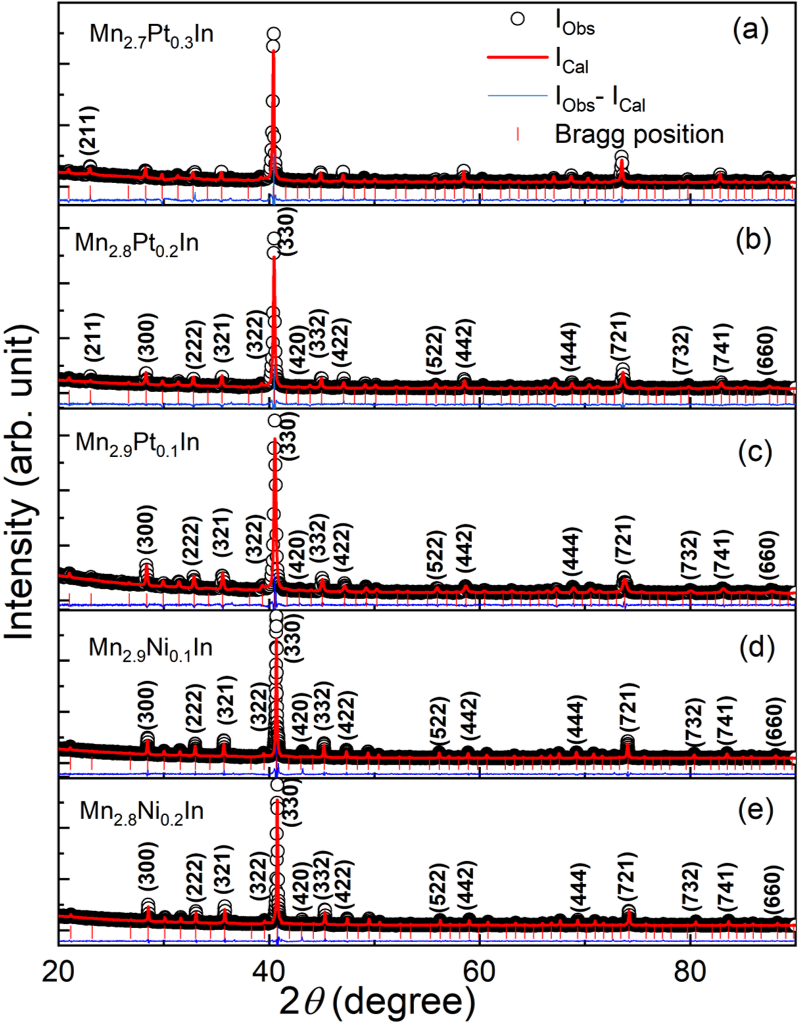
To verify our theoretical propositions, we have synthesized Mn3-xPtxIn and Mn3-yNiyIn samples with 0.1 to 0.3 and 0.1 to 0.2. We only concentrate on the doped samples as it is not possible to stabilize a single structural phase of Mn3In by the present arc-melting technique. The structural phase purity of all the doped samples can be seen from the Rietveld refinement of the room temperature powder x-ray diffraction (XRD) data as depicted in Fig. 3. All the Bragg peaks observed experimentally can be well indexed by incorporating the structural symmetry associated with space group P3m. The lattice parameters and the other agreement factors obtained from Rietveld refinement are tabulated within the Supplemental Material [35]. We have also thoroughly investigated the XRD data to find any site-specific preference of the doping element. As can be seen from the Pt composition-dependent room temperature powder XRD patterns [Fig. 3(a)-3(c)], the Bragg peak (211) is absent in Mn2.9Pt0.1In [Fig. 3(c)]. The intensity of the Bragg peak (211) increased with the increase of Pt concentration, in fact, it is very prominent in Mn2.7Pt0.3In [Fig. 3(a)]. Therefore, we have systematically substituted Pt atoms in all the possible Wyckoff positions to find out any preferentially site occupation. The variation of simulated intensity of the (211) peak for substitution of Pt at different Wyckoff positions in the Mn2.7Pt0.3In is shown in Supplemental Material [35]. In particular, we find a site preferential occupancy of doped Pt, Ni atoms at AOH and BOH sites (see Supplemental Material)[35].
V MAGNETIZATION STUDY
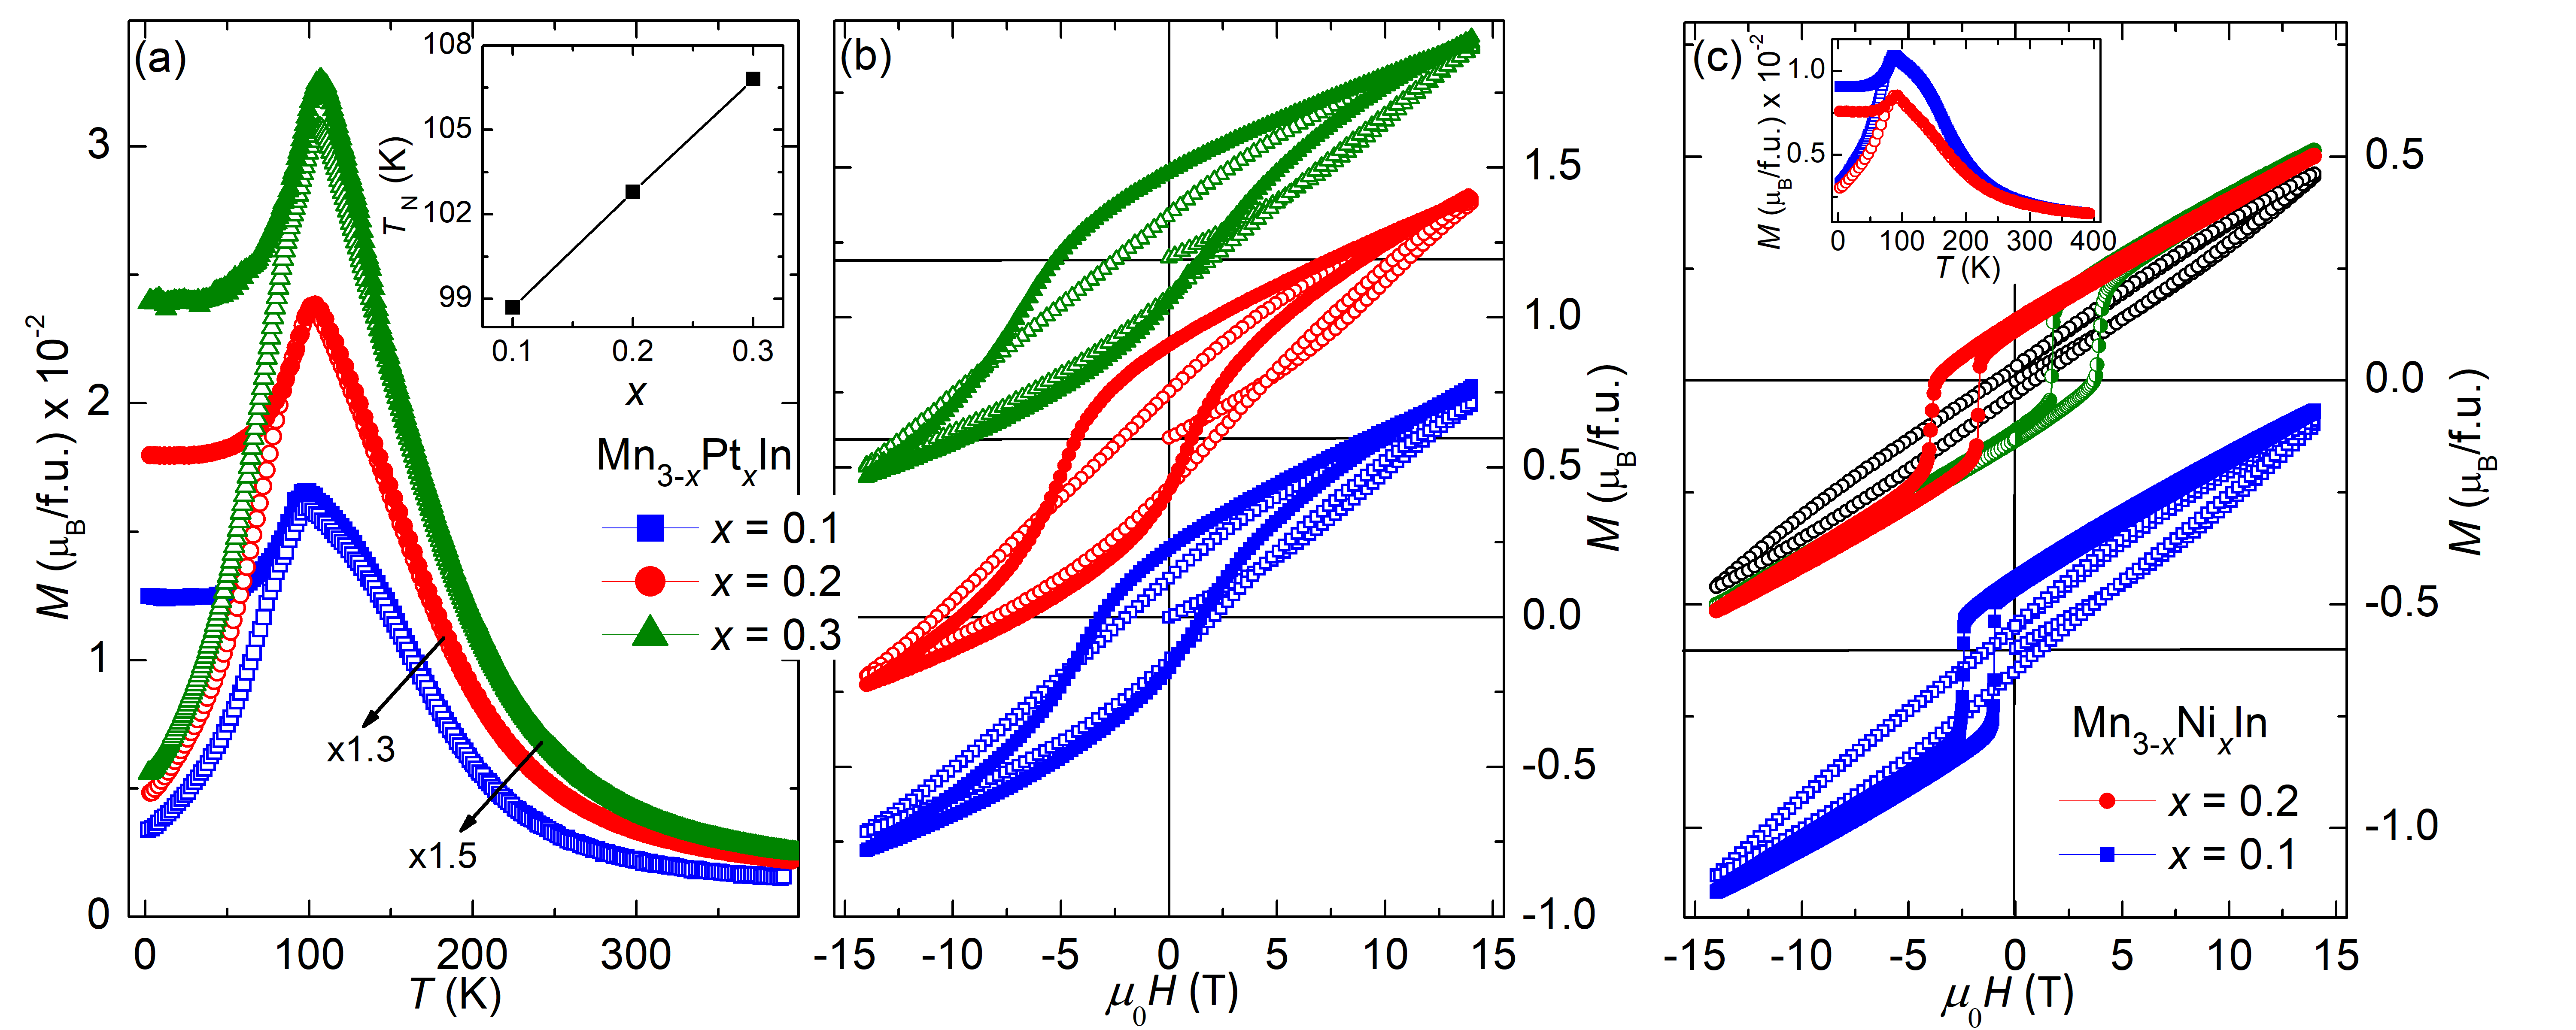
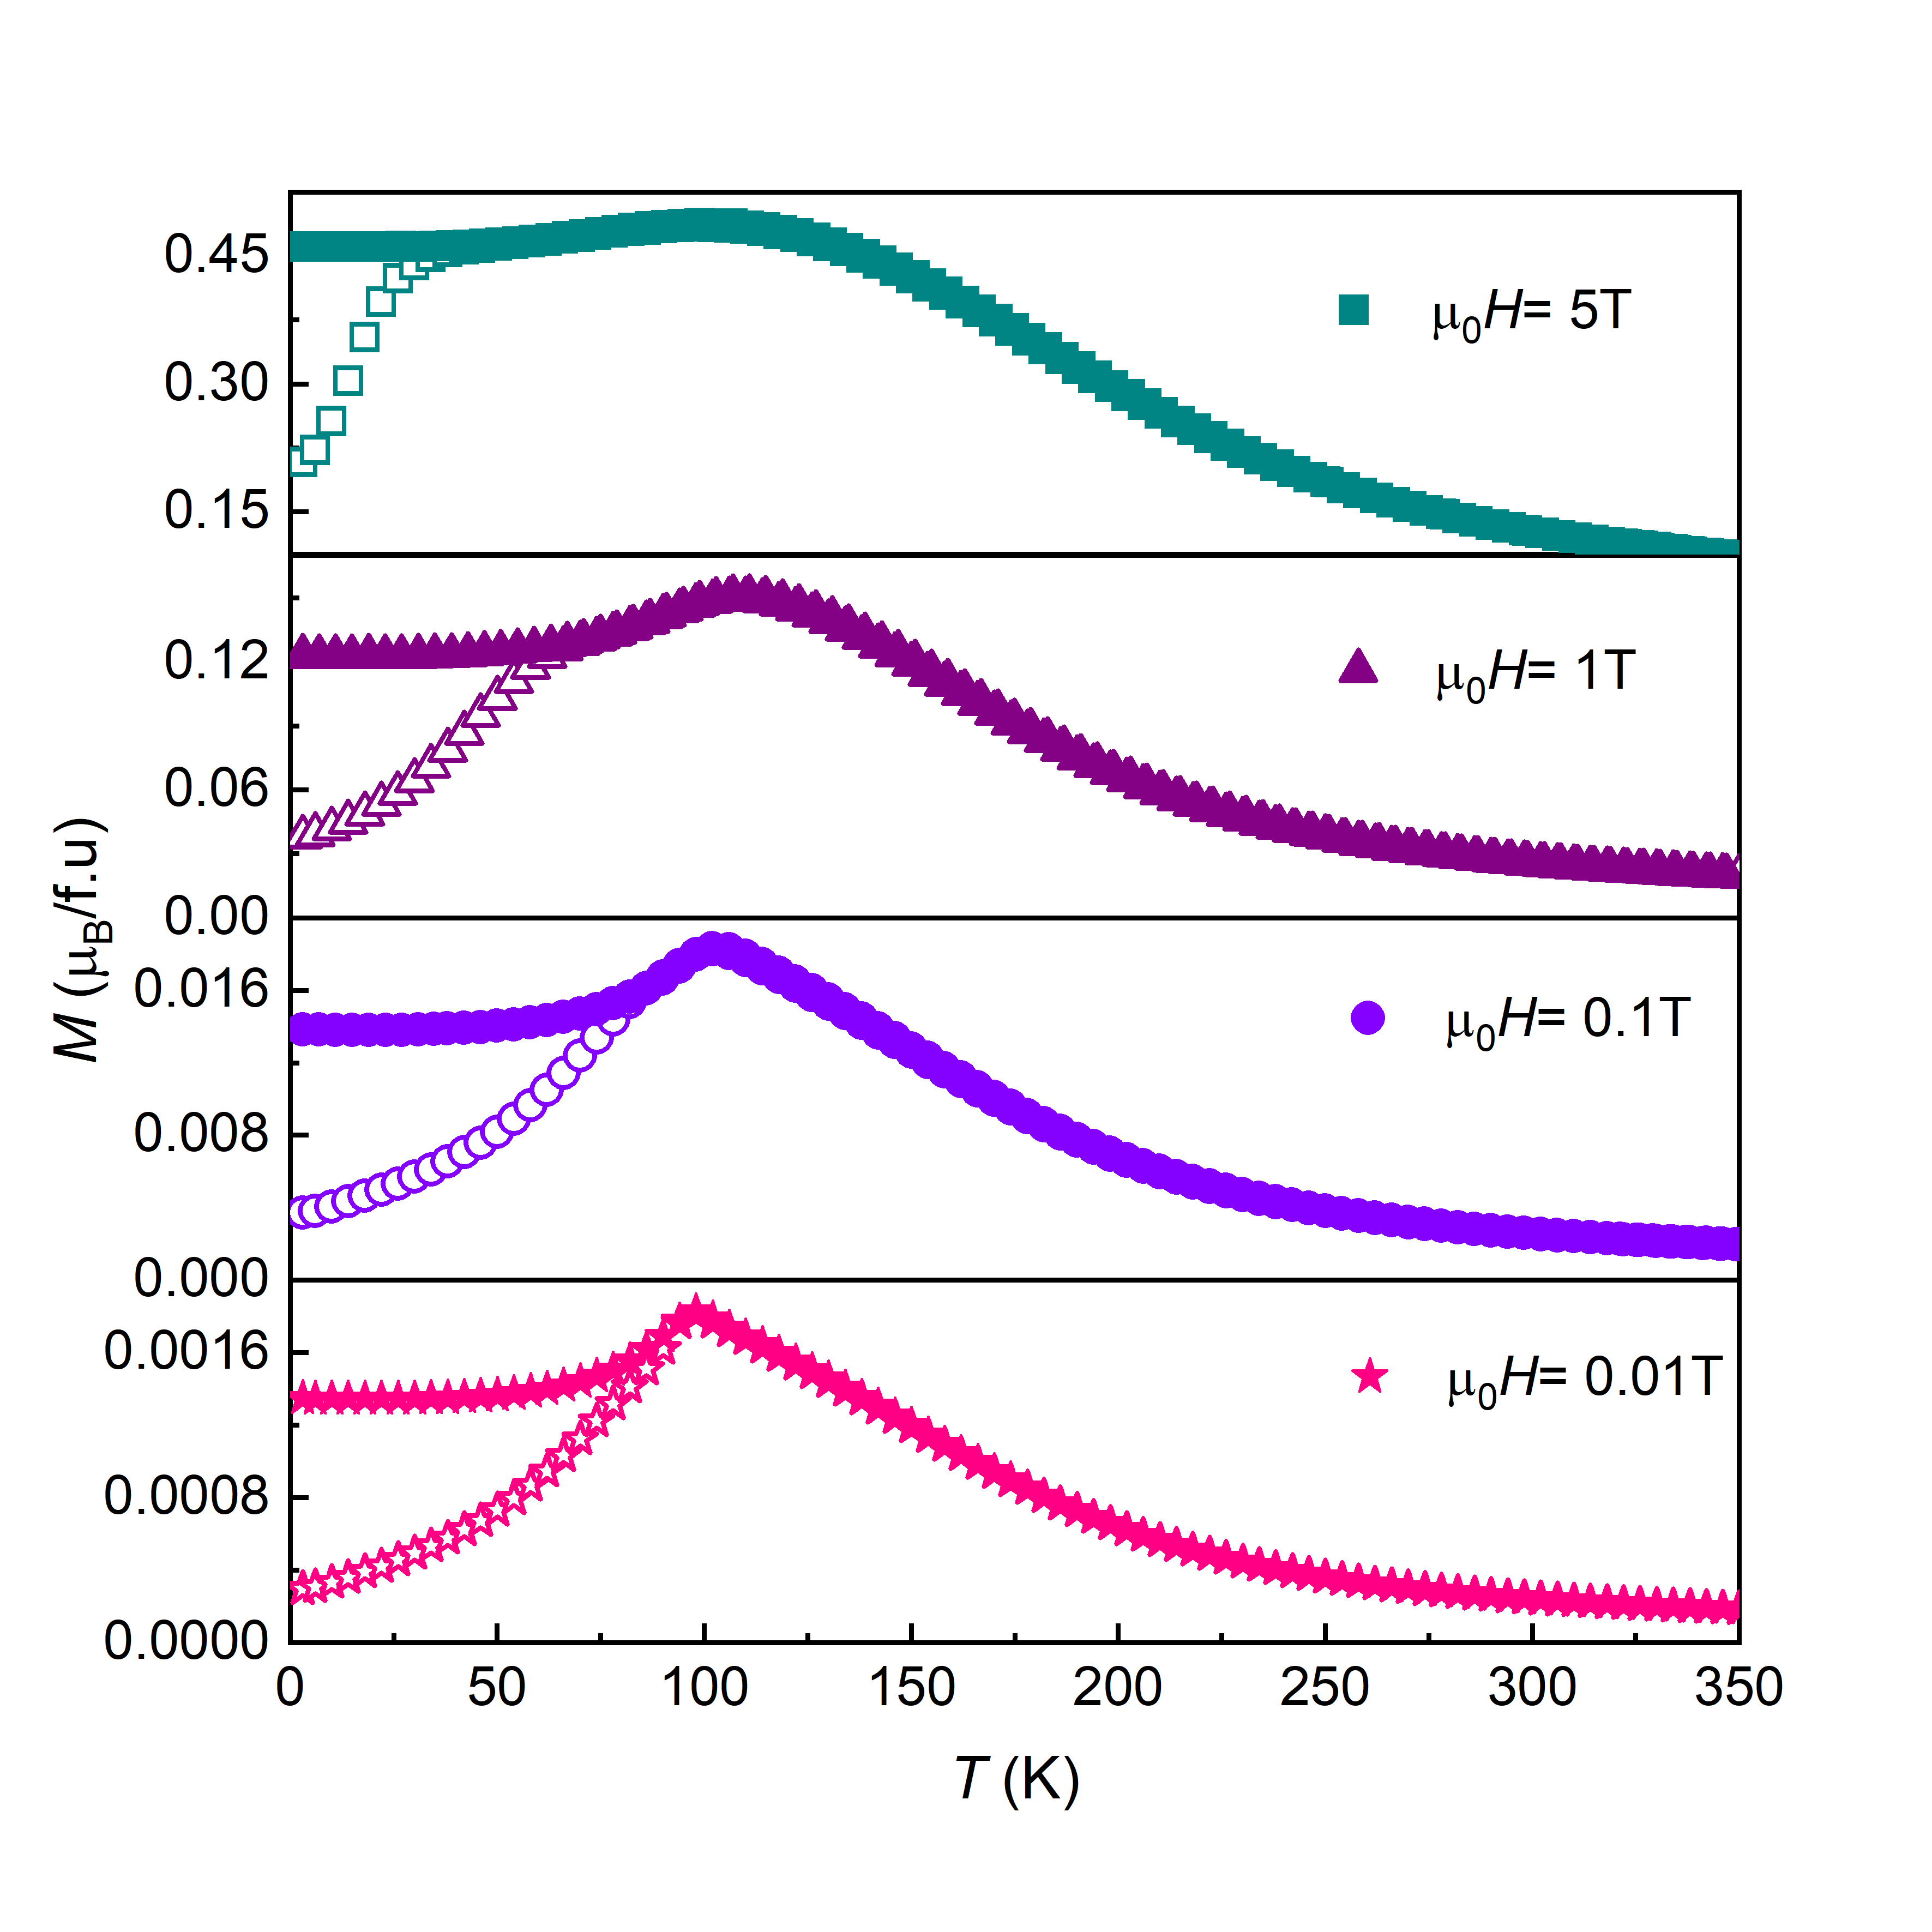
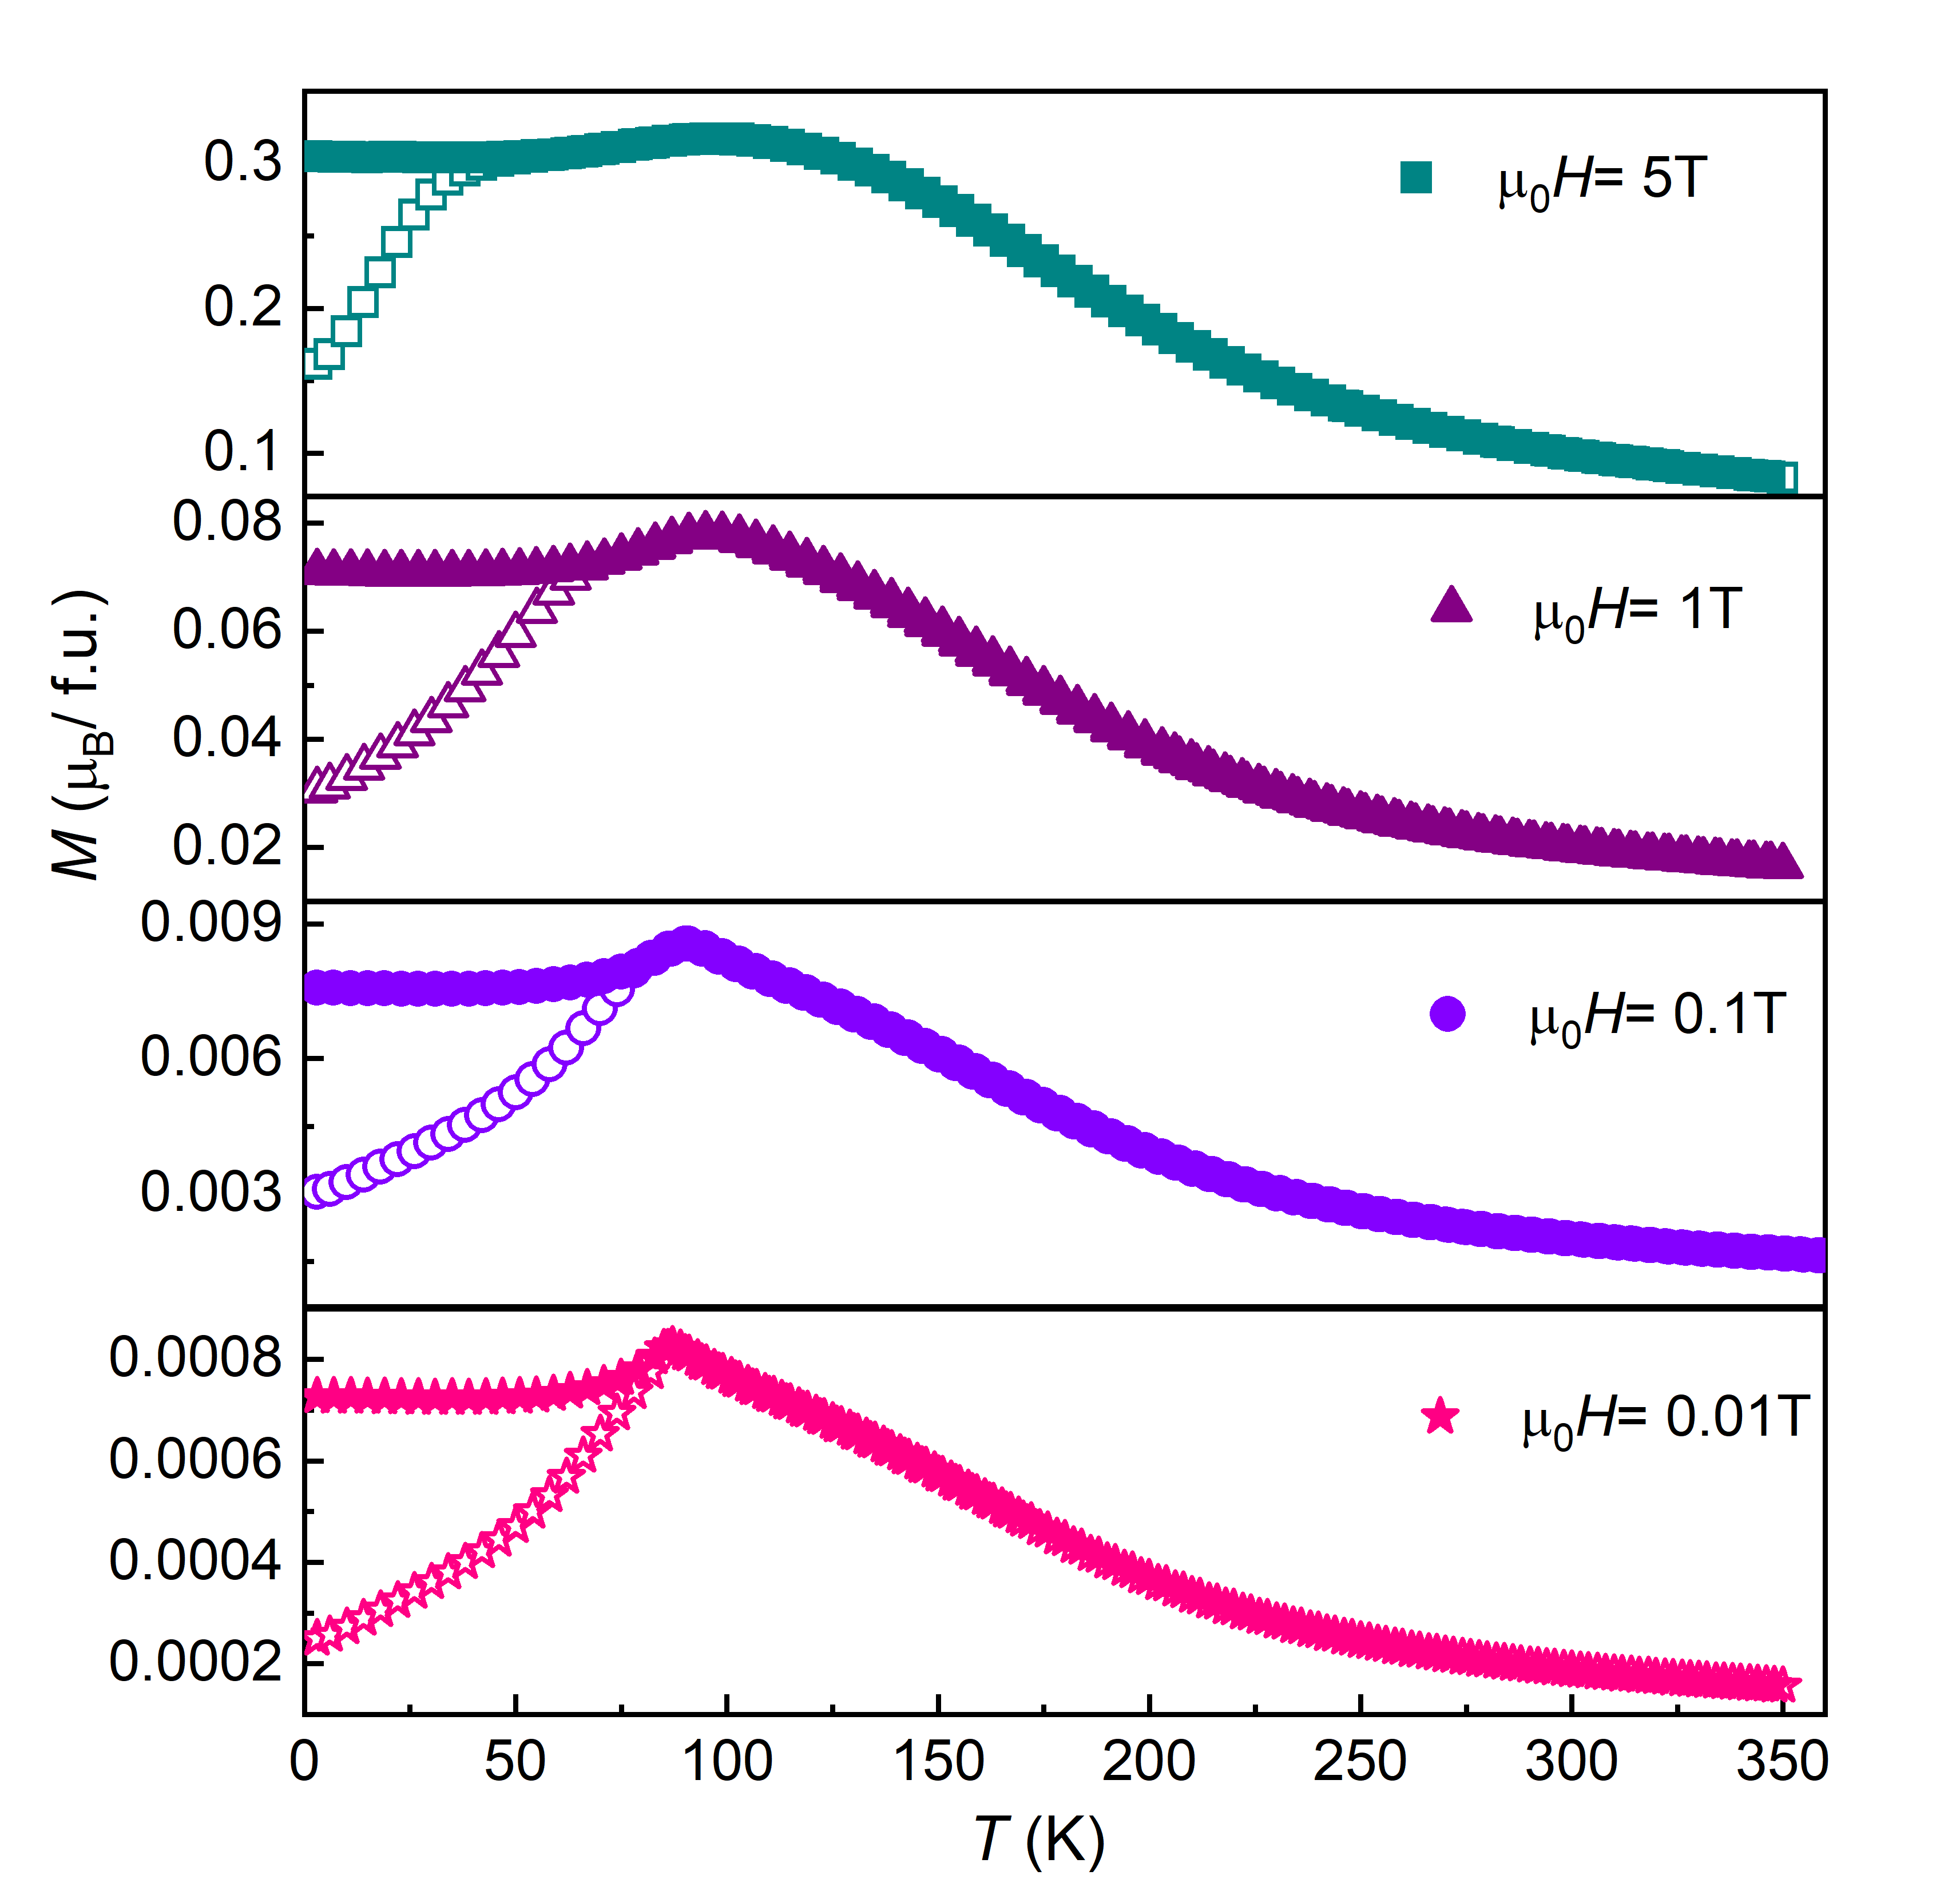
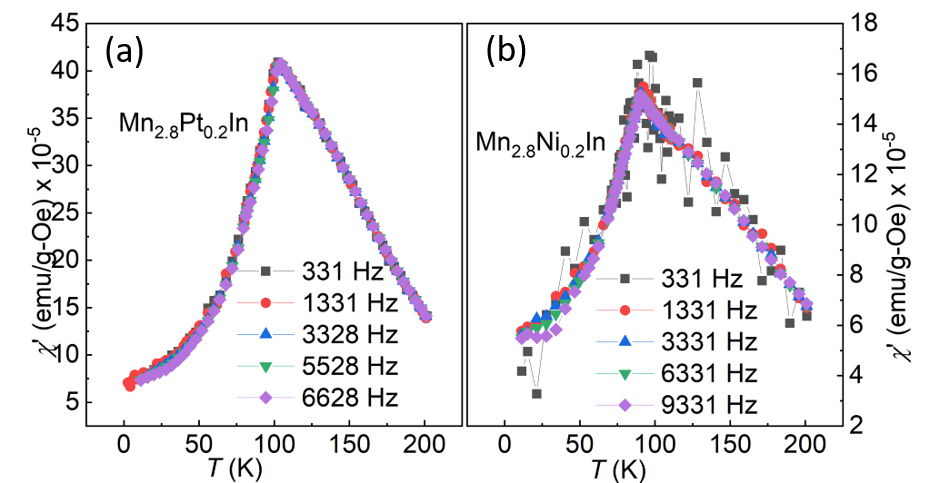
To study the effect of Pt doping on the magnetic properties of Mn3In, we have carried out temperature () dependent magnetization measurements for the Mn3-xPtxIn samples, as shown in Fig. 4(a). All the samples exhibit a typical AFM type curves. However, the zero field cooled (ZFC) and field cooled (FC) curves display a strong bifurcation below the Neel temperature (), which increases monotonically with increasing [inset of Fig. 4(a)]. The low temperature irreversibility between the ZFC and FC data suggests the presence of a magnetic phase coexistence, which might be due to the formation of FM cluster within the compensated FiM matrix. The presence of large irreversibility between the ZFC and FC data even at 5 T and frequency dependent ac-susceptibility measurements eliminate the possible existence of SG phase in the present system (see Supplemental Material)[35].
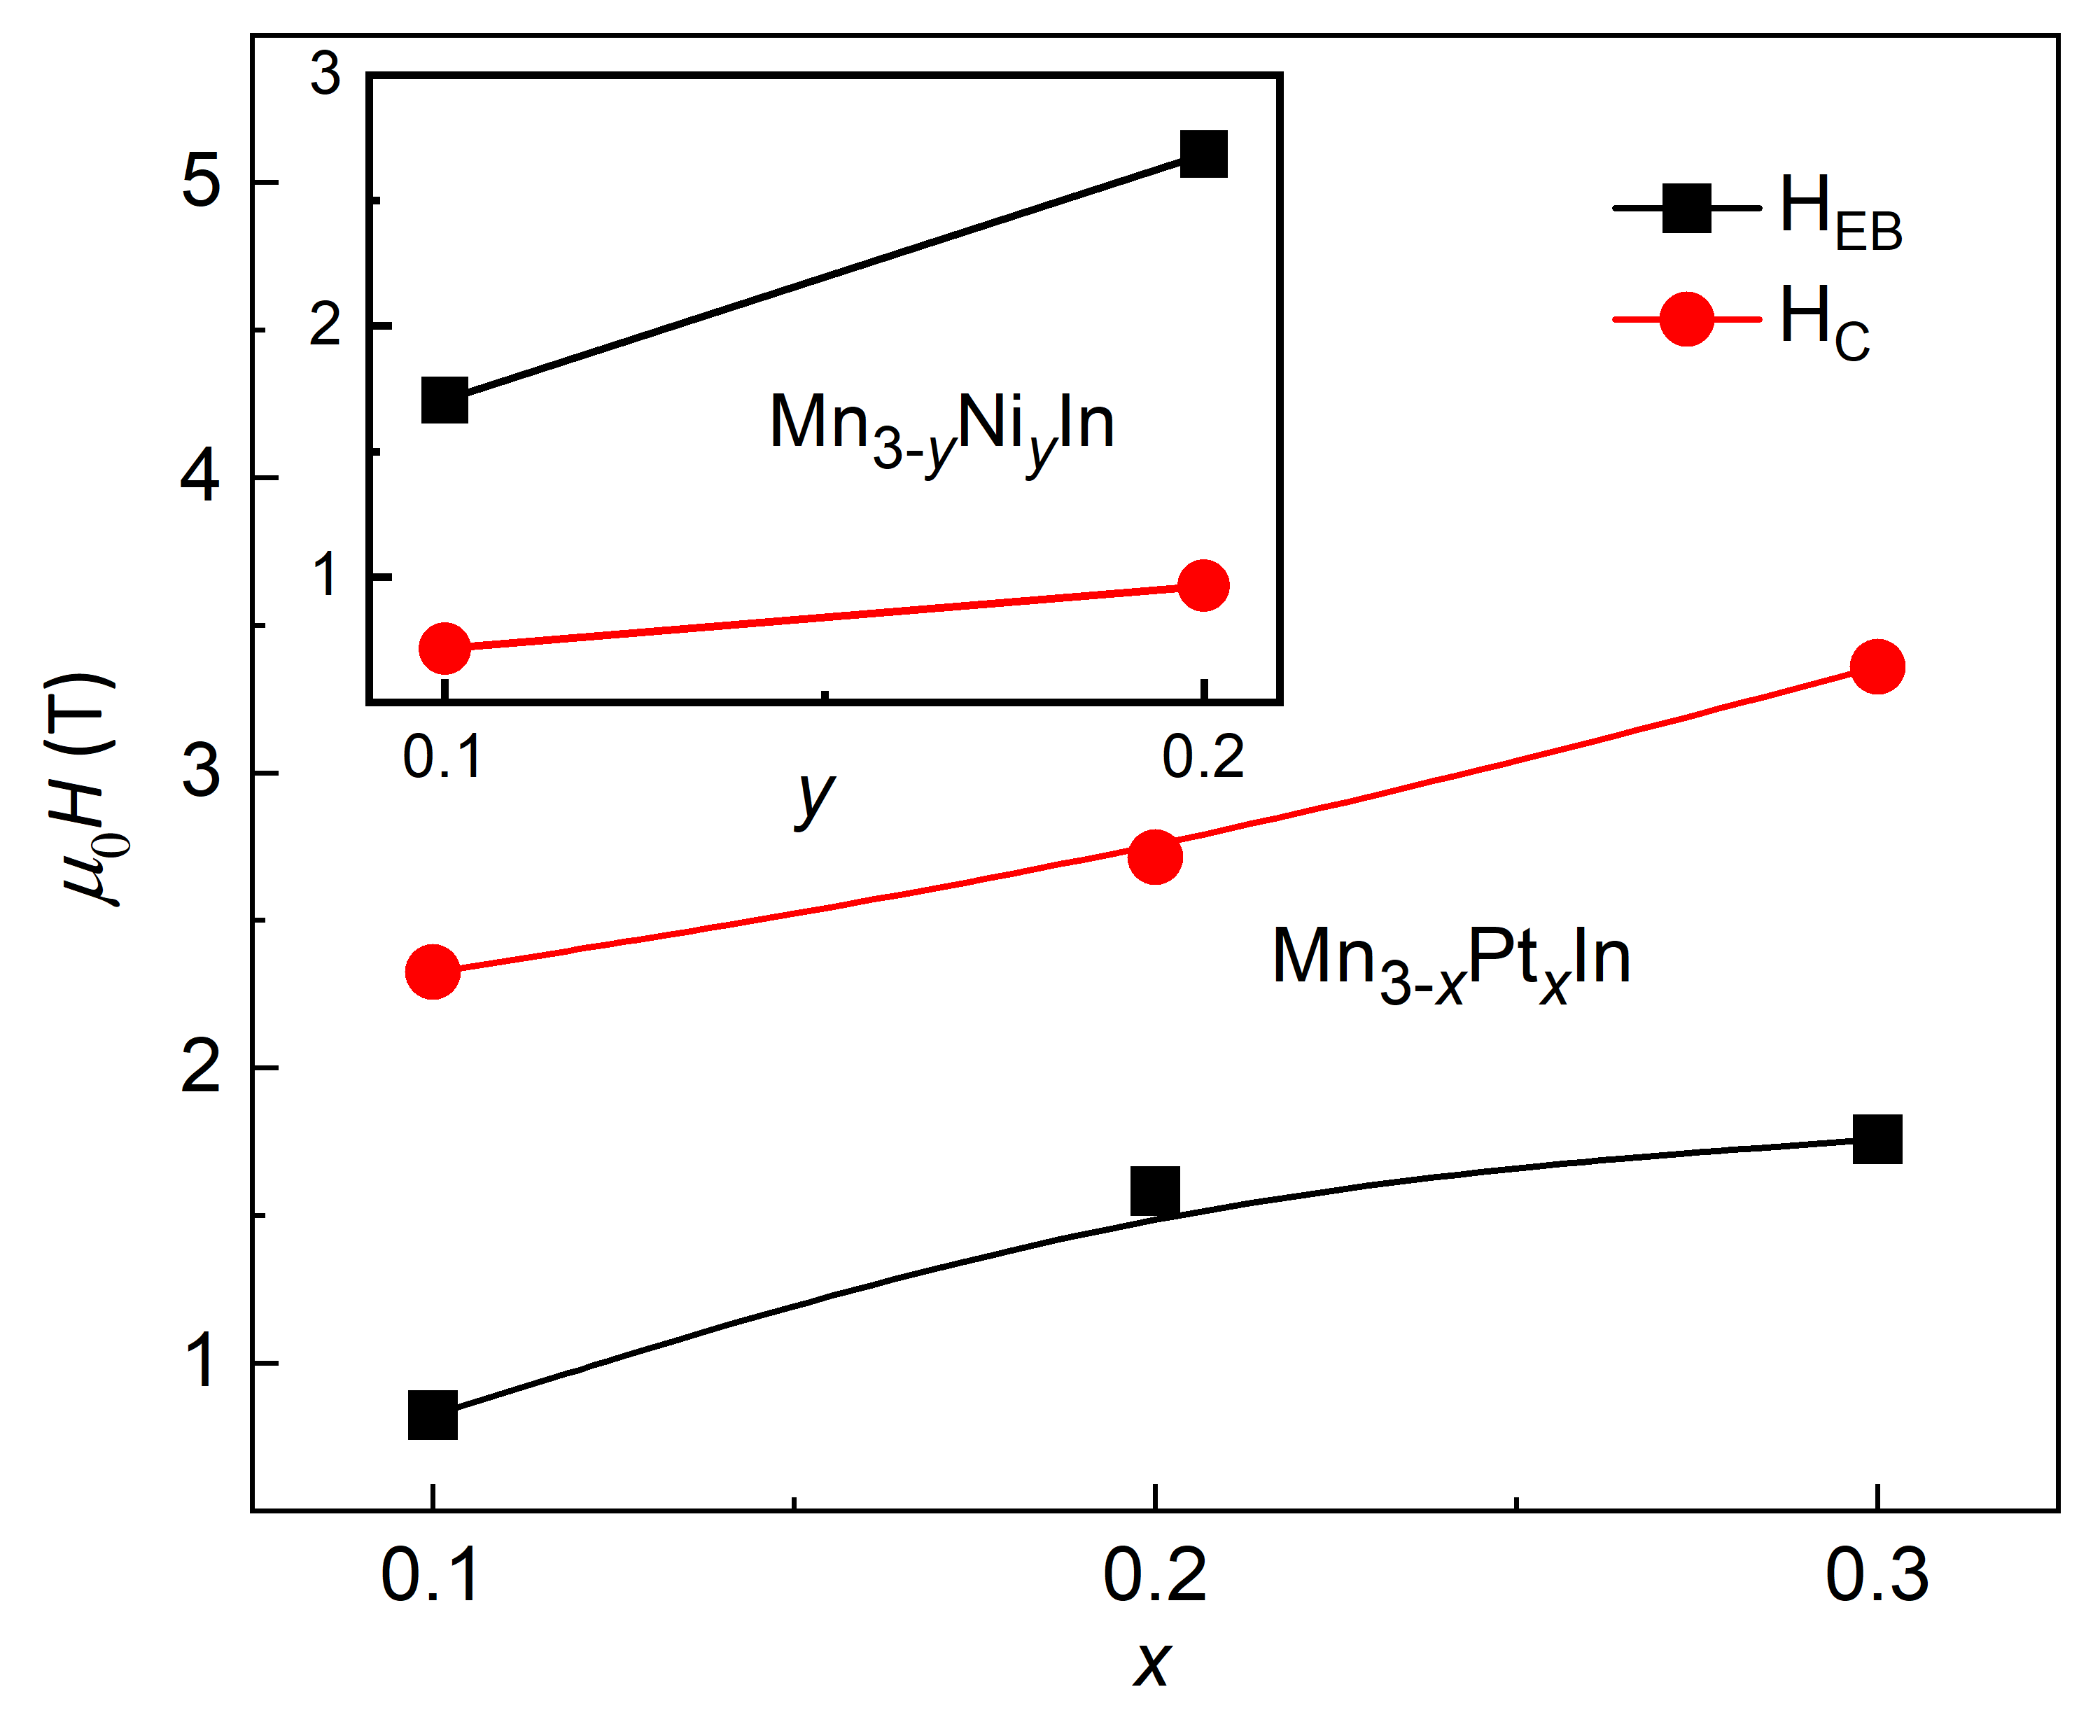
In order to further examine the nature of the magnetic phase coexistence, we have performed ZFC isothermal magnetization measurements at 2 K, as shown in Fig. 4(b) (open symbols). The ZFC loops exhibit a nearly linear field dependency up to the measured field of 14 T. However, all the loops show hysteretic behavior with a large coercive field (). The results corroborate our assumption about the presence of mixed FM and FiM phases. The linear nature of loop may arise from the compensated FiM background, whereas, the hysteretic behavior can originate from the existence of FM clusters. We have further measured FC isothermal magnetization loops at 2 K to examine the presence of any exchange interaction between the FM and FiM phases, as shown in Fig. 4(b) (solid symbols). Before the measurement, the samples were cooled down to the required temperature from 300 K in presence of 5 T field. As it can be seen, all the FC loops display a large shift along the negative field axis, demonstrating the existence of a large unidirectional exchange anisotropy in the system. Like the Pt doped samples, the data for Mn3-yNiyIn also displays a large irreversible behavior [inset of Fig. 4(c)]. The ZFC and FC measurements at 2 K for the Ni doped samples are plotted in Fig. 4(c). The ZFC loops exhibit a similar kind of hysteretic behavior as that of Pt doped samples, whereas, the FC loops display a spontaneous magnetization behavior with the loop closing field of about 5 T. The EB and coercive fields are calculated by using the formula =-(+)/2 and = - /2 respectively, where and are the lower and upper critical field at which the magnetization becomes zero. We find a large EB field () of 0.8, 1.6, and 1.8 T for 0.1, 0.2, and 0.3, respectively [Fig. 5]. In addition, we also observe an enhancement in the values to 2.33 T, 2.67 T and 3.37 T for 0.1, 0.2, and 0.3, respectively. For the Ni doped samples, an extremely large of 2.68 T is found for Mn2.8Ni0.2In [see inset of Fig. 5].
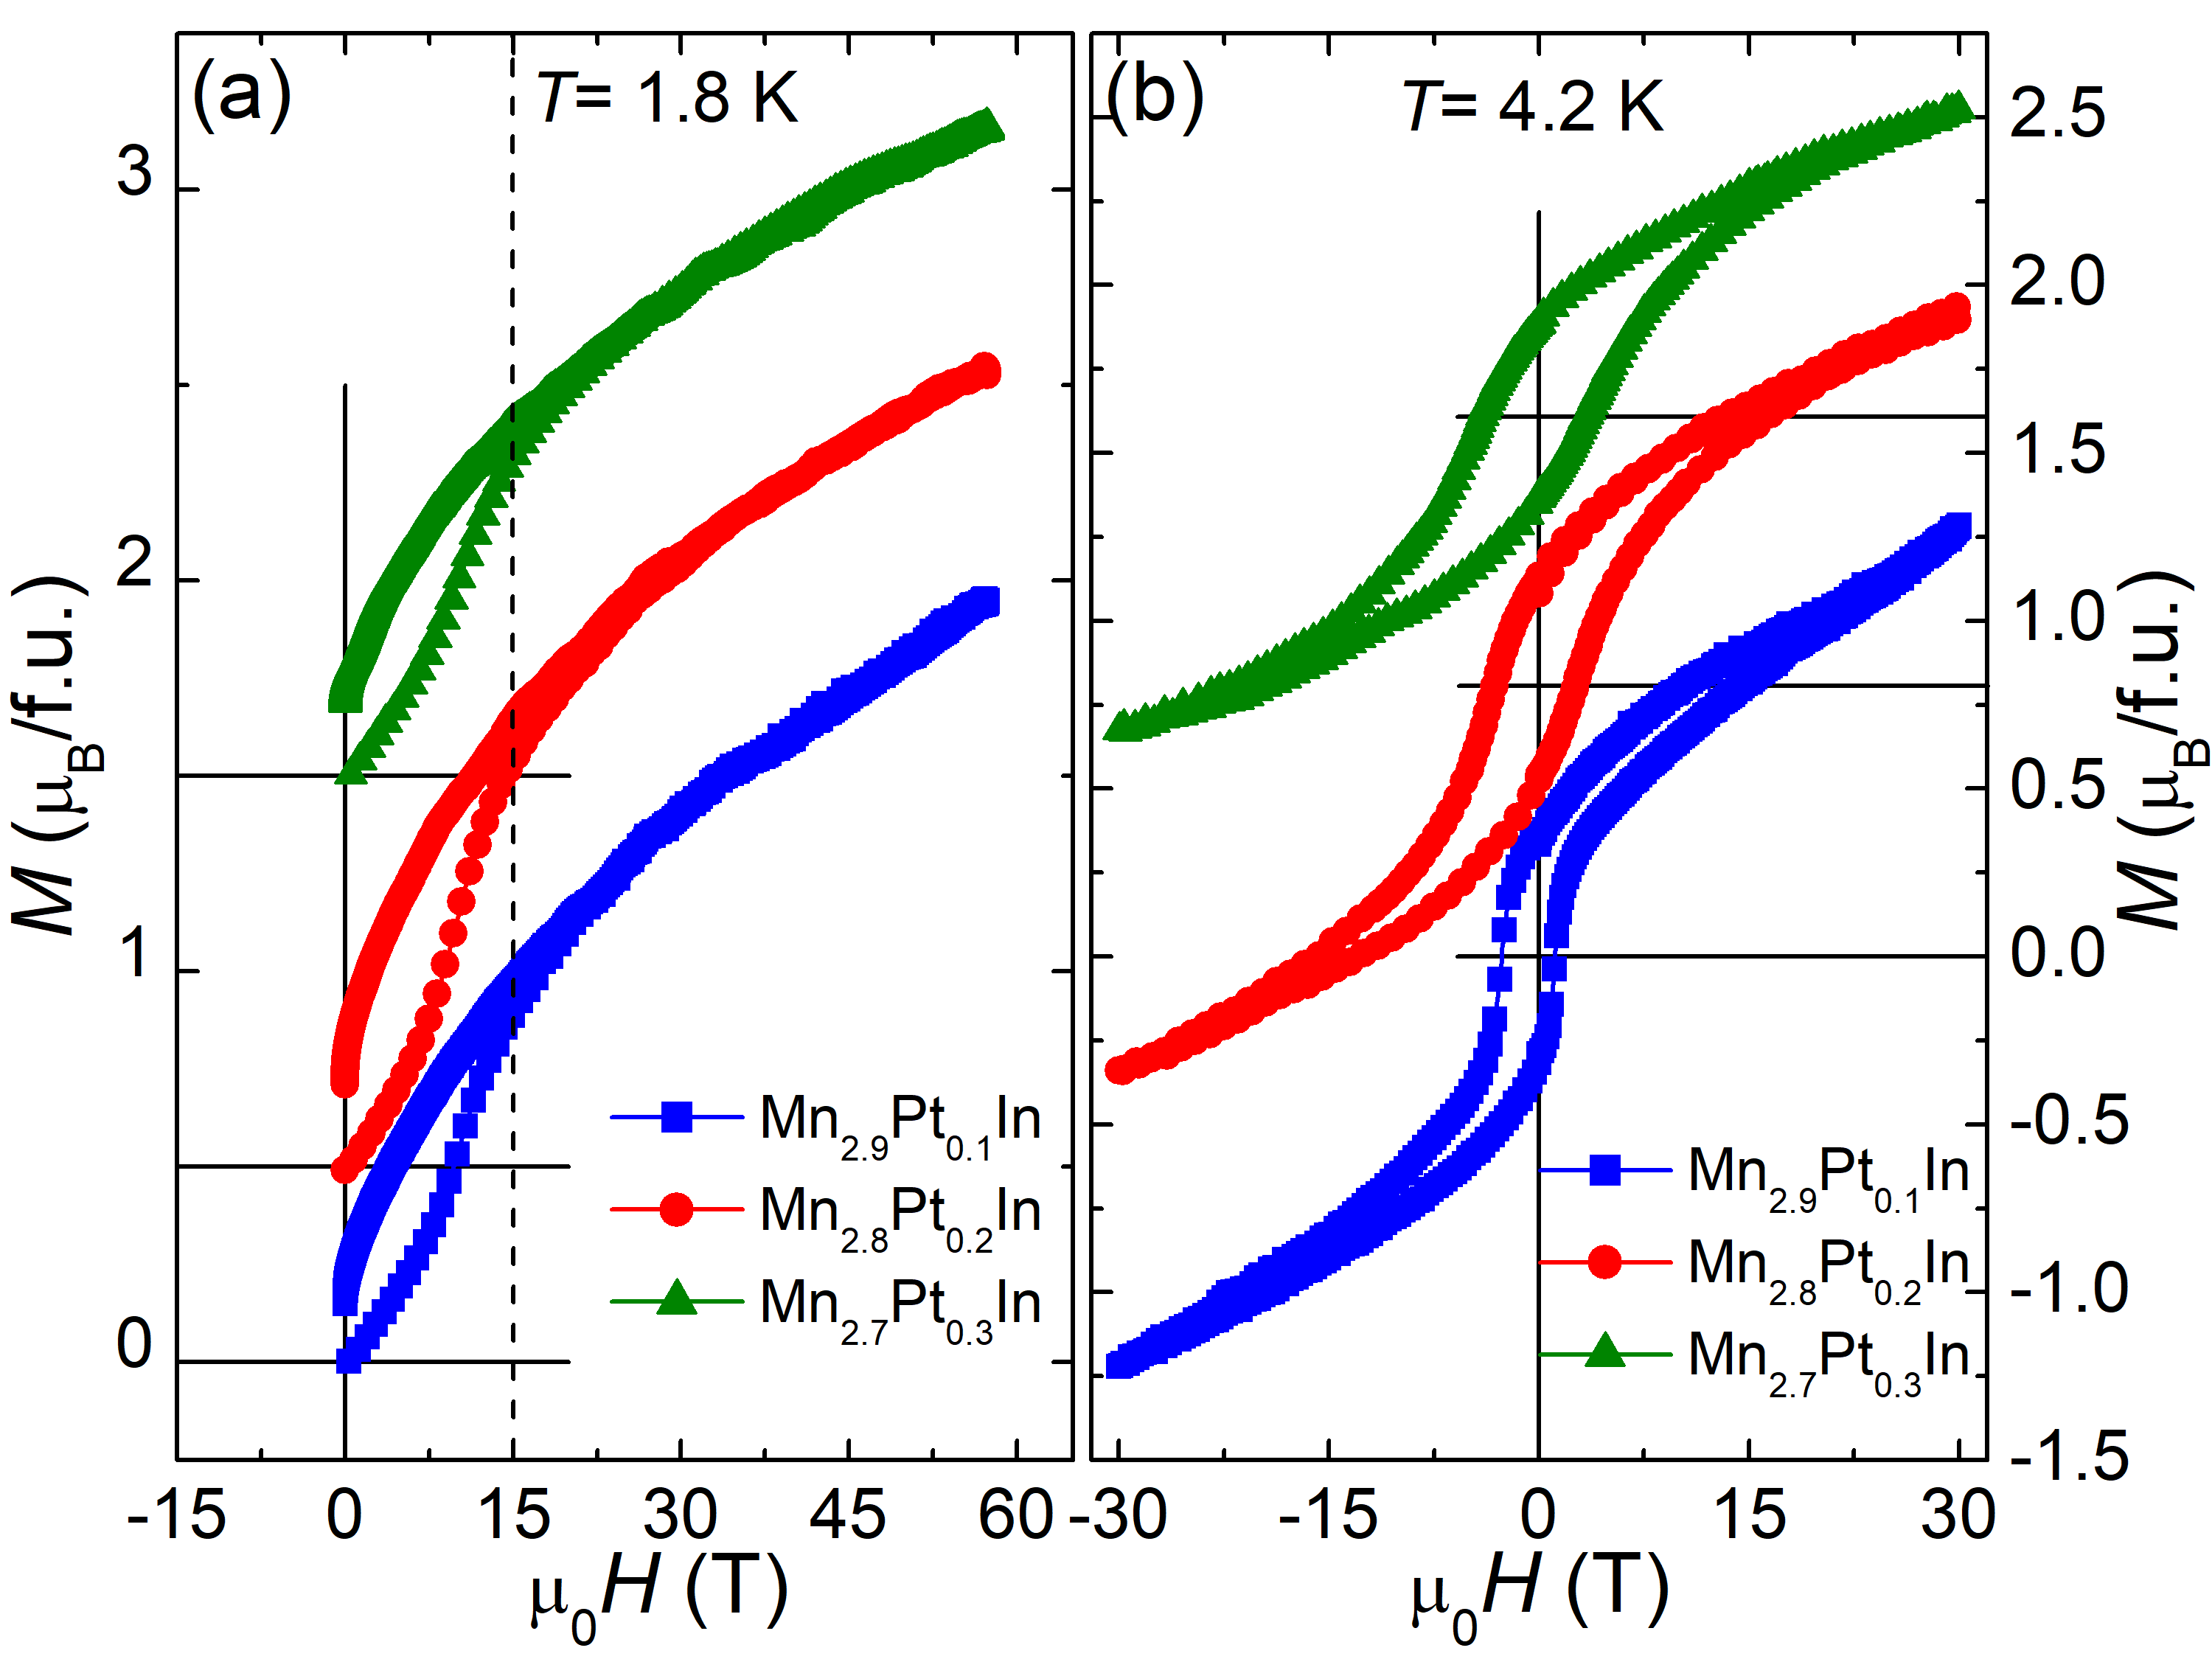
The finding of large EB with contrasting nature of the FC hysteresis in Pt and Ni doped samples require a deeper understanding of the underlying mechanism. Although the FC loops for the Ni doped samples closes at a moderate field of about 5 T, it is unclear for the Pt doped samples, if the FC loops really closes at 14 T. Moreover, to make sure that the observed EB effect does not arise from the minor loop measurement, we have carried out pulsed field magnetization measurements at 1.8 K at a field up to 60 T for the Pt doped samples as shown in Fig. 6(a). Clearly, all the loops close at a field of about 15 T. The curves do not show any signature of saturation up to the maximum applied field, indicating the robustness of inter sublattice exchange strength in the compensated ferrimagnet. A strong hysteretic behavior in the field range of 0-15 T with a remanent magnetization of 0.16-0.23 B/f.u. is also found in all the three samples. In addition, the presence of a step like feature around 10 T also suggests a field induced metamagnetic type of transition. To further probe the effect of high magnetic field, we have taken 15 T FC hysteresis loops measured up to 30 T for the Pt doped samples, as depicted in Fig. 6(b). As evident, all the loops close at about 15 T (see ZFC 60 T measurements). Hence, the FC hysteresis loops measured up to a field of 14 T in Fig. 4(b) fall almost in the major loop category. However, we find that the 15 T FC loops (measured up to 30 T) exhibit smaller EB field in comparison to that of the 5 T FC loops shown earlier.
VI TRANSPORT MEASUREMENT AND DISCUSSIONS
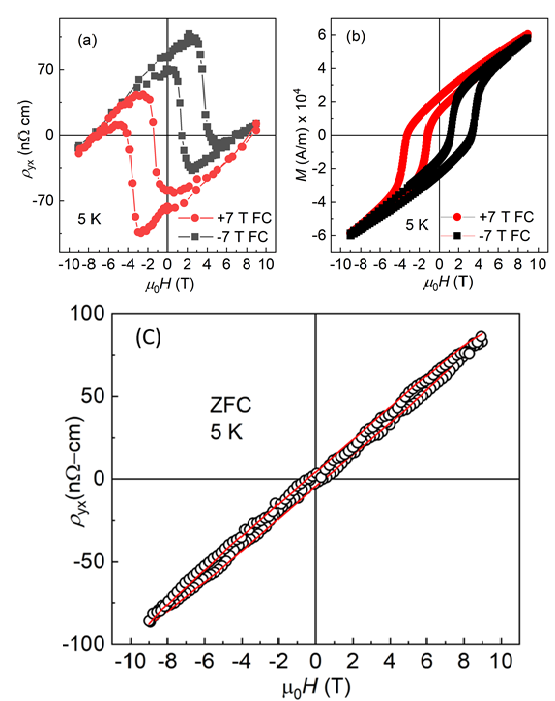
Obsevation of large EB in the present system strongly suggests the existence of exchange coupling between the FCF background [Fig. 7(a) and left panel of Fig. 7(b)] and the FiM clusters [right panel of Fig. 7(b)]. Our experimental results also directly support the theoretical proposition of FCF as the lowest energy state with negligible energy difference between the FCF and uncompensated FiM states. In a recent theoretical study, it is proposed that the uncompensated ferrimagnetic ordering as the lowest energy state in Mn3In [36]. However, our theoretical as well as the experimental results categorically establish FCF as the magnetic ground state in the present system. In order to further understand the nature of exchange interactions between the FCF background and the FiM cluster, we have performed Hall measurements in Mn2.8Ni0.2In, as it requires a moderately low field ( 5 T) to close the hysteresis loop. The field dependence of Hall resitivity () measured after field cooling the sample in +7 T and -7 T is shown in Fig. 7(c). To extract any possible additional component in the Hall resistivity, we have fitted the experimental data with the calculated one. The total can be expressed as , where , and are normal, anomalous and extra Hall resistivities, respectively [24, 37]. can be written as, , where is the normal Hall coefficient and is the magnetic field. While can be expressed as, , where is a constant, is the longitudinal resistivity and is the magnetization. Since the FC loop closes for field above 5 T, it can be assumed that the spin structure saturates for field larger than 5 T and hence the high field data only consists of and . In this scenario, the at field greater than 5 T can be expressed as . The calculated Hall resistivity is plotted as solid lines in Fig. 7(c). If we see the +7 T FC data, the experimental and calculated curves match pretty well everywhere except at the magnetization reversal point at +9 T to -9 T curve. To further examine this unusual behavior, we have performed similar fitting for the -7 T FC data, where the difference between the experimental and the calculated data arises at the magnetization reversal point at -9 T to +9 T field sweep curves. This indicates the presence of extra Hall effect (EHE) at the field reversal marked by dotted circles in Fig. 7(c). It is to be noted that for the +7 T FC loop, the measurement was performed by sweeping the field from +9 -9 +9 T, whereas, the field was sweeped as -9 +9 -9 T for -7 T FC loop. We have also performed the Hall effect measurements by zero field cooling the sample to low temperature. As expected, we do not find any extra Hall component in case of the ZFC Hall measurements (see Supplemental Material) [35].
The observed differences between the calculated and experimental Hall resistivity curves indeed indicate towards a different mechanism of magnetization reversal through lower and upper critical field in an exchange coupled system. The often found asymmetry in hysteresis curve in the vicinity of magnetization reversal occurs due to either domain wall motion or magnetization rotation on opposite side of hysteresis [38, 39, 40]. Most importantly, this extra Hall contribution in the present system appears only in the field decreasing or field increasing path of the Hall measurement when the sample is field cooled in positive or negative field. This kind of extra Hall contribution can only be assigned to the interfacial non-coplanar spin structure in an exchange bias system. This is due to the fact that the sign of the cooling field determines the nature of the spin orientations at the interface, leading to the observed asymmetry in the Hall signal across the field -reversal regime. Similar kind of effect has also been previously found in an exchange bias system, where, the additional Hall contribution is attributed to the topological -spin texture at the interface[41]. Therefore, in the present system, the origin of EHE is most likely connected to the non-vanishing scalar spin chirality originated from the non-coplanar spin structure[42, 43, 24, 37]. As a result, an extra component of Hall resistivity appears in the vicinity of the magnetization reversal through magnetization rotation [marked in dotted circles in Fig. 7(c)]. A possible spin configuration corresponding to the Hall signal marked in dotted circles is illustrated in the top panel of Fig. 7(c). In this scenario, the fictitious magnetic fields (indicated by the red arrows) associated with the solid angle subtended by the non-coplanar spins within the single domain FCF add up to give a non-vanishing effective field. This gives rise to the observed additional Hall component as marked by dotted circles in Fig. 7(c). On the other hand, the absence of extra Hall component in the reverse cycle [marked as dotted squares and represented schematically in the bottom panel of Fig. 7(c)] indicates the formation of multidomain state in the FCF layer. The random orientation of the fictitious magnetic field in different domains leads to a vanishing effective field. Moreover, the nucleation of domain states is favourable while moving from negative saturated field to positive one for the positive field cooled case and vice versa. In fact, the existence of AFM domain at the interface in an EB system has also been reported earlier [39, 44, 45].
VII Conclusions
In conclusion, we have reported a classic example of a composite quantum material where the material (Mn3In) shows the co-existence of fully compensated ferrimagnet (FCF) and large exchange bias (EB). In both pure and undoped Mn3In, FCF arises from the antiferromagnetic coupling between the intra-cluster staggered moment. The high degree of frustration in the energetically most stable FCF state and small energy barrier of this state with respect to other uncompensated magnetic states are the most plausible reason to give rise to a magnetic inhomogeneous state. The finding of large exchange bias in the present system is the manifestation of the exchange interaction between the FCF and the uncompensated ferrimagnetic clusters. The observed EHE in such systems indicate presence of interfacial DMI along with the symmetric exchange interaction. Moreover, it establishes the importance of compensation to achieve large EB regardless of the crystalline anisotropy.
Acknowledgements.
AKN acknowledges the support from Department of Atomic Energy (DAE), the Department of Science and Technology (DST)-Ramanujan research grant (No. SB/S2/RJN-081/2016), SERB research grant (ECR/2017/000854) and Nanomission research grant [SR/NM/NS-1036/2017(G)] of the Government of India. AA acknowledges DST-SERB (Grant No. CRG/2019/002050) for funding to support this research. AA thank A.I. Mallick for some initial calculations and discussion. We acknowledge the support of HLD at HZDR and HFML, members of the European Magnetic Field Laboratory (EMFL).References
- [1] Y. Tokura, M. Kawasaki, and N. Nagaosa, Nat. Phys. 13, 1056 (2017).
- [2] W. H. Meiklejohn, and C. P. Bean, Phys. Rev. 102, 1413 (1956).
- [3] J. Nogués, and I. K. Schuller, J. Magn. Magn. Mater. 192, 203 (1999).
- [4] S. Giri, M. Patra, and S. Majumdar, J. Phys. Condens. Matter 23, 073201 (2011).
- [5] B. M. Wang, Y. Liu, P. Ren, B. Xia, K. B. Ruan, J. B. Yi, J. Ding, X. G. Li, and L. Wang, Phys. Rev. Lett. 106, 077203 (2011).
- [6] A. K. Nayak, M. Nicklas, S. Chadov, C. Shekhar, Y. Skourski, J. Winterlik, and C. Felser, Phys. Rev. Lett. 110, 127204 (2013).
- [7] B. Dieny, V. S. Speriosu, S. S. P. Parkin, B. A. Gurney, D. R. Wilhoit, and D. Mauri, Phys. Rev. B 43, 1297 (1991).
- [8] S. Gider, B. U. Runge, A. C. Marley, and S. S. P. Parkin, Science 281, 797 (1998).
- [9] C. Binek, J. Appl. Phys. 97, 10C514 (2005).
- [10] T. Furubayashi, K. Kodama, H. Sukegawa, Y. K. Takahashi, K. Inomata, and K. Hono, Appl. Phys. Lett. 93, 122507 (2008).
- [11] V. Skumryev, S. Stoyanov, Y. Zhang, G. Hadjipanayis, D. Givord, and J. Nogués, Nature 423, 850 (2009).
- [12] W. C. Cain, and M. H. Kryder, J. Appl. Phys. 67, 5722 (1990).
- [13] M. Ali, P. Adie, C. H. Marrows, D. Greig, B. J. Hickey, and R. L. Stamps, Nat. Mater. 06, 70 (2006).
- [14] G. Salazar-Alvarez, J. Sort, S. Suriñ ach, M. D. Baró, and J. Nogués, J. Am. Chem. Soc. 129, 9102 (2007).
- [15] E. Maniv, R. A. Murphy, S. C. Haley, S. Doyle, C. John, A. Maniv, S. K. Ramakrishna, Y. -L. Tang, P. Ercius, R. Ramesh, A. P. Reyes, J. R. Long, and J. G. Analytis, Nat. Phys. 17, 525 (2021).
- [16] A. P. Malozemoff, Phys. Rev. B 35, 3679 (1987).
- [17] K. Takano, R. H. Kodama, A. E. Berkowitz, W. Cao, and G. Thomas, Phys. Rev. Lett. 79, 1130 (1997).
- [18] P. Miltényi, M. Gierlings, J. Keller, B. Beschoten, G. Güntherodt, U. Nowak, and K. D. Usadel, Phys. Rev. Lett. 84, 4224 (2000).
- [19] U. Nowak, K. D. Usadel, J. Keller, P. Miltényi, B. Beschoten, and G. Güntherodt, Phys. Rev. B 66, 014430 (2002).
- [20] H. Kurt, K. Rode, P. Stamenov, M. Venkatesan, Y.-C. Lau, E. Fonda, and J. M. D. Coey, Phys. Rev. Lett. 112, 027201 (2014).
- [21] A. K. Nayak, M. Nicklas, S. Chadov, P. Khuntia, C. Shekhar, A. Kalache, M. Baenitz, Y. Skourski, V. K. Guduru, A. Puri, U. Zeitler, J. M. D. Coey, and C. Felser, Nat. Mater. 14, 679 (2015).
- [22] R. Sahoo, L. Wollmann, S. Selle, T. Höche, B. Ernst, A. Kalache, C. Shekhar, N. Kumar, S. Chadov, C. Felser, S. S. P. Parkin, and A. K. Nayak, Adv. Mater. 28, 8499 (2016).
- [23] R. Stinshoff, A. K. Nayak, G. H. Fecher, B. Balke, S. Ouardi, Y. Skourski, T. Nakamura, and C. Felser, Phy. Rev. B 95, 060410(R) (2017).
- [24] B. Giri, A. I. Mallick, C. Singh, P. V. P. Madduri, F. Damay, A. Alam, and A. K. Nayak, Phys. Rev. B 102, 014449 (2020).
- [25] J. D. Browne, N. J. Hance, G. B. Johnston, and C. F. Sampson, Phys. Status Solidi A 49, K177 (1978).
- [26] Q. Zhang, D. Li, W. Cui, J. li, and Z. Zhang, J. Appl. Phys. 106, 113915 (2009).
- [27] P. Hohenberg, and W. Kohn, Phys. Rev. 136, B865 (1964).
- [28] G. Kresse, and J. Hafner, Phys. Rev. B 47, 558 (1993).
- [29] G. Kresse, and J. Furthmuller, Phys. Rev. B 54, 011169 (1996).
- [30] G. Kresse, and J. Furthmuller, Comput. Mater. Sci. 6, 15 (1996).
- [31] P. E. Blochl, Phys. Rev. B 50, 17953 (1994).
- [32] J. P. Perdew, K. Burke, and M. Ernzerhof, Phys. Rev. Lett. 77, 3865 (1996); 78, 1396(E) (1997).
- [33] J. K. Brandon, H. S. Kim, and W. B. Pearson, Acta Cryst. B35, 1937 (1979).
- [34] Interestingly, it is not possible to stabilize a ferromagnetic (FM) configuration for Mn3In. In fact, the FiM-1 calculation was initiated with a perfect FM configuration to start with, but the spin at 4e1 Mn-sites (inner tetrahe- dron of cluster A) flip after the relaxation, and converged to FiM-1.
- [35] See the supplementary information for details of experimental and theoretical tools, structural, magnetic, and transport measurements, which also includes Refs. [ 46-51].
- [36] S. Chatterjee, P. Dutta, S. Giri, S. Majumdar, S. Sadhukhan, S. Kanungo, S. Chatterjee, M. M. Patidar, G. S. Okram, and V. Ganesan, Phys. Rev. B 102, 214443 (2020).
- [37] P. K. Rout, P. V. Prakash Madduri, S. K. Manna, and A. K. Nayak, Phys. Rev. B 99, 094430 (2019).
- [38] M. R. Fitzsimmons, P. Yashar, C. Leighton, Ivan K. Schuller, J. Nogués, C. F. Majkrzak, and J. A. Dura, Phys. Rev. Lett. 84, 17 (2000).
- [39] J. McCord, R. Schafer, R. Mattheis, and K. -U. Barholz, J. Appl. Phys. 93, 9 (2003).
- [40] S. Brems, D. Buntinx, K. Temst, C. V. Haesendonck, F. Radu, and H. Zabel, Phys. Rev. Lett. 95, 157202 (2005).
- [41] M. Meng, S. Li, M. Saghayezhian, E. W. Plummer, and R. Jin, Appl. Phys. Lett. 112, 132402 (2018).
- [42] C. Sürgers, G. Fischer, P. Winkel, and H. v. Löhneysen, Nat. Commun. 5, 3400 (2014).
- [43] W. Wang, M. W. Daniels, Z.Liao, Y. Zhao, J. Wang, G. Koster, G. Rijnders, C. -Z. Chang, D. Xiao, and W. Wu, Nat. Mater. 18, 1054 (2019).
- [44] F. Nolting, A. Scholl, J. StoÈhr, J. W. Seo, J. Fompeyrine, H. Siegwart, J. -P. Locquet, S. Anders, J. LuÈ ning, E. E. Fullerton, M. F. Toney, M. R. Scheinfeink, and H. A. Padmore, Nature 405, 15 (2000).
- [45] H. Ohldag, A. Scholl, F. Nolting, S. Anders, F. U. Hillebrecht, and J. Stöhr, Phys. Phys. Rev. Lett. 86, 2878 (2001).
- [46] A. Gerber, Phys. Rev. B 98, 214440 (2018).
- [47] S. S Das, G. Kopnov, and A. Gerber, J. Appl. Phys. 124, 104502 (2018).
- [48] G. Kim, K. Son, Y. E. Suyolcu, L. Miao, N. J. Schreiber, H. P. Nair, D. Putzky, M. Minola, G. Christiani, P. A. van Aken, K. M. Shen, D. G. Schlom, G. Logvenov, and B. Keimer, Phys. Rev. Mater 4, 104410 (2020).
- [49] G. Kimbell, P. M. Sass, B. Woltjes, E. K. Ko, T. W. Noh, W. Wu, and J. W. A. Robinson, Phys. Rev. Mater 4, 054414 (2020).
- [50] L. Wu, F. Wen, Y. Fu, J. H. Wilson, X. Liu, Y. Zhang, D. M. Vasiukov, M. S. Kareev, J. H. Pixley, and J. Chakhalian, Phys. Rev. B 102, 220406(R) (2020).
- [51] L. Wu, and Y. Zhang, arXiv:1812.09847v6.
Supplemental Information
VIII Characterization
VIII.1 XRD Analysis
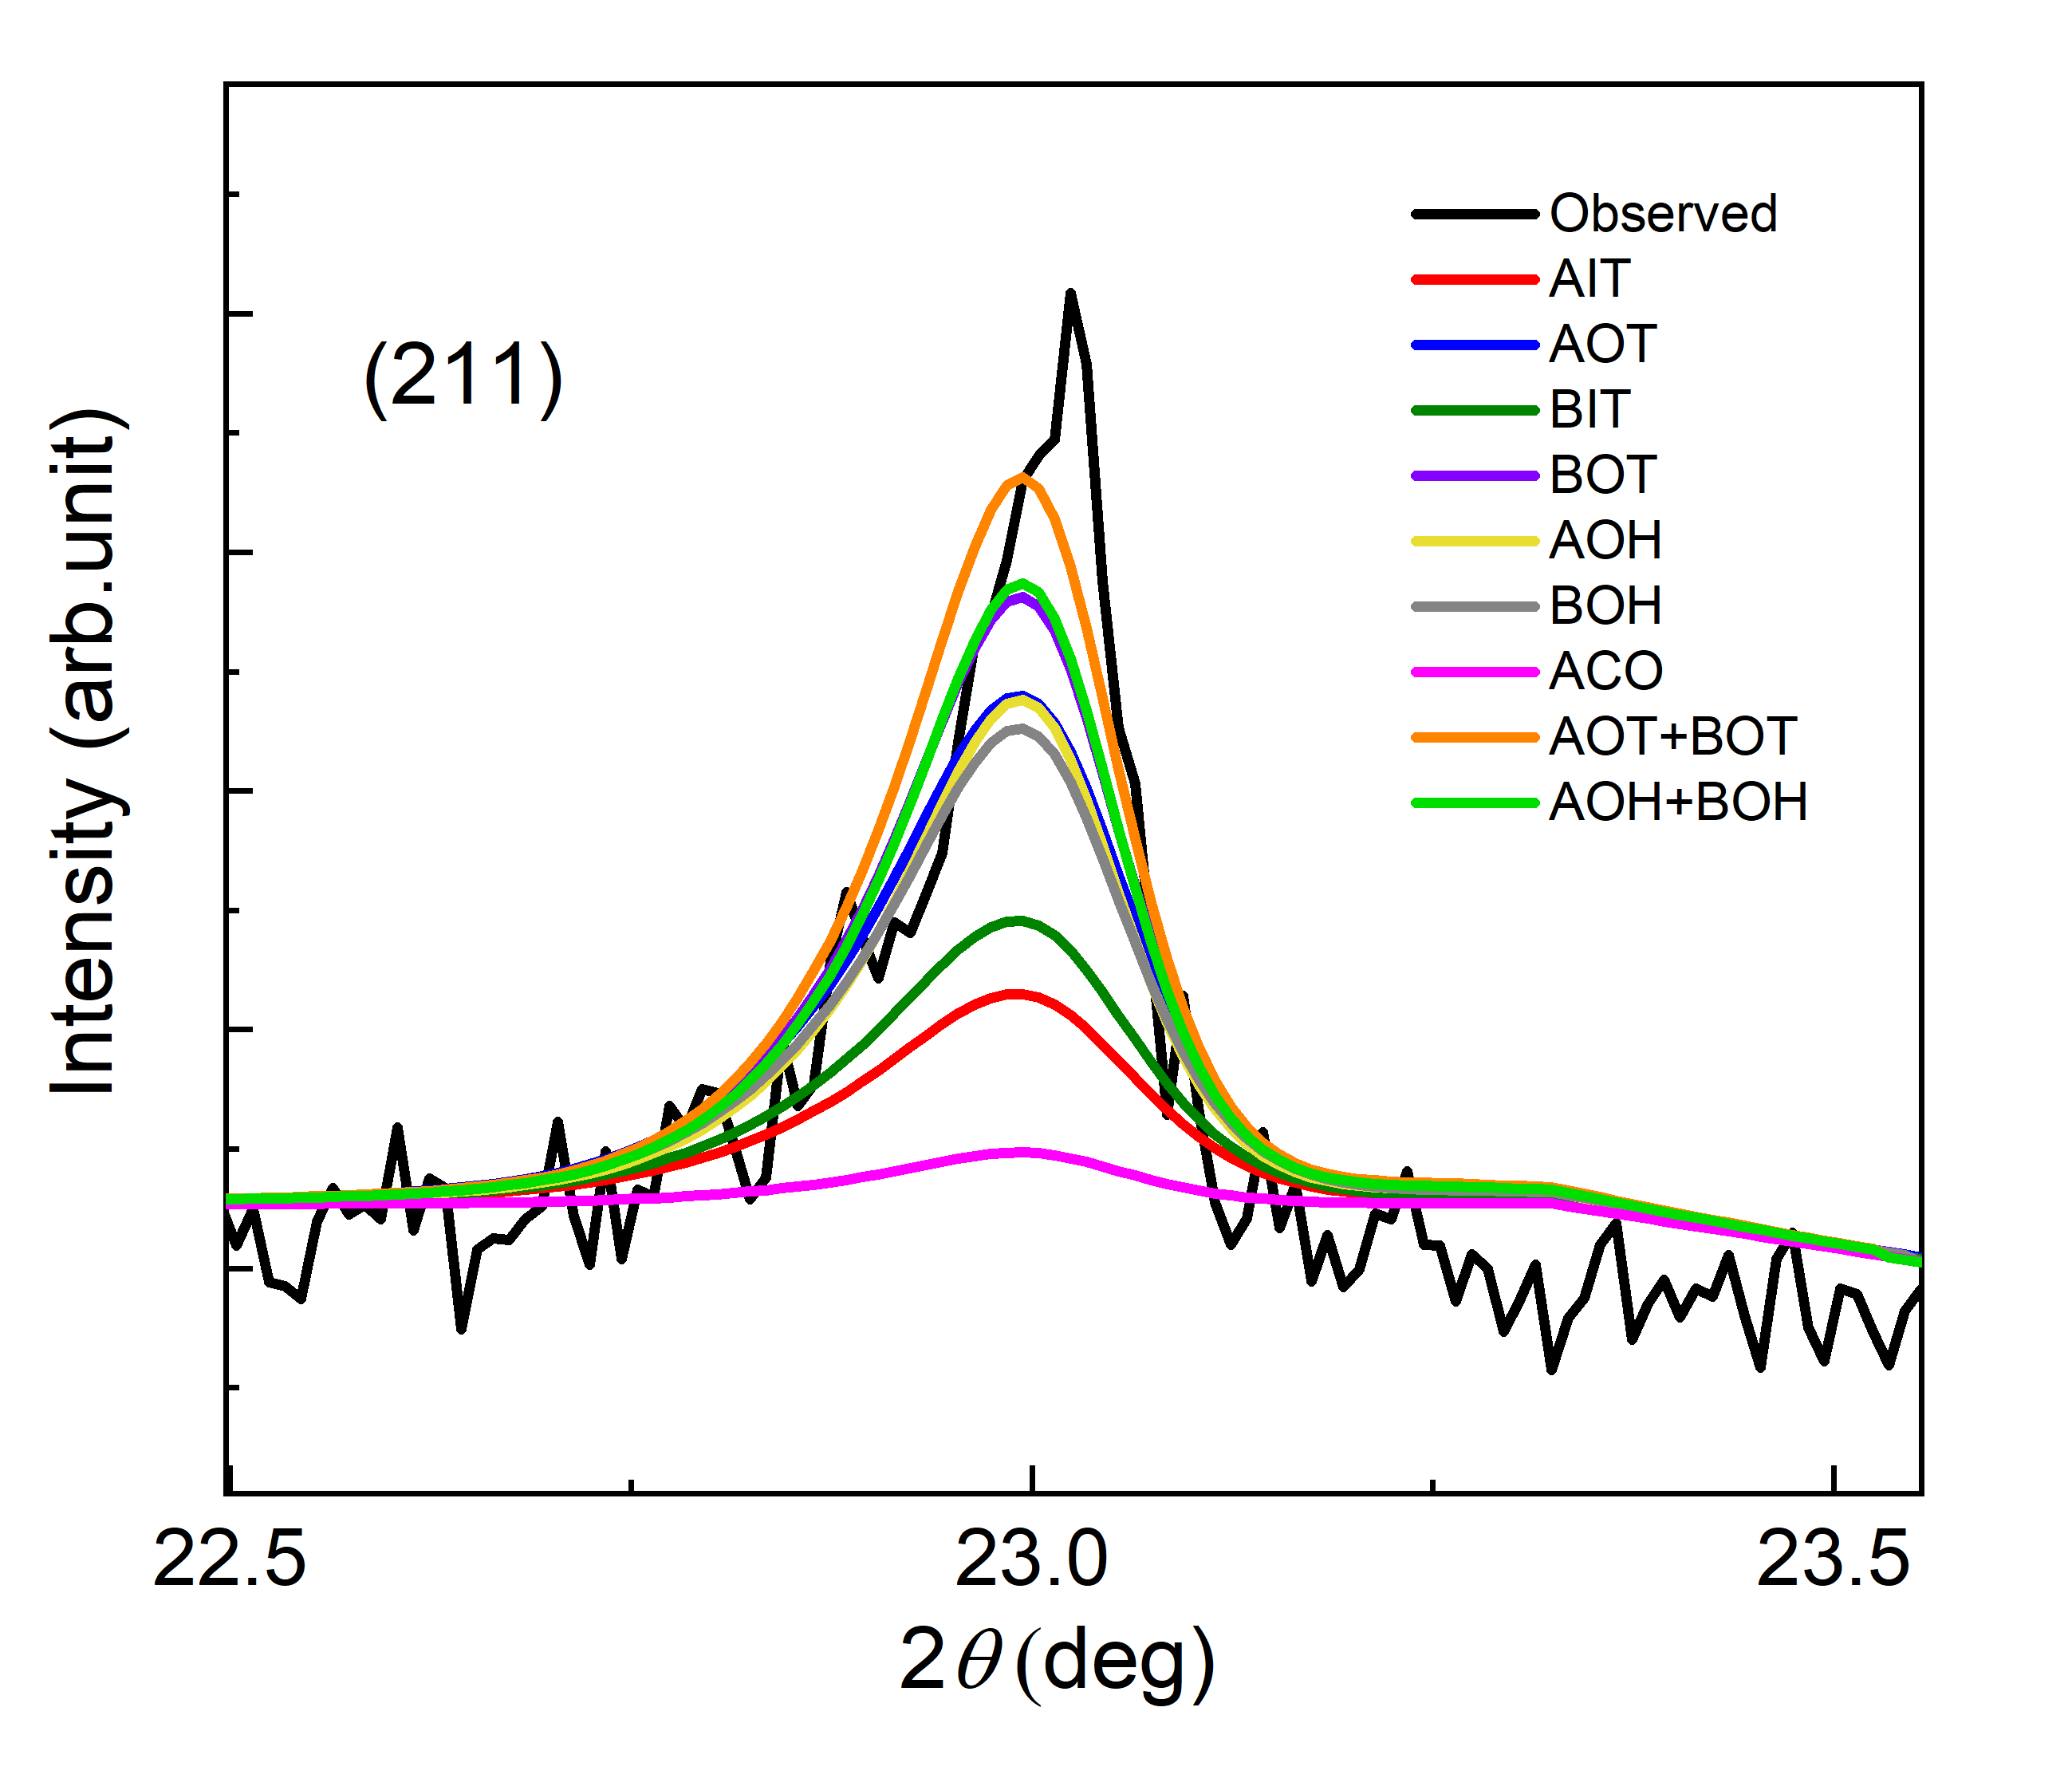
We find that it is not possible to stabilize a single structural phase of Mn3In by the present arc-melting technique. However, we were able to prepare Mn3-xPtxIn and Mn3-yNiyIn (x=0.1 to 0.3 for Pt and y=0.1 to 0.2 for Ni) samples in a structurally single phase of -brass structure. To obtain the phase purity and structural information of Mn3-xPtxIn and Mn3-yNiyIn, we have performed the powder XRD measurement at room temperature. Reitveld refinement of the powder XRD data confirms that all samples are single phase. It is found that the lattice constant increases/decreases with the increasing Pt/Ni doping concentration [see Table-3]. We have thoroughly investigated the XRD data to find any site-specific preference of the doping element. As can be seen from the Pt composition-dependent room temperature powder XRD pattern [Fig. 3 of main text], the Bragg peak (211) is absent in Mn2.9Pt0.1In. With the increase of Pt concentration, the intensity of the Bragg peak (211) is also increased, in fact, it is very prominent in Mn2.7Pt0.3In. There are multiple distinguishable Mn positions within Mn3In. So, the Pt can go to at any position. However, we have tried to obtain a particular or combination of distinguishable Mn positions to be preferentially occupied by Pt atoms. Therefore, we have systematically substituted Pt atoms among all the possible Wyckoff positions. The simulated intensity of the (211) peak by substitution of Pt at different Wyckoff positions in the Mn2.7Pt0.3In has shown in Fig. 8. We have taken the simulated intensity of the (211) peak, reduced 2value, Rp, and Rwp factors as the parameters to determine the possible favorable positions of Pt. It is evident from the intensity variation with Pt position that the 2 Pt atoms at AOH and 2 Pt atoms at BOH position appear to produce the best agreement factor. Also, the equal distribution of Pt atom at AOT and BOT positions gives almost the same agreement factors which have been compared in Table-4. We have tried other combinations as well, which do not agree well with the experimental data. Therefore, we assert that the Pt atoms are most favorably occupying the AOH and BOH positions. During the theoretical calculation, we have taken care of the site preferences of Pt atoms.
| Composition | Lattice constant () | 2 | Rp | Rwp |
| Mn2.9Pt0.1In | 9.431 | 1.87 | 3.04 | 4.22 |
| Mn2.8Pt0.2In | 9.449 | 2.9 | 4.83 | 6.36 |
| Mn2.7Pt0.3In | 9.460 | 3.85 | 5.23 | 7.49 |
| Mn2.9Ni0.1In | 9.399 | 5.11 | 3.65 | 5.61 |
| Mn2.8Ni0.2In | 9.386 | 3.68 | 3.22 | 4.73 |
| Position | Wight factor | 2 | Rp | Rwp |
|---|---|---|---|---|
| AOT and BOT | 50 | 3.96 | 5.33 | 7.60 |
| AOH and BOH | 50 | 3.85 | 5.23 | 7.49 |
VIII.2 SEM and EDAX Results
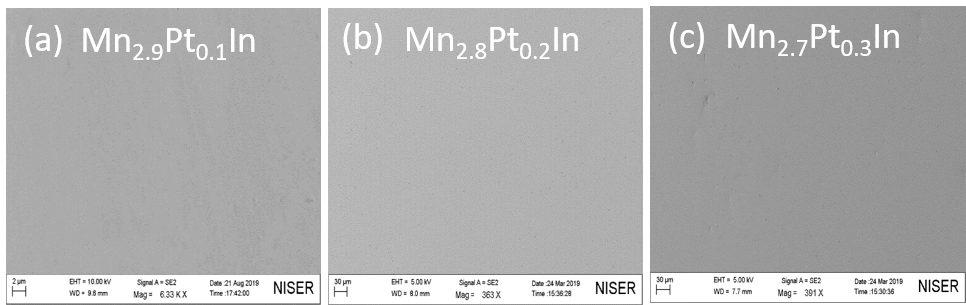
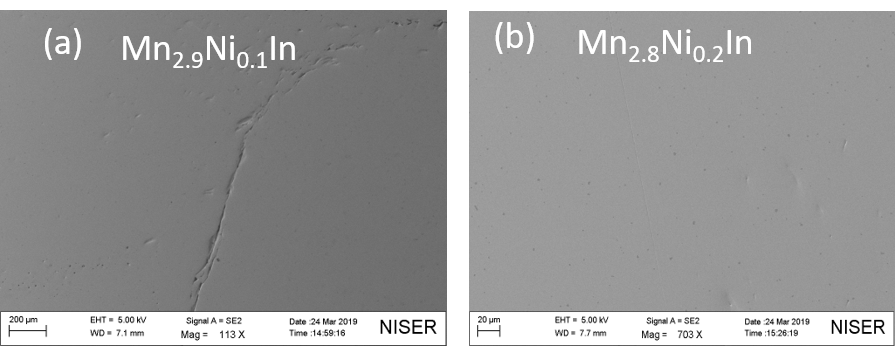
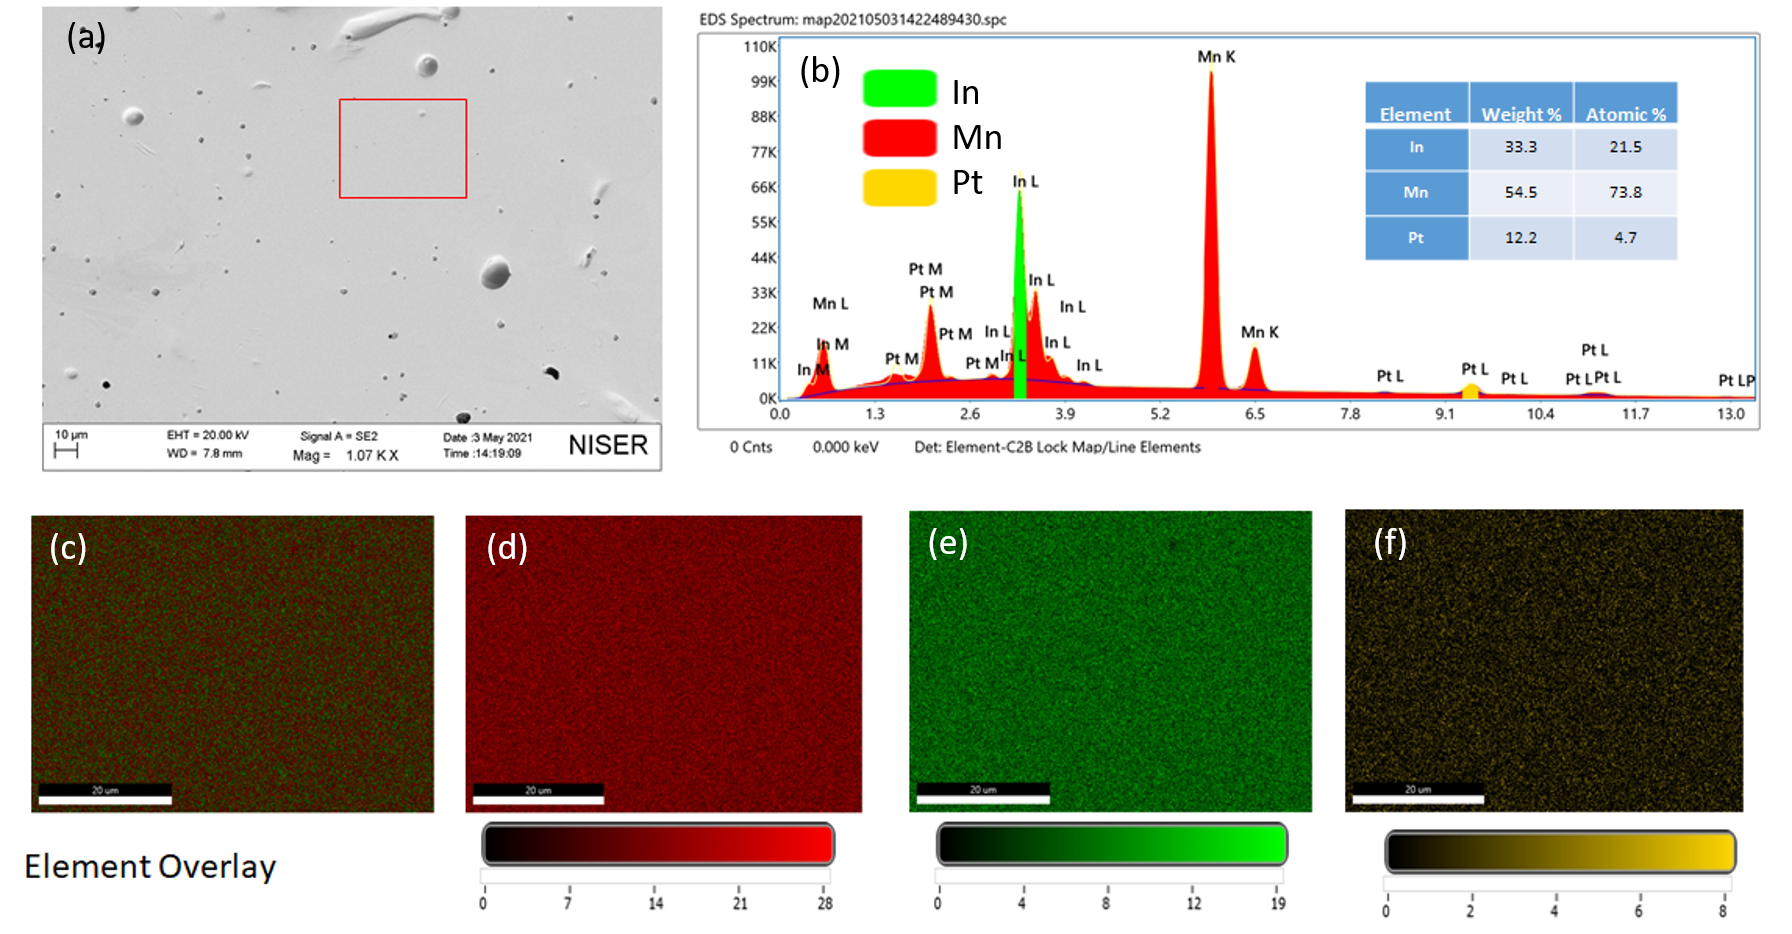
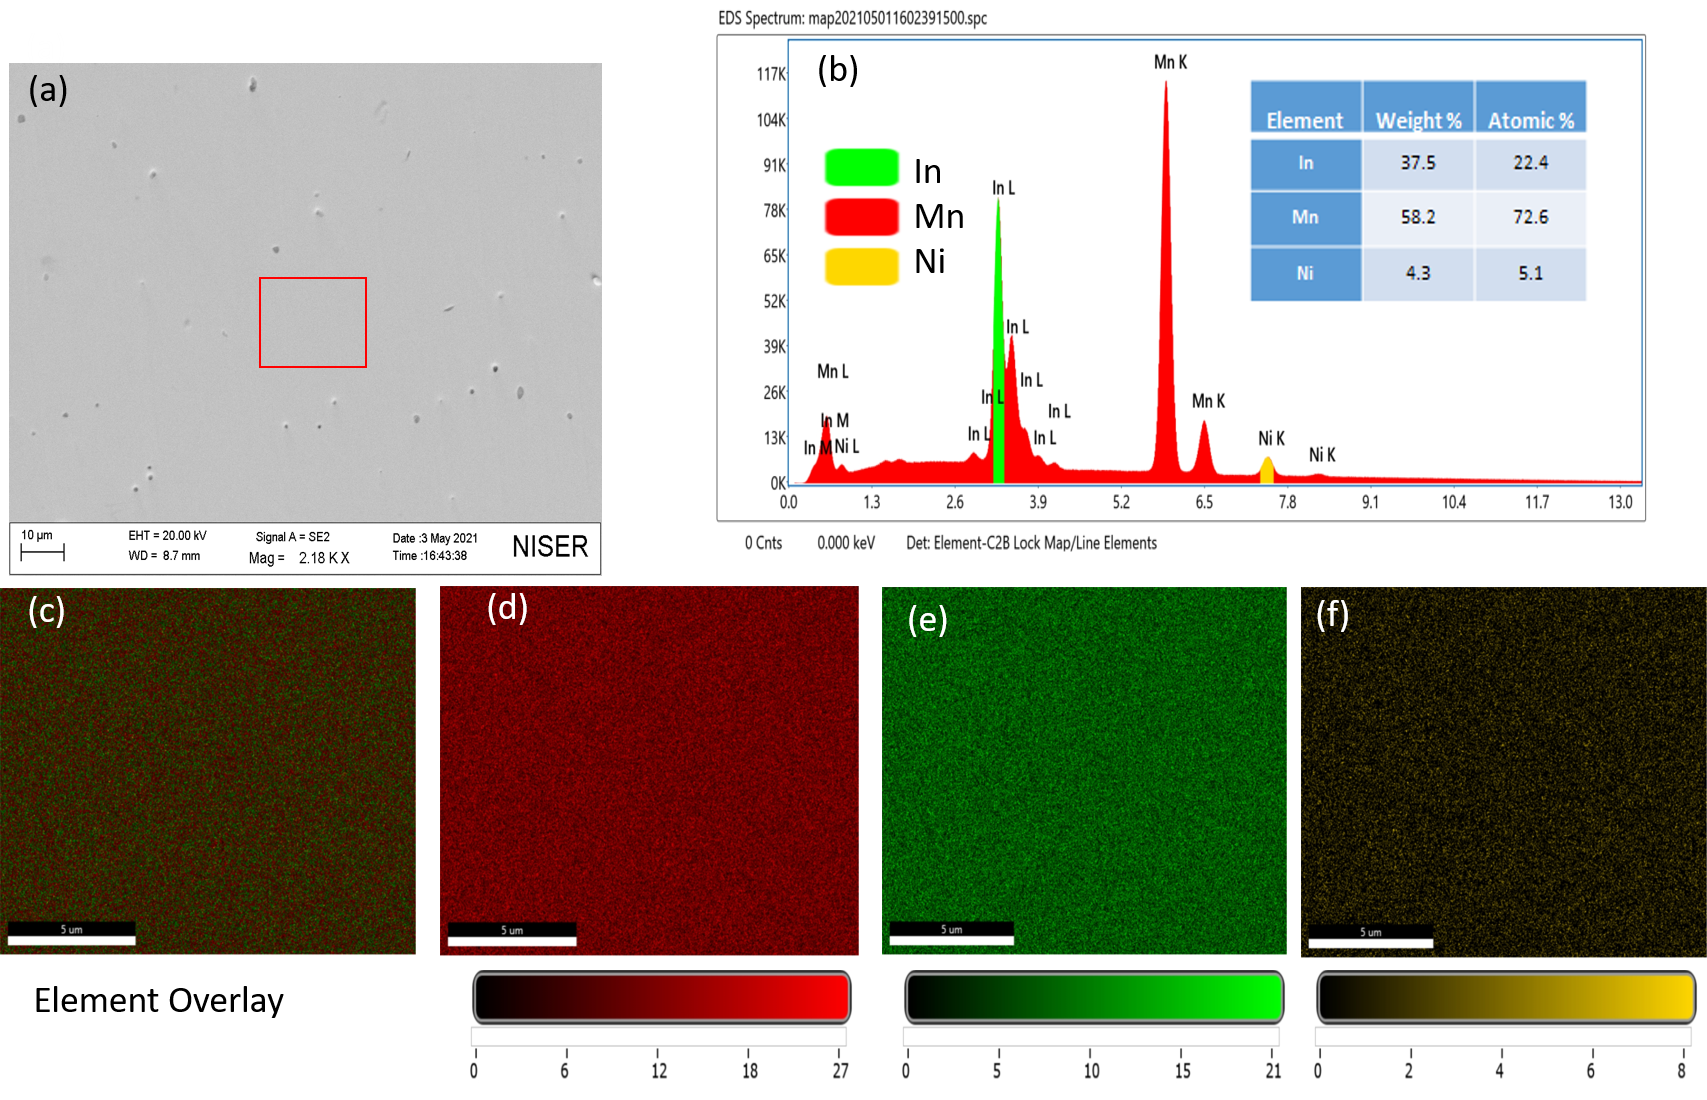
To check the homogeneity and phase purity we performed the SEM study on all the samples. Fig. 9(a)-9(c) represents the SEM images of Mn3-xPtxIn and Fig. 10(a) and 10(b) for Mn3-yNiyIn. Usually, any spatial chemical inhomogeneity appears as spatial color (dark and bright) contrast. The EDAX analysis gives the compositional value around the exact stoichiometric requirement which can be seen from Table-5. Further, we have performed elemental mapping of Mn2.8Pt0.2In and Mn2.8Ni0.2In samples as shown in Fig. 11(a)-11(f) and Fig. 12(a)-12(f) for Mn2.8Pt0.2In and Mn2.8Ni0.2In respectively. The SEM images show the single-phase nature of these samples. The EDS analysis gives the atomic percentage of the constituent elements which are very close to the initially selected composition of the respective samples [see the right inset of Fig. 11(b) and Fig. 12(b)]. The individual elemental mapping was obtained from the selected area marked by the red rectangle in Fig. 11(a) and Fig. 12(a). The elemental mapping in Fig. 11(c)-11(f) and Fig. 12(c)-12(f) describes the homogeneity of the samples. All these analyses along with XRD investigation resembles the homogeneity and single-phase nature of the compounds under study.
IX Magnetic Properties Studies
M(T) measurement for both the series of samples show bifurcation between the the FC and ZFC curve at low-temperature regions as a result of FM cluster formation during the field cooling process. Such bifurcation sustains even up to a high field of 5 T as can be seen from the (T) data at different values of external magnetic field for Mn2.8Pt0.2In and Mn2.8Ni0.2In samples [see Fig. 13 and Fig. 14]. Also, we have carried out the ac susceptibility measurement for Mn2.8Pt0.2In and Mn2.8Ni0.2In samples. The variation of the real part of ac susceptibility () with respect to temperature at various drive frequencies are shown in Fig. 15(a) and 15(b). The (T) shows a peak around the ordering temperature TN.
| Comosition | Require value ( ) | Obtained from EDAX () |
|---|---|---|
| Mn2.9Pt0.1In | Mn-72.5, Pt-2.5, In-25 | Mn-71.6, Pt-2.6, In-25.7 |
| Mn2.8Pt0.2In | Mn-70.0, Pt-5.0, In-25 | Mn-67.9, Pt-5.2, In-26.9 |
| Mn2.7Pt0.3In | Mn-67.5, Pt-7.5, In-25 | Mn-66.1, Pt-7.5, In-26.33 |
| Mn2.9Ni0.1In | Mn-72.5, Ni-2.5, In-25 | Mn-70.8, Ni-2.6, In-25.0 |
| Mn2.8Ni0.2In | Mn-70.0, Ni-5.0, In-25 | Mn-68.9, Ni-5.0, In-25.1 |
X Transport Properties
We have carried out the electrical transport measurement with a rectangular shape Hall bar. Fig. 16(a) and 16(b) represents the temperature dependence of longitudinal resistivity () of Mn3-xPtxIn and Mn3-yNiyIn in the temperature range of 2.5 -310 K. The resistivity of Mn3-xPtxIn and Mn3-yNiyIn samples decreases with increasing temperature i.e. a negative temperature coefficient of the resistivity. Whereas, pure Mn3In sample showed similar behavior only above the spin-glass transition temperature and below that found to be a metallic behavior [26, 36]. We have found the metallic behavior for Mn2.7Pt0.3In sample only. Fig. 16(c) shows the magnetoresistance (MR) effect of Mn2.8Ni0.2In sample at 5 K temperature. The percentage of MR is defined as 100 x (H-0)/(0), where H is the resistivity at magnetic field H and 0 is the resistivity at zero magnetic field.
XI Discussion about Extra Hall Effect (EH)
In our study, the Hall Effect experiments were performed with rectangular shape Hall bars. Also, we have performed the M(H) loop with the same sample used for Hall measurement following the same protocol and condition applied during Hall resistivity measurement. The experimental Hall resistivity ( yx) and the M-H plot are shown in Fig. 17(a) and 17(b) for 7 T field cooled case . Also, we have performed the zero field cooled Hall resistivity for the sample Mn2.8Ni0.2In [Fig. 17(c)]. The total Hall resistivity generally consists of two terms in trivial ferromagnetic/ferri-magnetic samples and can be expressed as yx= N + AH, where N and AH are the normal and anomalous Hall (AH) resistivity respectively. Normal Hall (N ) is given by N =R0H, where R0 is the normal Hall coefficient and related to the carriers density of the materials and H is the external magnetic field. AH resistivity arise from the intrinsic mechanism varies as the square of the longitudinal resistivity (xx) and directly scales with the magnetization (M) of the sample and can be written as AH=b2xxM, where b is the constant. So, yx can be written as yx= R0H + b2xxM at the high field and the unknown constant R0 and b is obtained by a straight line (y=mx+c) fitting in the plot of yx/H versus (2xxM)/H. The obtained parameters (R0 and b) are utilized to calculate the complete Hall loop by using the formula yx= R0H + b2xxM, where M is experimentally measured quantity i.e M(H). We have projected the calculated Hall resistivity data on the experimentaly obtain Hall data. We do not see any additional kind of Hall contribution in the ZFC Hall measurements [see Fig. 17(c)]. As can be seen form the Fig. 7 of the main manuscript that the calculated Hall resistivity matches perfectly with the experimental data at the high fields and a clear deviation appears at the first magnetization reversal region only. The calculated Hall resistivity (taking the experimentally measured M(H) into account) was subtracted from the experimental Hall data to obtain any extra Hall (EH) contribution.

The extra Hall (EH) may arise from the different mechanisms such as disorder, multichannel transport, or any chiral magnetic structure e.g. skyrmion/anti-skyrmion. It is well known that the spin of the conduction electron passing through a magnetic material tries to align with the local magnetization vector due to the large Hund’s coupling. Hence, an electron moving through a non-collinear spin structure with non-zero scalar spin chirality experiences a large fictitious magnetic field, giving rise to an extra component to the Hall Effect, called topological Hall Effect (THE). The basis of THE can be associated with a non-vanishing scalar spin chirality ijk = Si.(SjxSk), that corresponds to the solid angle subtended by three spins Si, Sj, andSk on a unit sphere. Therefore, THE can arise from a conventional non-coplanar magnetic ordering without the presence of any topological objects [42, 43, 24, 37]. Usually, the bump/dip kind of signature in Hall resistivity, which cannot be account for by the normal and anomalous Hall contribution is often signified as THE. However, without further evidence of topological object in the system under investigation diminishes the originality of the claim of THE. In this case, the observed bump/dip kind of signature in Hall resistivity can be readdressed in the shades of multichannel transport. More rigorously speaking, overlapping of AHE with opposite sign (one with +ve and another with –ve) can produce a signal similar to THE [46, 47, 48, 49, 50, 51]. In such cases, the opposite polarity of AHE with different coercive fields (Hc) and/or magnetization (M) occurs as a result of magnetic inhomogeneity. Also, the sign reversal in the AHE can be induced by varying the strength of the disorder [47, 50] in the system. This kind of magnetic inhomogeneity sometimes appears in the magnetic measurement like a step or dip kind of feature in M(H), broadening of longitudinal resistivity below the ordering temperature, signature of hysteresis, and step-like signal in the MR, etc. However, in our system, we don’t see any such ambiguity. Also, the XRD, SEM, and EDS study establishes the structurally single-phase nature and chemical homogeneity of the sample under investigation. Therefore, the observed EH in the present system most likely arises from the non-coplanar structure at the interface. We invoke some of the argument to validate the claim of the non-coplanar interface spin for observing THE. In the present system, the zero fields cooled (ZFC) M-H is linear with field and the value of magnetization is very small, suggesting a magnetic compensation. This is further supported by our DFT calculation, where we establish a completely compensated collinear ferrimagnetic state. However, the field cooled (FC) M-H data show a hard ferromagnetic signature with sharp transition at the field reversal region. This behavior can be related to the magnetization rotation of uncompensated interface spins which are the backbone of inducing the exchange bias effect. In this scenario, these uncompensated interface spin becomes maximal frustrated at the coercive field region. And we find an extra Hall contribution at the region of concern after the standard method of extraction of any extra Hall contribution. Therefore, we tried to provide a possible spin configuration of the interface based on the experimental result of EH. Where we have shown a possible non-coplanar spin arrangement (as they are the basis of THE) within a single domain AFM and multi-domain state. In such a case a non-coplanar structure subtending a finite solid angle may result in a THE.
XII DFT calculations
Here the degree of frustration indicates the deviation from the antiferromagnetic coupling between the two nearest neighboring Mn spins. The percentage of the total number of nearest neighbors which are frustrated divided by the total number of nearest neighbors for all Wyckoff sites gives the degree of frustration for a given configuration. It is clear from Fig. 18., that there is no direct correlation between the degree of frustration and the net magnetization of the unit cell. This may be due to the dominating effect of frustration arising from higher neighboring sites.