Panoply of doping-induced reconstructions and electronic phases in Ni-doped 1T-MoS2
Abstract
Monolayer MoS2 has promising applications in catalysis and optoelectronics, which can be enhanced by transition-metal doping. The 1T phase is metallic and also has several known distorted structures with distinct electronic properties. We use density-functional theory to investigate the effect of Ni-doping in 1T-MoS2, considering adatom and substitutional sites, and find an array of distorted phases induced by Ni-doping, beyond the ones typically reported. Depending on concentration and site, Ni-doping induces reconstructions to , (in two distinct phases), , and . The doped phases become semiconducting in most cases, and a few are also magnetic. These phases are metastable after removal of the dopant, offering a potential route to the experimental synthesis of pristine distorted phases. Most of these distorted pristine phases show spontaneous polarization and are potential ferroelectric materials. We find that the pristine phases have distinct semiconducting electronic structures, including several higher gaps in the conduction bands, which could have applications for transparent conductors, intermediate band solar cells, and nonlinear optics. Our calculations show that Ni-doping of 1T offers a systematic route to different distorted phases of 1T-MoS2, both doped and pristine, with a variety of electronic properties.
TOC Graphic
![[Uncaptioned image]](/html/2107.07541/assets/x1.png)
The crystal structure of MoS2 has strong covalent bonds in-plane and weak van der Waals interactions out of plane, and offers different stackings and single-layer polymorphs. In bulk, MoS2 can exist as 2H or 3R phase, which have similar energies and differ by stacking sequence and orientation of the 1H layers. In monolayer form, MoS2 exists as 1H and 1T, which differ by coordination around Mo: 1H has trigonal prismatic coordination and 1T has octahedral bonding. 1T is higher in energy, and so most studies of MoS2 have focused on the 2H or 1H phase, due to their greater stability. 2H-MoS2 has already shown promising applications in lubrication, hydrodesulfurization, and optoelectronics 1, 2, 3, 4. Studies related to 2H and 1H MoS2 also include tunability of band gap from direct to indirect 5, 6, good electron mobility 7, the possibility of defect engineering including creating quantum emitters 8, catalysis in solar hydrogen production 9, adsorption of CO or NO for potential gas sensors 10, or adsorption of O2 molecules 11. Theoretical and experimental work has shown that transition-metal-doping in MoS2 can improve catalytic reactivity 12, 13, 9, lubrication 14, 15 and gas sensing 10, 16 in 2H- and 1H-MoS2. However, much less is known about transition-metal doping in 1T-MoS2. Our previous work addressed the structural and electronics properties with Ni-doping in 1H-, 2H-, and 3R-MoS2 17. This study will look explicitly at properties of Ni-doped 1T-MoS2.
1T-MoS2 shows metallic behavior, uniquely among the polytypes of MoS2, which are otherwise semiconducting. The band gap variation is also possible from metallic nature to semiconducting up to a band gap of 1 eV by covalent functionalization 18. Recently, other applications of 1T-MoS2 have also been explored such as hydrogen evolution reaction 19, supercapacitors, batteries 20, 21 and photocatalysis 22. In addition, both edge and basal planes are catalytically active in 1T-MoS2 which makes 1T phase more attractive for catalysis than other phases of MoS2 where only edge planes are active 23, 24, 25. With such potential of various applications, many experimental techniques have been proposed to synthesize 1T-MoS2, including exfoliation of lithium-intercalated 2H-MoS2 26, hydrothermal methods 27, and external stimuli such as mechanical strain and electric fields 28. Theoretical calculations 29, 30 and experiments show 1T is unstable with respect to distortions and forms more stable phases such as 1T′ (), 1T′′ (), 1T′′′ (), or 31, 32, 33. (We will use the reconstruction notation predominantly in this work, for clarity.) Experiments show that a phase transition from 2H-MoS2 induced by Li intercalation also leads to formation of 1T′ 34 and 1T′′ structure 35, and both 1T′ and structures can be synthesized using deintercalation of K ions from KMoS2 crystals 36. Theoretical studies showed that Li adsorption 37 and charge doping 38, 39 can also induce structural distortion to 1T′ and other structural distortions such as a diamond-like clustering of Mo atoms. These more stable distorted 1T phases show other interesting properties for applications: for example, 1T′ has been calculated to be a topological insulator 40 and 1T′′′ has been predicted to be 2D ferroelectric material 41. The unique properties offered by more stable distorted 1T phases are interesting to explore. In this letter, we report a variety of different reconstructions induced by Ni-doping into 1T-MoS2, and compare the stability with Ni-doped 1H MoS2, analyze the mechanisms for reconstructions, and finally report electronic and magnetic properties.
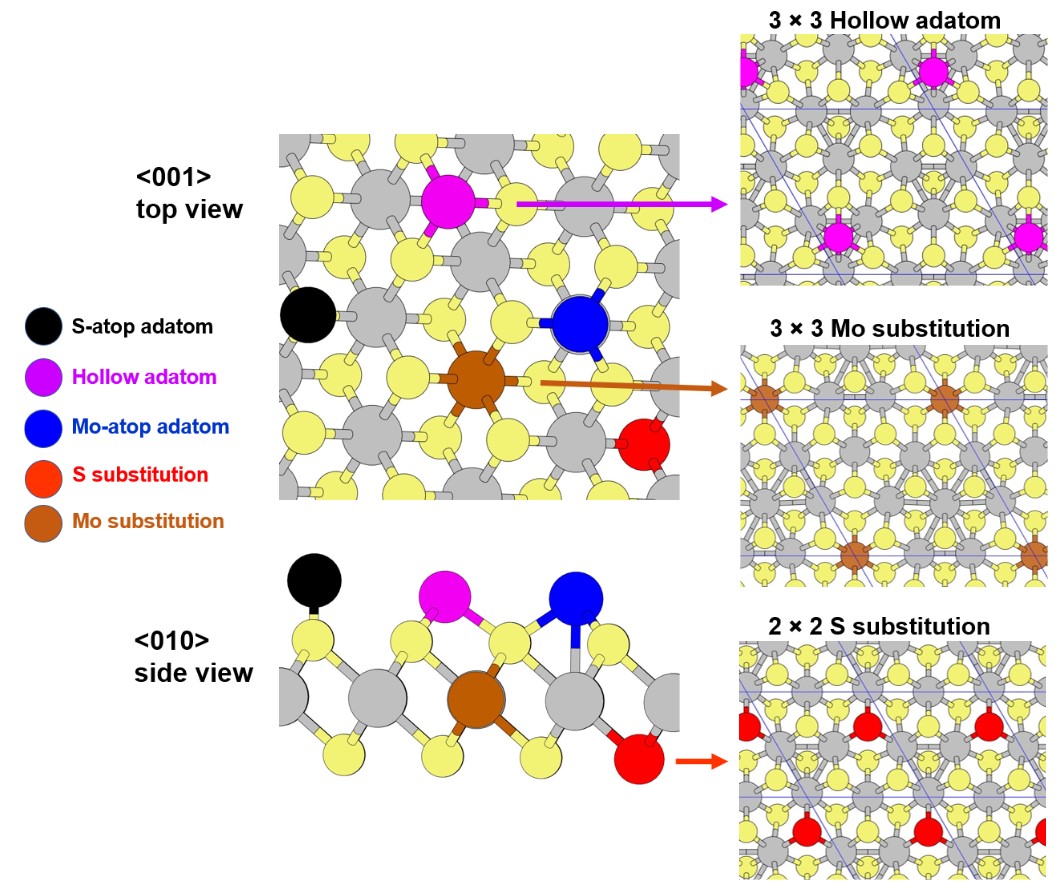
The most probable sites for dopants in MoS2 include substitutions and adatoms, and are shown in Fig. 2. The adatom positions are the same as in 1H-MoS2 17, since the individual S planes are the same in both polytypes. We also considered the bridge site along the Mo-S bond but found that an adatom in this site was unstable and relaxed to the hollow site (as in 1H)17, so it was not considered further. We will use these sites to study the various structural and electronic properties of Ni-doped MoS2.
We first compare the thermodynamic favorability of doping via the doping formation energy, which is a function of the chemical potentials during the growth process 42. It is given by
| (1) |
for substitution cases, and
| (2) |
for adatom cases, where is the doped supercell energy, is the number of units in the supercell, is the pristine unit cell energy, and and are the chemical potential of Ni and the removed Mo or S atom, respectively. is taken equal to the bulk Ni energy per atom, and for substitution cases, we consider both the “Mo-rich” () and “S-rich” () conditions, where we use calculations of the bulk phases of Mo and S 42, and the other species’ chemical potential is given by equilibrium with 1T-MoS2.
Relative stability of different monolayer phases in MoS2 is compared and is shown in Fig. 2(d). 1T is the highest-energy monolayer phase, and 1H is more favorable than 1T by 0.85 eV per MoS2 unit, in agreement with previous literature 43. For comparison, we look also at 1T bulk, which has been synthesized experimentally and showed superconductivity at 4 44. Lattice parameters for 1T bulk are 3.21 Å and 6.04 Å, close to experimental result 44 3.19 Å and 5.94 Å. The layer dissociation energy for 1T bulk is 0.20 eV per MoS2, which is 0.05 eV more than 2H-MoS2 17. The most stable distorted phase is 1T′ (), which is more stable than 1T bulk but less stable than 1H. For the purpose of doping formation energy calculations, in Equations 1 and 2, we will use this most stable 1T′ for .
The doping formation energies for Ni-doped MoS2 with Mo or S substitution and different adatom sites (Fig. 1) were computed with supercells from to . Fig. 2 shows results for adatoms in (a), substitutions (b), and phase diagram (c). Similar to other literature 45, we find Ni at hollow site is most favorable among adatoms, which is different than 1H case (Mo-atop was favorable) 17. Also, compared to 1H, substitutional doping is more favorable given 1T′ than 1H. However, given undistorted 1T, Ni doping is energetically favorable in all cases that leads to reconstructions to more stable structures, as will be discussed in next section. Despite the lower doping formation energies for 1T, the total energy of Ni-doped 1H is lower than Ni-doped 1T for each doping cases, as shown in Fig. S1. This means that given Mo, S and Ni atoms, formation of Ni-doped 1H is more favorable than Ni-doped 1T. Ni-doping does reduce the difference in energy between 1H and 1T, which is partly due to reconstruction of the doped 1T (will be discussed later). Mo substitution showed the largest reduction in the energy difference. The difference becomes smaller with high doping concentration, when the impact of Ni is proportionately greater. For example, in Mo substitution, the difference is 0.23 eV and 0.42 eV per MoS2 unit in 8% and 2% of doping concentration respectively. A phase transition from Ni-doped 1H to 1T might be possible at elevated temperature at higher doping concentration, particularly for the Mo-substituted case.
Figure S2 shows doping formation energy as a function of dopant concentration expressed as inverse of area. Unlike Ni-doping in other monolayer counterpart (1H) 17, the graph looks non-linear and does not show any sign of convergence. This behaviour is the first sign of unusual thing going on the structure. So, Ni-doping can cause structural distortion, and is the reason for such strange behaviour in Fig. S2. This also means that doping formation energy depends on the initial structural configurations. For example, in adatom cases, more energy is required to dope Ni into than others; likewise in S-substitution, less energy is required to dope into than others.
We additionally constructed phase diagrams of the stable doping site as a function of chemical potentials and , for Ni-doped 1T, as we did previously for other MoS2 polytypes 42, 17. The phase diagram shown in Fig. 2 (c) allows us to identify which doped structures can form in equilibrium and which are compatible with stability of the corresponding pristine structure. The hollow site is favored in the pristine stability region. The other doping sites are predicted to be accessible only out of equilibrium, except for the case where Mo and S substitution are also accessible.
For comparison of Ni-S and Ni-Mo bond length with 1H, we find similar qualitative result as stated in Ref. 17, Ni-S bond in Mo-substitution is smaller and Ni-Mo bond in S-substitution is larger than Mo-S bonds. We find the Ni-Mo bond length in S-substitution to be 2.51 Å similar as 1H, and in Mo-atop, Ni-Mo bond is 2.54 Å, and Ni-S bond is 2.06 Å(in 1H, Ni-Mo = 2.51 Å and Ni-S = 2.12 Å) 17. Ni-S bond in Mo-substitution is 2.25 Å, which is slightly less than in 1H (2.34 Å).
As indicated in previous discussion, different kinds of distortions occurred in the monolayer 1T phase related to its instability to 1T′ and other reconstructions 38, 31. Various patterns of Mo-atom clustering in the relaxed structures were observed depending on supercell size and doping scheme. The cause for distortion is Ni attracting S or repelling Mo in the neighbourhood surrounding of Ni, which results in distortions. In Mo substitution and Mo-atop, the Ni-S bond decreases which creates weaker Mo-S bonds; in S substitution and hollow, Ni-Mo bonds increases (Ni pushes Mo away); and in S-atop, a stronger Ni-S bond forms with Ni pulling more electrons towards it, leaving weaker Mo-S bonds. To determine if the corresponding pristine structures were stable or would relax back to the original 1T phase, we returned the doped structures to pristine by removing adatoms or restoring Mo or S atoms to Ni-substituted sites, and relaxed the resulting structures. This process of removal of adatoms is akin to the methods used to synthesize 1T phases via Li or K atoms 46, and undoing Ni substitution of Mo or S seems plausible via ion-exchange methods that have been used to interconvert different TMDs 47, and therefore the route used in our calculations may also constitute a viable method for experimental synthesis.
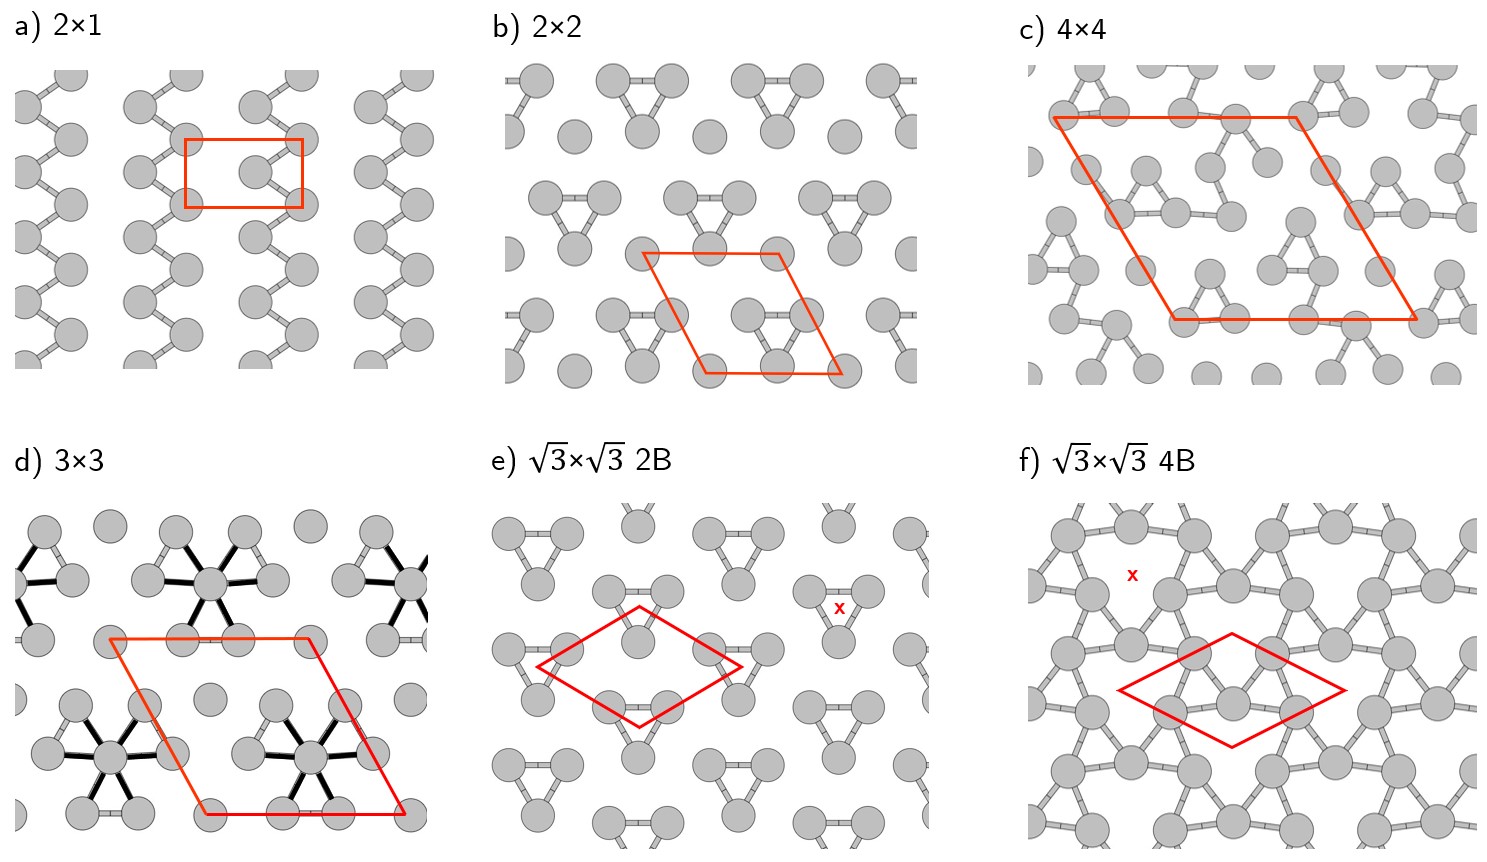
Most of the structures relaxed to previously known phases ( or ) 38, 31, 30, 29 while a few structures were not found in the literature and seem to be new metastable phases of 1T. Note that supercells for even are compatible with only or structures, while the supercell is commensurate with . The details of new phases after removal or replacement with relaxation are shown in Table 1: the identified phases’ lattice parameter and Mo-Mo distance are close to those of Zhuang et al. 38, who calculated an Mo-Mo distance of 2.78 Å for and 2.84 Å for though we also have a lower-energy and more closely clustered resulting from S substitution. To differentiate between two differently clustered structures, we will use number of bonds in the cluster and specify 2B for two Mo bonds and 4B for four Mo bonds. Interestingly we found many works referring to both these two distinct structures as although the structure and properties are distinct, and therefore the distinction between those is necessary. Examples of Mo-Mo clustering with doping and after removal or replacement are shown in Fig. 1 and 3. The , 2B and 4B structures are 0.21 eV, 0.19 eV and 0.26 eV per MoS2 lower in energy than 1T respectively. The phases not previously reported are obtained from and Mo substitution, and the energies are 0.08 eV and 0.15 eV per MoS2, respectively: lower than 1T, but higher than the other reconstructions. Interestingly, the most stable reconstructed structure induced by Ni–doping is 4B and has similar energy to 1T′ (), only by 0.002 eV higher per MoS2. The 4B structure has been synthesized experimentally 36 with the lattice parameter 5.58 Å, which is close to our result ( 5.61 Å). Also, Mo-Mo bonds reported in the same experiment is 3.01 Å and Mo-Mo bond in our case is 3.02 Å. The 2B, 4B obtained in supercell, and obtained in supercell are obtained by finding the reduced unit cell (primitive cell) of those supercell, with consistent results obtained from both Phonopy 48 and the Bilbao Crystallographic Server 49, 50. Space group as identified using Findsym 51 for undistorted 1T is . The space group of is ; is ; and for 2B and 4B is . All distorted phases except and have point group , has and has point group. Both phases have all 3 Mo atoms equivalent, at the Wyckoff positions, but in one there are two Mo bonds to each Mo atom, and the axis is in the middle of a 3-membered Mo ring, whereas in the other there are four Mo bonds to each Mo atom, and the axis is in between 3-membered Mo rings.
| Doping type | |||
| Mo subs. | |||
| S subs. | 4B | ||
| Hollow | 2B | ||
| Mo-atop | |||
| S-atop | 2B |
| a) | ||||||
| Structure | (Å) | (Å) | (eV) | (eV) | ||
| 3.18 | 3.18 | 0 | 0 | |||
| 5.67, 3.18 | 2.78 | -0.26 | 0.02 | |||
| 6.43 | 2.78 | -0.21 | 0.08 | |||
| 9.73 | 2.68 | -0.08 | 0.28 | |||
| 2B | 5.64 | 2.84 | -0.19 | 0.59 | ||
| 4B | 5.61 | 3.02 | -0.26 | 0.83 | ||
| 13.01 | 2.78 | -0.15 | 0.25 | |||
| b) | ||||||
| Structure | Gap (eV) | Number of bands below gap | ||||
| 0.46 | 1.63 | 2 | ||||
| 0.58 | 3.98 | 2 | ||||
| 0.30 | 4.81 | 8 | ||||
| 0.19 | 0.81 | 2 | ||||
| 0.15 | 1.92 | 3 | ||||
| 0.52 | 4.52 | 11 | ||||
| 0.08 | 0.42 | 2 | ||||
| 0.25 | 1.34 | 7 | ||||
| 0.09 | 2.15 | 6 | ||||
| 0.46 | 4.46 | 21 | ||||
| 0.83 | 1.20 | 3 | ||||
| 2B | 0.22 | 2.54 | 3 | |||
| 0.73 | 4.40 | 6 | ||||
| 0.22 | 1.70 | 3 | ||||
| 4B | 0.38 | 4.89 | 9 | |||
| 0.11 | 1.84 | 17 | ||||
| 0.39 | 4.69 | 47 | ||||
Next, we found a variety of electronic structures in the Ni-doped and pristine reconstructions. For Ni-doped phases, the DOS is shown in Fig. S4 and band gaps in Table S1. For pristine reconstructions, the DOS is shown in Fig. S5, the band gaps in Table 2, and the band structures in Fig. 4. When undoped, the 1T phase is metallic 53, 54. 1T showed a metal-to-semiconductor transition in most cases we considered; only Mo-substituted and , S-substituted , Mo-atop , and S-atop and remained metallic. This anomalous electronic behavior comes from the reconstructed clustering of Mo atoms which depends on both doping scheme and doping concentration. Also, as discussed earlier, of the new phases in 1T after removal or replacement of Ni with relaxation, all of the obtained structures are semiconducting. The undistorted 1T has octahedral geometry and crystal field of such geometry suggests splitting of orbitals () over orbitals () but undistorted 1T is unstable and relax to other distorted phase and on doing this, the degeneracy of electronic states can be lifted to lower the energy by structural distortion.29 As shown in Fig. 4, small band gaps exist in . Our band structure for is comparable to Ref. 55. Gaps in higher conduction band is observed in undistorted 1T even though the structure is metallic. Multiple gaps in the conduction band is preserved or added by distorted phases except by structure (Fig. S6 (a)). We plotted the density of states in a uniform -grid (shown in Fig. S5) to confirm that the gaps are not due to choice of -path in the Brillouin zone. Common to all, a gap of 0.30–0.73 eV exists above 4 eV from the valence band maximum (VBM). The -orbital of Mo starts to contribute more at that region transitioning from orbitals of Mo and is therefore such gap exists in all structures above 4 eV from the VBM. Similar result of gap about 0.5 eV above 4 eV from VBM was found due to -orbital in ReS2 bilayers where they used time–resolved second harmonic generation microscopy to monitor the additional electron absorption state.56 Other gaps in lower conduction band is dominated by -orbitals of Mo and -orbital of S. Here we define band complexes which is a group of bands separated by a gap in the conduction band. Usually -orbitals contribution are dominated from the clustered Mo except in first two band complex of . For the first band in the band complex above 2 eV from VBM, the shape orienting not necessarily in -direction is dominant, and contribution of such shape in the band complexes below 2 eV is small. There are some band complexes in the different structures that agrees to Hckel model like behaviour in the wavefunction where same orbitals differ in bands within band complex by a sign or a magnitude. In the Mo cluster, only the first band of both structures have bonding orbitals, and in most of the case the Mo cluster have node causing antibonding nature in the cluster. The idea of multiple gaps can be utilized in intermediate band solar cells57 where photon of different energy can be excited into intermediate band, and such intermediate bands are obtained due to defect state or doping. In our case, we have multiple gaps due to clustering of Mo bonds that can be used intermediate band solar cell. Ideally, intermediate bands solar cell needs to have metal-like intermediate band, with filled and empty states which can facilitate electronic transition.58 When these structures are slightly doped, they can have electrons available to conduct although the material is semiconducting. Also, some of the Ni-doped structures (Fig S7 (b) and (d)) has metallic intermediate bands. Also a patent on multiple band gaps with Co-Ni oxide compositions has also been reported to be used for intermediate band solar cells. 59 Likewise the application of multiple gaps can also be applied as the transparent conducting materials.60 The band gaps and other gaps away from valence band maximum is summarized in Table 2. Also note that we computed bandstructures with spin-orbit coupling and DFT+, and we found that adding spin-orbit coupling did not cause a significant splitting in the bandstructure while DFT+ method slightly changed the width of gaps, but overall conclusion regarding multiple gaps was not affected.
We computed the oxidation state of Ni following the methodology suggested by Sit et al. 61 for assigning oxidation states based on -orbital occupations from spin-polarized DFT+ calculations, using values of 5.5 eV for Ni 62 and 4 eV for Mo 63. The results were similar to other polytypes 17: we found an oxidation state of Ni4+ in Mo substitution for all concentrations in 1T (as for high concentration for 1H, 2H, 3R). This result agrees with a conclusion from X-ray photoemission for Mo substitution by Ni in 1T-MoS2 64. S-substitution and adatoms showed Ni2- (as for all 1H, 2H, and 3R concentrations). DFT+ calculations were also performed for DOS and found to be qualitatively similar to the non-DFT+ calculations.
We also computed the spontaneous polarization in the different reconstructions as all obtained structures are non-centrosymmetric. 4B has been calculated as a 2D ferroelectric material with an equivalent bulk polarization of 0.28 C/cm2 (using the S-S distance as the height along the direction),41 which corresponds to a 2D polarization of /Å. Previous literature has reported values in terms of this somewhat ill-defined bulk polarization, but we will use instead the better-defined polarization per unit area as befitting a 2D material. Our calculation agrees with this previous result. The obtained polarization magnitudes for 2B, , , and are /Å, /Å, /Å, and /Å, respectively. The polarizations are out of plane for 2B, 4B, and because in-plane polarization is forbidden in the point group. There is in-plane polarization for () and (), with polarization vectors /Å and /Å, respectively. is metallic and therefore has no polarization. We can make a simple analysis of the plausibility of ferroelectric switching in these structures, assuming the switching barrier is at the (paraelectric) undistorted 1T structure. We obtain switching energy estimates for our structures from 0.03 eV/atom to 0.09 eV/atom. These values are comparable to the barriers for typical ferroelectric materials such as PbTiO3 (0.01 eV/atom) and PbZrO3 (0.04 eV/atom) whose polarization are 0.79 and 0.70 .65 Moreover, there could be a lower-energy switching pathway. These results suggest the polarization may indeed be switchable, indicating a true ferroelectric.
We also checked the invariants of all of the obtained metastable reconstructions using Z2Pack.66, 67 As noted earlier, the parity criterion of valence band showed the structure40 to have index as 1, whereas our calculation based on hybrid Wannier center embedded in Z2Pack showed index to be 1. For all other structures, we found index to 0 indicating topologically trivial.
We investigated the presence of magnetism in the doped structures, given reports of magnetism in some structures of doped 1H-MoS2 63, 17. Some 1T reconstructions showed magnetization. The magnetic moments in S substitution and are 0.23 and 0.78 respectively; S-atop and are 0.30 and 0.20 respectively. The magnetic moments around Mo and S sites were negligible and these reported moments all represent magnetic moments around Ni site. In some cases (S-atop and S-substitution ), we have semiconducting magnets, which could be interesting for spintronics 68. Using the mean-field approximation to predict Curie temperatures, considering only spin-magnetic moments, yields 59.16 , 493.1 , 485.1 , and 238.5 for S substitution and , and S-atop and , respectively. The magnitude of energy difference of spin polarized the non-polarized state are relatively large in the case where magnetization was seen as shown in Table 3 but are less than 0.08 meV where magnetization is absent.
| Doping type | () | (meV) | Electronic nature |
| S subs. | 0.23 | -1.64 | semiconductor |
| S subs. | 0.78 | -27.91 | metal |
| S atop | 0.30 | -17.32 | metal |
| S atop | 0.20 | -7.86 | semiconductor |
To conclude our work, we studied Ni–doped 1T MoS2 and the different reconstructions induced by doping with Ni. We found that the most thermodynamically favorable site for Ni-doping is an adatom on the hollow site. Ni-doped 1T formed reconstructed phases, based on the pristine structures such as or 2B, , 4B and , where the two structures differ by the number of Mo-Mo bonds. These structures also showed spontaneous polarization that could be useful as ferroelectric material. Similarly, these structures also showed multiple gaps away from valence band maximum which has potential application in intermediate band solar cells and transparent conductive materials. Ni-doping of 1T mostly showed metal-to-semiconductor transitions due to the reconstructions, and sometimes caused a small magnetic moment. These calculation shows that Ni-doping on 1T-MoS2 could be used as a way to synthesize a range of distorted pristine phases, through methods such as dissolution or evaporation of adatoms, ion exchange for Mo or S substitution, or epitaxial growth of pristine phases on top of a Ni-doped monolayer. Such structures can be interesting for applications in optoelectronics and catalysis, and also could offer other interesting properties, as can be elucidated by further investigation on these new structures.
Supplementary Information
Further computational details, full structural/electronic/magnetic properties of Ni-doped 1T MoS2, doping formation energies as a function of concentration, bandstructures of doped, density of states for both doped and pristine systems (PDF). Relaxed atomic coordinates for Ni-doped 1T MoS2, undistorted and reconstructed 1T structures (XSF).
Acknowledgments
We acknowledge Enrique Guerrero for preparing the phase diagram. This work was supported by UC Merced start-up funds and the Merced nAnomaterials Center for Energy and Sensing (MACES), a NASA-funded research and education center, under award NNX15AQ01. This work used computational resources from the Multi-Environment Computer for Exploration and Discovery (MERCED) cluster at UC Merced, funded by National Science Foundation Grant No. ACI-1429783, and the National Energy Research Scientific Computing Center (NERSC), a U.S. Department of Energy Office of Science User Facility operated under Contract No. DE-AC02-05CH11231.
Methods
In this work, we use plane-wave density functional theory (DFT) in Quantum ESPRESSO version 6.1 69, 70. We use the PBE exchange-correlation functional 71 in general, with the semi-empirical Grimme-D2 (GD2) 72 van der Waals correction (for consistency with bulk calculations, though the effect is small for monolayers). The similarity of results are shown in Fig. 2 (d). We used Optimized Norm-Conserving Vanderbilt pseudopotentials 73, 74 from the SG15 set 75 for PBE and from Pseudodojo 76 for LDA. Further calculation details are in the Supplementary Information. We used the dipole correction method 77 to compute out-of-plane dipole moments, and the Berry-phase method78 for in-plane polarization to study ferroelectric properties. The topological properties were analyzed using Z2Pack66, 67 software based on hybrid Wannier charge centers that determines the invariant index.
References
- Mao et al. 2018 Mao, J.; Wang, Y.; Zheng, Z.; Deng, D. The rise of two-dimensional MoS2 for catalysis. Front. Phys. 2018, 13, 138118
- Radisavljevic et al. 2011 Radisavljevic, B.; Radenovic, A.; Brivio, J.; Giacometti, V.; Kis, A. Single-layer MoS2 transistors. Nat. Nanotech. 2011, 6, 147–150
- Lopez-Sanchez et al. 2013 Lopez-Sanchez, O.; Lembke, D.; Kayci, M.; Radenovic, A.; Kis, A. Ultrasensitive photodetectors based on monolayer MoS2. Nat. Nanotech. 2013, 8
- Krause et al. 2010 Krause, O. et al. High-precision cryogenic wheel mechanisms of the JWST/MIRI instrument: performance of the flight models. SPIE 2010, 7739, 773918
- Splendiani et al. 2010 Splendiani, A.; Sun, L.; Zhang, Y.; Li, T.; Kim, J.; Chim, C.-Y.; Galli, G.; Wang, F. Emerging Photoluminescence in Monolayer MoS2. Nano Lett. 2010, 10, 1271–1275
- Mak et al. 2010 Mak, K. F.; Lee, C.; Hone, J.; Shan, J.; Heinz, T. F. Atomically Thin MoS2: A New Direct-Gap Semiconductor. Phys. Rev. Lett. 2010, 105, 136805
- Kaasbjerg et al. 2012 Kaasbjerg, K.; Thygesen, K. S.; Jacobsen, K. W. Phonon-limited mobility in n-type single-layer MoS2 from first principles. Phys. Rev. B 2012, 85, 115317
- Lin et al. 2016 Lin, Z.; Carvalho, B. R.; Kahn, E.; Lv, R.; Rao, R.; Terrones, H.; Pimenta, M. A.; Terrones, M. Defect engineering of two-dimensional transition metal dichalcogenides. 2D Mater. 2016, 3, 022002
- Ma et al. 2016 Ma, X.; Li, J.; An, C.; Feng, J.; Chi, Y.; Liu, J.; Zhang, J.; Sun, Y. Ultrathin Co(Ni)-doped MoS2 nanosheets as catalytic promoters enabling efficient solar hydrogen production. Nano Research 2016, 9, 2284–2293
- Ma et al. 2016 Ma, D.; Ju, W.; Li, T.; Zhang, X.; He, C.; Ma, B.; Lu, Z.; Yang, Z. The adsorption of CO and NO on the MoS2 monolayer doped with Au, Pt, Pd, or Ni: A first-principles study. Appl. Surf. Sci. 2016, 383, 98 – 105
- Zhao et al. 2017 Zhao, B.; Liu, L. L.; Cheng, G. D.; Li, T.; Qi, N.; Chen, Z. Q.; Tang, Z. Interaction of O2 with monolayer MoS2: Effect of doping and hydrogenation. Mater. Des. 2017, 113, 1 – 8
- Jeong et al. 2018 Jeong, G.; Kim, C. H.; Hur, Y. G.; Han, G.-H.; Lee, S. H.; Lee, K.-Y. Ni-Doped MoS2 Nanoparticles Prepared via Core–Shell Nanoclusters and Catalytic Activity for Upgrading Heavy Oil. Energy Fuels 2018, 32, 9263–9270
- Hakala et al. 2017 Hakala, M.; Kronberg, R.; Laasonen, K. Hydrogen adsorption on doped MoS2 nanostructures. Sci. Rep. 2017, 7, 15243
- Jun-Feng et al. 2012 Jun-Feng, Y.; Braham, P.; Qian-Feng, F. Tribological properties of transition metal di-chalcogenide based lubricant coatings. Front. Mater. Sci. 2012, 6, 116–127
- Vazirisereshk et al. 2019 Vazirisereshk, M. R.; Martini, A.; Strubbe, D. A.; Baykara, M. Z. Solid Lubrication with MoS2: A Review. Lubricants 2019, 7, 57
- Tedstone et al. 2016 Tedstone, A. A.; Lewis, D. J.; O’Brien, P. Synthesis, Properties, and Applications of Transition Metal-Doped Layered Transition Metal Dichalcogenides. Chem. Mater. 2016, 28, 1965–1974
- Karkee et al. 2021 Karkee, R.; Guerrero, E.; Strubbe, D. A. Enhanced interlayer interactions in Ni-doped MoS2, and structural and electronic signatures of doping site. Phys. Rev. Materials 2021, 5, 074006
- Tang and Jiang 2015 Tang, Q.; Jiang, D. Stabilization and Band-Gap Tuning of the 1T-MoS2 Monolayer by Covalent Functionalization. Chem. Mater. 2015, 27, 3743–3748
- Ambrosi et al. 2015 Ambrosi, A.; Soferb, Z.; Pumera, M. 2H →1T phase transition and hydrogen evolution activity of MoS2, MoSe2, WS2 and WSe2 strongly depends on the MX2 composition. Chem. Commun. 2015, 51, 8450–8453
- Acerce et al. 2015 Acerce, M.; Voiry, D.; Chhowalla, M. Metallic 1T phase MoS2 nanosheets as supercapacitor electrode materials. Nat. Nanotech. 2015, 10, 313–318
- Geng et al. 2017 Geng, X.; Jiao, Y.; Han, Y.; Mukhopadhyay, A.; Yang, L.; Zhu, H. Freestanding Metallic 1T MoS2 with Dual Ion Diffusion Paths as High Rate Anode for Sodium-Ion Batteries. Adv. Funct. Mater. 2017, 27, 1702998
- Du et al. 2016 Du, P.; Zhu, Y.; Zhang, J.; Xu, D.; Peng, W.; Zhang, G.; Zhang, F.; Fan, X. Metallic 1T phase MoS2 nanosheets as a highly efficient co-catalyst for the photocatalytic hydrogen evolution of CdS nanorods. RSC Adv. 2016, 6, 74394–74399
- Mlinar 2017 Mlinar, V. Electronic and optical properties of nanostructured MoS2 materials: influence of reduced spatial dimensions and edge effects. Phys. Chem. Chem. Phys. 2017, 19, 15891–15902
- Liao et al. 2014 Liao, T.; Sun, Z.; Sun, C.; Dou, S. X.; Searles, D. J. Electronic Coupling and Catalytic Effect on H2 Evolution of MoS2/Graphene Nanocatalyst. Sci. Rep. 2014, 4, 6256
- Liu et al. 2017 Liu, L.; Li, X.; Xu, L.-C.; Liu, R.; Yang, Z. Effect of edge structure on the activity for hydrogen evolution reaction in MoS2 nanoribbons. Appl. Surf. Sci. 2017, 396, 138–143
- Benavente et al. 2002 Benavente, E.; Santa-Ana, M.; Mendizábal, F.; González, G. Intercalation chemistry of molybdenum disulfide. Coord. Chem. Rev. 2002, 224, 87 – 109
- Hu et al. 2017 Hu, J.; Huang, B.; Zhang, C.; Wang, Z.; An, Y.; Zhou, D.; Lin, H.; Leungc, M. K. H.; Yang, S. Engineering stepped edge surface structures of MoS2 sheet stacks to accelerate the hydrogen evolution reaction. Energy Environ. Sci. 2017, 10, 593–603
- Song et al. 2016 Song, S.; Keum, D. H.; Cho, S.; Perello, D.; Kim, Y.; Lee, Y. H. Room Temperature Semiconductor-Metal Transition of MoTe2 Thin Films Engineered by Strain. Nano Lett. 2016, 16, 188–193
- Zhao et al. 2018 Zhao, W.; Pan, J.; Fang, Y.; Che, X.; Wang, D.; Bu, K.; Huang, F. Metastable MoS2: Crystal Structure, Electronic Band Structure, Synthetic Approach and Intriguing Physical Properties. Chem. Eur. J. 2018, 24, 15942–15954
- Ge et al. 2020 Ge, Y.; Wan, W.; Ren, Y.; Liu, Y. Large thermoelectric power factor of high-mobility transition-metal dichalcogenides with 1T′′ phase. Phys. Rev. Res. 2020, 2, 013134
- Pal et al. 2017 Pal, B.; Singh, A.; G., S.; Mahale, P.; Kumar, A.; Thirupathaiah, S.; Sezen, H.; Amati, M.; Gregoratti, L.; Waghmare, U. V.; Sarma, D. D. Chemically exfoliated MoS2 layers: Spectroscopic evidence for the semiconducting nature of the dominant trigonal metastable phase. Phys. Rev. B 2017, 96, 195426
- Sokolikova and Mattevi 2020 Sokolikova, M. S.; Mattevi, C. Direct synthesis of metastable phases of 2D transition metal dichalcogenides. Chem. Soc. Rev. 2020, 49, 3952
- Heising and Kanatzidis 1999 Heising, J.; Kanatzidis, M. G. Exfoliated and Restacked MoS2 and WS2: Ionic or Neutral Species? Encapsulation and Ordering of Hard Electropositive Cations. J. Am. Chem. Soc. 1999, 121, 11720–11732
- Eda et al. 2012 Eda, G.; Fujita, T.; Yamaguchi, H.; Voiry, D.; Chen, M.; Chhowalla, M. Coherent Atomic and Electronic Heterostructures of Single-Layer MoS2. ACS Nano 2012, 6, 7311–7317
- Dungey et al. 1998 Dungey, K. E.; Curtis, M. D.; Penner-Hahn, J. E. Structural Characterization and Thermal Stability of MoS2 Intercalation Compounds. Chem. Mater. 1998, 10, 2152–2161
- Fang et al. 2019 Fang, Y.; Hu, X.; Zhao, W.; Pan, J.; Wang, D.; Bu, K.; Mao, Y.; Chu, S.; Liu, P.; Zhai, T.; Huang, F. Structural Determination and Nonlinear Optical Properties of New 1T′′′Type MoS2 Compound. J. Am. Chem. Soc. 2019, 141, 790–793
- Kan et al. 2014 Kan, M.; Wang, J. Y.; Li, X. W.; Zhang, S. H.; Li, Y. W.; Kawazoe, Y.; Sun, Q.; Jena, P. Structures and Phase Transition of a MoS2 Monolayer. J. Phys. Chem. C 2014, 118, 1515–1522
- Zhuang et al. 2017 Zhuang, H. L.; Johannes, M. D.; Singh, A. K.; Hennig, R. G. Doping-controlled phase transitions in single-layer MoS2. Phys. Rev. B 2017, 96, 165305
- Chen et al. 2020 Chen, K.; Deng, J.; Shi, Q.; Ding, X.; Sun, J.; Yang, S.; Liu, J. Z. Charge doping induced reversible multistep structural phase transitions and electromechanical actuation in two-dimensional 1T′-MoS2. Nanoscale 2020, 12, 12541–12550
- Qian et al. 2014 Qian, X.; Liu, J.; Fu, L.; Li, J. Quantum spin Hall effect in two-dimensional transition metal dichalcogenides. Science 2014, 346, 1344–1347
- Shirodkar and Waghmare 2014 Shirodkar, S. N.; Waghmare, U. V. Emergence of Ferroelectricity at a Metal-Semiconductor Transition in a Monolayer of . Phys. Rev. Lett. 2014, 112, 157601
- Guerrero et al. 2021 Guerrero, E.; Karkee, R.; Strubbe, D. A. Phase stability and Raman/IR signatures of Ni–doped MoS2 from DFT studies. J. Phys. Chem. C 2021, 125, 13401–13412
- Chen et al. 2013 Chen, X.; Chen, Z.; Li, J. Critical electronic structures controlling phase transitions induced by lithium ion intercalation in molybdenum disulphide. Chin. Sci. Bull. 2013, 58, 1632–1641
- Fang et al. 2018 Fang, Y.; Pan, J.; He, J.; Luo, R.; Wang, D.; Che, X.; Bu, K.; Zhao, W.; Liu, P.; Mu, G.; Zhang, H.; Lin, T.; Huang, F. Structure Re-determination and Superconductivity Observation of Bulk 1T MoS2. Angew. Chem. Int. Ed. 2018, 57, 1232 –1235
- Hao et al. 2019 Hao, Y.; Wang, Y. T.; Xu, L. C.; Yang, Z.; Liu, R. P.; Li, X. Y. 1T-MoS2 monolayer doped with isolated Ni atoms as highly active hydrogen evolution catalysts: A density functional study. Appl. Surf. Sci. 2019, 469, 292 – 297
- Liu et al. 2018 Liu, L.; Wu, J.; Wu, L.; Ye, M.; Liu, X.; Wang, Q.; Hou, S.; Lu, P.; Sun, L.; Zheng, J.; Xing, L.; Gu, L.; Jiang, X.; Xie, L.; Jiao, L. Phase-selective synthesis of 1T’ MoS2 monolayers and heterophase bilayers. Nat. Mater. 2018, 17, 1108–1114
- Chen et al. 2017 Chen, H.; Chen, Z.; Ge, B.; Chi, Z.; Chen, H.; Wu, H.; Cao, C.; Duan, X. General Strategy for Two-Dimensional Transition Metal Dichalcogenides by Ion Exchange. Chem. Mater. 2017, 29, 10019–10026
- Togo and Tanaka 2015 Togo, A.; Tanaka, I. First principles phonon calculations in materials science. Scr. Mater. 2015, 108, 1–5
- Aroyo et al. 2011 Aroyo, M. I.; Perez-Mato, J. M.; Orobengoa, D.; Tasci, E.; de la Flor, G.; Kirov, A. Crystallography online: Bilbao Crystallographic Server. Bulg. Chem. Commun. 2011, 43, 183–197
- Aroyo et al. 2006 Aroyo, M. I.; Perez-Mato, J. M.; Capillas, C.; Kroumova, E.; Ivantchev, S.; Madariaga, G.; Kirov, A.; Wondratsche, H. Bilbao Crystallographic Server I: Databases and crystallographic computing programs. Z. Krist. 2006, 221, 15–27
- Stokes and Hatch 2005 Stokes, H. T.; Hatch, D. M. Program for Identifying the Space Group Symmetry of a Crystal. J. Appl. Cryst. 2005, 38, 237–238
- Cordero et al. 2008 Cordero, B.; Gómez, V.; Platero-Prats, A. E.; Revés, M.; Echeverría, J.; Cremades, E.; Barragán, F.; Alvarez, S. Covalent radii revisited. Dalton Trans. 2008, 21, 2832–2838
- Komsa and Krasheninnikov 2015 Komsa, H.-P.; Krasheninnikov, A. V. Native defects in bulk and monolayer MoS2 from first principles. Phys. Rev. B 2015, 91, 125304
- Coutinho et al. 2017 Coutinho, S.; Tavares, M.; Barboza, C.; Frazão, N.; Moreira, E.; Azevedo, D. L. 3R and 2H polytypes of MoS2: DFT and DFPT calculations of structural, optoelectronic, vibrational and thermodynamic properties. J. Phys. Chem. Solids 2017, 111, 25 – 33
- Hu et al. 2013 Hu, T.; Li, R.; Dong, J. A new () dimerized structure of monolayer 1T-molybdenum disulfide, studied from first principles calculations. J. Chem. Phys. 2013, 139, 174702
- Dhakal et al. 2018 Dhakal, K. P.; Kim, H.; Lee, S.; Kim, Y.; Lee, J.; Ahn, J.-H. Probing the upper band gap of atomic rhenium disulfide layers. Light Sci. Appl. 2018, 7, 98
- Luque et al. 2012 Luque, A.; Martí, A.; Stanley, C. Understanding intermediate-band solar cells. Nat. Photonics 2012, 6, 146–152
- Luque and Martí 2001 Luque, A.; Martí, A. A Metallic Intermediate Band High Efficiency Solar Cell. Prog. Photovolt: Res. Appl. 2001, 9, 73–86
- Carter et al. 2019 Carter, E. A.; Alidoust, N.; Lessio, M. Multiple band gap Co-Ni oxide compositions and applications thereof. 2019, patent number:10,256,361
- Brunin et al. 2019 Brunin, G.; Ricci, F.; Ha, V.-A.; Rignanese, G.-M.; Hautier, G. Transparent conducting materials discovery using high-throughput computing. npj Comput. Mater. 2019, 5, 63
- Sit et al. 2011 Sit, P. H.-L.; Car, R.; Cohen, M. H.; Selloni, A. Simple, Unambiguous Theoretical Approach to Oxidation State Determination via First-Principles Calculations. Inorg. Chem. 2011, 50, 10259–10267
- Zhu et al. 2018 Zhu, Y.; Liang, X.; Qin, J.; Deng, L.; Bi, L. Strain tunable magnetic properties of 3d transition-metal ion doped monolayer MoS2: A first-principles study. Int. J. Quantum Chem. 2018, 8, 055917
- Wu et al. 2018 Wu, M.; Yao, X.; Hao, Y.; Dong, H.; Cheng, Y.; Liu, H.; Lu, F.; Wang, W.; Cho, K.; Wang, W.-H. Electronic structures, magnetic properties and band alignments of 3d transition metal atoms doped monolayer MoS2. Phys. Lett. A 2018, 382, 111–115
- Luo et al. 2019 Luo, R.; Luo, M.; Wang, Z.; Liu, P.; Song, S.; Wang, X.; Chen, M. The atomic origin of nickel-doping-induced catalytic enhancement in MoS2 for electrochemical hydrogen production. Nanoscale 2019, 11, 7123
- Beckman et al. 2009 Beckman, S. P.; Wang, X.; Rabe, K. M.; Vanderbilt, D. Ideal barriers to polarization reversal and domain-wall motion in strained ferroelectric thin films. Phys. Rev. B 2009, 79, 144124
- Gresch et al. 2017 Gresch, D.; Autès, G.; Yazyev, O. V.; Troyer, M.; Vanderbilt, D.; Bernevig, B. A.; Soluyanov, A. A. Z2Pack: Numerical implementation of hybrid Wannier centers for identifying topological materials. Phys. Rev. B 2017, 95, 075146
- Soluyanov and Vanderbilt 2011 Soluyanov, A. A.; Vanderbilt, D. Computing topological invariants without inversion symmetry. Phys. Rev. B 2011, 83, 235401
- Liu et al. 2016 Liu, W.; Zhang, H.; Shi, J.; Wang, Z.; Song, C.; Wang, X.; Lu, S.; Zhou, X.; Gu, L.; Louzguine-Luzgin, D. V.; Chen, M.; Yao, K.; Chen, N. A room-temperature magnetic semiconductor from a ferromagnetic metallic glass. Nat. Commun. 2016, 7, 13497
- Giannozzi et al. 2009 Giannozzi, P. et al. QUANTUM ESPRESSO: a modular and open-source software project for quantum simulations of materials. J. Phys.: Condens. Matter 2009, 21, 395502
- Giannozzi et al. 2017 Giannozzi, P. et al. Advanced capabilities for materials modelling with Quantum ESPRESSO. J. Phys.: Condens. Matter 2017, 29, 465901
- Perdew et al. 1996 Perdew, J. P.; Burke, K.; Ernzerhof, M. Generalized Gradient Approximation Made Simple. Phys. Rev. Lett. 1996, 77, 3865–3868
- Grimme 2006 Grimme, S. Semiempirical GGA-Type Density Functional Constructed with a Long-Range Dispersion Correction. J. Comput. Chem. 2006, 27, 1787–1799
- Hamann 2013 Hamann, D. R. Optimized norm-conserving Vanderbilt pseudopotentials. Phys. Rev. B 2013, 88, 085117
- Schlipf and Gygi 2015 Schlipf, M.; Gygi, F. Optimization algorithm for the generation of ONCV pseudopotentials. Comput. Phys. Commun. 2015, 196, 36–44
- web http://www.quantum-simulation.org/potentials web http://www.quantum-simulation.org/potentials,
- web http://www.pseudo-dojo.org web http://www.pseudo-dojo.org,
- Bengtsson 1999 Bengtsson, L. Dipole correction for surface supercell calculations. Phys. Rev. B 1999, 59, 12301–12304
- Resta 1994 Resta, R. Macroscopic polarization in crystalline dielectrics: the geometric phase approach. Rev. Mod. Phys. 1994, 66, 899–915