Status of the Yakutsk air shower array and future plans
Abstract
The Yakutsk Extensive Air Shower Array has been continuously operating for more than 50 years (since 1970) and up until recently it has been one of world’s largest ground-based instruments aimed at studying the properties of cosmic rays in the ultra-high energy domain. In this report we discuss results recently obtained at the array — on cosmic rays energy spectrum, mass composition and directional anisotropy — and how they fit into the world data. Special attention is paid to the measurements of muonic component of extensive air showers. Theoretical results of particle acceleration at shocks are also briefly reviewed. Future scientific and engineering plans on the array modernization are discussed.
I Introduction
The only way to study the properties of cosmic rays (CR) with energies above eV is by registering extensive air showers (EAS) — cascades of secondary particles produced by high-energy CRs hitting Earth’s atmosphere. On one hand by studying the EAS properties one can investigate hadron interactions at energies unreachable for terrestrial particle acceleration technology. On the other hand — EAS method provides the basis for obtaining crucial information on primary CR properties: their energy spectrum, mass composition and distribution of arrival directions on the celestial sphere. Hence, EAS study is a dedicated area of CR physics at the intersection of astrophysics and nuclear physics.
There are many techniques of EAS registration and all of them are based on the detection of shower particles and accompanying emission in various ranges. The most common type of an instrument intended for EAS registration is a ground-based EAS array which is, basically, a network of particle detectors distributed over a certain area of ground surface.
After the prediction was made about CR spectrum abrupt cut-off at eV due to CR interaction with recently discovered cosmic microwave background (CMB) [1, 2], a series of projects had been started around the world, aiming at creation of large EAS arrays capable of providing sufficient statistics in the ultra-high energy domain. One of this projects have resulted in the creation of the Yakutsk extensive air shower array (YEASa).
The YEASa is a stationary research site located in the Lena river valley 55 km south of Yakutsk (Russia) (61.7∘ N, 129.4∘ E, m above the sea level, atmospheric depth — 10200pt). It is one of the longest running experiments that register the flux of the ultra-high energy CRs (UHECR): it has been continuously operating since 1973. From the very beginning it was created as a complex instrument, capable of measuring several EAS components with different types of detectors. Charged and electromagnetic (e-m) components of air showers are measured with surface scintillation detectors (SD). Muons are registered with the similar detectors buried below the ground level: such placement prevents the contamination of the muon data with e-m component by providing a shielding with energy threshold GeV.
The array controls a wide range of CR energy (), from eV up to and above eV, thanks to its three-threshold trigger. The basis of the array is a network of forty-nine observation detector points (or “stations”) that form a triangular pattern and covers the area of 11 km2. Each triangle serves as a local trigger for events selection. The so-called “Trigger-500” (T500) is formed by triangles with 500-m side and selects events with eV. The “Trigger-1000” (T1000) is formed by triangles with 1000-m side and selects events with energy starting from about eV. Each station contains a pair of 2 m2 scintillation detectors operating in 2 s coincidence mode. Scintillation detectors are continuously calibrated by array’s data acquisition and synchronization system (DAQ) and are adjusted by amplitude density spectra of background cosmic muons [3, 4].
Nineteen stations in central part of the array are equipped with integral optical detectors providing measurement of Cherenkov light emission produced by charged component of air showers (Main ChA). In the center of the array are located detectors that form a standalone small array that selects events by Cherenkov light with threshold energy around eV — the Small Cherenkov Array (Small ChA) [5]. It has a rather complex trigger that accounts for various combinations of fired detectors. The latest addition to this setup is a system of three observational points, each housing fast differential Cherenkov detectors based on camera-obscura principle (the “Obscura”) [6]. First point, “Obscura-1”, also contains a set of scintillation detectors and muon telescopes [7]. The “Obscura” system is also equipped with a DAQ that controls a set of dipole antennas registering radio-emission of EAS within the 30-35 MHz frequency band [8].
The array has been continuously operating for more than 50 years. During this period an extensive and uniform data set has been accumulated. Here we give an overview of recent results obtained with this instrument.
II Cosmic Ray Energy Spectrum
The main EAS parameters at the YEASa — arrival direction, location of a showers core and primary energy — are reconstructed by the lateral distribution function (LDF) of e-m and charged components registered with SD. This particles travel through a multi-layered shield with a total thickness 0pt and through a 5 cm scintillator, releasing a portion of energy measured in arbitrary units , which is proportional to the MeV, the vertical muon equivalent (VEM).
The LDFs of the SD response were obtained within the frameworks of four hadron interaction models for primary protons and iron nuclei for energy range eV [9]. The main energy estimator at the YEASa is — a measured particle density at 600 m from the shower core. The energy is reconstructed with the use of quasi-calorimetric method based on estimation of the energy fraction dissipated by e-m component in the atmosphere described in [10]. EAS simulations performed with CORSIKA code [11] gave a new refined estimation of CR energy:

| (1) |
where is a value converted to vertical shower direction. The resulting energy spectrum is shown on Fig. 1(a) with black circles (Yakutsk SD). It includes more than events registered at the YEASa during the continuous period of operation from 1974 to 2017. Simulations gave energy estimation lower by factor compared to the previous one, given in [10].
With black squares on the same panel is shown energy spectrum obtained by the measurement of Cherenkov light emission at the YEASa — with both Main ChA and Small ChA (Yakutsk Cherenkov) [20]. Energy was estimated with the use of a similar quasi-calorimetric technique that utilizes a flux of Cherenkov photons at a certain core distance as an energy estimator:
| (2) |
| (3) |
where and are energy estimators at 150 m and 400 m from shower core correspondingly. Expression (2) is used in energy range PeV and expression (3) — to estimate primary energy of showers above eV.
At first glance it follows from Fig. 1(a) that the spectrum measured with the use of Cherenkov technique is significantly lower than the measured by SD. But given that the uncertainties of calorimetric methods (1) and (2-3) are above 20 % and about 15 % correspondingly, if one applies just a 5 % correction to the estimated energy in both spectra, then they start to agree within experimental errors, as shown on Fig. 1(b).
On lower panels of Fig. 1 the results of the YEASa are shown in comparison with CR spectra measured by different world experiments: Tunka-133 [12], IceCube [13], Telescope Array (TA) [14], the Pierre Auger Observatory (PAO) [15], HiRes [16], Akeno [17] and AGASA [18]. On Fig. 1(c) values are shown without any correction of energy scale, on Fig. 1(d) energy scale of each experiment was tuned by its own coefficient, also shown on panel (d). Lines represent the predictions of the CR diffusive shock acceleration model [19] described in details in section IV. It is seen that after applying such energy rescaling all results agree with each other within experimental errors.
III Cosmic Ray Mass Composition
The YEASa has been continuously registering CRs at energy above eV — for 50 years. During this period a unique dataset have been accumulated on e-m, muon and Cherenkov components of EAS. These measurements allowed us to reconstruct the cascade curve of shower development and its parameters, namely — the depth of maximum shower development () which is sensitive to CR mass composition and further investigate the dynamics of its change with increase of energy. The was reconstructed from LDF of Cherenkov light in EAS measured at the YEASa [21]. The results are shown on Fig. 2(a) with black circles (Main ChA) together with measurements of different arrays: Tunka-133 [22], HiRes [23], PAO [24], TA [25] and LOFAR [26]. With lines are denoted energy dependencies according to the predictions of hadron interaction models QGSJet II-04 [27], EPOS-LHC [28], and Sibyll-2.3c [29].

The mean atomic number of primary CR particles () can be estimated from a relation that follows from principle of nucleon superposition as:
| (4) |
where values of were obtained in experiment (“exp”) and in model calculations for primary protons () and iron nuclei (Fe). Interpretation of measurements is shown on Fig. 2(b). This result was obtained for limited data selection with QGSJet II-04 model, which explains discrepancy with the shown data.
Another method of the CR mass composition estimation utilized at the YEASa — is to derive values from parameters of LDF measured by SD [30]:
| (5) |
where and . This approach gives us:
| (6) |
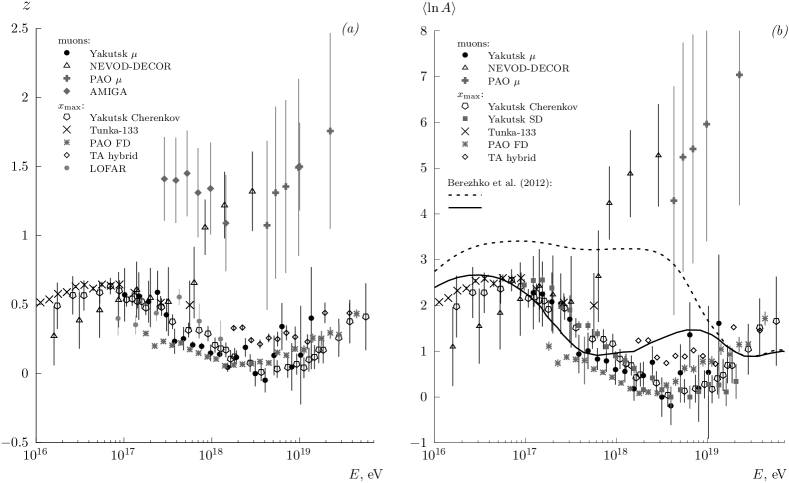
where is a parameter of the SD LDF local steepness. On Fig. 2(c) is shown a comparison of estimations obtained with two methods described above. Black circles denote results obtained with Main ChA [21]; with black triangles — results obtained with Small ChA [20]; stars — estimation with the use of SD technique described in [30].
Comparison of Yakutsk results with the world data is shown on Fig. 2(d). Lines represent the predictions of the diffusive CR shock acceleration model within two scenarios described in details in Section IV. As can be seen from the figure, there are irregularities of the value of , due to a change in mass composition. It was found that at energies up to eV CR composition is abundant with nuclei with atomic numbers in the region. In the eV interval the fraction of protons starts increasing and peaks at %. At energy above eV CR mainly consist of helium nuclei, nuclei from the CNO group and heavier elements [21, 30].
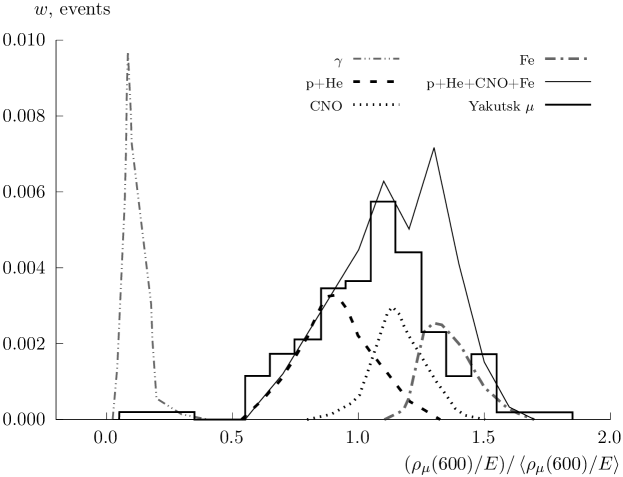
On Fig 3 an estimation of the CR mass composition is shown, obtained with a slightly different technique: by combining measurements performed on the main muon setup of the YEASa and on muon telescopes included in the Small ChA setup. We have estimated the CR mass composition in energy range eV by muon fraction in registered EASs. It was found that % of CRs in this energy region are protons and helium nuclei, % — nuclei from the CNO group, % — iron nuclei and about % are primary gamma-photons of UHE [7]. This preliminary result was obtained within the framework of QGSJet II-04 model [27] and is roughly consistent with results shown on Fig. 2.
III.1 Upper limit of the integral photon flux in the ultra-high energy domain
Photons do not deviate from their initial direction in magnetic fields and because of this property are a good instrument for the search of point sources of UHECRs. That is why any information on primary gamma-photons can be used for deriving the properties of the CR sources and for studying the interaction of UHE photons with photonic field of the Universe. The development of EAS initiated by neutral particles should significantly differ from that in EAS of hadronic nature. Neutral particles generate air showers with deep in the atmosphere; and EASs from primary gamma-photons contain significantly less muons since they are dominated by e-m component.
A multi-component experimental data set of the YEASa allowed us to select showers whose properties were hinting at their photonic origin. The final selection included 11 candidate events. The performed analysis resulted in estimation of the upper limit for integral primary photon flux at energy above eV. The obtained results are shown on Fig. 4 with black arrows. On the same figure, together with the data from AGASA [35], PAO [33, 34], and TA [36], our previous result [32] is shown. Curves denote the predictions of theoretical models, developed within the framework of “top-down” scenarios of UHECR generation [37, 38, 39]. Shaded area corresponds to the GZK-mechanism [40].
If one considers “hadronic” events as a background, then it is possible to claim with a high degree of confidence, that selected showers were initiated by primary photons. The probability of at least one such event in our data set equals to , and all in the case of all 11 showers it equals to 0.011, which is consistent with other experiments and with results of theoretical calculations.
IV Theory of particle acceleration at shocks
Theoretical studies of CR origin at the Institute has a long history since the discovery by G. F. Krymsky of the process of regular (diffusive) acceleration of charged particles at the fronts of shock waves [41]. A large amount of theoretical and experimental studies carried out since then convincingly indicate that the process of regular acceleration underlies a big number of various phenomena in the generation of spectra of superthermal particles in various astrophysical objects. Today, almost all studies aimed at explaining the origin of CR are based on considering the possibilities of regular acceleration under various conditions. This mechanism turned out to be so universal and effective that it made it possible to explain many of the properties of CRs [42]. Later, a numerical model for study the diffusive shock acceleration of CRs in supernova remnants has been developed. It can also describes the evolution of remnants and the properties of their nonthermal radiation [43, 44]. It was shown that the acceleration of CR by supernova remnants is characterized by high efficiency enough to compensate for the losses associated with CRs escape from the Galaxy. The model also describes well most of the observed properties of the nonthermal radiation of supernova remnants SN 1006, SN Tycho, SN 1987A and others.
By applying the established features of CR acceleration in supernova remnants (magnetic field amplification, CR escape, etc.) to large-scale shock waves generated in the intergalactic medium by the energy release from active galactic nuclei, it was shown that nonrelativistic shock waves generated by jets from active galactic nuclei, can effectively accelerate charged particles up to energies eV and able to form the observed CR spectrum of extremely high energies [45].
There are two scenarios of the formation of the total CR spectrum are usually considered. Within the first of them (“dip” scenario), the galactic CR component prevails up to energy eV, in the energy range eV a transition from the galactic to the extragalactic component of CRs occurs. In the second scenario (“ankle” scenario), the extragalactic component prevails at energies above eV, and the galactic component extended up to eV. The galactic components in both scenarios are produced in type Ia supernova remnants, where protons are accelerated up to eV and iron nuclei up to eV. In “ankle” scenario there is a second component of galactic CRs from more powerful type IIb supernovae, which explode in the dense wind of a presupernova star, where maximum energy of accelerated particles can reach eV. On Figure 1d the modeled CR spectra of “dip” and “ankle” scenarios are shown by solid and dashed lines, respectively. One can see, that both models describe the experimental data more or less well.
Since the maximum energy of accelerated in supernova remnants CRs is proportional to the charge of particles, towards the end of the galactic component heavier elements, up to iron, begin to dominate and the composition of CRs becomes heavier. On Figures 2d and 7b the modeled value of as function of energy compared with the modern experimental data. Here also “dip” and “ankle” scenarios are shown by solid and dashed lines, respectively. It is clearly seen, that the “ankle” scenario with the second galactic component accelerated in type IIb supernova remnants rejected by existing measurements. Thus, comparison of detailed modeling with experimental data indicates that galactic CRs are accelerating in supernova remnants up to eV (see [19] for more details and references).
V Muon Component of Extensive Air Showers
High-energy muons111with energies GeV are important component of EASs. They are almost not absorbed in the air and travel through soil and rock and can be detected deep below the ground level. Since they are direct descendants of nuclear interactions occurring during air shower development, the muon density () is sensitive to the characteristics of said interactions and also to the mass composition of primary CR initiating EAS in the Earth’s atmosphere.
At the same time, for more than 10 years both experimenters and theorists have been noting the problem of muon excess in EAS with energies above eV relative to the values obtained in numerical calculations performed with the use of UHE hadron interaction models. This problem is widely known within the CR research community as the “Muon Puzzle”. Recently an international workgroup has published a meta-analysis that covers a large volume of experimental data on muon content in EAS [46]. The analysis evaluates both recent results of currently running experiments (IceCube [47], NEVOD-DECOR [48, 49], PAO [50, 51, 52] and YEASa among others) and archive data. In the end a preliminary conclusion was made that none of the hadron interaction models that are widely used in the UHECR research can adequately describe the behaviour of muon component of EAS with energies above eV. Furthermore, the discrepancy rises with increasing energy.
Despite the recently obtained hints of a possible solution to the Muon Puzzle in future experiments at Large Hadron Collider (LHC) [53], this problems stays unresolved to this day. And besides the discrepancy between model predictions and experimental data, there is a mismatch between different experiments.
V.1 The lack of muon excess in Yakutsk data?
Since registration of EAS is indirect method of CR observation, each array uses its own experimental technique and utilizes unique methods for reconstruction of parameters of primary CRs. And each experiment uses its own classification parameter for estimation of characteristics of the muon component.
In order to compare muon content in EAS measured on different arrays, authors of the review [46] have introduced an arbitrary scale parameter :
| (7) |
where is a classification parameter of muon flux measured in experiment, and are, correspondingly, values of this parameters obtained in simulations for primary protons and iron nuclei.
Regular measurements of muon component in air showers at the YEASa have started in 1976 [56]. Current configuration of the muon setup consists of three detector points located at 0.5 and 1.0 km from the array center. Each point is an underground housing covered with a -m layer of soil that forms a shield with GeV threshold and absorbs the e-m component.
At the YEASa the main muon estimator is particle density at core distance 300 m — [55]. The obtained preliminary values were included in the meta-analysis. Though after applying of energy rescaling the Yakutsk data became vaguely consistent with the majority of the presented data, the energy dependence of -parameter differs significantly from other experiments.
On Fig. 5(a) these values are shown without energy rescaling (Yakutsk ). It is seen that they are suspiciously consistent with the values derived from interpretation of the data of other experiments, obtained mainly with the use of optical methods and by registering the EAS radio-emission [22, 24, 25, 54]. A good agreement is also observed between muon and Cherenkov data of the YEASa [21, 55].
On Fig. 5(b) are shown estimations of the CR mean atomic number obtained in different experiments. It follows that the Yakutsk muon data are also compatible with estimation derived from the parameters of the LDF measured by SD [30]. Both Yakutsk values and estimations based on the interpretation of the data of other experiments are also roughly consistent with predictions of the CR diffusive shock acceleration model for the case of the “dip”-scenario described in detail in Section IV (shown with solid line).
Therefore an intriguing picture is emerging in the UHE domain. Muon measurements performed at the YEASa contradict the results of other experiments [48, 49, 50, 51, 52] where muon fluxes are measured directly, but agree with measurements of longitudinal shower development. It is obvious that it is premature to draw any conclusion, we have to test the treatment and interpretation of our data at first.
VI Directional Anisotropy Studies
VI.1 A beam of ultra-relativistic particles in cosmic rays
Recently an indication of a short-lived beam of UHE particles was reported. Three particles with energies above eV were registered from a compact sky region during one day: from Jan. 21, 2009 23:40:35 to Jan. 22, 2009 22:54:22 (UTC). Two particles were detected at the YEASa [57, 58] and one — at TA [59]. Chance probability of occurrence of such a triplet was estimated to be [60]. Estimated energies of two particles registered in Yakutsk were nearly identical, eV and eV correspondingly. After the refinement of the Yakutsk energy estimation [9] one may confidently claim that energy of the TA event was twice the energy of two Yakutsk events [61].
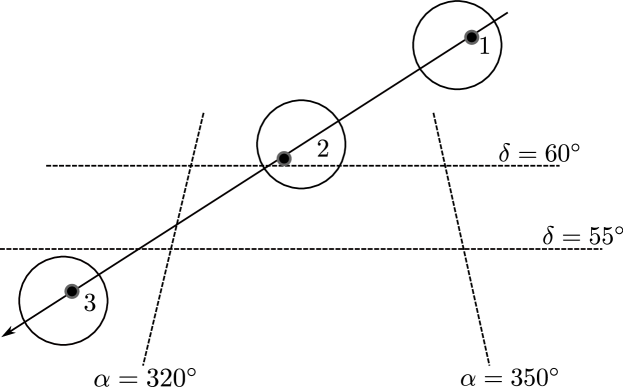
It is only possible to consider all three particles as a beam if they were emitted by a point source, but their arrival directions lie within which is inconsistent with this condition. But it is still possible to consider this hypothesis if the source was moving. Thus, as a possible source of ultrarelativistic particles a non-stationary relativistic jet was considered. From the observer’s point of view the front of the forming jet may be deemed as a subluminal point source.
Empty circles in Fig. 6 indicate the celestial coordinates of all three events in the equatorial coordinate system. The circle sizes roughly correspond to the experimental errors. Black line with an arrowhead and black dots represent the best fit to the parameters under the assumption that the apparent source of particles was moving with a constant angular velocity. It is seen that the moving point source hypothesis is actually consistent with experimental data. If all three events coincided by chance, then such an ordered arrangement of coordinates would be unlikely. This confirms our hypothesis that two EAS arrays have registered the arrival of the actual beam of UHECR particles.
However, since the entire phenomenon lasted for a whole day and this in turn means that the source was moving much faster then light. This paradox can be explained by the kinematics of a relativistic source moving toward the observer. In our case, this effect is amplified by a mechanism that we call the Cherenkov resonance. The essence of the mechanism is as follows. The source is a front of a non-stationary relativistic jet that propagates at subluminal velocity towards the Solar system. Trajectories of UHE particles emitted by the source are curved in a large-scale magnetic field. The mean particle speed along the line of sight can become noticeably lower than the speed of light and lower than the source’s speed. Some of the particles emitted by the source on a certain path segment will then come to the observer simultaneously, in the form of a beam.
The difference in particle magnetic rigidities should not be great and hence it follows that one of them could be a helium nucleus and two other particles could be protons. The phenomenon of the Cherenkov resonance should be general in nature. In particular, it can be suggested that short gamma-ray bursts also act as manifestations of the Cherenkov resonance [61].
VI.2 Zenith angular distribution of cosmic rays
The zenith angle distribution of EAS from UHECR has been a subject of numerous studies since the very beginning of EAS measurements. Modern arrays measure both the sizes and incident directions of showers. Previous studies of zenith angle distribution at the YEASa were performed mainly at the highest energies where the full trigger efficiency is reached. In order to maximize the statistics and extend the dataset towards the lower energies we have considered the distribution in the wide energy range, with energy-dependent array exposure due to absorption of showers in the atmosphere.
The method consists in introducing a unified particle density threshold in the observed showers and applying of a log-normal distribution for approximation of fluctuations of the main classification parameter used at the yeas — . It allows one to describe the expected zenith angular distribution with a simple analytical formula:
| (8) |
where , is a normalization constant, , the mean density is defined by the attenuation curve and is the RMS deviation which is a free parameter during a fit to experimental data. This allowed us to estimate the particle attenuation length and the frequency rate of EAS events, both of which are crucial for obtaining the arrival direction distribution. To obtain the EAS frequency rate distribution over the zenith angle, within the framework of this approach we have re-processed our data in the energy range eV and studied its tight connection with the absorption in the atmosphere.
With the use of the resulting distributions we performed a search for the CR flux anisotropy in equatorial system and established an upper limit for a fraction of the CR flux from a point source. The resulting distribution over the right ascension () can be described with a uniform distribution arising from the diurnal rotation of the celestial sphere.
Such a uniform distribution dictates the application of the harmonic analysis. As a null hypothesis we took an isotropic distribution when expected amplitudes of all harmonics within the limit are equal to zero and a non-zero amplitude of the first harmonic appears if there is a point source of CR. The phase of the harmonic points the direction towards the source along the right ascension.
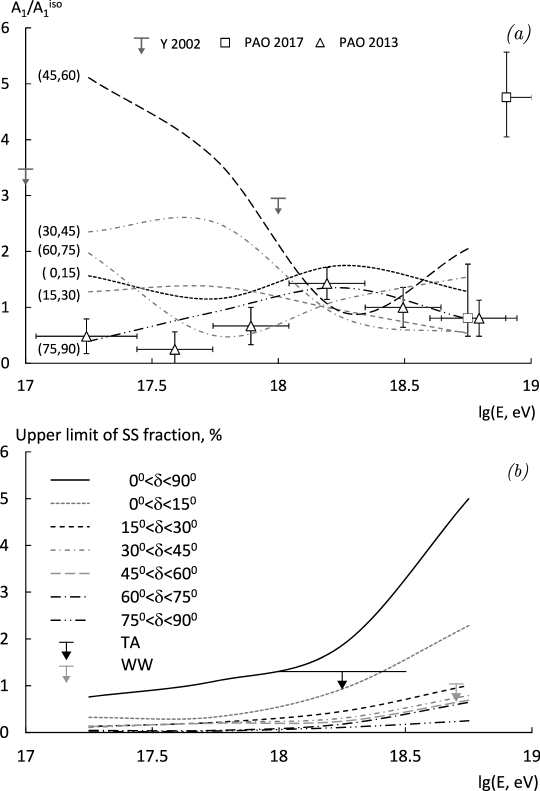
To involve the declination distribution in the analysis, one may apply harmonic analysis withing the rings of limited in intervals of the declination. It is convenient to express the first harmonic amplitude in units of isotropic amplitude which is governed by the sample size . If there is a significant deviation from the expected value then our null hypothesis should be rejected. The results of this analysis together with the previous data are shown on Fig. 7a.
There is a significant deviation from from isotropy at energies below eV within the declination interval , but this effect actually arises from seasonal variations of atmospheric conditions [64]. At the same time the data of PAO [63] reveal a large-scale anisotropy at a confidence level, but the anisotropy dipole points to the declination which if outside of the YEASa’s field of view. On the whole, the Yakutsk data do not show a statistically significant deviation [62] from the null hypothesis [65].
There is also a possibility to estimate the statistical power of the method in a situation when there is a separable source (SS) of CR and we need to calculate the upper limit for the fraction of the UHECR flux from it in the total background. Let this SS is presented within the declination interval, at right ascension and introduces the fraction to the isotropic flux of CR. Then this alternative hypothesis could be rejected at a high confidence level by comparing the expected first harmonic amplitude with the observed one ().
To calculate the first harmonic amplitude one has to sum vectors of the length pointing to a source direction , and isotropic vectors of the same length. By applying the central limit theorem we get the amplitude squared [65]:
| (9) |
As a result of comparison with the observed amplitude of the first harmonic of the right ascension distributions in the declination intervals, the upper limits of the CR flux fraction from the hypothetical SS, shown on Fig. 7, were obtained in comparison with the previous results [66, 67] in the energy range eV. This result currently represents the strongest constraints on the fraction of CR flux from a separable CR source in this energy range in the Northern Hemisphere.
VII Prospect of the future upgrade
The YEASa is currently being upgraded with the main goals to improve the accuracy of angular measurements and primary energy estimation. The uncertainty in energy estimation is expected to be reduced by increasing the accuracy of particle density measurement in individual events and with introduction of a new set of Cherenkov light detectors. An upgraded DAQ will provide temporal measurements with improved accuracy.
For improvement of amplitude measurements a new type of detector station electronics unit (SEU) was developed, internally nicknamed “SEU-v.4”. Unlike the old SEU (“SEU-v.3”) with timing resolution 100 ns and amplitude RC-resolution 100 s, the SEU-v.4 was developed as an easily reconfigurable multipurpose device based on a field-programmable gate array chip (FPGA). It provides the resolution of timing and amplitude RC-measurements of 6.25 ns.
Synchronization in the new DAQ (internally nicknamed “EAS-v.4”) is provided by reconfigurable “Synchronization Center” (SC) with a source based on time server Meinberg M600. Together with SEU-v.4 units it can provide the accuracy of temporal measurements not worse than ns which should result in five-fold increase of the accuracy for reconstruction of EAS arrival direction. The new system provides online monitoring and real-time diagnostics of the detectors condition and, what is more important for studying the EAS and UHECR physics, is capable of performing on-the-fly re-configuration of the accounting of delays in communication lines. Currently 19 stations located around the center of the array are equipped with updated SEUs, more stations are expected to be upgraded in the nearest future. There is also a plan to implement measurement of the time-base of the detector’s signal in the new DAQ.
The main characteristic of differential Cherenkov detectors is timing resolution: it defines the accuracy of reconstruction of EAS parameters. This has lead to the design of a high-resolution detector based on the Frensel lense and Hamamatsu R1250 PMT [68]. Currently a prototype cluster of four such detectors undergoes a field-test which has demonstrated scientific and economic efficiency of such a design. Recently an algorithm was developed for digital processing of the detector signal time-base and for reconstruction of saturated pulses. It was shown that the signal reflects the features of longitudinal development of EAS and is sensitive to the CR mass composition [69].
As discussed in Section V, measurements of muon component are vital for the EAS studies — from both astrophysical and nuclear points of view. In order to improve the accuracy and statistics of muon measurements at the YEASa, plans are to extend the existing grid of muon detectors. Preliminary design is to deploy additional ten observational points of 4 m2 area each and with Gev threshold.
VIII Conclusion
The Yakutsk Extensive Air Shower Array has been continuously operating for more than 50 years and has accumulated a unique and extensive set of data on various EAS components.
The long noted difference between cosmic-ray fluxes obtained from the array’s SD and its Cherenkov detectors can be mitigated by adjusting both energy estimates by only 5 %, which is well within the energy reconstruction uncertainties of both methods.
Different methods of measuring the UHECR mass composition give consistent results. In particular, the mass composition derived from the muon measurements agrees well with the results of -based methods, both from SD and Cherenkov detectors.
The possible lack of muon excess according to the Yakutsk data, reviewed in Section V, represents an intriguing separate element of the Muon Puzzle. While presented results contradict to the direct muon measurements performed by world experiments, they are consistent with both -based results of other arrays and predictions of theoretical models of UHECR generation. It is premature to make a final conclusion, first of all it is necessary to test and re-evaluate the treatment and interpretation of our data and also to refine the measurements technique. Recently initiated extensive modernization of the Yakutsk instrument should contribute to solving this problem.
Acknowledgements.
This this report was made within the framework of the research project No. AAAA-A21-121011990011-8 curated by the Ministry of Science and Higher Education of the Russian Federation.References
- Zatsepin and Kuzmin [1966] G. T. Zatsepin and V. A. Kuzmin, JETP Lett. 4, 78 (1966).
- Greisen [1966] K. Greisen, Phys. Rev. Lett. 16, 748 (1966).
- Glushkov et al. [1974] A. V. Glushkov, O. S. Diminshtein, T. A. Egorov, N. N. Efimov, L. I. Kaganov, et al., in Experimental Methods of Very High Energy Cosmic Rays Research (YaF SO AN SSSR, Yakutsk, 1974) pp. 43–47, in Russian.
- Borodina et al. [1974] G. A. Borodina, V. P. Valkov, V. E. Gevrasev, et al., in Experimental Methods of Very High Energy Cosmic Rays Research (YaF SO AN SSSR, Yakutsk, 1974) pp. 48–51, in Russian.
- Knurenko et al. [1998] S. P. Knurenko, V. A. Kolosov, Z. E. Petrov, A. Pudov, R. G. Sidorov, and I. Y. Sleptsov, Sci. Edu. 1998(4) (1998), in Russian.
- Mokhnachevskaya et al. [2018] V. Mokhnachevskaya, Y. A. Egorov, S. Knurenko, and Z. Petrov, PoS 301, 341 (2018).
- Knurenko and Petrov [2020] S. P. Knurenko and I. S. Petrov, Phys. Rev. D 102, 023036 (2020), arXiv:2007.08135 [astro-ph.HE] .
- Knurenko et al. [2017] S. P. Knurenko, Z. E. Petrov, and I. S. Petrov, Nucl. Instr. Methods A 866, 230 (2017).
- Glushkov et al. [2018] A. V. Glushkov, M. I. Pravdin, and A. V. Saburov, Phys. Atom. Nucl. 81, 575 (2018).
- Egorov [1993] T. A. Egorov (for the Yakutsk EAS array), in Proc. of the Tokyo Workshop on Techniques for the Study of Extremely High Energy Cosmic Rays, edited by M. Nagano (ICRR, Univ. Tokyo, 1993) p. 35.
- Heck et al. [1988] D. Heck, J. Knapp, J. N. Capdevielle, G. Schatz, and T. Thouw, CORSIKA: A Monte Carlo Code to Simulate Extensive Air Showers, FZKA 6019 (Forschungszentrum Karlsruhe, 1988).
- Berezhnev et al. [2012] E. S. Berezhnev, H. Besson, N. M. Budnev, A. Chiavassa, O. A. Gress, et al., Nucl. Instr. Methods A 692, 98 (2012), arXiv:1201.2122 [astro-ph.HE] .
- Aartsen et al. [2013] M. G. Aartsen, R. Abbasi, Y. Abdou, M. Ackermann, J. Adams, et al., Phys. Rev. D 88, 042004 (2013), arXiv:1307.3795 [astro-ph.HE] .
- Abbasi et al. [2016] R. U. Abbasi, M. Abe, T. Abu-Zayyad, M. Allen, R. Azuma, et al., Astroparticle Phys. 80, 131 (2016).
- Aab et al. [2015a] A. Aab, P. Abreu, M. Aglietta, E. J. Ahn, I. A. Samarai, et al., The Pierre Auger Observatory: Contributions to the 34th International Cosmic Ray Conference (ICRC 2015) (2015a), Proc. 34th ICRC, 2015, The Hague, The Netherlands, arXiv:1509.03732 [astro-ph.HE] .
- Zundel [2016] Z. Zundel (for Telescope Array Collab.), PoS 236, 445 (2016).
- Nagano et al. [1992] M. Nagano, M. Teshima, Y. Matsubara, H. Y. Dai, T. Hara, et al., J. Phys. G: Nucl. Phys. 18, 423 (1992).
- Shinozaki [2006] K. Shinozaki (for AGASA Collab.), Nucl. Phys. B: Proc. Suppl. 151, 3 (2006).
- Berezhko et al. [2012] E. G. Berezhko, S. P. Knurenko, and L. T. Ksenofontov, Astroparticle Phys. 36, 31 (2012).
- Knurenko and Sabourov [2013] S. P. Knurenko and A. Sabourov, EPJ Web of Conf. 53, 04004 (2013).
- Knurenko and Petrov [2019] S. P. Knurenko and I. S. Petrov, Adv. Space Res. 64, 2570 (2019).
- Prosin et al. [2016] V. V. Prosin, S. F. Berezhnev, N. M. Budnev, M. Brückner, A. Chiavassa, et al., EPJ Web of Conf. 121, 03004 (2016), Proc. RICAP-14 (Noto, Italy, September 30 – October 3).
- Ulruch and Cazon [2012] M. Ulruch and L. Cazon, Astroparticle Phys. 38, 41 (2012).
- Bellido [2018] J. Bellido (on behalf of the Pierre Auger Collab.), PoS 301, 506 (2018).
- Abbasi et al. [2018] R. U. Abbasi, M. Abe, T. Aby-Zayyad, M. Allen, R. Azuma, et al., Astrophys. J. 858, 76 (2018).
- Buitnik et al. [2016] S. Buitnik, A. Corstanje, H. Falcke, J. Hörandel, T. Huege, et al., Nature 531, 70 (2016).
- Ostapchenko [2011] S. Ostapchenko, Phys. Rev. D 83, 014018 (2011), arXiv:1010.1869 [hep-ph] .
- Pierog et al. [2015] T. Pierog, I. Karpenko, J. M. Katzy, E. Yatsenko, and K. Werner, Phys. Rev. C 92, 034906 (2015), arXiv:1306.0121 [hep-ph] .
- Riehn et al. [2018] F. Riehn, H. Dembinski, R. Engel, A. Fedynitch, T. Gaisser, and T. Stanev, PoS 301, 301 (2018).
- Pravdin et al. [2018] M. I. Pravdin, A. V. Glushkov, and A. V. Saburov, Astronomy Lett. 44, 588 (2018).
- Knurenko and Petrov [2018] S. P. Knurenko and I. S. Petrov, JETP Lett. 107, 676 (2018).
- Glushkov et al. [2010] A. V. Glushkov, I. T. Makarov, M. I. Pravdin, I. E. Sleptsov, D. S. Gorbunov, G. I. Rubtsov, and S. V. Troitsky, Phys. Rev. D 82, 041101(R) (2010).
- Abraham [2008] J. Abraham (for the Pierre Auger Collab.), Astroparticle Phys. 29, 243 (2008), arXiv:0712.1147 [astro-ph] .
- Aab et al. [2017] A. Aab et al., JCAP 1704, 009 (2017).
- Shinozaki et al. [2002] K. Shinozaki, M. Chikawa, M. Fukushima, N. Hayashida, N. Inoue, et al., Astroparticle Phys. 571, L117 (2002).
- Rubtsov et al. [2018] G. Rubtsov, M. Fukushima, D. Ivanov, M. Kuznetsov, M. Piskunov, et al. (for Telescope Array Collab.), PoS 301, 551 (2018).
- Ellis et al. [2006] J. Ellis, M. V. E, and N. D. V., prd 74, 115003 (2006).
- Bhattacharjee and Sigl [2000] P. Bhattacharjee and G. Sigl, Phys. Rept. 327, 109 (2000).
- Berezinsky and Zatsepin [1969] V. S. Berezinsky and G. T. Zatsepin, Phys. Lett. B 28, 423 (1969).
- Gelmini et al. [2008] G. B. Gelmini, O. E. Kalashev, and D. V. Semikoz, JETP 106, 1061 (2008), arXiv:astro-ph/0506128 .
- Krymskii [1977] G. F. Krymskii, Soviet Physics Doklady 22, 327 (1977).
- Berezhko and Krymsky [1988] E. G. Berezhko and G. F. Krymsky, Sov. Phys. Usp. 31, 27 (1988).
- Berezhko et al. [1994] E. G. Berezhko, V. K. Yelshin, and L. T. Ksenofontov, Astroparticle Phys. 2, 215 (1994).
- Berezhko et al. [1996] E. G. Berezhko, V. K. Elshin, and L. T. Ksenofontov, JETP 82, 1 (1996).
- Berezhko [2008] E. G. Berezhko, Astrophys. J. 684, L69 (2008).
- Dembinski et al. [2019] H. P. Dembinski et al. ( for EAS-MSU, IceCube, KASCADE-Grande, NEVOD-DECOR, Pierre Auger Observatory, SUGAR, Telescope Array, Yakutsk EAS Array ), EPJ Web of Conf. 210, 02004 (2019), Proc. of UHECR-2018 (Paris, France, October 8-12).
- Gonzalez [2019] J. G. Gonzalez (for the IceCube Collab.), EPJ Web of Conf. 208, 03003 (2019).
- Bogdanov et al. [2010] A. G. Bogdanov, D. M. Gromushkin, R. P. Kokoulin, G. Manocchi, A. A. Petrukhin, et al., Phys. Atom. Nucl. 73, 1852 (2010).
- Bogdanov et al. [2018] A. G. Bogdanov, R. P. Kokoulin, G. Mannocchi, A. A. Petrukhin, O. Saavedra, et al., Astroparticle Phys. 98, 13 (2018).
- Aab et al. [2015b] A. Aab, P. Abreu, M. Aglietta, et al. (for the Pierre Auger Collab.), Phys. Rev. D 91, 032003 (2015b), arXiv:1408.1421 [astro-ph.HE] .
- Aab et al. [2016] A. Aab, P. Abreu, M. Aglietta, et al. (for the Pierre Auger Collab.), Phys. Rev. Lett. 117, 192001 (2016), arXiv:1610.08509 [hep-ex] .
- Müller et al. [2019] S. Müller et al. (for the Pierre Auger Collab.), EPJ Web of Conf. 210, 02013 (2019), Proc. UHECR-2018 (Paris, France, Oct. 8-12).
- Alb [2021] The Muon Puzzle in cosmic-ray induced air showers and its connection to the Large Hadron Collider (2021), arXiv:2105.06148 [astro-ph.HE] .
- Corstanje et al. [2021] A. Corstanje, S. Buitink, H. Falcke, B. M. Hare, J. R. Hörandel, et al., Phys. Rev. D 103, 102006 (2021), arXiv:2103.12549 [astro-ph.HE] .
- Glushkov and Saburov [2019] A. V. Glushkov and A. V. Saburov, JETP Lett. 109, 559 (2019).
- Glushkov et al. [1979] A. V. Glushkov, V. M. Grigoriev, O. S. Diminshtein, T. A. Egorov, N. N. Efimov, et al., in Cosmic rays of ultra-high energies (YaF SO AN SSSR, Yakutsk, 1979) pp. 130–140, in Russian.
- Artamonov et al. [1994] V. P. Artamonov, B. N. Afanasiev, A. Glushkov, V. P. Grigoriev, M. N. Dyakonov, et al., Bull. Rus. Acad. Sci.: Physics 58, 2026 (1994).
- Ivanov et al. [2010] A. A. Ivanov, S. P. Knurenko, M. I. Pravdin, and I. E. Sleptsov, Moscow Univ. Physics Bull. 65, 292 (2010).
- Abbasi [2014] R. U. Abbasi (for Telescope Array Collab.), Astrophys. J. 790, L21 (2014).
- Krymsky et al. [2017] G. F. Krymsky, M. I. Pravdin, and I. E. Sleptsov, Astronomy Lett. 43, 703 (2017).
- Krymsky et al. [2019] G. F. Krymsky, M. I. Pravdin, I. E. Sleptsov, and A. D. Krasilnikov, Astronomy Lett. 45, 576 (2019).
- Sidelnik [2013] I. Sidelnik (for the Pierre Auger Collab.), in Proc. 33rd ICRC, Vol. 1, edited by R. S. Shellard (Rio de Janeiro, Brazil, 2013) p. 479.
- Aab [2017] A. Aab (for the Pierre Auger Collab.), Science 357, 1266 (2017), arXiv:1709.07321 [astro-ph.HE] .
- Pravdin et al. [2002] M. I. Pravdin, A. A. Ivanov, A. D. Krasilnikov, V. A. Kolosov, I. T. Makarov, et al., Izv. RAN. Ser. Fiz. 66, 1592 (2002), in Russian.
- Ivanov [2018] A. A. Ivanov, Phys. Rev. D 97, 083003 (2018), arXiv:1803.06792 [astro-ph.HE] .
- Abbasi et al. [2017] R. U. Abbasi, M. Abe, T. Abu-Zayyad, M. Allen, R. Azuma, et al., Astroparticle Phys. 86, 21 (2017), arXiv:1608.06306 [astro-ph.HE] .
- Wibig and Wolfendale [1999] T. Wibig and A. Wolfendale, J. Physics G 25, 2001 (1999).
- Matarkin and Timofeev [2019] S. V. Matarkin and L. V. Timofeev, Bull. Russ. Acad. Sci.: Physics 83, 640 (2019).
- Ivanov et al. [2020] A. A. Ivanov, S. V. Matarkin, and L. V. Timofeev, Int. J. Mod. Physics D 28, 2050033 (2020).