4D-XY Superfluid Transition and Dissipation in 4He Confined in Nanoporous Media
Abstract
4He confined in nanoporous Gelsil glass is a unique, strongly correlated Bose system exhibiting quantum phase transition (QPT) by controlling pressure. Previous studies revealed that the QPT occurs with four - dimensional (4D) XY criticality, which appears in the zero-temperature limit of the superfluid density. However, the phase diagram also suggested that 4D XY nature appears at finite temperatures. Here, we have determined the critical exponent of the superfluid density of 4He in two Gelsil samples that have pore diameter to be about 3 nm, using a newly developed mechanical resonator technique. The critical exponent in the powerlaw fitting , where is the superfluid transition temperature, was found to be 1.0 0.1 for all pressures realized in this experiment, 0.1 2.4 MPa. This value of gives a decisive evidence that the finite-temperature superfluid transition belongs to 4D XY universality class. The emergence of the 4D XY criticality is explained by the existence of many nanoscale superfluid droplets, the so called localized Bose - Einstein condensates (LBECs), above . Due to the large energy cost for 4He atoms to move between the LBECs, the phase of the LBEC order parameters fluctuates not only in spatial (3D) but imaginary time (D) dimensions, resulting in the 4D XY criticality by a temperature near , which is determined by the finite size of the system in the imaginary time dimension. Below , macroscopic superfluidity grows in the nanopores of Gelsil by the alignment of the phases of the LBEC order parameters. An excess dissipation peak observed below is well explained by this phase matching process.
1 Introduction
In the last decades, quantum phase transitions (QPTs) have been of much interest in condensed matter physics[1, 2]. It has been realized that emergence of QPT is a characteristic of strongly correlated systems[3, 4], as the strong inter-particle correlation produces quantum fluctuations. Second-order QPT is characterized by a zero-temperature quantum critical point (QCP), which emerges at a particular value of external parameters. In general, QCP is connected to the classical phase transition line at finite temperatures. At 0 K, QPT is driven not only by quantum fluctuations in spatial dimensions but also by those in an imaginary-time dimension , where is . This suggests that a -dimensional classical phase transition at finite temperatures can be continuously connected to a -dimensional QPT at 0 K, where is the dynamical critical exponent[1]. In the case of , one may expect that a three-dimensional (3D) classical phase transition is terminated by a 4D QPT. However, 4D QPT was suggested only in two real systems, underdoped cuprate superconductors[5, 6] and 4He confined in nanoporous media.
4He confined in nanoporous media is a strongly correlated bosonic system showing QPT[7, 8, 9, 10, 11, 12, 13]. At K and at SVP (near zero pressure), bulk liquid 4He undergoes the superfluid transition, which appears as a critical phenomenon with the 3D XY universality class (O(2) symmetry)[14, 15]. When liquid 4He is confined in a porous Gelsil glass with a pore diameter of about 3 nm, the superfluid transition temperature decreases down to 1.4 K near SVP[7]. As the pressure increases, and the superfluid density decrease. eventually reaches 0 K at a critical pressure MPa, meaning that a QPT occurs at . The suppression of superfluidity is attributed to the emergence of a non-trivial nonsuperfluid state consisting of the localized Bose-Einstein condensates (LBECs). At a temperature , which is slightly lower than , heat capacity shows a peak, indicating the superfluid transition in nanopores[8]. However, no superfluidity is observed between and . The heat capacity peak is attributed to the emergence of many nanoscale LBECs in the pore voids. Strong correlation among helium atoms and the confinement within narrow pores suppress the spatial exchange of atoms and hence phase coherence among LBECs, so the system does not show macroscopic superfluidity. This trend is reinforced as the pressure, i.e. the correlation in He atoms, increases, eventually resulting in the QPT at .
Eggel et al.[12, 13] theoretically studied the QPT using the disordered quantum rotor (Bose–Hubbard) model[16], in which the LBECs are located at the 3D lattice sites. They noticed that the particle-hole (p-h) symmetry in the system is recovered by the randomness in the size of LBEC. The p-h symmetry keeps to be unity, thus the QPT belongs to the 4D XY universality class. Near the QCP, the zero-temperature superfluid density , which was obtained by extrapolation of measured at finite , varies as . The critical exponent is given by , where is the critical exponent of the correlation length . In 4D XY, , so and . This agrees well with the experimental observation that the zero-temperature superfluid density is proportional to the pressure except for the very vicinity of . Moreover, the 4D XY criticality shows an unexpected agreement with the experimental result at finite temperatures. The theory proposed the temperature dependence of the critical pressure at as . The 4D XY criticality gives . This also agreed well with the experimental result that the phase boundary between the LBEC state and the superfluid state is fitted to a power law .
In the general theory of QPT[1], however, a zero-temperature QCP is altered to a classical critical line at finite temperatures, in this case, a 3D XY superfluid transition. Therefore, the agreements of the experimental observations with the theoretical results of the 4D XY criticality not only at but at finite temperatures are rather surprising, and motivate us to study the superfluid transition of 4He in the nanoporous Gelsil in more detail.
In the previous work[7], we employed the torsional oscillator (TO) technique to examine superfluidity of 4He in Gelsil. However, it was difficult to determine the critical exponent of the superfluid density, because the bulk liquid 4He that exists in the TO bob (around the Gelsil sample) and in the torsion rod might contribute to the superfluid signal. We have developed a superfluid mechanical resonator[17, 18] to measure the superflow and dissipation of 4He inside the Gelsil. This method enables us to eliminate the unwanted contribution outside the Gelsil sample and extract only the effect of macroscopic superfluidity in the nanoporous network. In the previous letter, we reported on the experimental determination of the critical exponent of the superfluid density near [19]. We have found that the the superfluid critical exponent is , which agrees with the exponent of the 4D XY universality class. In this paper, we give a full account on the experiment. We have measured dissipation in the superflow characteristics. The dissipation below is explained by the phase matching among the LBECs, which is a necessary process for macroscopic superfluidity throughout the Gelsil sample. We also present a scaling analysis for the superfluid density, which was first proposed by Eggel[13]. These analyses further support the finite-temperature 4D XY criticality and the LBEC conjecture.
2 Experimental
2.1 Double-diaphragm superfluid mechanical resonator
In order to eliminate the effect of crosstalk which may contribute to the background of the signal, we have developed a mechanical resonator that has two flexible diaphragms, in which the drive and detection of the superflow are made separately. The experimental apparatus is depicted in Fig. 1. The superfluid mechanical resonator consists of two liquid 4He resorviors RI and RO that are connected by a porous Gelsil glass disk (G). The top wall of the resorvoir RI has two circular diaphragms D1 and D2. D1 and D2 are metal-deposited Kapton films with different thicknesses, 50 and 7.5 , respectively. Two circular fixed electrodes E1 and E2 are located oppositing to D1 and D2 respectively. The filling line F is connected to the gas handling system at room temperature via a metal capillary. We have used the first grade (99.999%) 4He gas with natural abundance (perhaps 0.3 ppm 3He is contained) for the liquid helium samples.
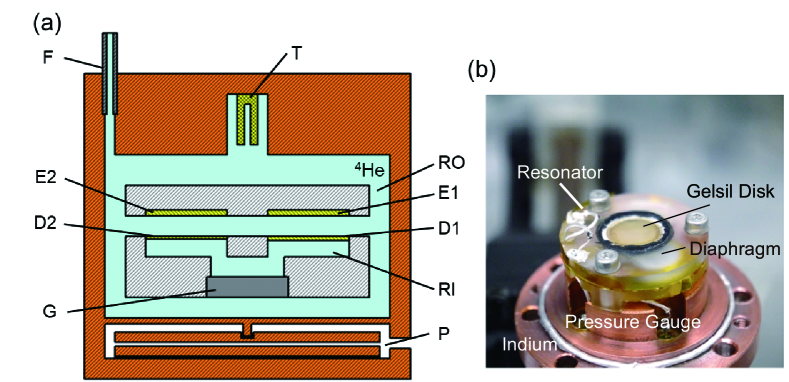
In the measurement, two volumes RI and RO are filled with liquid 4He, so that the bulk liquid in reservoir RI is connected to the liquid in RO via the liquid in Gelsil (G). The whole system forms a kind of Helmholtz resonator in which the porous Gelsil acts as a bottleneck, but we have found that the resonances observed in this apparatus cannot be assigned to be the Helmholtz resonance, except for a mode at low frequency (the mode, see below). In order to drive and detect the mechanical oscillation, a DC bias voltage of 350 V is applied to both diaphragms. An AC voltage from a wave generator is superimposed to the driver electrode E1. This produces mechanical oscillation of the stiffer diaphragm D1 with the same frequency of AC voltage. The oscillation of D1 then mechanically drives liquid 4He motion in inner resorvoir RI. The oscillation propagates to the detector diaphragm D2 via the liquid in RI. The motion of D2 induces displacement current on detector electrode E2, which is picked up using a current preamplifier and a lock-in amplifier.
In the resonator cell, a capacitive pressure gauge (P) is installed for precise pressure measurement of bulk liquid 4He. A quartz tuning fork (T) is also placed in the top of resorvior RO. It works as a liquid viscometer, which is helpful in analyzing dissipation of mechanical resonator. All the measurements were performed in the temperature range between 0.7 and 2.4 K using a cryogen-free 3He refrigerator. The resonator is connected to the 3He stage (pot) via a superconducting heat switch made of lead. The temperature of the resonator cell is stabilized by controlling the temperatures of the 3He stage and the cell, and by switching on or off the heat switch depending on the target temperature.
2.2 Porous Gelsil glass
Gelsil is a nanoporous glass manufactured by the sol-gel method. The Gelsil samples we employed in this work were produced by a different manufacturer from that in the previous TO and heat capacity studies[7, 8]. We have used two Gelsil samples, denoted by sample A and B.
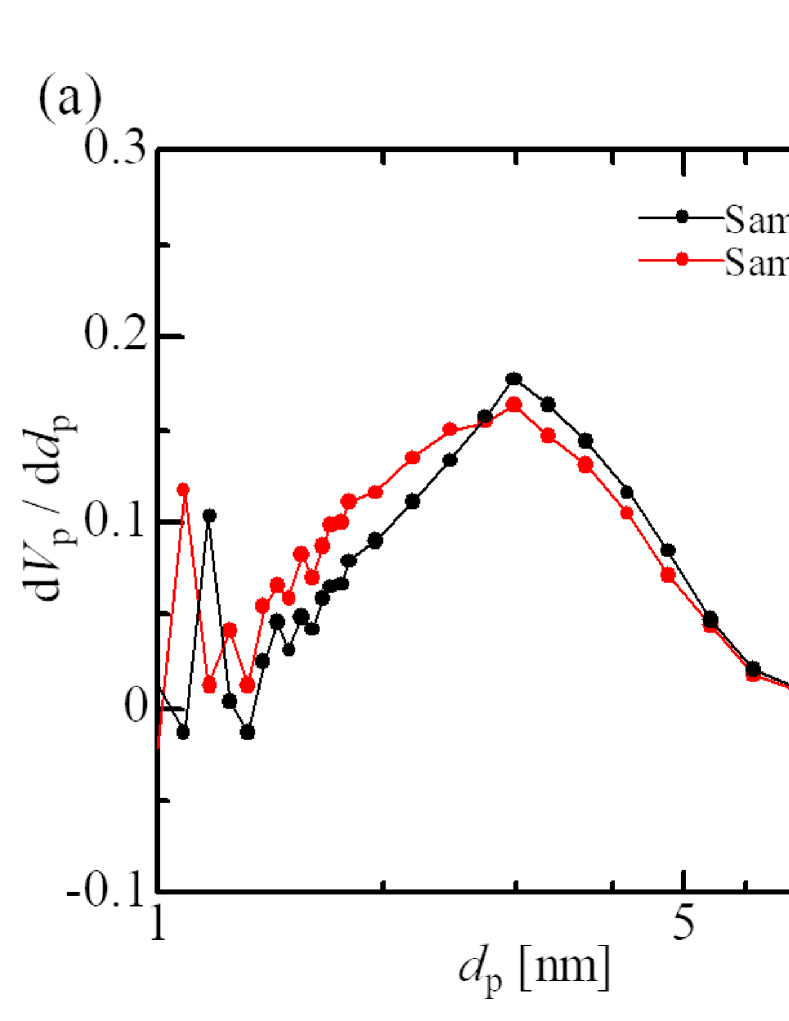
In Fig. 2, we show the pore diameter distribution of the two samples obtained by the BJH method [20] applied to nitrogen adsorption and desorption isotherms measured by the Belsorp Mini II apparatus. Although the nominal pore diameters are 2.5 nm and 3.0 nm for sample A and B, respectively, the pore size distributions measured by us are almost identical. The peaks of the distribution are located at 3.0 nm and 3.8 nm, for adsorption and desorption isotherms, respectively. The sharp peaks from the desorption isotherms correspond to the size of bottlenecks in the porous structure, while the distribution from adsorption isotherm show the volume of the pores of particular diameters. We note that sample B has a slightly larger pore volume in the size range 1.5 d 3.0 nm compared to sample A. The dimensions of these two disks are 9.0 mm in diameter and 1.0 and 2.0 mm in thickness for sample A and B, respectively.
2.3 Experimental procedure
After the 3He refrigerator was cooled down, we slowly injected 4He to the resonator cell keeping the rate of pressure change in the resorvoir as small as possible. This is because the resorvoir RI is connected to RO only through the Gelsil disk, which might have a high flow impedance, and the resorvoir wall is made of thin Kapton diaphragms that can easily be broken by large pressure impulse. The measurement was limited at the pressure range MPa, above which bulk 4He solidifies in the resorvoirs.
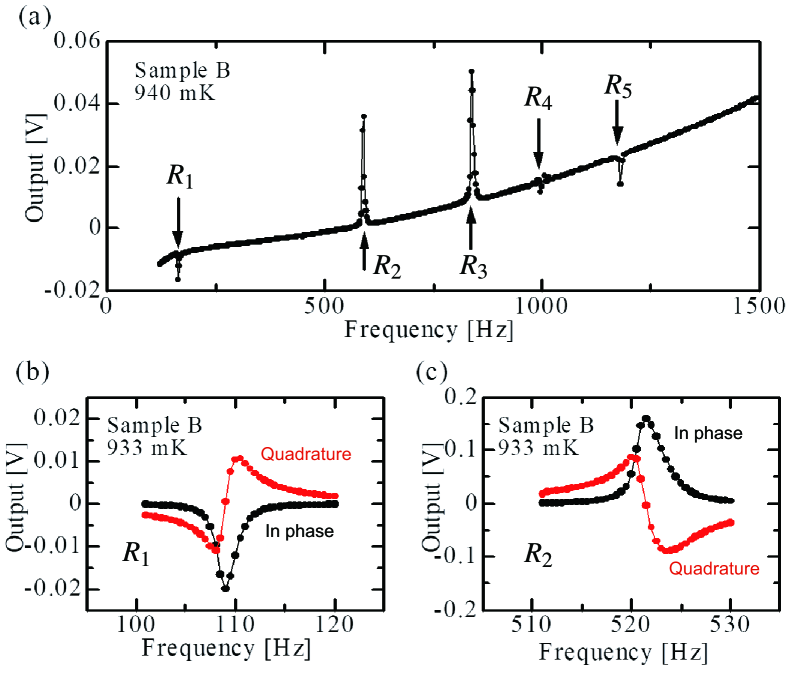
In the measurement, we initially measured the frequency spectra of the in-phase and quadrature of the lock-in outputs by sweeping the driving frequency from 10 to 2000 Hz, at some fixed temperatures. An example of the spectrum for sample B is shown in Fig. 3(a). We have observed five sharp resonances at frequencies between 10 and 1250 Hz for both samples A and B. As is discussed in the later section, these resonances are determined by the geometry of the reservoir RI, hydrodynamic properties of liquid helium in RI, and superfluid properties of helium in Gelsil that hydrodynamically connects RI and RO. We denote the resonance modes at frequencies in frequency order as . In Fig. 3(b) and (c), we show the in-phase and quadrature components of the lock-in output for and resonances. Note that the two resonances have opposite phases. This phase inversion is originated from the difference in the mechanisms of the and other resonance modes. Since this difference is essential for the precise determination of the superfluid density and its critical exponent, we will discuss it in detail in the next Section. There were many other resonance modes at higher frequencies than 2000 Hz, but they were not examined in detail in this work.
We have measured the resonance curves such as those shown in Fig. 3(b) and (c) at fixed temperatures between 0.7 and 2.4 K. The temperature dependencies of the superfluid density and dissipation are obtained by fitting Lorenzian formula to the resonance curve at each temperature.
3 Results
3.1 Characteristics of resonance modes
The five resonances are characterized by two types of fundamental modes: The resonance modes are observed in the entire experimental temperature range K. On the other hand, the lowest frequency mode was observed only below the superfluid transition temperature of 4He inside the Gelsil pores, . Moreover, the mode has an opposite phase relation, between the drive and output voltage, to the other modes as shown in Fig. 3(b) and (c). These facts indicate that and are the fundamental modes of the resonator, while are higher order modes of the mode.
3.1.1 The modes
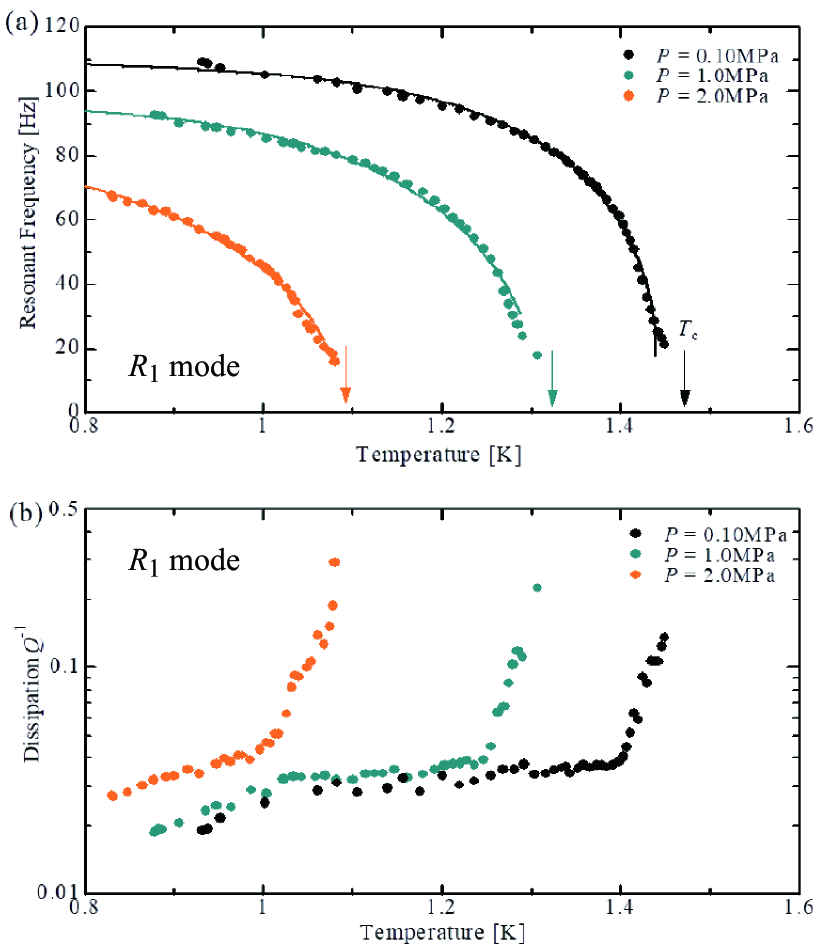
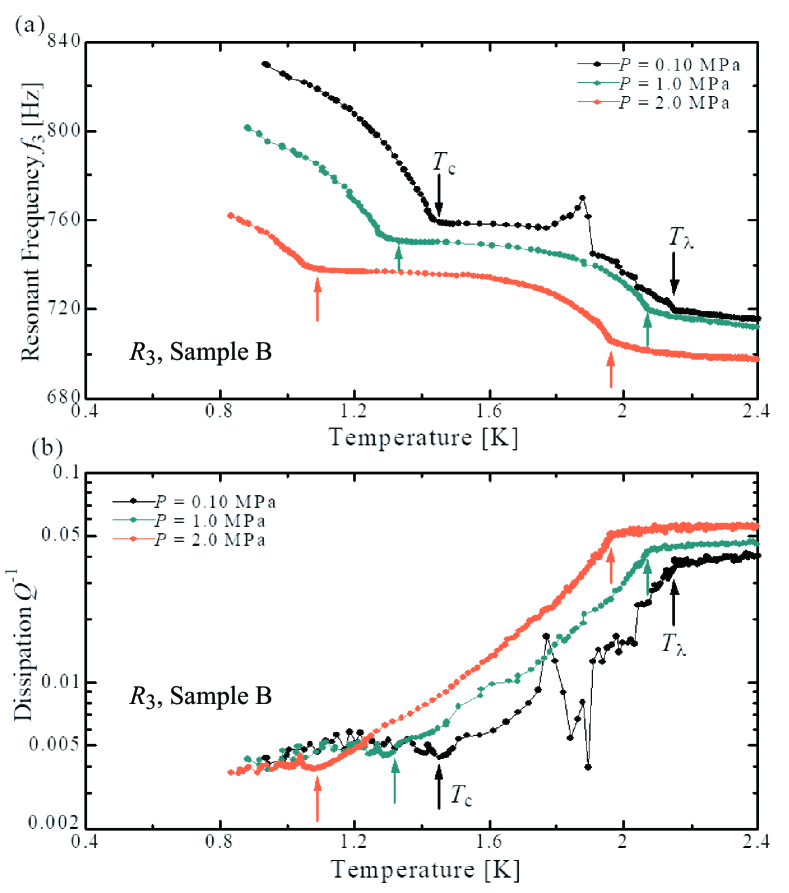
Figure 4 shows the temperature dependencies of for sample A and B at various pressures. The accompanied dissipation is discussed in the later section. The resonance was detected in the entire experimental temperature range K. As decreases from 2.4 K, gently increases (except for the data at MPa of sample B), and shows a sharp increase at temperatures that coincide with bulk . Below , shows a rounded temperature dependence, and then changes little around 1.6 K. At a certain temperature denoted as , increases again and then saturates at lower temperatures. Since is close to the superfluid transition temperature observed in the previous TO study[7], it can be tentatively identified as the superfluid transition temperature of 4He in the present Gelsil samples. In later section we determine as a fitting parameter in the power-law fitting of the superfluid density in Gelsil.
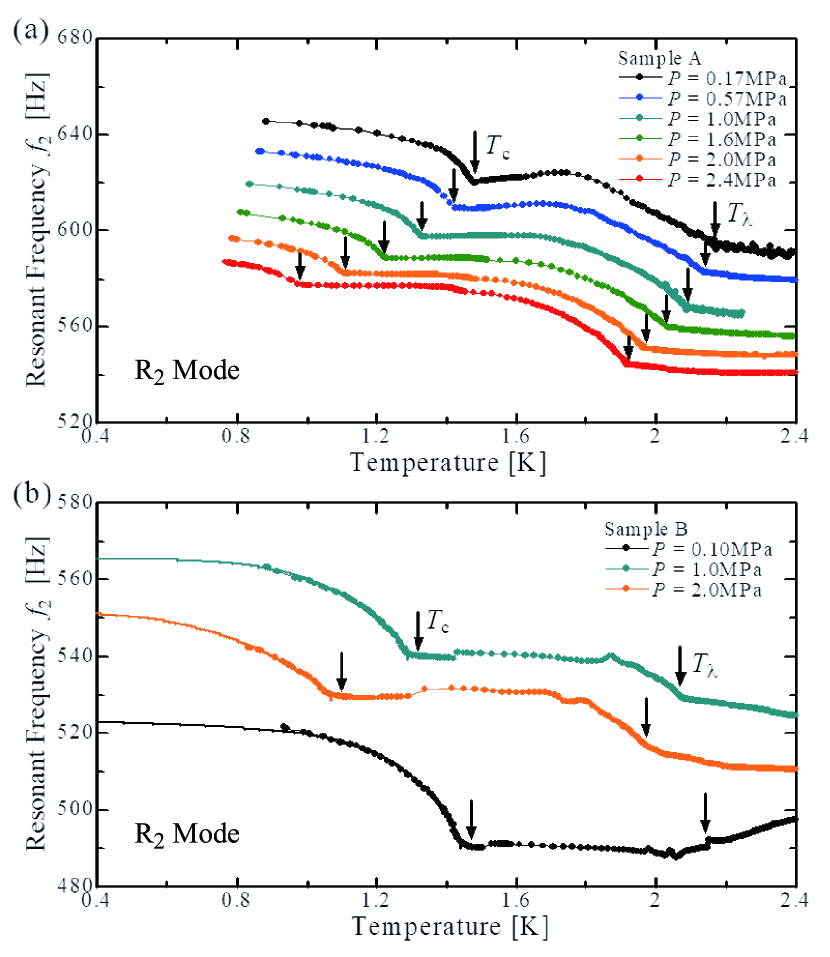
The temperature dependence of is common in the data obtained at all pressures. As the pressure increases, the overall behaviors shift to lower frequencies due to the increase in the mass of liquid 4He inside the resonator. In the measurement of sample B (Fig. 4 (b)), at 0.10 MPa is exceptionally lower than the data at higher pressures. We attribute this behavior to an accidental change of the tension of detector diaphragm when the pressure increased from 0.1 to 1.0 MPa. This irregularity in the pressure dependence of does not affect the overall temperature dependence.
3.1.2 The mode
In the measurement of sample A, it was difficult to determine the temperature dependence of resonant frequency due to the noise in the measurement electronics, which was particularly prominent at low frequencies at which the mode exists. We then improved the electronics setup so that and dissipation were successfully determined for sample B.
The temperature dependencies of and dissipation are shown in Fig. 5. Contrary to the measurements of the modes, the mode was identified only below a certain temperature near . As increases from the lowest temperature, monotonously decreases and tends to 0 Hz near . Simultaneously, increases in the vicinity of with a divergent behavior, meaning that the resonance vanishes at .
3.1.3 Identification of the resonance modes
Above the bulk , 4He is a normal viscous liquid with shear viscosity Pas. This gives the viscous penetration depth m, where is the liquid density and the angular frequency of oscillatory flow. As is much larger than the pore diameter , the motion of the normal liquid 4He is tightly blocked in the nanopores of Gelsil, so that the liquid in RI is mechanically isolated from the liquid in RO. Therefore, the resonance modes observed above , i.e. the modes, can be modeled as a coupled oscillation among two diaphragms D1 and D2, which have tensions and , respectively, and liquid 4He enclosed in RI.
The resonance curves shown in Fig. 3 shows that at the resonance the detector diaphragm D2 oscillates in phase with the drive diaphragm D1, as shown in the illustration of Fig. 6(a). This means that helium in RI can be treated practically as an incompressible liquid. We can then apply a simplified model for the mode, which is shown in Fig. 6 (b). It consists of an effective mass of liquid helium in RI hung under two parallel springs with effective spring constants and . The helium mass is a complicated function of the real mass, viscosity of liquid, and the geometry of RI. The effective spring constant of liquid 4He is estimated to be N/m, where is the total area of the diaphragms, the compressibility of liquid 4He ( Pa-1, and is the volume of RI. The diaphragm tensions and are obtained to be 150 (150) and 70 (10) N/m for samples A (B), respectively, from changes in the capacitance between the diaphragms and the fixed electrodes when they are biased with several DC voltages. This practical incompressibility of liquid leads to the simple mass-spring model of Fig. 6 (b).
Below , the viscosity-free superfluid component makes the effective mass decrease, resulting in the increase in . However, the liquid in RI is still isolated from that in RO, because the liquid 4He in Gelsil behaves as normal, although LBECs are formed in the nanopores. When the liquid in Gelsil undergoes the superfluid transition at , the liquid can flow through the nanopores of Gelsil. Although the mechanism of the reduction of by the superfluid component is complicated, it does not influence the analysis because tends to be constant just above (around 1.5 K).
To conclude, at , the displacement of D2 is equal to that of D1 and liquid 4He in RI, while once 4He in Gelsil undergoes the superfluid transition, the displacement of D2 becomes smaller than others due to the superflow through Gelsil. Then the resonant frequency below is obtained by the model of oscillating liquid 4He with mass under the restoring force of parallel spring constants and . Assuming that the flow velocity of superfluid 4He through Gelsil is lower than superfluid critical velocity, below is obtained as
| (1) |
where is density of bulk liquid 4He, the superfluid density of 4He in Gelsil, the total volume of inner and outer liquid, and a coefficient depending on configuration of Gelsil.
Before considering the mode, we briefly note on the modes. The modes were observed at K, as in the case of the mode. The mode has the same phase relationship between D1 and D2 as that of the mode. However, the and modes have an opposite phase relationship to the mode. These behaviors are seen in Fig. 3 (a). Although the modes can be regarded as higher order modes of the fundamental mode, they are yet to be identified accurately. The inversion of the phase in the and modes might be caused by the small but finite compressibility of liquid helium. In AppendixA, we show the characteristics of the mode and discuss the critical exponent derived from .
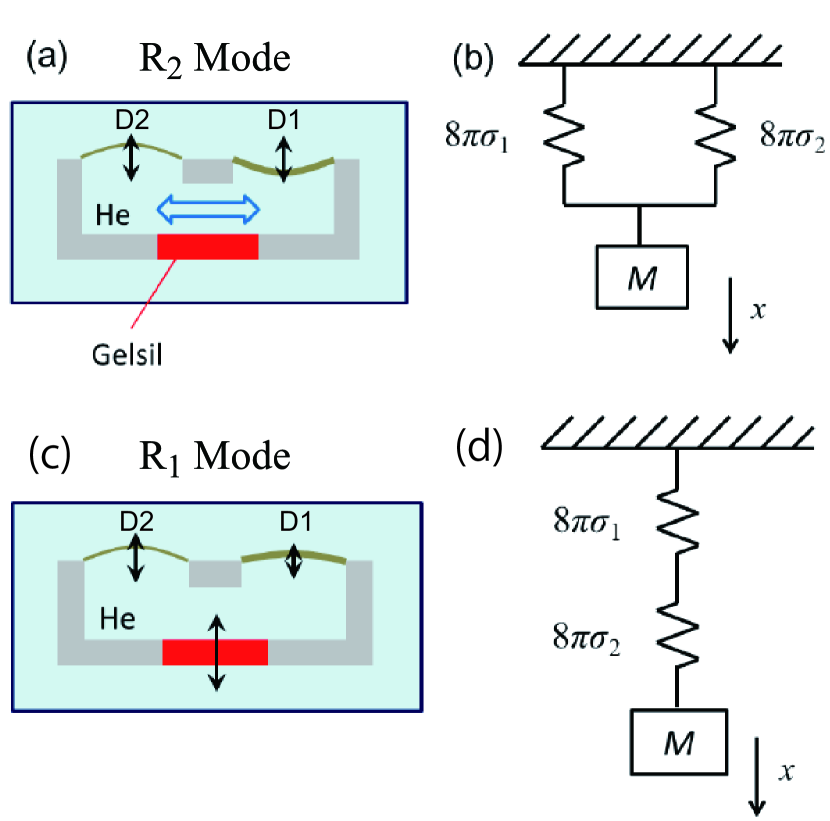
Next, we consider the resonance process of the mode. The resonance is observed only below , and the phase between drive and detection in the resonance curve has an opposite relation to that of the mode. The mode is therefore attributed to pure superfluid motion through Gelsil. When the driver diaphragm D1 pulles liquid 4He inside RI as illustrated in Fig. 6 (c), some amount of superfluid flows from RO to RI via Gelsil. This superflow pulles up the detector diaphragm D2 as it is much more flexible than D1. This mechanism explains the fact that D1 and D2 oscillate out of phase at , contrary to the other modes. We calculate the temperature dependence of by considering the hydrodynamic properties of liquid 4He in bulk and in Gelsil.
The resonant frequency can be written by a hydrodynamic inductance and a capacitance , defined by and , where is the mass current of superflow, the mass of 4He atom and the chemical potential difference across the nanopore channel of Gelsil, as . In the case of superflow oscillation by restoring force from the diaphragms, , where is a structual coefficient depending on the detail of the channel, and , where is the area of each diaphragm. Assuming that bulk liquid 4He in RI is incompressible, is given by
| (2) |
If we assume that Gelsil consists of parallel straight flow channels, the superfluid density of liquid 4He in Gelsil is estimated to be about an order of magnituide smaller than the bulk one. Because , , and are constant determined by the experimental setup and is regarded as constant in the current temperature range, represents the temperature dependence of the superfuid density .
Because approaches 0 Hz and the dissipation diverges at , the precise determination of from is difficult in the vicinity of . However, the formula of , Eq. (2), enables us to determine precisely in the overall temperature range. We compare the temperature dependence of obtained from the data to by the following procedure. From the experimental data of , we obtain an arbitrary functional form of for three experimental pressures. is then converted to using Eq. (2). Finally, is calculated by Eq. (1) in which a constant is determined as a fitting parameter.
3.2 Dissipation of the mode
The data of dissipation provides another essential information for elucidating the mechanism of superfluid transition of 4He in Gelsil. Measurement of dissipation is generally influenced by mechanical stability of the resonator. Since the measurement employing sample A was suffered from some unstable behaviors, we have improved the setup such as vibrational isolation. Here we discuss the sample B measurement, in which we believe that clear temperature dependence of dissipation below were obtained without suffering from instability problem.
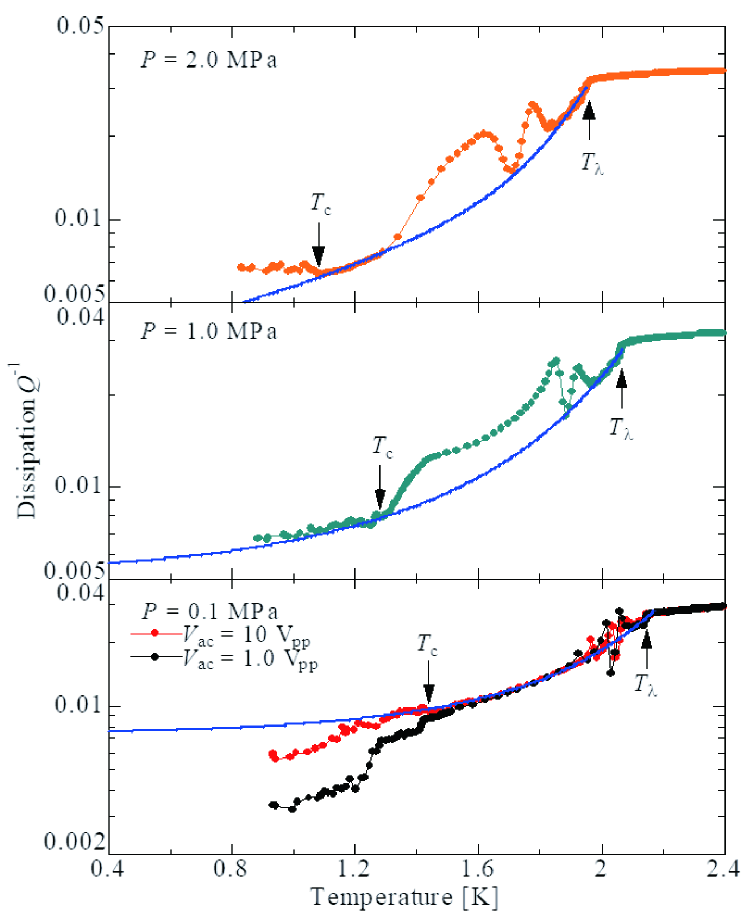
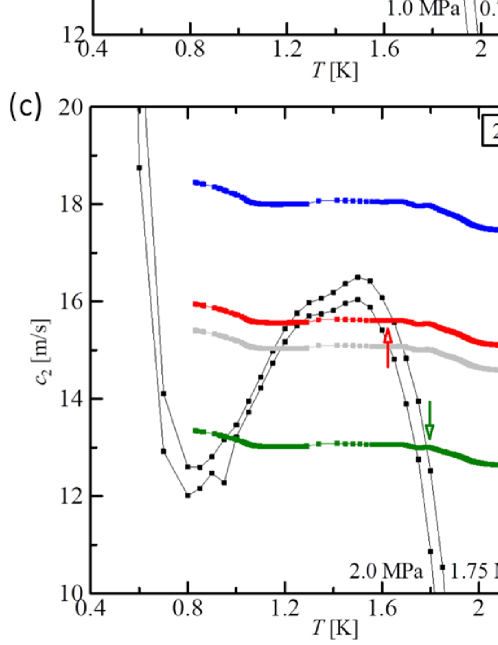
The temperature dependence of of the mode are shown in Fig. 7. We show two data sets for MPa taken with two different drive voltages, and 10.0 Vp-p. Otherwise the data were taken at Vp-p. As decreases above , decreases gently. This is attributed to the temperature dependence of viscosity in bulk 4He. then falls sharply at , but at it decreases to about of the value at , with a seemingly nonsystematic change. We analyze the data at by assuming contributions from (1) change in viscosity of bulk liquid, (2) emergence of superfluid density in bulk liquid, and (3) coupling of the mechanical oscillation to second sound resonances. In order to analyze the effects of (1) and (2), we employ the data of the quartz tuning fork in the resonator cell. During the measurement, we have monitored the resonant frequency and dissipation of the fork at all the temperatures. The temperature dependencies of the frequency and the dissipation are quantitatively explained by taking into account the changes in the hydrodynamic mass of the fork and the viscous drag force in bulk 4He[21].
The dissipation of a fork in liquid 4He is given by , where is the amplitude of vibration, the resonant frequency and the effective viscosity of liquid. We monitored the pressure of the liquid in the volume RO, and found that the pressure changes with temperature according to the temperature dependence of liquid density. The actual change in must include the effect of pressure change. Taking this effect into account, we determined the temperature dependence of for three data sets ( and 2.0 MPa) from the tuning fork measurement. The blue solid lines in Fig. 7 are for three pressures. They agree well with at temperatures just below and near , but there are extra dissipation peaks in the intermediate temperature range. We attribute this excess dissipation to the coupling of the mechanical resonance to some standing wave modes of the superfluid second sound. We calculated the second-sound resonant frequencies of this particular resonator by the finite element method, and obtained a quantitative agreement with the temperatures of the dissipation peaks. Details of the analysis is given in Appendix C.
Below , the dissipation taken at Vp-p significantly decreases and deviates from the expected contribution of bulk liquid. This large reduction of dissipation is attributed to the emergence of superfluid mass current through Gelsil. The temperature dependence of should therefore be proportional to the superfluid density of 4He in Gelsil. However, below is not monotonous and a small peak-like structure is observed around 1.3 K. On the other hand, at Vp-p, changes little and starts to decrease at lower temperature. In the data taken at and 1.0 MPa, changes little or even slightly increases. These behaviors of suggest that an additional dissipation occurs and cancels the reduction of below .
The existence of excess dissipation in 4He in Gelsil is also supported by an experiment using porous Vycor glass, in which the confined 4He underwent superfluid transition at 1.97 K. At the dissipation sharply decreased at any driving voltages, and no excess dissipation was observed. We conclude that the excess dissipation is unique to 4He in Gelsil and should be related to the mechanism of superfluid transition in much smaller pores than Vycor has.
4 Discussion
4.1 Critical exponent of superfluid density
In this section, we discuss the critical exponent of derived from the mode in more detail than the previous publication[19]. Similar analysis and discussion for the mode in sample B are presented in AppendixA.
In order to discuss the superfluid critical phenomenon in the vicinity of , we derive the temperature dependence of of 4He in Gelsil using Eq. (1) as the following formula,
| (3) |
Here the density of bulk liquid 4He is assumed to be independent of temperature in the range of interest ( K). However, as seen in Fig. 4, the measured resonant frequencies just above have a small but finite slope, in which the origin is unknown. We subtracted this as a background offset assuming a linear temperature dependence. Because , and the structual coefficient are constant, the left hand side of Eq. (3) determines precisely the temperature dependence of .
In the discussion of critical phenomenon, the superfluid density in the vicinity of is written by a power law
| (4) |
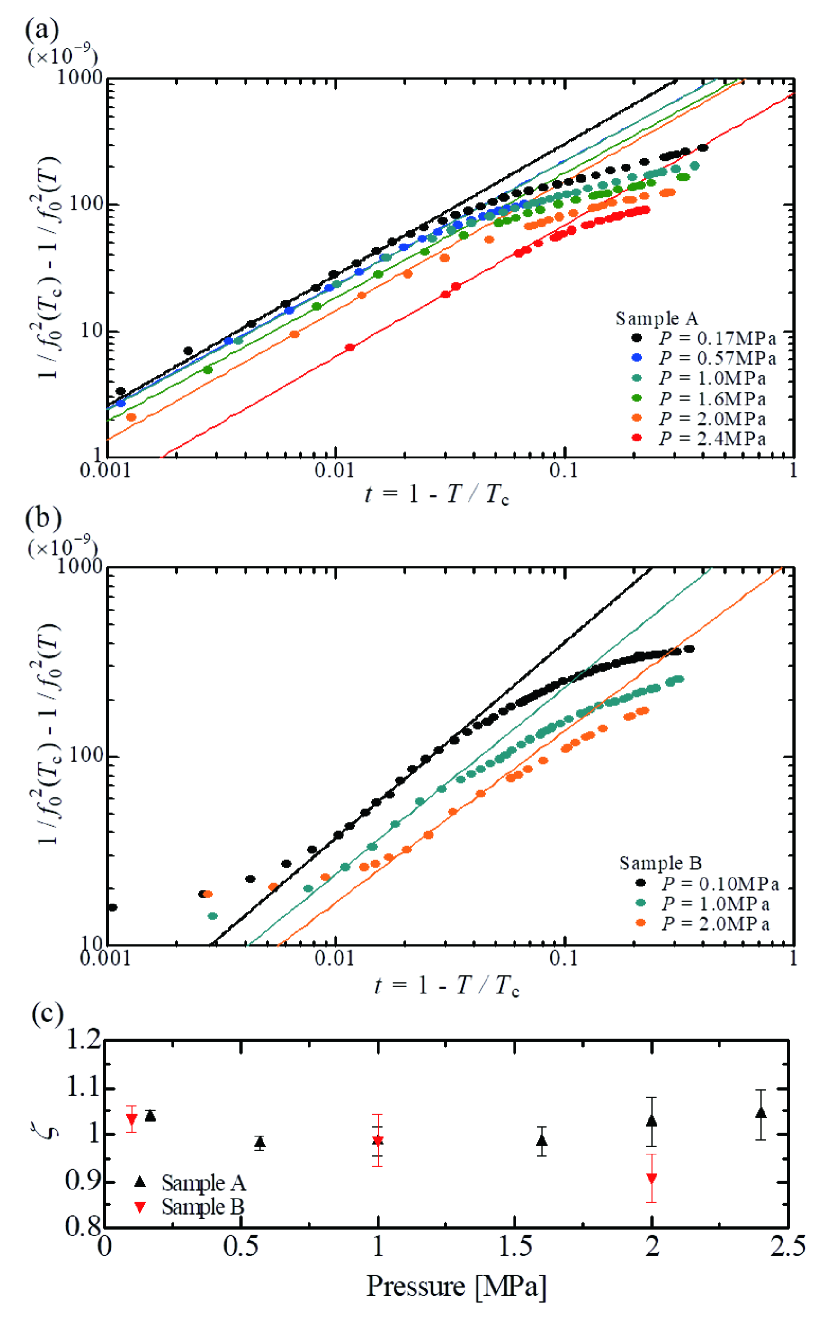
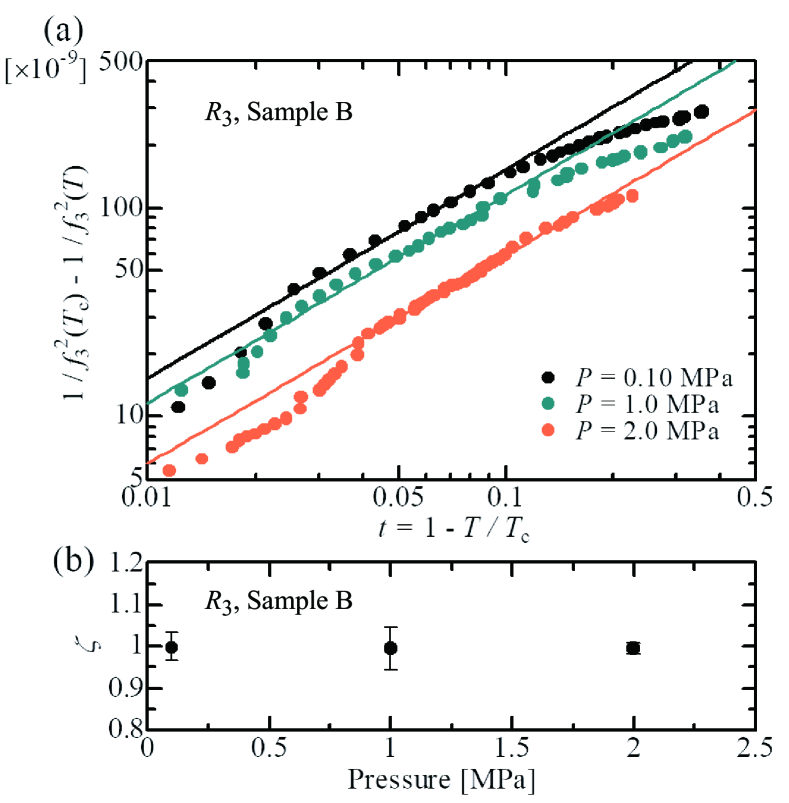
where is the critical exponent for superfluid density. In Fig. 8, we show - plots of the quantity , which is proportional to , obtained from the data shown in Fig. 4, as a function of reduced temperature . In these plots, we have determined so as to make the longest straight lines in the - plots.
All the data obey a power law in a limited range of . The data of sample A shown in Fig. 8 (a) are well fitted with straight lines in the range , while the plots for sample B shown in Fig. 8 (b) deviates from straight lines in the immediate vicinity of superfluid transition . This deviation reflects the result that near of sample B is more rounded than that of sample A (see Fig. 4). Despite this smeared behavior in in sample B, the - plots obey straight lines in the temperature range . We discuss later the origin of the deviation from the power law.
The critical exponent obtained from the slope of the straight lines in the - plots is shown in Fig. 8(c). The error bars represent fitting errors in the plots. We found that for both samples and at all pressures. No pressure dependence was observed. Although the data of sample B are smeared in the vicinity of , are identical to the results of sample A, except for the case of MPa, in which and 0.91 for sample A and B, respectively. Although the reason of the discrepancy is not clear, we note that the range of that shows the power law is rather narrow ().
| System | Pore size (nm) | Porosity (%) | (MPa) | (K) | Method | Ref. | |
|---|---|---|---|---|---|---|---|
| Bulk 4He | – | – | SVP | 2.172 | Second sound | Goldner et al. [22] | |
| Bulk 4He | – | – | SVP - 2.91 | 2.172 - 1.782 | 0.66 - 0.68 | Second sound | Greywall and Ahlers [14] |
| vector | – | – | – | – | – | Campostrini et al. [23] | |
| (3DXY) | |||||||
| Vycor | 7 | 30 | SVP | 1.955 | Fourth sound | Kiewiet et al. [25] | |
| Porous Gold | 24, 75 | 58, 69 | SVP | 2.169 | Torsional osc. | Yoon and Chan[26] | |
| Xerogel | 10 | 60 | SVP | 2.088 | Torsional osc. | Chan et al. [29] | |
| Aerogel | not defined | 99.5 - 94 | SVP | 2.1717 - 2.1698 | Torsional osc. | Yoon et al. [31] | |
| Aerogel | not defined | 94 | SVP | 2.166 | Torsional osc. | Wong et al. [30] | |
| Aerogel | not defined | 93.6 | SVP - 2.9 | 3 mK below | Heat pulse | Mulders et al. [32] | |
| Gelsil | 3 | 50 | 0.1 - 2.4 | 1.47 - 1.0 | AC flow | This work |
The exponent is unprecedented. All the other confined 4He systems that were previously studied show smaller than 1. We summarize the superfluid critical exponents in 4He systems in Table 1. In bulk 4He, the critical exponent was determined to be at SVP with great accuracy[22]. Under pressure, detailed analyses taking confluent singularities into account concluded [14]. These values agree exactly with a critical exponent for vector (i.e. 3D XY) model calculated by Monte Carlo and high temperature expansion[23]. of 4He confined in various porous materials had also been examined: In porous Vycor glass with 7 nm pore diameter and in two porous gold samples, has been obtained to be 0.65 and 0.67[25, 26]. It is remarkable that is identical to the bulk one in these porous media. The bulk - like critical exponent may be a manifestation of the Harris criterion, in which, if the critical exponent of heat capacity, , is negative () in pure system, the critical phenomenon is not influenced by randomness or disorder[27]. This is the case of superfluid 4He, because at the transition is obtained to be [24].
On the other hand, 4He in aerogel shows interesting discrepancy[28]. Aerogel consists of random network of silica strands with about 10 nm thickness and has large open volume. Thus the pore size is ill-defined and the porosity is extremely large (90 99.5 %) compared to other porous madia such as Vycor and Gelsil. Torsional oscillator and heat capacity studies revealed that 4He shows a sharp superfluid transition, with to be near 0.8, depending on the sample batch and porosity[29, 30]. As the heat capacity peak in aerogel are strongly rounded, was estimated by fitting the data to powerlaw in a finite temperature range, and was found to take a large negative value () for low porosity samples. More recent study shows that both and approaches to the values of bulk 4He as the porosity increases from 95 to 99.5 %[31]. To conclude, in quite contrast with the case of Vycor and porous gold, the Harris criterion does not hold in 4He in aerogel. 4He confined in xerogel, a nanoporous glass with the same structure as Vycor and Gelsil with pore size about 10 nm, also shows , which does not agree with the Harris criterion[29, 30]. Though it remains a matter of speculation, these discrepancies were attributed to correlation in disorder: i.e. The disorder in aerogel and xerogel are spatially correlated, while Vycor and porous gold have uncorrelated disorder[28, 30].
The characteristics of the superfluid critical phenomenon in 4He in Gelsil differs from the abovementioned confined 4He systems in two observations, low transition temperatures that eventually reaches 0 K, and the critical exponent . ’s of other systems are located at temperatures between 1.95 to 2.17 K at SVP, very close to the bulk transition , and do not exhibit any QPT at high pressures. The critical exponent of 4He in Gelsil is larger than in bulk and these porous materials. This implies that superfluid 4He in Gelsil belongs to a different universality class from in bulk or in other porous materials even at the highest transition temperature 1.48 K.
In theory of critical phenomena, the superfluid order parameter near is expressed by . The mean field theory gives the critical exponent [33]. As the superfluid density , the critical exponent for is . Because the upper critical dimension of the XY model is 4, the 4D XY model should be described by the mean field theory. Fig. 8 (c) shows that the experimentally determined is 1 at all pressure range we examined. We conclude that the superfluid transition in Gelsil belongs to 4D XY universality class even at finite temperatures far from 0 K.
4.2 4D XY criticality at finite temperatures
4.2.1 Absence of macroscopic superfluidity above
As shown in Sec. 3.1.2, the mode disappears at , i.e. tends to zero with diverging . This fact provides conclusive evidence that no macroscopic superfluidity exists throughout the Gelsil samples between and . Although the absence of superfluidity between and was shown in the previous TO studies, the TO could not perfectly exclude the superfluidity of 4He in Gelsil above , as the TO is sensitive to the contribution from bulk 4He inside the bob[7].
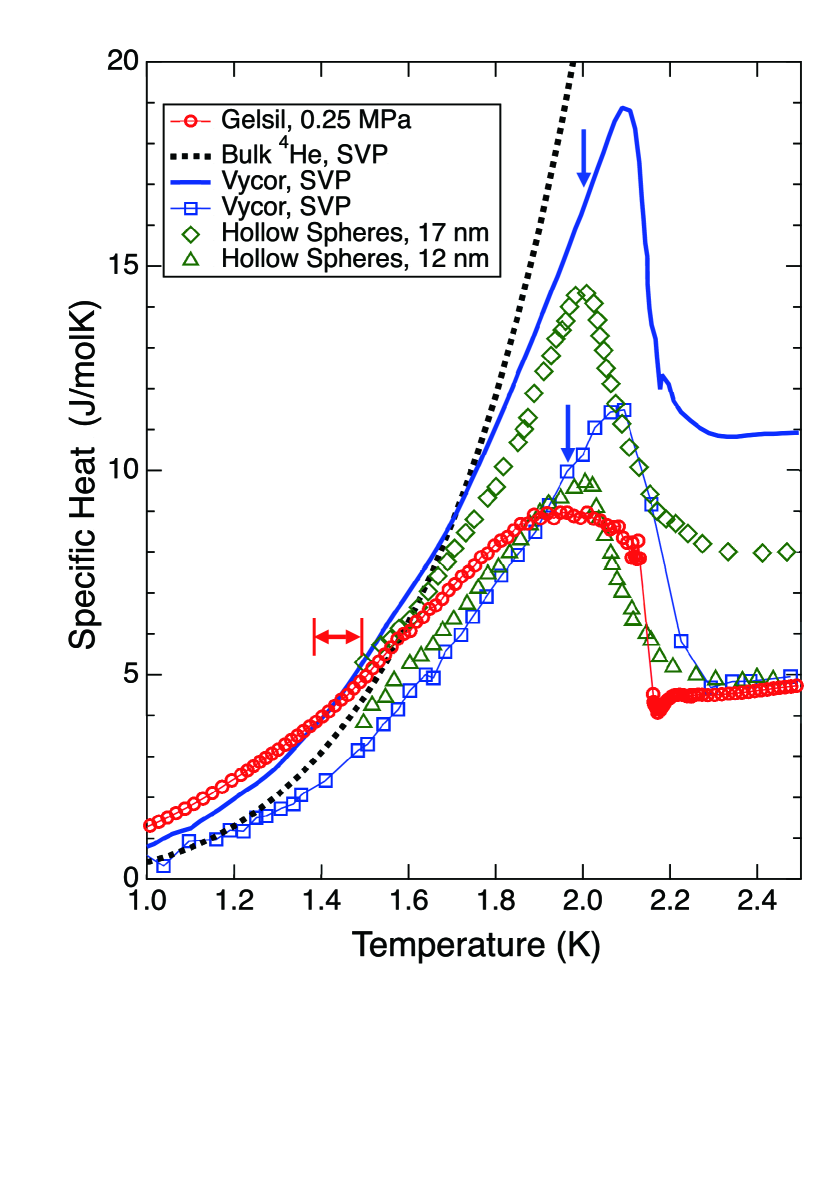
Despite of the perfect absence of macroscopic superfluidity, the heat capacity shows a peak near the bulk , indicating a superfluid transition above [8]. Typical data of the specific heat are shown in Fig. 9 together with the data of other 4He systems. In this graph, the data of 4He in porous Vycor glasses[35, 36] and of 4He droplets formed in microscopic bubbles in copper metal foils[37] are also plotted. The specific heat data of all the confined 4He systems have a blunted shape of the sharp -like peak of the bulk superfluid transition. Clearly, this ”smeared-out” specific heat is caused by a finite-size effect in the superfluid transition[38]. We particularly take notice of the similarity between the specific heat of 4He in Gelsil and that of 4He droplets in copper[37]. The latter system consists of a number of independent hollow spheres of liquid 4He, in which liquid is formed on the metal wall with finite but unknown thickness, coexisting with helium gas inside the liquid sphere. The typical sphere sizes of the two data in Fig. 9 are 17 and 12 nm. It is remarkable that the data of 4He in Gelsil are qualitatively identical to the data of the 12 nm hollow spheres. This agreement leads us to conclude that, at the temperature of the specific heat peak, K, 4He in Gelsil undergoes a finite-size superfluid transition without showing macroscopic superfluidity. (In this paper, we call the emergence of finite sized superfluid droplets a superfluid transition, although it is not a true phase transition in the thermodynamic limit.) Then it is reasonable to speculate that the size of the superfluid droplets, i.e. LBECs, is limited by the pore size.
4.2.2 Superfluid transition and correlation length
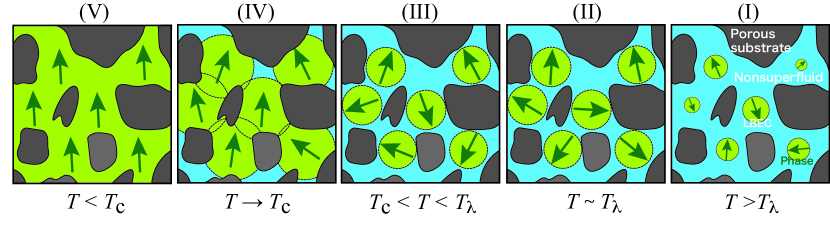
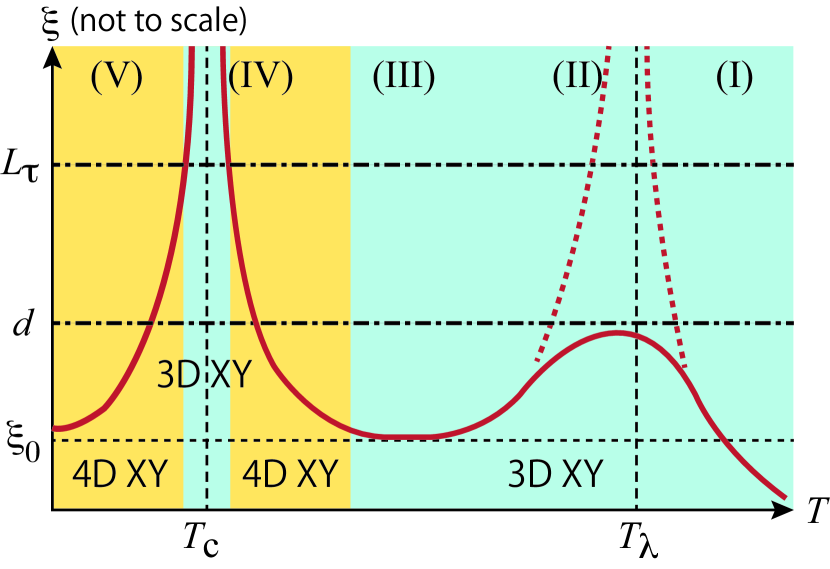
We propose a scenario of the formation of LBECs and the superfluid transition using illustrations in Fig. 10, and the temperature dependence of the correlation length schematically shown in Fig. 11. The scenario described here is a corrected version of the scenario presented in the previous Letter[19], in which the concept of the 4D-3D crossover was omitted.
At , indicated as the temperature region (I) in Figs. 10 and 11, seeds of LBEC are formed at the large spaces of the nanopores. The size of LBEC and the direction of the phase of the order parameter strongly fluctuate by thermal effect and suppression of the exchange of helium atoms. The correlation length , which is roughly the size of LBEC in this temperature regime, traces that of bulk helium (Fig. 11).
As approaches the bulk (the region (II)), the specific heat increases, but it is limited to a certain value at a temperature slightly below . This is attributed to the finite-size effect. The growth of the LBEC, i.e. the growth of , is strongly limited at a length scale determined by the nanoporous structure, because the correlation among LBECs is disturbed by the narrowness of the paths, in which the exchanges of helium atoms are strongly suppressed. The limit length is probably the major part of the pore-size distribution shown in Fig. 2, say, nm. The standstill of the growth of manifests itself in a rounded specific heat shown in Fig. 9.
At between and (the region (III)), the specific heat decreases as in the case of bulk 4He. The specific heat of 4He in Gelsil below the peak temperature is explained by the contribution of rotons and phonons[8]. This fact strongly suggests that each LBEC might behave as a superfluid droplet, although the system does not exhibit macroscopic superfluidity; i.e. The fluctuation of the phase of the order parameter in each LBEC tends to vanish, but the phases among LBECs are uncorrelated. In the region (III), the correlation length will decrease to a constant . Note that, in this temperature region, is no longer the size of LBEC, but is much smaller than it.
In region (IV), as approaches , starts to increase in both the spatial (3D) and imaginary time (+1D) dimensions, and the LBECs start to overlap each other (Fig. 10). Here we denote the correlation length in the imaginary time direction as , where is the dynamical critical exponent, which is considered to be 1 in the present system[1, 12, 13]. The increase in is limited by a length . is given by the system temperature and the velocity of a collective excitation, which is typically the phonon (sound) velocity [13],
| (5) |
where is Planck’s constant and is the Boltzmann constant. For helium at MPa and at K, we obtain as 7.5 nm. This value is larger than the major part of the pore size, nm. When exceeds , the critical behavior should show a crossover from 4D to 3D XY. The 3D correlation length diverges at , then start to decrease.
Just below (the region (V)), the phase coherence establishes, as illustrated in Fig. 10. Again, the criticality shows a crossover from 3D to 4D XY, as becomes smaller than . The 4D XY critical behavior in is observed in this regime. As decreases further, the fluctuation of the order parameter vanishes, so that tends again to the low temperature limit .
The correlation length can be calculated by using the Josephson relation[39, 40, 41]
| (6) |
Note that this formula is for the 3D case. Since this relation is believed to hold generally between the superfluid density and the correlation length, the index is parenthesized in and . The zero-temperature limit of the superfluid density is obtained as a coefficient of the powerlaw fitting Eq. (4), . From the fitting result for the MPa data of sample B shown in Fig. 8 (b), we obtain to be 249 kg/m3. The corresponding is estimated to be 0.33 nm. This value is close to of bulk helium at SVP, 0.31 nm[41]. However, should also be estimated in the 4D space using the dimensionality dependent Josephson formula. We discuss on the 4D correlation length in AppendixB.
4.2.3 4D XY criticality at zero and finite temperatures
The pressure dependence of zero-temperature superfluid density, , and the phase boundary, , were clearly explained as an emergence of 4D XY criticality by applying the disordered Bose - Hubbard model to the 4He in nanoporous structure[12, 13]. In this model, each site corresponds to a large part of pore that contains one LBEC, which consists of approximately 30 - 100 4He atoms, and the sites are connected to neighbors by randam hopping matrix . The -th site has a random chemical potential and a random charging energy , which is an increase in energy when a 4He atom is transferred to the LBEC at the -th site from the nearest neighbor. It is thus an analogue of the charging energy of the superconducting Josephson junction. is given by
| (7) |
where is volume of -th site, the number density and the compressibility of 4He[12, 13]. Using the bulk 4He compressibility to , and assuming that two atomic layers adjacent to the pore wall surface do not participate in superfluidity[42], is estimated to be 0.54 K. This estimation suggests that the superfluid transition occurring around 0.5 K is governed by quantum fluctuation; i.e. The phase of a LBEC fluctuates by the suppression of change in the number of atoms in one site, which cost the energy . This is the very origin of the emergence of 4D XY.
This estimation of has an ambiguity in magnitude: In the previous work of Eggel et al.[12], was estimated to be 1.4 K. The discrepancy between the present and previous estimations is caused by the discrepancies between the nominal pore sizes and the measured pore parameters of Gelsil samples. As shown in Fig. 2, the two Gelsil samples of nominal pore sizes 2.5 and 3.0 nm have identical pore size distributions that are peaked at 3.0 or 3.8 nm. The distribution of the pore size makes the precise determination of difficult. Moreover, it has been suggested that, in general, the compressibility of liquid may be suppressed by confinement into nanoporous media due to the restriction of molecular motion[43]. The suppression of can also occur in the narrow pore regions of the Gelsil samples, resulting in a further increase in . Therefore, we conclude that the quantum effect dominates the superfluid transition, even at K.
The mechanism of the emergence of 4D XY universality class was discussed in the paper by Eggel et al.[12]. In the Bose - Hubbard model[16], the 4D XY criticality is realized only in the case of absence of disorder and at the multicritical points in the - phase diagram (tips of the Mott lobes). In other superfluid - insulator phase boundaries than the tips of the lobes, the p-h symmetry is broken, so the system does not show the 4D XY criticality. In the 4He-Gelsil system, the 4D XY seemed unrealistic because it is difficult to tune the chemical potential. Moreover, in the presence of randomness, the p-h symmetry might also be broken because the number of helium atoms in each LBEC, , is randomly distributed. Eggel et al. found, however, that the fluctuation in produces an exponential factor in a coefficient producing the p - h symmetry breaking in the Lagrangian density, where is the average of the deviation of particle number from the average. Since this factor is as small as , the p - h symmetry breaking becomes negligible. Next, the randomness could produce correlation in disorder in the imaginary time dimension (the correlated disorder[44]). This correlated disorder effect can alter the universality class from 4D XY to others, but such a crossover will appear only at the very vicinity of QCP, at and near 0 K. When the system is away from the QCP, the effect of correlated disorder is negligible. As a result, the 4D XY criticality can be possessed at finite temperatures. We propose that the robustness of 4D XY criticality is sustained not only at 0 K but at finite temperatures, because the charging energy for LBEC is large in the nanopores of Gelsil samples. On the other hand, in 4He in other porous media such as Vycor, is estimated to be about 10 mK[12]. This small makes the critical phenomena in other porous materials completely classical, which, in the case of Vycor, is 3D XY[25, 41, 35].
In the imaginary time dimension, the system size is limited by which was derived above. In analogy with the 3D - 2D finite - size crossover observed in superfluid 4He slabs[38], a crossover from the 4D to 3D XY ciriticality is expected to occur when the correlation length in the time direction reaches . Thus, the critical exponent may change from 1 to other value such as 0.67, as in the case of porous Vycor and gold[25, 26]. In the result of the power-law fitting shown in Fig. 8, an upward deviation from the line is observed in sample B. This might be an indication of the 4D - 3D crossover, but it is hard to explain the absence of such deviations observed in sample A. In the previous letter we have attributed the deviation from the powerlaw in sample B to the thickness of the glass sample (2 mm), which is twice the thickness of sample A[19]. These interpretations should be reconsidered with more detailed experimental study in the vicinity of .
4.3 The scaling of superfluid density
Eggel proposed that the observed physical quantities are described by a universal scaling function that depends on the ratio of the extent in the imaginary time dimension and [13]. Here we describe the scaling argument and the result of fitting using the data of obtained for samples A and B.
In the theory of finite-size scaling, the free energy density is given by a scaling function ,
| (8) |
Here is a control parameter related to as , and is the scaling dimensions of and , and is the length scale in real spaces. Since the critical exponent of the correlation length ,
| (9) |
As the scaling dimension of is , can be written as
| (10) |
including the scaling in the imaginary time dimension , where is the inverse temperature.
Superfluid density is defined by the helicity modulus[40] derived from the free energy. The change in free energy density caused by the spatial change (twist) in the phase of the order parameter is
| (11) |
In order for to satisfy Eq. (10) and Eq. (11),
| (12) |
Assuming that the scaling function of the superfluid density, , is a function of the ratio of the correlation length to the scale in the temporal direction, the superfluid density is written by
| (13) |
We recall that and the control parameter of superfluid transition of 4He in Gelsil is pressure, i.e. . Using the reduced pressure , where is the critical pressure at QCP, and the critical exponents in 4D XY, and , the scaling of superfluid density is described by
| (14) |
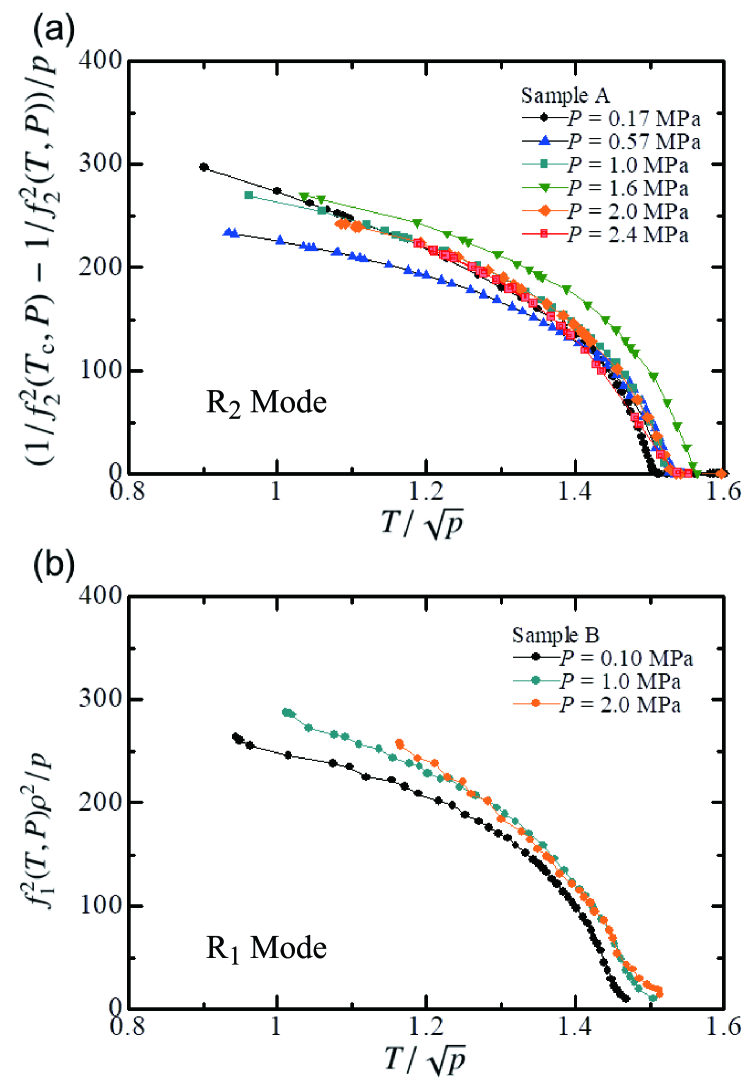
The scaling of superfluid densities for each samples are shown in Fig. 12. For sample A, the superfluid density is evaluated by Eq. (3) because the lowest mode was not precisely measured for sample A. For sample B, the pressure dependence of the resonant frequency was not monotonous due to the mechanical instability of D2 diaphragm. In the latter, therefore, the scaling of is examined using Eq. (2). Both the quantities are proportional to , but is multiplied by to take the pressure dependence of density of bulk liquid 4He into account.
As shown in Fig. 12, most of the data sets successfully collapse onto a single curve, the scaling function. At some pressures, there exist deviations, which seem to be shift in temperature direction. There seems no monotonous deviations against pressure. We attribute the deviations to unknown experimental errors such as the determination of pressure. The scaling analysis is another strong evidence of the 4D XY criticality.
4.4 Dissipation anomaly by phase alignment
The transition from the LBEC states to the macroscopic long-range ordered state is a process that the phases of LBECs which initially point to random directions are aligned as the system is cooled passing , as shown in Fig. 10 (IV) and (V). During this phase alignment process, excess dissipation should be produced, and it can be detected as a change in the linewidth of the superfluid resonances. We calculate the excess dissipation using the Josephson - Anderson equation, which was proposed to discuss the decay of superflow by phase slippage[45, 46, 47]. Here we analyze the data of sample B, in which the dissipation was stably measured during the experimental runs.
As we pointed out in Sec. 3.2, in the dissipation of the superfluid resonator, there are contributions originated from the bulk liquid ((1) viscosity, (2) superfluid density, and (3) coupling to the second sound). The dissipation other than the second sound effect, i.e. the change in , is calculated as the blue solid lines in Fig. 7. The calculated curves basically agree with the temperature dependence of between and , and some structures are attributed to the the coupling of second sound modes to the resonance. The coupling to the second sound is discussed later in this section and in Appendix C.
The dissipation energy after which the part of is subtracted is shown in Fig. 13. Here, in order to discuss the energy scale, is converted into the dissipation energy by the definition , where is the total energy stored in the system. equals to the work by electric AC force, estimated by
| (15) |
where is the period of the resonance, the amplitude of the displacement of driver diaphragm D1 and the capacitance between D1 and E1.
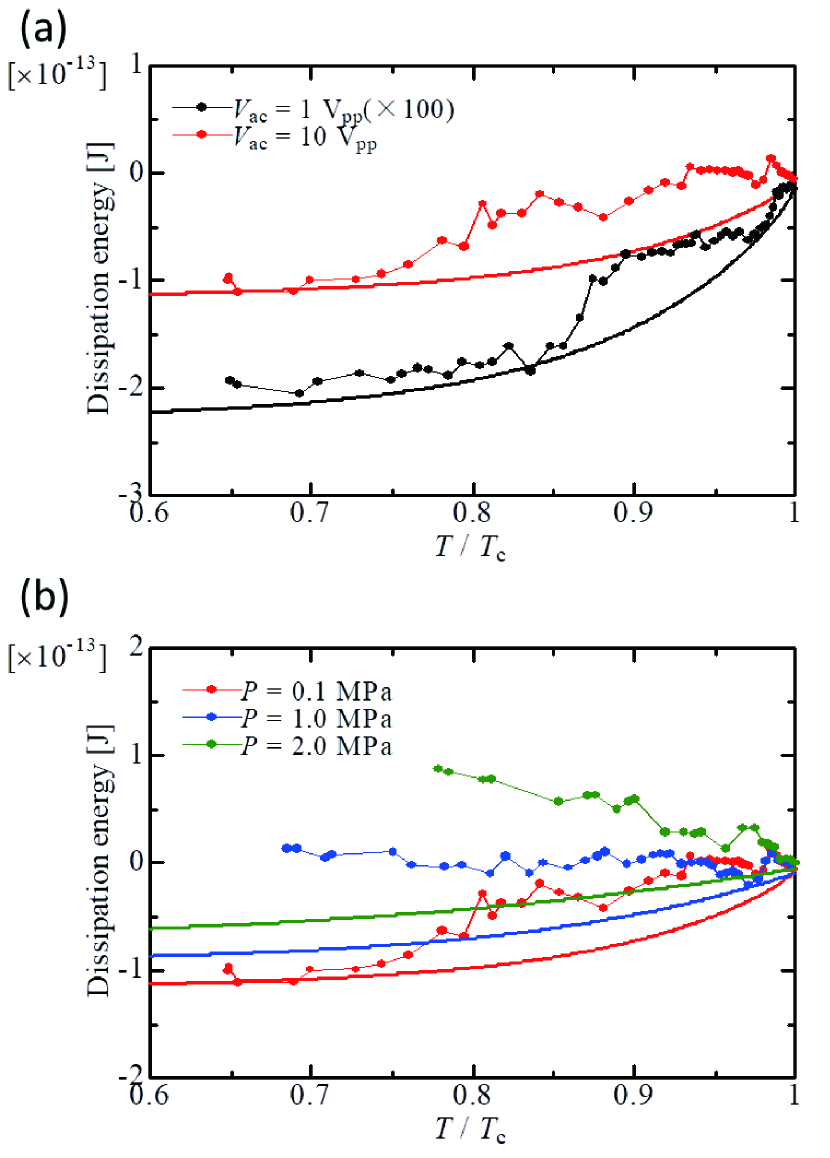
The temperature dependence of the dissipation energy below consists of two contributions. One is the negative contribution by the occurrence of superflow through Gelsil. Below , the bulk liquid in RI hydrodynamically connects to the liquid in RO. The mass superflow through the Gelsil nanopores results in the reduction in . The reduction of dissipation induced by the superflow will depend on the details the flow structure in Gelsil (e.g. tortuosity of the flow paths) and the structure of the resonator. Although it is difficult to evaluate quantitatively these structural effects, the dissipation reduction will be simply proportional to the superflow mass. The superflow mass is determined by the superfluid density in Gelsil, , the superfluid velocity inside the nanopores and the structure of the nanopores. Assuming that has no temperature dependence, the negative dissipation is determined by the temperature dependence of . In fact, the data of MPa taken at 1 Vp-p (black dots in Fig. 13 (a)) agrees well with the curve obtained from the temperature dependence (black line in the same Figure). We have therefore adjusted a coefficient to match the dependence of obtained from the mode Eq. (2) with the data at low temperatures. For the data of MPa taken at 10 Vp-p, the negative contribution to the dissipation was calculated in the same manner. At pressures 1.0 and 2.0 MPa, the negative terms were determined with reference to the data of 0.1MPa at 10Vp-p. These calculations are shown by solid lines in Fig. 13 (b).
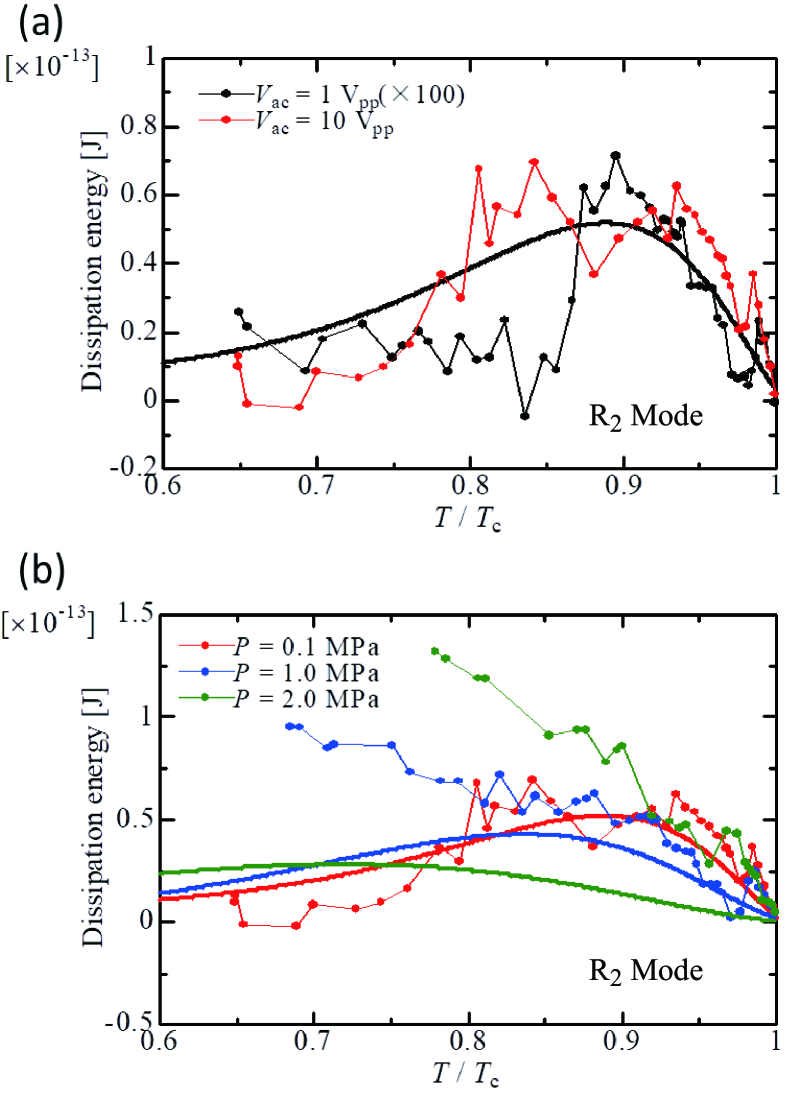
Subtracting the negative dissipation contribution from the data below , we find excess dissipation anomalies. The excess dissipation is shown in Fig. 14. Although the data are scattered, a broad peak or an increase is observed. In the data taken at MPa, the dissipation has a peak at around . On the other hand, at pressures 1.0 and 2.0 MPa, the excess dissipation increases with decreasing temperature. We find that, in the 0.1 MPa data shown in Fig. 14 (a), the height of the peak at 10 Vp-p is about 100 times the height of the 1 Vp-p data. This means that the observed excess dissipation depends on the driving force.
We propose a model to explain the excess dissipation as an anomaly originated from the the alignment event of the mismatched phases among LBECs. As the LBECs overlap near or at , the phases of many LBECs start be matched each other with fluctuation. Under the periodic driving force applied from the bulk liquid outside the Gelsil sample, the phase matching and mismatching events occur repeatedly during measurements over many periods of oscillation. This produces a statistic dissipation event which can be detected by the resonator response.
In the Josephson - Anderson formula[45, 46, 47], changes in the phase angle of the superfluid order parameter produce the changes in energy, which is written by
| (16) |
where and are differences in superfluid phase and chemical potential between two spatially separated arbitrary points, respectively. In the present experimental situation, we take these differences between a macroscopically grown Bose-Einstein condensate producing macroscopic superflow via Gelsil and a LBEC droplet which participate newly to the condensate. When the phase of the newly connected LBEC is changed to the phase of the macroscopic superfluid, the phase of the LBEC tends to coincide with that of the macroscopic condensate, i.e. , within a characteristic time scale . The change of the chemical potential difference, i.e. energy cost per 4He atom, is given by . Therefore, the change in energy per one additional LBEC is
| (17) |
where is the mean condensate number per LBEC. is given by , where is the condensate density of LBEC, the mean volume of LBEC. Because LBECs grow from , which is sufficiently higher than , should be different from the macroscopic superflid density . The superfluid density is determined by the number of LBECs participating in the macroscopic superfluid with the local condensate density .
The phase coherence is achieved by positional exchanges of helium atoms between LBECs, which are carried by the flow induced by the resonator. Assuming that the flow rate between LBECs develops toward low temperature proportionally to the macroscopic superfluid density , and that the density carried between completely linked LBECs is , the mass current density between LBECs is . The phase coherence is established when the mass carried from another LBEC spatially separated by a distance reaches the mass in a LBEC of density . Then, the characteristic time scale of phase matching event is
| (18) |
The dissipation event is caused by a newly connected LBEC at a given temperature. On the other hand, the LBECs that already participate to the macroscopic superfluid at sufficiently high temperature have phase coherence, and suffer no change in their phase because of the much larger energy cost than that of the small LBEC case. The number of LBECs contributing to the dissipation event, , is the number of the LBECs newly participating in the macroscopic superfluid within the temperature range . Because the rate of LBEC belonging to the macroscopic superfluid equals to the rate ,
| (19) |
where is the total number of LBECs. The characteristic temperature scale should correspond to the energy scale which makes the phase of a LBEC decoupled from the macroscopic superfluid. We assume that this energy equals to the energy of phase matching event, . Thus, the total dissipation energy by resolving the phase mismatch is
| (20) |
Because superfluid phase has a degree of freedom ( is an integer), the phase matching can progress in either increasing or decreasing direction, which is decided by the energy cost. Therefore, the maximum phase difference is effectively and equals to as a mean value.
The dissipation energies calculated from Eq. (20) are shown in Fig. 14 for different pressures. The calculated dissipation at MPa has an excellent agreement with the data without any fitting parameters. The data at 1.0 MPa also agrees with the calculated line except for low temperatures, and the data at 2.0 MPa is significantly larger than the line at all temperature range. The data for 0.1 MPa taken at 1 Vp-p agrees with the calculated dissipation, in which the factor 100 is multiplied. This agreement ensures the dependence on the superfluid velocity in Eq. (20) on the assumption that is propotional to the drive voltage .
The disagreement between the calculation and experimental data at high pressures, 1.0 and 2.0 MPa, may be originated from the coupling of the mechanical resonance to some standing wave modes of the superfluid second sound. We discuss the coupling of the second sound in Appendix C. The coupling may be the origin of the additional dissipation structures and some anomalies in at , which are shown in Fig. 7 and Fig. 4, respectively. At and 2.0 MPa, the frequencies of some standing wave modes are close to at temperatures below , and the modes have little temperature dependence because of the second sound velocity has a minimum. The coupling of the mode to the second sound modes with little temperature dependence may result in an additional dissipation in a broad range below , This speculation is consistent with the fact that at 0.1MPa the dissipation data agree well with the calculation of the phase matching - induced dissipation. At 0.1 MPa, the sound velocity is so large that all the modes have much higher frequencies than . To conclude, the excess dissipation below is quantitatively accounted for the mechanism of phase alignment during the growth of macroscopic superfluid.
4.5 The phase diagram
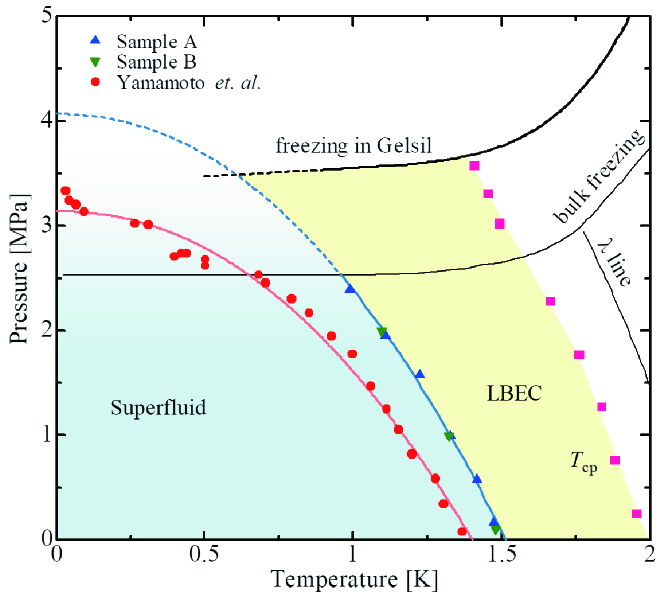
The - phase diagram obtained in this and previous works is summarized in Fig. 15. In this work, the data of phase boundary was obtained only at MPa, over which bulk 4He freezes in the resorviors. is 1.45 K at 0.1 MPa, and decreases, as increases, down to 0.98 K at 2.4 MPa.
It is remarkable that shows no difference between the results of sample A and B, whereas in the sample used in the previous TO study was significantly lower than the present samples. The difference of between the present samples A and B and the previous one is 0.08 K at 0.1 MPa, but it increases up to 0.25 K at 2.4 MPa. Kobayashi et al. also found that depends on the time of annealing of the glass sample for dehydration[48]. Even in a single sample, longer annealing time lowered at high pressure region, although near 0 MPa showed no change for the additional annealing. From these observations, the factors that determine is yet to be elucidated, although seems very sensitive to the nanoporous structure. In our scenario of the superfluid transition, it is essential that the LBECs are connected each other via narrow paths in which the positional exchange of helium atoms are strongly suppressed. This may be the origin of the sample - dependent , in particular at high pressure regimes ( MPa). It is plausible that, in the narrow bottleneck paths (say, 2 nm) between LBECs, 4He atoms are hard to move particularly at high pressures, in which the interatomic correlation is enhanced.
As in the previous work[12], the phase boundary is fitted by with better quality than the fitting to the previous TO data. The quantum critical pressure is obtained for samples A and B to be 4.08 MPa. This is higher than the freezing pressure of 4He in Gelsil which was determined in a previous measurement, MPa[49]. Although the freezing pressure of 4He in Gelsil is unknown in the present Gelsil samples, the QPT may be masked by the solid phase. Such a masking, even if it exists, will not influence the quantum critical nature observed at lower pressure.
5 Conclusion
We have precisely determined the critical exponent of superfluid density of 4He confined in two nanoporous Gelsil glass samples by a newly developed mechanical resonance technique. This work has revealed a number of features that are essential for elucidating the mechanism of the superfluid transition. The superfluid critical exponent is obtained as for two glass samples under all pressure ranges where the experiment was performed. This means that superfluid 4He in Gelsil exhibits a 4D XY quantum criticality even at finite temperatures, contrary to general expectation for quantum critical phenomena, in which the phase transitions at any finite temperatures should be classical. This apparent contradiction is explained by a hypothesis about the mechanism of superfluid transition that the macroscopic superfluidity emerges by the sequential growth of local coherence between nearest neighbor LBECs, where the correlation length is still finite. This proposed mechanism has also been confirmed in the context of the evaluation of dissipation that is expected to occur accompanied with the superfluid transition, as the energy cost for resolving the phase mismatch between LBECs. In this work, a novel mechanism of the superfluid transition of 4He in nanoporous media has been definitely established. This outcome will be a key for further understanding general confined 4He systems.
To our knowledge, superfluid 4He in Gelsil is the first example of bosonic 4D XY system in real matter. Further studies of QPT in superfluid 4He in nanoporous media is expected to stimulate theoretical studies of 4D XY in the Bose-Hubbard model[50] and 4D XY QPTs proposed in fermionic systems[5, 6].
Acknowledgments
We are grateful to Kazuyuki Matsumoto and Tomoki Minoguchi for fruitful discussions.
Appendix A The mode
We have made a measurement of temperature dependence of the mode for sample B. The data of and are shown in Fig. 16. As the temperature decreases, shows a sharp increase at bulk , then saturates below 1.6 K, and shows a steep increase at inside Gelsil. decreass at and decreases monotonously, except for large scatter in the data of MPa at K. The origin of the large scatter of and the accompanied jumps in is unknown. At , turns to increase and shows a broad peak.
The temperature and pressure dependencies of the mode are similar to those observed in the mode. The mode can therefore be a higher order mode of , but the detail of the higher order mode has not yet been elucidated. As an attempt, we apply Eq. (1), the formula of obtained from the spring-mass model in Fig. 6 (b), to the temperature depenence of below .
We analyze the powerlaw behavior of near by plotting as a function of . The results are shown in Fig. 17 (a). Although the data are scattered, can also be fitted by a power law in the temperature range . As shown in Fig. 17 (b), the exponent is for three pressures. It is concluded that the critical exponents obtained from the mode are consistent with those from the mode. It should, however, be emphasized that the mode is not fully identified, so that the formula, Eq. (1), deriving has not been validated for the mode.
We finally note that the dissipation shown in Fig. 16 (b) increases below with a broad peak. It can be understood by the same phase matching mechanism as the dissipation in the mode.
Appendix B The correlation length in 4D
The definition of the correlation length given by Eq. 6 is for the 3D superfluid. The definition of for arbitrary dimensions is given by[40, 35]
| (21) |
where is the dimension of the system. For , the superfluid density must be defined in a 4D space including the imaginary time dimension, with a (SI) unit kg/m4. In this Appendix, we show that in 4D is nearly equal to , although there are some ambiguities in estimating the length scale in the imaginary time dimension.
Here we estimate using the data taken at MPa. In Sec. 4.2.2, we have obtained the zero-temperature limit of the superfluid density to be kg/m3. Here the number 3 in parentheses indicates 3D. In order to obtain the density in 4D space, one needs to know “the lattice constant” in the imaginary time dimension. The lattice constant in unit of time is related to the ultraviolet cutoff energy by [1]. This is converted to the lattice constant in unit of length by multiplying the velocity of collective excitation , i.e. . In superfluid helium, is the phonon, i.e. sound, velocity, and the corresponding cutoff energy should be the maximum phonon frequency . We assume that is the phonon energy at the end of the linear dispersion in the well-known phonon - (maxon -) roton dispersion () curve. In the phonon region ( Å-1), the dispersion curve of 4He in Gelsil is identical to that of bulk superfluid 4He[52]. We therefore adopt meV and m/s at MPa. Using these values, is estimated to be 0.16 nm. Then the superfluid density in 4D is obtained to be
| (22) |
The 4D correlation length is finally estimated to be 0.23 nm. This value is about the same as the 3D one, nm. Considering the ambiguities in the physical quantities in these estimations, we conclude that the correlation length scale is identical in 3D and 4D.
Appendix C Coupling of second sound standing waves with the mechanical resonator
As shown in Figs. 4 and 7, we have observed anomalous behaviors in the dissipation and the corresponding frequency , at temperatures between and . For example, in the middle panel of Fig. 7 ( MPa), shows two peaks at and 1.8 K, below which an excess amount of dissipation is observed down to 1.4 K, around which there is another peak. Correspondingly, shown in Fig. 4 shows small kinks, which coincide with the peaks at 1.8 K and at 1.4 K. Moreover, at different pressures have similar peak structures, which systematically shift to low temperatures with increasing pressure.
We attribute these anomalies to the couplings of the resonance to standing wave modes of superfluid second sound. The excitation of second sound needs oscillation of temperature by local heating[53]. There are two possible sources: One is a heating by the loss of displacement current between the fixed electrode and flexible diaphragm oscillating at . Another heat source is dissipation in the mechanical oscillation of the diaphragm. In the former, the heating is proportional to the square of the displacement current, , which oscillates at a frequency twice the mechanical resonant frequency, i.e. , while in the latter, the heat oscillates with the same frequency . Both of the heatings are estimated to be about 1 nW, which is enough to excite the second sound standing waves in the resonator.
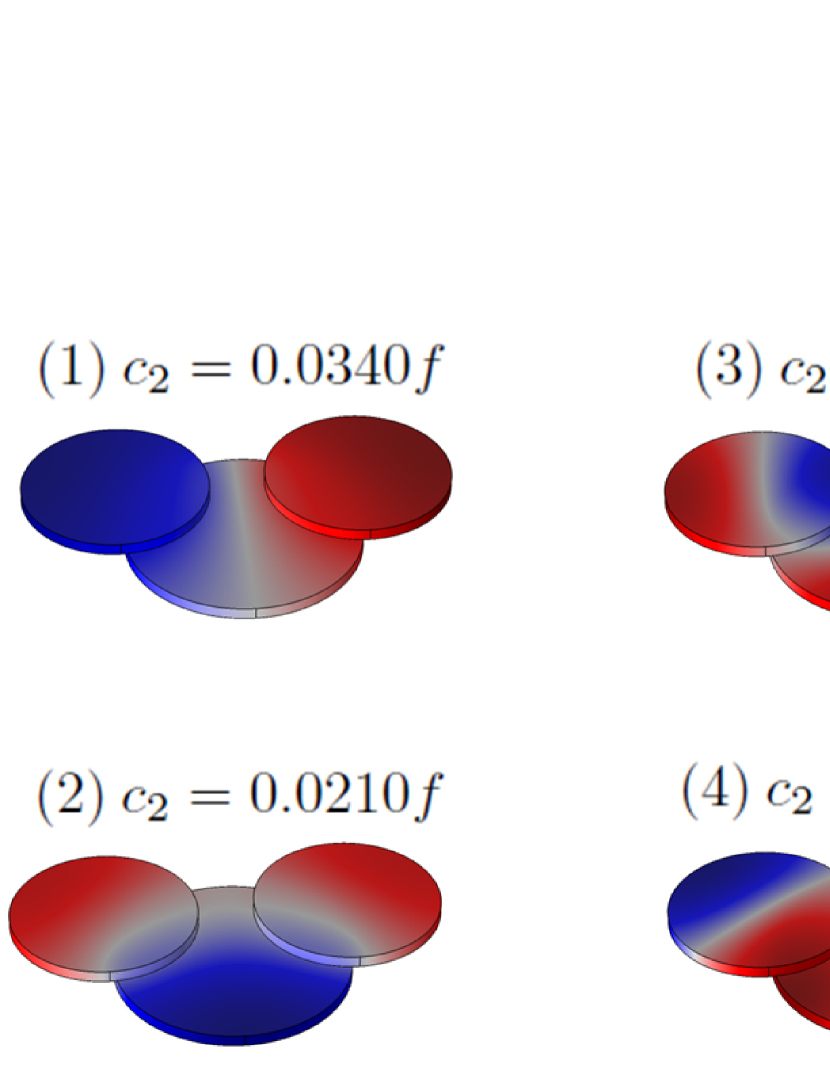
It is difficult to calculate analytically calculate the fundamental modes of second sound resonances due to structural complexity of the mechanical resonator. Thus, we apply the finite element method (FEM) analysis to the resonator using COMSOL Multiphysics. Here we have performed a simple acoustic analysis of an ordinary density wave with the known second sound velocity to obtain the relationship between the sound velocity and the frequencies of the standing waves. Although the second sound is a temperature wave with no net pressure (or density) oscillation, the present method will also work to find the second sound modes which are determined only by the shape of the resonator and the sound velocity. The results are shown in Fig. 18 as distributions of sound pressure. Each mode is represented just at the condition of a standing wave resonance. The condition is expressed as , where is the (second) sound velocity, the frequency of standing wave and the coefficient depending on the mode (having the dimension of wavelength). Note that the heating induced by displacement current produces oscillation at , while the heating by mechanical oscillation results in .
We have compared the frequencies of various second sound modes with and have succeeded to assign the dissipation anomalies to the modes. The assignment of the modes is seen in Fig. 19. In this figure, we plot with the “mode velocity”, which is derived by using the formula with coefficients determined by the FEM analysis. When crosses to , the second sound can be excited by the mechanical resonator. The coupling may produce an anomaly in accompanied with a peak in dissipation. Although data do not exactly correspond to the experimental pressure, we find some anomalies in near the crossing points, some of which are indicated by arrows.
We identify that the first mode is excited at , while the others are at . The fourth mode seems not to be excited. The fifth and sixth modes can not be distinguished due to almost the same excitation conditions, although they can be simultaneously excited. In the data of MPa in Fig. 19 (a), the dissipation anomalies are assigned to be the first, third and sixth modes from the low temperature side. At MPa (Fig. 19 (b)), the modes are the same as in the case of 0.1 MPa, but the first mode couples at the temperature where shows maximum and has little temperature dependence. This results in broad dissipation peak around 1.4 K, as shown in Fig. 7. At MPa (Fig. 19 (c)), the third and sixth modes are coupled with the resonance, and the third mode couples at the temperature of the maximum of . This also produces a broad peak around 1.6 K.
Near 1 K, i.e. below , takes a minimum depending on pressure[51]. The third mode at 1.0 MPa and the sixth mode at 2.0 MPa may couple with the resonance around this minimum near . These couplings probably produce an additional dissipation that should have a very broad peak around 1 K. It is strongly suggested that the deviation between experimental data and the calculated dissipation observed at and 2.0 MPa (Fig. 14 (b)) is caused by this coupling. At MPa, no discrepancy between the dissipation data and the calculation. The absence of discrepancy at low pressures is also explained by the absence of the standing wave modes in the corresponding frequency regime. We therefore conclude that the phase matching process plus the second sound coupling account for the observed dissipation below at all pressures.
Appendix D Superfluid velocity
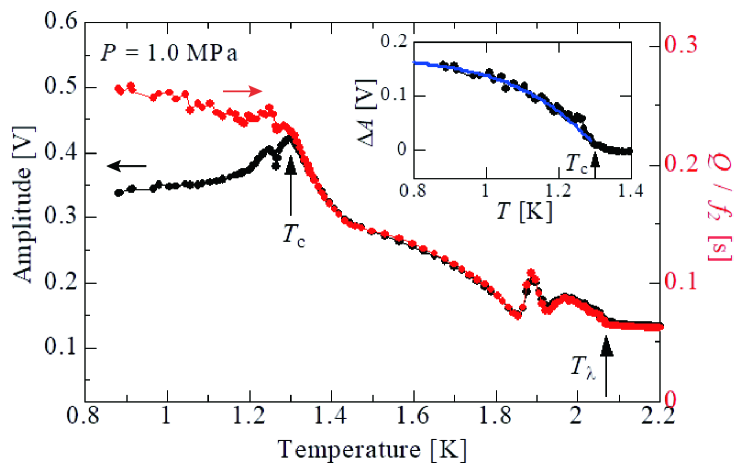
In this Appendix, we derive the superfluid velocity from the oscillation amplitude voltage of the resonator. In Fig. 20, we show the temperature dependence of the amplitude for sample B under 1.0 MPa, together with the quality factor devided by the resonant frequency, . In a usual condition, the amplitude corresponds to by a relation of , where is a resonant frequency. As is clearly seen in the graph, the amplitude matches exactly with above . Below , however, deviates from . This deviation is attributed to the occurrence of superflow through Gelsil nanopores. Below , the amplitude of the pressure swing by the AC drive is relaxed due to the superflow between RI and RO, resulting in the decrease in the displacement of the detector diaphragm.
The displacement of the detector diaphragm D2, , is related to by
| (23) |
where is the electric permittivity, is the area of the detector diaphragm, = 350 V is the bias DC voltage applied to D2, is the capacitance in equilibrium position between D2 and the opposed electrode E2, and = 500 MV/A is the gain of the current preamplifier. The amplitude directly corresponds to the mass current of liquid 4He moving in RI and flowing through Gelsil. The reduction in attributed to mass current through Gelsil, , is estimated as the deviation of from the temperature dependence of shown in Fig. 20. Then determines mass current by the following relation
| (24) |
where is the superfluid velocity in Gelsil and the total cross sectional area of the flow channel in Gelsil. Unless the superfluid velocity exceeds a critical velocity, is determined by the chemical potential difference across the channel. The inset of Fig. 20 shows the temperature dependence of . It is remarkable that matches with the temperature dependence of superfluid density estimated from the mode frequency , as indicated by the blue line. It is therefore concluded that is constant and is well explained by Eq. (24). This analysis provides a strong support to our hydrodynamic model of the resonator and the validity of the determination of by Eq. (1) and Eq. (2). The superfluid velocity estimated from Eq. (24) is mm/s.
References
- [1] S. L. Sondhi, S. M. Girvin, J. P. Carini, and D. Shahar, Rev. Mod. Phys. 69, 315 (1997).
- [2] S. Sachdev, Quantum Phase Transitions, Cambridge University Press (2011).
- [3] P. Gegenwart, Q. Si, and F. Steglich, Nature Phys. 4, 186 (2008).
- [4] B. Keimer, S. A. Kivelson, M. R. Norman, S. Uchida, and J. Zaanen, Nature 518, 179 (2015).
- [5] D. M. Broun, W. A. Huttema, P. J. Turner, S. Özcan, B. Morgan, R. Liang, W. N. Hardy, and D. A. Bonn, Phys. Rev. Lett. 99, 237003 (2007)
- [6] M. Franz and A. P. Iyengar, Phys. Rev. Lett. 96, 047007 (2006).
- [7] K. Yamamoto, H. Nakashima, Y. Shibayama and K. Shirahama, Phys. Rev. Lett. 93 075302 (2004).
- [8] K. Yamamoto, Y. Shiabayama and K. Shirahama, Phys. Rev. Lett. 100 195301 (2008).
- [9] K. Shirahama, J. Low Temp. Phys. 146, 485-497 (2007).
- [10] K. Shirahama, K. Yamamoto and Y. Shibayama, Low Temp. Phys. 34, 273 (2008).
- [11] K. Shirahama, K. Yamamoto and Y. Shibayama, J. Phys. Soc. Jpn. 77, 111011 (2008).
- [12] Th. Eggel, M. Oshikawa and K. Shirahama. Phys. Rev. B 84, 020515(R) (2011).
- [13] Th. Eggel, Ph.D. Thesis, University of Tokyo (2011).
- [14] D. S. Greywall and G. Ahlers, Phys. Rev. A 7, 2145 (1973); G. Ahlers, Rev. Mod. Phys. 52, 489 (1980).
- [15] M. Barmatz, I. Hahn, J. A. Lipa, and R. V. Duncan, Rev. Mod. Phys. 79, 1 (2007).
- [16] M. P. A. Fisher, P. B. Weichman, G. Grinstein, and D. S. Fisher, Phys. Rev. B 40, 546 (1989).
- [17] O. Avenel and E. Varoqaux, Phys Rev. Lett. 55, 2704 (1985).
- [18] X. Rojas and J. P. Davis, Phys. Rev. B 91, 024503 (2015).
- [19] T. Tani, Y. Nago, S. Murakawa, and K. Shirahama, J. Phys. Soc. Jpn. 90, 033601 (2021).
- [20] E. P. Barrett, L. G. Joyner, and P. P. Halenda, J. Am. Chem. Soc. 73, 373 (1951).
- [21] R. Blaauwgeers, M. Blazkova, M. Clivecko, V. B. Eltsov, R. de Graaf, J. Hosio, M. Krusius, D. Schmoranzer, W. Schoepe, L. Skrbek, P. Skyba, R. E. Solntsev, and D. E. Zmeev, J. Low Temp. Phys. 146, 537 (2007).
- [22] L. S. Goldner, N. Mulders, and G. Ahlers, J. Low Temp. Phys. 93, 131 (1993).
- [23] M. Campostrini, M. Hasenbusch, A. Pelissetto, P. Rossi, and E. Vicari, Phys. Rev. B 63, 214503 (2001).
- [24] J. A. Lipa, J. A. Nissen, D. A. Stricker, D. R. Swanson, and T. C. P. Chui, Phys. Rev. B68, 174518 (2003).
- [25] C. W. Kiewiet, H. E. Hall and J. D. Reppy, Phys. Rev. Lett. 35, 1286 (1975).
- [26] J. Yoon and M. H. W. Chan, Phys. Rev. Lett. 78, 4801 (1997).
- [27] A. B. Harris, J. Phys. C 7, 1671 (1974).
- [28] M. Chan, N. Mulders, and J. Reppy, Phys. Today 49 (8), 30 (1996).
- [29] M. H. W. Chan, K. I. Blum, S. Q. Murphy, G. K. S. Wong and J. D. Reppy, Phys. Rev. Lett. 61 1950 (1988).
- [30] G. K. S. Wong, P. A. Crowell, H. A. Cho, and J. D. Reppy, Phys. Rev. B 48, 3858 (1993); G. K. S. Wong, Ph.D. Thesis, Cornell University (1990).
- [31] J. Yoon, D. Sergatskov, J. Ma, N. Mulders, and M. H. W. Chan, Phys. Rev. Lett. 80, 1461 (1998).
- [32] N. Mulders, R. Mehrotra, L. S. Goldner, and G. Ahlers, Phys. Rev. Lett. 67, 695 (1991).
- [33] H. Nishimori and G. Ortiz, Elements of Phase Transitions and Critical Phenomena, OUP Oxford (2010).
- [34] R. J. Donnelly and C. F. Barenghi, J. Phys. Chem. Ref. Data 27, 1217 (1998).
- [35] G. Zassenhaus, Ph. D. Thesis, Cornell University, 1999.
- [36] D. F. Brewer, J. Low Temp. Phys. 3, 205 (1970).
- [37] E. G. Syskakis, F. Pobell, and H. Ullmaier, Phys. Rev. Lett. 55, 2964 (1985).
- [38] F. M. Gasparini, M. O. Kimball, K. P. Mooney, and M. Diaz-Avila, Rev. Mod. Phys. 80, 1195 (2008).
- [39] B. D. Josephson, Phys. Lett. 21, 608 (1966).
- [40] M. E. Fisher, M. N. Barber, and D. Jasnow, Phys. Rev. A 8, 1111 (1973).
- [41] G. Zassenhaus and J. D. Reppy, Phys. Rev. Lett. 83, 4800 (1999).
- [42] T. Makiuchi, M. Tagai, Y. Nago, D. Takahashi, and K. Shirahama, Phys. Rev. B 98, 235104 (2018).
- [43] G. Y. Gor, D. W. Siderius, C. J. Raumussen, W. P. Krekelberg, V. K. Shen and N. Bernstein, J. Chem. Phys. 143, 194506 (2015).
- [44] A. Weinrib and B. I. Halperin, Phys. Rev. B 27, 413 (1983).
- [45] B. D. Josephson, Phys. Lett. 1, 251 (1962).
- [46] P. W. Anderson, Rev. Mod. Phys. 38, 298 (1966).
- [47] R. E. Packard, Rev. Mod. Phys. 70, 641 (1998).
- [48] T. Kobayashi, J. Taniguchi, A. Saito, S. Fukazawa, M. Suzuki, K. Shirahama, J. Phys. Soc. Jpn. 79, 084601 (2010).
- [49] K. Yamamoto, Y. Shibayama and K. Shirahama. J. Phys. Soc. Jpn. 77, 013601 (2007).
- [50] O. A. Prośniak, M. Ła̧cki, and B. Damski, Sci. Rep. 9, 8687 (2019).
- [51] R. D. Maurer and M. A. Herlin, Phys. Rev. 81, 444 (1951).
- [52] O. Plantevin, H. R. Glyde, B. Fåk, J. Bossy, F. Albergamo, N. Mulders, and H. Schober, Phys. Rev. B 65, 224505 (2002).
- [53] See for example, Low Temperature Physics, Ch. Enss and S. Hunklinger, Springer (2005).
- [54] J. S. Brooks and R. J. Donnelly, J. Phys. Chem. Ref. Data 6, 51 (1977).