eprint
Electronic coherence and coherent dephasing in the optical control of electrons in graphene
Abstract
Electronic coherence is of utmost importance for the access and control of quantum-mechanical solid-state properties. Using a purely electronic observable, the photocurrent, we measure an electronic coherence time of 224 fs in graphene. The photocurrent is ideally suited to measure electronic coherence as it is a direct result of quantum path interference, controlled by the delay between two ultrashort two-color laser pulses. The maximum delay for which interference between the population amplitude injected by the first pulse interferes with that generated by the second pulse determines the electronic coherence time. In particular, numerical simulations reveal that the experimental data yield a lower boundary on the electronic coherence time and that coherent dephasing masks a lower coherence time. We expect that our results will significantly advance the understanding of coherent quantum-control in solid-state systems ranging from excitation with weak fields to strongly driven systems.
Within the last 25 years, the role of electronic coherence is pivotal in ultrafast optoelectronics Bigot et al. (1991); Krausz and Stockman (2014); Hohenleutner et al. (2015); Cundiff (2016); Higuchi et al. (2017); Reutzel et al. (2019). Several experimental schemes has been applied to study the underlying lifetime of coherence, which can range from picoseconds in cold atoms Maunz et al. (2007); Koch and Shapiro (2012) down to the sub-femtosecond timescales in highly excited semiconductors and metals Bigot et al. (1991); Petek and Ogawa (1997); Seiffert et al. (2017). One key to measure coherence is the access to an interference process, such as used in coherent spectroscopy Petek and Ogawa (1997); Cundiff (2016); Reutzel et al. (2020) or four-wave mixing Cundiff (1994). As a counterpart to these experiments relying on optical polarization, we will show that a current, which is a direct result of quantum interference in solids, can serve as ideal observable to measure electronic coherence in solids. While there are various measurements demonstrating the coherent control in solids Atanasov et al. (1996); Haché et al. (1997); Dupont et al. (1995); Fortier et al. (2004); Sun et al. (2010, 2012), the underlying timescale of electronic coherence is mostly obscured due to the lack of ultrafast pulses.
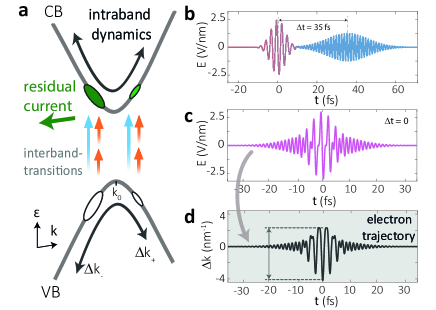
In particular, light of low temporal symmetry can generate net currents in solids, even in the absence of a bias voltage or spatial asymmetries in the material Armstrong et al. (1962); Atanasov et al. (1996); Haché et al. (1997); Dupont et al. (1995); Sun et al. (2010); Higuchi et al. (2017); Garzón-Ramírez and Franco (2018); Grzón-Ramírez and Franco (2020). In the perturbative limit, such light-induced symmetry breaking arises due to the interference of an even and odd order pathway from a given initial to a final momentum state, as schematically shown in Fig. 1a for one- versus two-photon absorption Atanasov et al. (1996); Haché et al. (1997); Dupont et al. (1995); Blanchet et al. (1997); Fortier et al. (2004); Franco and Brumer (2008). By changing the relative phase between the two colors, the quantum interference and, thus, the net current amplitude and direction can be controlled. Intriguingly, this interference process persists beyond the perturbative regime and expands to the strong-field regime. In this case, the interference between intra- and interband light-induced electron dynamics leads to a phase-controllable current Wismer et al. (2016); Chizhova et al. (2016); Higuchi et al. (2017); Sato et al. (2018). In all these regimes, the current requires electronic coherence to emerge as it relies on interference Shapiro and Paul (2012). Scattering with other electrons or phonons are sources of decoherence, leading to a suppression of the light-injected current, as the electrons loose its ability to interfere Bigot et al. (1991); Petek and Ogawa (1997); Gu and Franco (2017); Hu et al. (2018). Whereas the current is a purely electronic observable arising from electron interference, commonly applied methods to measure coherence, based on the optical response of matter, rely on measuring the optical polarization. While such measurements offer information about coherence between optically active states it is often hard to disentangle electronic and vibrational contributions to the resulting signal, making it challenging to directly measure electronic coherence Petek and Ogawa (1997); Cassette et al. (2015); Kraus et al. (2018); Geneaux et al. (2019).
In this Letter, we demonstrate the ability to monitor electronic coherence by injecting a two-color induced photocurrent in graphene. The combined two-color optical field is described as , with the delay between both pulses, and and are the envelope functions of the laser pulses with angular frequencies of and . To lowest order, the current density emerges as a third order process in the photoresponse Atanasov et al. (1996); Haché et al. (1997); Dupont et al. (1995); Shapiro and Paul (2012); Grzón-Ramírez and Franco (2020):
| (1) |
where and are the peak field strengths. The dependence of the relative phase on the time delay between the two colors is given by Atanasov et al. (1996); Haché et al. (1997); Franco and Brumer (2008).
The formalism that leads to Eq.(1) requires continuous wave excitation, where only excitation separated by contributes to the net current (see blue and red arrows in Fig. 1a). When short and strong laser pulses are applied to a continuum of resonant states, intraband motion may become important and deviations from Eq. (1) can occur, which we will discuss later based on numerical simulations.
In the experiment, we focus two laser fields to the center of a 10 2 m2 graphene strip, a few-cycle fundamental and a frequency-doubled femtosecond laser field. The monolayer graphene is epitaxially grown on silicon carbide (4H-SiC) and connected to two electrodes Higuchi et al. (2017). The laser beam radii are m (1/ intensity) for both the and beams and, thus, the electrodes are hardly illuminated by the laser field. The sample is placed in vacuum ( hPa). Laser pulses from an 80-MHz-Ti:Sapphire laser oscillator with a center wavelength of 800 nm are frequency doubled using a beta barium borate (BBO) crystal. Both colors are separately controlled in a two-color interferometer and sent to the sample. This setup allows independent control of relative phase, intensity, polarization, and dispersion. The resulting pulse duration of fs (intensity full width at half maximum (FWHM)) for the fundamental is measured via spectral phase interferometry for direct electric-field reconstruction (SPIDER), while its second harmonic with a pulse duration of fs (17 fs Fourier limit) is determined via a cross-correlation frequency-resolved optical gating (XFROG). We note that both pulses do not spectrally overlap and, thus, optical interference between both pulses does not occur. We perform a lock-in measurement referenced to a periodic modulation of the temporal delay between both colors to isolate the relative phase-dependent current as given by Eq. (1). For further noise suppression, we apply post-processing filters to eliminate high-frequency noise and DC-like contributions, which may occur due to sample imperfections Sheridan et al. (2020).
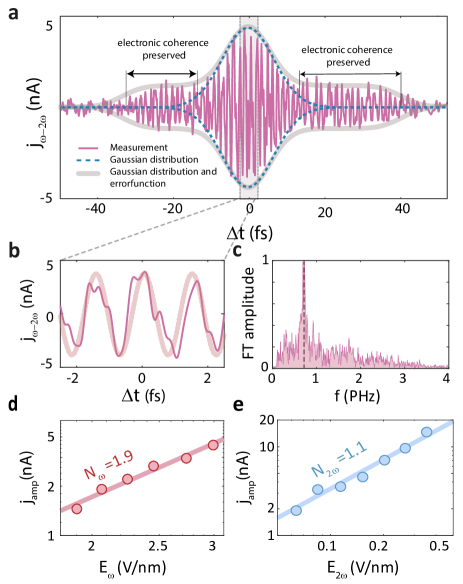
Figure 2a shows the phase-dependent current as a function of the temporal delay . The applied peak electric field strengths are V/nm and V/nm, resulting in a maximal + current of 5 nA. The central region of the overlap scan is magnified in Fig. 2b. Changing the temporal delay by a quarter period of the field, i.e., by fs, results in a fully symmetric two-color field and no current is measured. Delaying the two pulses by fs reverses the current direction. The amplitude of the Fourier transform over the entire phase-sensitive current signal, shown in Fig. 2c, exhibits a clear peak at THz (800 nm 375 THz), as also expected from Eq. (1). Additionally, we determine the scaling of the current amplitude as a function of E and E0, 2ω. We observe a power-law scaling of non-linearities of = 1.86 0.15 and = 1.09 0.10 for the variation of and , respectively (Figs. 2d, 2e), which also supports Eq. (1). Hence, the periodicity of the current modulation as a function of the delay and the power-law scaling corroborate the excitation scheme even in the presence of broadband excitation.
The entire signal shown in Fig. 2a consists of two regimes. The inner part resembles a Gaussian distribution with a width of 17 fs (FWHM, blue dashed line), and an asymmetric outer part with a broadening of the signal up to 32 fs for negative delay (2 arrives first) and 39 fs for positive delay ( arrives first). To obtain these numbers, we fit a Gaussian envelope with two error functions to the peaks of the oscillatory signal and so determine the envelope, shown as a gray line. Importantly, the signal outside the main overlap region (blue dashed line) is used in the following to determine the coherence time.
To understand the role of electronic coherence more quantitatively in the current generation process, we model the electron dynamics in graphene using a nearest-neighbor tight-binding model of graphene with minimal coupling of the laser field for the applied laser parameters Kelardeh et al. (2015); Higuchi et al. (2017); Li et al. (2021). The residual conduction band population is obtained by numerically integrating the time-dependent Schrödinger equation (TDSE). In the simulation, we use a carrier-envelope phase of zero for the fundamental to avoid current generation due to the low temporal symmetry of the fundamental pulse Higuchi et al. (2017). Thus, all currents obtained in the following are of two-color nature.
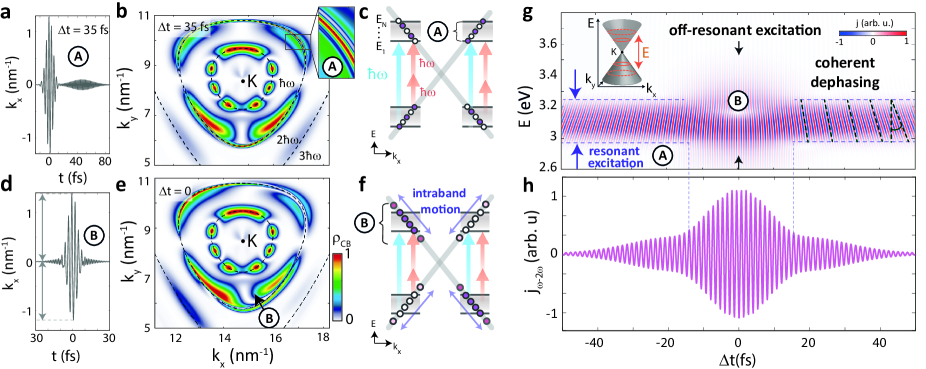
We discuss the simulation results of the delay-dependent current in two parts: (A), when both pulses do not temporally overlap, and (B), when both pulses do temporally overlap. These cases are marked with labels A and B throughout Fig. 3. In Fig. 3a (case A) both pulses are temporally separated by fs, and thus hardly overlap in time. Figure 3b shows the corresponding numerically obtained residual conduction band (CB) population around the K-point. In the spectral overlap region of the two colors, i.e, at the resonance line, is determined by the relative phase between the two absorption pathways (illustrated in Fig. 3c with the red and blue arrows). A population imbalance between k-states on the left and right side of the K-points results in a net current. For , all resonantly excited k-states experience the same spectral phase. Increasing introduces an additional spectral phase and, thus, a spectrally dependent phase at each k-point. As a result, the population distribution becomes modulated as a function of the spectral excitation energy, as shown in the numerical results (see the magnified area in Fig. 3b) and schematically illustrated in Fig. 3c with the filled and solid circles. Depending on the phase the interference at each single k-point is either constructive resulting in excitation or destructive, resulting in no excitation.
Before we discuss this further, we note that in case B, both pulses temporally overlap, as shown in Fig. 3d. Here, electrons experience asymmetric trajectories (intraband motion), resulting in additional symmetry breaking and off-resonant excitation (see Fig. 3a larger errors for and Fig. 3f). As a result, Fig. 3e reveals a strongly asymmetric resonant and off-resonant residual population distribution Wismer et al. (2016); Heide et al. (2021).
To understand how a residual current emerges, we first evaluate along constant energies between valence and conduction band (see inset of Fig.3 g, example orange rings around the K-point). The current at eV corresponds to the energy of one photon absorption of the pulse ( eV) and two-photon absorption of the pulse ( eV). In Fig. 3g we plot the current as function of energy for delays ranging from fs to fs. Finally, integration over all energies results in the total residual current (Fig. 3h). This current is maximized when both pulses are in temporal overlap and decreases as a function of delay.
Based on the simulation results we are now able to discuss the role of coherence, coherent dephasing, and off-resonant excitations to the delay-dependent current. When both pulses are temporally separated (case A) we see from Fig. 3 g that the two-color current originates from resonant excitation around 3.1 eV. Also in Fig. 3 g we see that the spectral phase introduced by the delay results in a shearing of the current modulation in the plot (see dashed lines). Importantly, it is this shearing that leads to a reduction of the total current after integration (Fig. 3h). This effect is known as coherent dephasing Haroche and Raimond (2006), originating from the spectrally dependent phase .
By contrast, when both pulses are in temporal overlap (region B), the current contributions are in phase and do not cancel out each other. Further, additional symmetry-breaking due to the phase-dependent two-color laser field results in off-resonant excitation, which increases the current amplitude. In the method section, we show a video of the temporal evolution of the conduction band population. The video shows most clearly that while in the overlap region B off-resonant excitation emerge. Yet, the main current contribution originates from the resonant excitation, which also matches the observed power-law scalings (Figs. 2 d and 2 e).
We note that for the applied laser parameters, i.e., 1 V/nm we are in a regime where the Rabi frequency becomes comparable to the driving frequency (or photon energy) and a Rabi cycle comparable to the pulse duration Higuchi et al. (2017); Heide et al. (2021). The first gives raise to non-perturbative excitation, as discussed in the previous section in case B. The second, when a Rabi cycle becomes comparable or shorter than the pulse duration or even an optical cycle, coherent depopulation and carrier-wave Rabi flopping may significantly influence the coherent signal. Both processes are naturally included in our TDSE model simulations. For an applied field strength of V/nm (as used in Fig. 2 a) and an excitation energy of eV we obtain a Rabi frequency at the peak of the electric field of 677 THz, corresponding to energy of 2.8 eV. So far we have not observed significant deviations from a perturbative power-law scaling, as shown in Fig. 2 d, but for higher electric fields strengths and longer laser pulses, we may expect that the coherent control enters the strong-field regime.
The good agreement between experiment (Fig. 2 a) and simulation (Fig. 3 h) allows us to argue that electronic coherence is preserved at least up to a delay of fs for the negative delay and fs for the positive delay. While the experiment cannot distinguish between coherent dephasing and decoherence caused by scattering, we can only determine a lower bound of the electronic coherence time of fs for the negative delay and fs for a positive delay, given by the error functions (black arrows in Fig. 2 a). Whereas the experiment shows a shorter coherence time when the pulse arrives first, the simulation shows a symmetric trace. One reason for this asymmetric behavior might be that for the first pulse (2) generates the population via one-photon absorption, which could lead to a higher total initial population. While the current amplitude, which is the result of interference, is only sensitive to the overlap of the two populations, a possible initial population-dependent decoherence time might break the symmetry Bigot et al. (1991). Further simulations accounting for the critical role of decoherence and scattering are required, which are beyond the scope of this work. To determine the decoherence time, we take the mean of both values and obtain fs.
By comparing this decoherence time with a reported thermalization time of 5080 fs, which involves multiple-scattering events, we find that the decoherence time is about 2-3 times shorter Breusing et al. (2011); Tielrooij et al. (2015); Gierz et al. (2013). Similarly, Auger processes and carrier multiplication can occur on a similar time scale Winzer et al. (2010); Brida et al. (2013). Subsequent electron cooling and phonon scattering are incoherent processes that occur on a time scale of 100 fs to ps Graham et al. (2013); Ulstrup et al. (2015) and thus are unlikely to be responsible for the loss of electron coherence.
The coherence time obtained from the photocurrent measurements reflects electronic coherence and coherent dephasing. While the latter reduces the current amplitude, it does not affect the electronic coherence. In coherent spectroscopy, such as in pulse echo experiments, these two dephasing channels are usually considered as , reflecting both natural -dephasing and dephasing caused by inhomogeneities in the ensemble Hahn (1950); Kurnit et al. (1964); Stern et al. (1990); Oshio and Feinberg (1991); Haroche and Raimond (2006). By introducing a frequency gradient to one of the pulses, can be corrected for coherent dephasing. A similar approach might be possible here, namely by shaping the spectral phase of one of the laser pulses to correct for coherent dephasing. In such a scenario, the observed phase shift of the current as a function of energy, shown in Fig. 3 g, can be nulled. Then, the photocurrent can directly be used to monitor electronic coherence Haroche and Raimond (2006).
In summary, we present a lower boundary for the electronic coherence time in graphene of fs. To observe it, we use quantum-path interference and the resulting current, generated by a two-color laser field as an observable. The ultrafast nature of the laser pulses employed and the ability to time delay them offer an ideal probe for monitoring this coherence. By shaping the spectral phase of the laser pulses we propose the possibility to disentangle decoherence and coherent dephasing in a similar manner as applied for pulse echo experiments. We expect this versatile and efficient method for measuring electronic coherence based on a purely electronic observable to find widespread use in vastly different systems and experimental configurations.
Acknowledgments
This work has been supported in part by the Deutsche Forschungsgemeinschaft (SFB 953 “Synthetic Carbon Allotropes”) and the PETACom project financed by Future and Emerging Technologies Open H2020 program. T. E. appreciates the support of the Friedrich Naumann Foundation for Freedom and the International Max Planck Research School Physics of Light. I.F. is supported by the National Science Foundation under Grant No. CHE-1553939.
References
- Bigot et al. (1991) J. Y. Bigot, M. T. Portella, R. W. Schoenlein, J. E. Cunningham, and C. V. Shank, “Two-dimensional carrier-carrier screening in a quantum well,” Physical Review Letters 67, 636–639 (1991).
- Krausz and Stockman (2014) Ferenc Krausz and Mark I. Stockman, “Attosecond metrology: from electron capture to future signal processing,” Nature Photonics 8, 205–213 (2014).
- Hohenleutner et al. (2015) M. Hohenleutner, F. Langer, O. Schubert, M. Knorr, U. Huttner, S. W. Koch, M. Kira, and R. Huber, “Real-time observation of interfering crystal electrons in high-harmonic generation,” Nature 523, 572–575 (2015).
- Cundiff (2016) Steven T. Cundiff, “Coherent spectroscopy of semiconductors,” Optics InfoBase Conference Papers 16, 4639–4664 (2016).
- Higuchi et al. (2017) Takuya Higuchi, Christian Heide, Konrad Ullmann, Heiko B. Weber, and Peter Hommelhoff, “Light-field-driven currents in graphene,” Nature 550, 224–228 (2017).
- Reutzel et al. (2019) Marcel Reutzel, Andi Li, and Hrvoje Petek, “Coherent Two-Dimensional Multiphoton Photoelectron Spectroscopy of Metal Surfaces,” Physical Review X 9, 011044 (2019).
- Maunz et al. (2007) P. Maunz, D. L. Moehring, S. Olmschenk, K. C. Younge, D. N. Matsukevich, and C. Monroe, “Quantum interference of photon pairs from two remote trapped atomic ions,” Nature Physics 3, 538–541 (2007).
- Koch and Shapiro (2012) Christiane P. Koch and Moshe Shapiro, “Coherent Control of Ultracold Photoassociation,” Chemical Reviews 112 (2012).
- Petek and Ogawa (1997) H. Petek and S. Ogawa, “Femtosecond time-resolved two-photon photoemission studies of electron dynamics in metals,” Progress in Surface Science 56, 239–310 (1997).
- Seiffert et al. (2017) L. Seiffert, Q. Liu, S. Zherebtsov, A. Trabattoni, P. Rupp, M. C. Castrovilli, M. Galli, F. Süßmann, K. Wintersperger, J. Stierle, G. Sansone, L. Poletto, F. Frassetto, I. Halfpap, V. Mondes, C. Graf, E. Rühl, F. Krausz, M. Nisoli, T. Fennel, F. Calegari, and M. F. Kling, “Attosecond chronoscopy of electron scattering in dielectric nanoparticles,” Nature Physics 13, 766–770 (2017).
- Reutzel et al. (2020) Marcel Reutzel, Andi Li, Zehua Wang, and Hrvoje Petek, “Coherent multidimensional photoelectron spectroscopy of ultrafast quasiparticle dressing by light,” Nature Communications 11, 1–5 (2020).
- Cundiff (1994) S. T. Cundiff, “Effects of correlation between inhomogeneously broadened transitions on quantum beats in transient four-wave mixing,” Physical Review A 49, 3114–3118 (1994).
- Atanasov et al. (1996) R Atanasov, A Haché, J L P Hughes, H M Van Driel, and J E Sipe, “Coherent Control of Photocurrent Generation in Bulk Semiconductors,” Physical Review Letters 76, 1703–1706 (1996).
- Haché et al. (1997) A. Haché, Y. Kostoulas, R. Atanasov, J. L.P. Hughes, J. E. Sipe, and Max Glasbeek, “Observation of coherently controlled photocurrent in unbiased, bulk GaAs,” Physical Review Letters 78, 306–309 (1997).
- Dupont et al. (1995) E. Dupont, P. B. Corkum, H. C. Liu, M. Buchanan, and Z. R. Wasilewski, “Phase-controlled currents in semiconductors,” Physical Review Letters 74, 3596–3599 (1995).
- Fortier et al. (2004) T. M. Fortier, P. A. Roos, D. J. Jones, S. T. Cundiff, R. D. R Bhat, and J. E. Sipe, “Carrier-envelope phase-controlled quantum interference of injected photocurrents in semiconductors,” Physical Review Letters 92, 147403 (2004).
- Sun et al. (2010) Dong Sun, Charles Divin, Julien Rioux, John E. Sipe, Claire Berger, Walt A. De Heer, Phillip N. First, and Theodore B. Norris, “Coherent control of ballistic photocurrents in multilayer epitaxial graphene using quantum interference,” Nano Letters 10, 1293–1296 (2010).
- Sun et al. (2012) Dong Sun, Charles Divin, Momchil Mihnev, Torben Winzer, Ermin Malic, Andreas Knorr, John E Sipe, Claire Berger, Walt A de Heer, Phillip N First, and Theodore B Norris, “Current relaxation due to hot carrier scattering in graphene,” New Journal of Physics 14, 105012 (2012).
- Armstrong et al. (1962) J. A. Armstrong, N. Bloembergen, J. Ducuing, and P. S. Pershan, “Interactions between light waves in a nonlinear dielectric,” Physical Review 127, 1918–1939 (1962).
- Garzón-Ramírez and Franco (2018) Antonio J. Garzón-Ramírez and Ignacio Franco, “Stark control of electrons across interfaces,” Physical Review B 98, 121305(R) (2018).
- Grzón-Ramírez and Franco (2020) Antonio J Grzón-Ramírez and Ignacio Franco, “Symmetry breaking in the Stark Control of Electrons at Interfaces ( SCELI ),” The Journal of Chemical Physics 153, 044704 (2020).
- Blanchet et al. (1997) Valérie Blanchet, Céline Nicole, Mohamed Aziz Bouchene, and Bertrand Girard, “Temporal coherent control in two-photon transitions: From optical interferences to quantum interferences,” Physical Review Letters 78, 2716–2719 (1997).
- Franco and Brumer (2008) Ignacio Franco and Paul Brumer, “Minimum requirements for laser-induced symmetry breaking in quantum and classical mechanics,” Journal of Physics B: Atomic, Molecular and Optical Physics 41, 074003 (2008).
- Wismer et al. (2016) Michael S. Wismer, Stanislav Yu Kruchinin, Marcelo Ciappina, Mark I. Stockman, and Vladislav S. Yakovlev, “Strong-Field Resonant Dynamics in Semiconductors,” Physical Review Letters 116, 197401 (2016).
- Chizhova et al. (2016) Larisa A Chizhova, Florian Libisch, and Joachim Burgdörfer, “Nonlinear response of graphene to a few-cycle terahertz laser pulse: Role of doping and disorder,” Physical Review B 94, 075412 (2016).
- Sato et al. (2018) Shunsuke A. Sato, Matteo Lucchini, Mikhail Volkov, Fabian Schlaepfer, Lukas Gallmann, Ursula Keller, and Angel Rubio, “Role of intraband transitions in photocarrier generation,” Physical Review B 98, 035202 (2018).
- Shapiro and Paul (2012) Moshe Shapiro and Brumer Paul, Quantum control of molecular processes (John Wiley & Sons, 2012).
- Gu and Franco (2017) Bing Gu and Ignacio Franco, “Quantifying Early Time Quantum Decoherence Dynamics through Fluctuations,” Journal of Physical Chemistry Letters 8, 4289–4294 (2017).
- Hu et al. (2018) Wenxiang Hu, Bing Gu, and Ignacio Franco, “Lessons on electronic decoherence in molecules from exact modeling,” Journal of Chemical Physics 148, 1–11 (2018).
- Cassette et al. (2015) Elsa Cassette, Ryan D. Pensack, Benoît Mahler, and Gregory D. Scholes, “Room-temperature exciton coherence and dephasing in two-dimensional nanostructures,” Nature Communications 6, 6086 (2015).
- Kraus et al. (2018) Peter M. Kraus, Michael Zürch, Scott K. Cushing, Daniel M. Neumark, and Stephen R. Leone, “The ultrafast X-ray spectroscopic revolution in chemical dynamics,” Nature Reviews Chemistry 2, 82–94 (2018).
- Geneaux et al. (2019) Romain Geneaux, Hugo J.B. Marroux, Alexander Guggenmos, Daniel M. Neumark, and Stephen R. Leone, “Transient absorption spectroscopy using high harmonic generation: A review of ultrafast X-ray dynamics in molecules and solids,” Philosophical Transactions of the Royal Society A: Mathematical, Physical and Engineering Sciences 377, 2145 (2019).
- Sheridan et al. (2020) Erin Sheridan, Lu Chen, Jianan Li, Qing Guo, Shan Hao, Muqing Yu, Ki Tae Eom, Hyungwoo Lee, Jung Woo Lee, Chang Beom Eom, Patrick Irvin, and Jeremy Levy, “Gate-Tunable Optical Nonlinearities and Extinction in Graphene/LaAlO3/SrTiO3Nanostructures,” Nano Letters 20, 6966–6973 (2020).
- Kelardeh et al. (2015) Hamed Koochaki Kelardeh, Vadym Apalkov, and Mark I. Stockman, “Graphene in ultrafast and superstrong laser fields,” Physical Review B 91, 045439 (2015).
- Li et al. (2021) Q. Z. Li, P. Elliott, J. K. Dewhurst, S. Sharma, and S. Shallcross, “Ab initio study of ultrafast charge dynamics in graphene,” Physical Review B 103, L081102 (2021).
- Heide et al. (2021) Chrisitan Heide, Tobias Boolakee, Takuya Higuchi, and Peter Hommelhoff, “Adiabaticity parameters for the categorization of light-matter interaction – from weak to strong driving,” (2021), arXiv:2104.10112 .
- Haroche and Raimond (2006) Serge Haroche and J-M. Raimond, Exploring the Quantum: Atoms, Cavities, and Photons (Oxford University Press, Oxford, 2006) pp. 0–3.
- Breusing et al. (2011) M. Breusing, S. Kuehn, T. Winzer, E. Malić, F. Milde, N. Severin, J. P. Rabe, C. Ropers, A. Knorr, and T. Elsaesser, “Ultrafast nonequilibrium carrier dynamics in a single graphene layer,” Physical Review B - Condensed Matter and Materials Physics 83, 153410 (2011).
- Tielrooij et al. (2015) K. J. Tielrooij, L. Piatkowski, M. Massicotte, A. Woessner, Q. Ma, Y. Lee, K. S. Myhro, C. N. Lau, P. Jarillo-Herrero, N. F. Van Hulst, and F. H.L. Koppens, “Generation of photovoltage in graphene on a femtosecond timescale through efficient carrier heating,” Nature Nanotechnology 10, 437–443 (2015).
- Gierz et al. (2013) Isabella Gierz, Jesse C. Petersen, Matteo Mitrano, Cephise Cacho, I. C.Edmond Turcu, Emma Springate, Alexander Stöhr, Axel Köhler, Ulrich Starke, and Andrea Cavalleri, “Snapshots of non-equilibrium Dirac carrier distributions in graphene,” Nature Materials 12, 1119–1124 (2013).
- Winzer et al. (2010) Torben Winzer, Andreas Knorr, and Ermin Malic, “Carrier multiplication in graphene,” Nano Letters 10, 4839–4843 (2010).
- Brida et al. (2013) D. Brida, A. Tomadin, C. Manzoni, Y. J. Kim, A. Lombardo, S. Milana, R. R. Nair, K. S. Novoselov, A. C. Ferrari, G. Cerullo, and M. Polini, “Ultrafast collinear scattering and carrier multiplication in graphene,” Nature Communications 4, 1–9 (2013), arXiv:1209.5729 .
- Graham et al. (2013) Matt W. Graham, Su Fei Shi, Daniel C. Ralph, Jiwoong Park, and Paul L. McEuen, “Photocurrent measurements of supercollision cooling in graphene,” Nature Physics 9, 103–108 (2013), arXiv:1207.1249 .
- Ulstrup et al. (2015) Søren Ulstrup, Jens Christian Johannsen, Alberto Crepaldi, Federico Cilento, Michele Zacchigna, Cephise Cacho, Richard T Chapman, Emma Springate, Felix Fromm, Christian Raidel, Thomas Seyller, Fulvio Parmigiani, Marco Grioni, and Philip Hofmann, “Ultrafast electron dynamics in epitaxial graphene investigated with time- and angle-resolved photoemission spectroscopy,” Journal of Physics: Condensed Matter 27, 164206 (2015).
- Hahn (1950) E. L. Hahn, “Spin echoes,” Physical Review 80, 580–594 (1950).
- Kurnit et al. (1964) N. A. Kurnit, I. D. Abella, and S. R. Hartmann, “Observation of a photon echo,” Physical Review Letters 13, 567–568 (1964).
- Stern et al. (1990) Ady Stern, Yakir Aharonov, and Yoseph Imry, “Phase uncertainty and loss of interference: A general picture,” Physical Review A 41, 3436–3448 (1990).
- Oshio and Feinberg (1991) Koichi Oshio and David A. Feinberg, Magnetic Resonance in Medicine, Tech. Rep. 344-349 (1991).