The IBISCO survey
We present the analysis of the ALMA CO(2-1) emission line and the underlying 1.2 mm continuum of Mrk509 with spatial resolution of 270 pc. This local Seyfert 1.5 galaxy, optically classified as a spheroid, is known to host a ionised disc, a starburst ring, and ionised gas winds on both nuclear (Ultra Fast Outflows) and galactic scales. From CO(2-1) we estimate a molecular gas reservoir of , located within a disc of size 5.2 kpc, with = (2.01.1) inclined at deg. The molecular gas fraction within the disc is , consistent with that of local star-forming galaxies with similar stellar mass. The gas kinematics in the nuclear region within r700 pc, that is only marginally resolved at the current angular resolution, suggests the presence of a warped nuclear disc. Both the presence of a molecular disc with ongoing star-formation in a starburst ring, and the signatures of a minor merger, are in agreement with the scenario where galaxy mergers produce gas destabilization, feeding both star-formation and AGN activity. The spatially-resolved Toomre Q-parameter across the molecular disc is in the range , and shows that the disc is marginally unstable across the starburst ring, and stable against fragmentation at nucleus and in a lopsided ring-like structure located inside of the starburst ring. We find complex molecular gas kinematics and significant kinematics perturbations at two locations, one within 300 pc from the nucleus, and one 1.4 kpc away close to the region with high , that we interpret as molecular winds with velocity . The total molecular outflow rate is in the range 6.4 - 17.0 , for the optically thin and thick cases, respectively. The molecular wind total kinetic energy is consistent with a multiphase momentum-conserving wind driven by the AGN with in the range 0.06-0.5 . The spatial overlap of the inner molecular wind with the ionised wind, and their similar velocity suggest a cooling sequence within a multiphase wind driven by the AGN. The second outer molecular wind component overlaps with the starburst ring, and its energy is consistent with a SN-driven wind arising from the starburst ring.
Key Words.:
galaxies: active - galaxies: ISM - galaxies: kinematics and dynamics - galaxies: Seyfert - techniques: interferometric1 Introduction
Understanding the relation between the Feedback from accreting super-massive black holes (SMBHs) and the interstellar medium (ISM) of their host galaxies is still an open issue. Host bulge properties such as velocity dispersion, luminosity and mass are tightly correlated with the mass of the SMBHs in the galactic center as shown by past seminal works (Gebhardt et al. 2000; Ferrarese & Ford 2005; Kormendy & Ho 2013; Shankar et al. 2016, 2017). The gas in the galactic bulge inflows toward the nucleus and gives rise to the growth of central SMBH through the active luminous phase of the Active Galactic Nuclei (AGN) (Fabian 2012; King & Pounds 2015). During their active phases, AGN can generate winds that interact with galaxy ISM, potentially altering both the star formation process and the nuclear gas accretion. When the black hole reaches a critical mass the AGN driven winds, the nuclear activity and the SMBH growth are stopped giving rise to the SMBH - host bulge properties relations (Silk & Rees 1998; Fabian 1999; King 2003).
Outflows are ubiquitous in both luminous AGN and in local Seyfert galaxies, and occur on a wide range of physical scales, from highly-ionised semi-relativistic winds and jets in the nuclear region at sub-parsecs scales, out to galactic scale outflows seen in mildly ionised, molecular and neutral gas (Morganti et al. 2016; Fiore et al. 2017; Fluetsch et al. 2019; Lutz et al. 2020; Veilleux et al. 2020, and references therein). In some cases molecular and ionised winds have similar velocities and are nearly co-spatial, suggesting a cooling sequence scenario where molecular gas forms from the cooling of the gas in the ionised wind (Richings & Faucher-Giguere 2017; Menci et al. 2019). Other AGNs show ionised winds that are faster than the molecular ones, suggesting a different origin of the two phases (Veilleux et al. 2020, and references therein).
The molecular phase is a crucial element of the feeding and feedback cycle of AGN because it constitutes the bulk of the total gas mass and it is the site of star formation activity. On galactic scales, massive molecular winds are common in local Seyfert galaxies (e.g. Feruglio et al. 2010; Cicone et al. 2014; Dasyra et al. 2014; Morganti et al. 2015; García-Burillo et al. 2014, 2017, 2019), these winds likely suppress star formation (i.e. negative feedback) as they reduce the molecular gas reservoir by heating or expelling gas from the host-galaxy ISM. In late type AGN-host galaxies, the gas kinematics appears complex at all scales, showing several components such as bars, rings, and (warped) discs, with high velocity dispersion regions (e.g. Shimizu et al. 2019; Feruglio et al. 2020; Fernández-Ontiveros et al. 2020; Alonso-Herrero et al. 2020; Aalto et al. 2020; Audibert et al. 2020).
Accurate dynamical modeling of the molecular gas kinematics reveals kinematically-decoupled nuclear structures, high velocity dispersion at nuclei, trailing spirals, evidences of inflows and AGN-driven outflows. (e.g. Combes et al. 2019a; Combes 2019b, 2020).
The outflows driving mechanism (wind shock, radiation pressure or jet), their multiphase nature and their relative weights and impact on the galaxy ISM are still open problems (Faucher-Giguère & Quataert 2012; Zubovas & King 2012; Richings & Faucher-Giguere 2017; Menci et al. 2019; Ishibashi et al. 2021).
So far different outflow phases have been observed only for a handful of sources. Atomic, cold and warm molecular outflows have been observed in radio galaxies (e.g. Morganti et al. 2007; Dasyra & Combes 2012; Dasyra et al. 2014; Tadhunter et al. 2014; Oosterloo et al. 2017).
The nuclear semi-relativistic phase and the galaxy scale molecular phase have been observed simultaneously in less than a dozen sources, with varied results: in some cases data suggest energy driven flows (Feruglio et al. 2015; Tombesi et al. 2015; Longinotti et al. 2018; Smith et al. 2019), in other cases data suggest momentum driven flows (e.g. García-Burillo et al. 2014; Feruglio et al. 2017; Fluetsch et al. 2019; Bischetti et al. 2019; Marasco et al. 2020).
Fiore et al. (2017), using a compilation of local and high redshift winds, showed that there is a broad distribution of the momentum boost, suggesting that both energy and momentum-conserving expansion may occur. Enlarging the sample of local AGN-host galaxies with outflows detected in different gas phases is important to understand the nature and driving mechanisms of galaxy-scale outflows.
In this paper we present a study of Markarian 509 (Mrk 509) based on ALMA observations.
Mrk 509 is a Seyfert 1.5 galaxy located at D 142.9 Mpc (z = 0.034397, Huchra et al. 1993) implying a physical scale of 0.689 kpc/arcsec, and hosts an AGN with (Shinozaki et al. 2006), a bolometric luminosity of (Duras et al. 2020), and a black hole with mass (Bentz et al. 2009).
The AGN is hosted by a medium size galaxy resembling a bulge in optical imaging (Ho & Kim 2014), but hosting both an ionized gas disc and a starburst ring (Phillips et al. 1983; Kriss et al. 2011; Fischer et al. 2015), where star formation is currently ongoing (, Gruppioni et al. 2016).
Mrk 509 is a complex system showing evidence of both an ongoing minor merger and multiphase gas winds. The minor merger with a gas-rich dwarf is suggested by an ionised gas linear tail (Fischer et al. 2013, 2015), whereas Liu et al. (2015) found evidence of a [OIII] quasi-spherical wind powered by the AGN in the inner kpc region, with velocity 290 km/s and mass outflow rate = 5 . The ionised wind appears spatially anti-correlated with the emission, suggesting suppression of star formation in this region.
Gas kinematics suggests that the ionised wind is physically unrelated to the linear tail, and their apparent overlap is due to projection effects only (Liu et al. 2015).
On nuclear scales, highly ionised semi-relativistic gas winds are detected with velocity v 0.15-0.2c and outflow rates in the range 0.005-0.05 (Dadina et al. 2005; Cappi et al. 2009; Tombesi et al. 2011, 2012; Detmers et al. 2011).
Simultaneous Chandra and Hubble Space Telescope with the Cosmic Origins Spectrograph (HST-COS) observations showed that the wind detected through UV absorption lines is located within pc from the active nucleus, and that X-ray warm absorbers and UV absorbers are related (Ebrero et al. 2011; Kriss et al. 2019).
Given the widespread evidence of winds from nuclear to kpc scales and in different gas phases (Phillips et al. 1983; Kriss et al. 2011; Tombesi et al. 2011, 2012; Liu et al. 2015), Mrk 509 is an optimal candidate to investigate the wind driving mechanisms, stellar feedback versus AGN feedback, and their impact on the host-galaxy ISM.
In this paper, we exploit
ALMA data of Mrk509 to trace the distribution and kinematics of cold molecular gas and to look for evidences of molecular winds.
The CO(2-1) and underlying continuum observations examined here are part of the ALMA survey of the IBISCO sample.
The IBISCO sample is drawn from the INTEGRAL (International Gamma-Ray Astrophysics Laboratory) IBIS (Imager on Board INTEGRAL Spacecraft) catalog of hard X-ray (20-100 keV) selected AGN (Malizia et al. 2012). The IBISCO sample is selected to have z0.05, AGN bolometric luminosity , and accurate black hole mass measurements. Being hard X-ray selected, the IBISCO sample is unbiased against nuclear obscuration, similarly to BASS, the BAT AGN Spectroscopic Survey (Koss et al. 2017, 2020).
The ALMA survey of IBISCO is aimed at obtaining a reliable overview of the cold gas kinematics in the central kpc of the AGN host galaxies with angular resolutions in the range 100-200 pc.
The paper is organized as follows. Section 2 presents the ALMA observational setup and data reduction. Section 3 presents the observational results, in particular the continuum emission, the gas properties and the CO kinematics. Section 4 describes the dynamical modeling, section 5 the properties of the molecular wind. In Section 6 we discuss our results and in section 7 we show our conclusions and future perspectives.
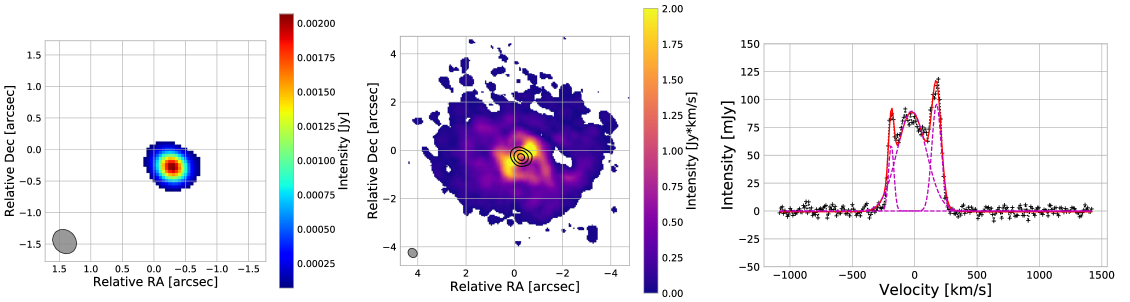
has been applied. Black contours show the 1.2 mm continuum emission at (5,30,100). The synthesized beam is reported bottom left corner. Right panel: CO(2-1) spectrum (black crosses) extracted from the continuum-subtracted clean data-cube from the regions where emission is above 3. The solid red shows the multi-gaussian fit, the three gaussian components are shown using magenta lines.
2 Observations and data reduction
Mrk 509 was observed with ALMA (program ID 2017.1.01439.S) during cycle 5 on September 2018 for a total integration time of 75 minutes in the frequency range 221.8-223.7 GHz (band 6), which covers the CO(2-1) line (observed redshifted frequency of 222.9 GHz) and the underlying 1.2 mm continuum. The obervations were conducted with the 12 m array in the
C43-5 configuration with 44 antennas, minimum baseline of 14.6 m and maximum baseline of 1397.9 m. This provided us an angular resolution of about 0.4 arcsec and a largest angular scale of 4.6 arcsec.
We used CASA 5.4.1 software (McMullin et al. 2007) to produce a set of calibrated visibilities and to generate clean data-cubes. We calibrated the visibilities in the pipeline mode and using the default calibrators provided by the observatory: bandpass and flux calibrators J2148+0657 and J2000-1748, J2025-0735 phase/amplitude calibrator. The absolute flux accuracy is better than 10. To estimate the rest-frame 1.2 mm continuum emission we averaged the visibilities in the four spectral windows, excluding the spectral range covered by the CO(2-1) emission line. To estimate the continuum emission underlying the CO(2-1) line, we modeled the visibilities in the spectral window (spw) containing the emission line with the uvcontsub task, adopting a first order polynomial. We verified that using a zero order polynomial did not affect the results. We subtracted the continuum from the global visibilities and created the continuum-subtracted CO(2-1) visibility table. We imaged CO(2-1) and continuum using the tclean task by adopting a natural weighting scheme, and produced a clean cube by using the hogbom cleaning algorithm with a detection threshold of 3 times the r.m.s. noise, a pixel size of 0.05 arcsec and a spectral resolution of 10.6 km/s. With this procedure we obtained a clean map of the continuum with a synthesized beam of 0.396 0.343 at PA = 51 deg, which corresponds to a spatial resolution of 285 244 . The resulting r.m.s. noise in the clean continuum map is 0.014 mJy/beam in the aggregated bandwidth. From the continuum-subtracted CO(2-1) visibilities we produced a clean data-cube with a beam size of 0.412 0.353 at a PA = 48 deg and a r.m.s. noise of 0.38 mJy/beam for a channel width of 10.6 km/s.
3 Results
Figure 1, left panel, shows the 1.2 mm continuum map. The peak position of the continuum flux density map, obtained through 2D fitting in the image plane with CASA, is consistent with the AGN position reported by NED (NASA/IPAC Extragalactic Database, https://ned.ipac.caltech.edu). We measure a continuum flux density mJy, and a flux at the peak position mJy/beam. According to our 2D fit the continuum emission is consistent with an unresolved source.
| FWHM [km/s] | [mJy] | Velocity [km/s] |
|---|---|---|
| (1) | (2) | (3) |
| 21.60 0.03 | 59.4 0.1 | -187.71 0.03 |
| 116.82 0.08 | 89.5 0.3 | -23.56 0.05 |
| 37.63 0.02 | 96.2 0.1 | 175.39 0.02 |
Figure 1, central panel, shows that the CO(2-1) surface brightness (moment 0 map) is distributed over a region of approximately 8 arcsec, that is 5.5 kpc, and, in the inner 1.4 kpc region, shows an elongated shape along the north-west to south-east direction, crossing the AGN position. A CO-depleted region, that is a region with a CO(2-1) surface brightness lower than neighbouring regions, is detected located at 1.4 kpc west-ward to the AGN.
The CO(2-1) spectrum (Fig. 1, right panel), extracted from the clean data-cube in the region defined by a mask with 3 threshold, shows a multiple peak profile reminiscent of disc-like kinematics. We fitted the emission line with a combination of three Gaussian profiles whose parameters are reported in the Table 1. From the best-fit we measured an integrated flux density of over a line width of 180 km/s. We then derived the CO(2-1) luminosity using the relation of Solomon & Vanden Bout (2005).
To estimate the proper conversion factor , we use the stellar mass and the conversion function by Accurso et al. (2017).
The is derived from broad-band spectral energy distribution (SED) decomposition including the emission of stars, dust heated by SF and AGN dusty torus (Gruppioni et al. 2016). We report in Appendix A details on the SED fitting. We derive a total stellar mass of , and a .
Using this, we derive a molecular gas mass within a region of kpc diameter.
For the CO-depleted region we derived a upper limit molecular gas mass assuming the same conversion factor.
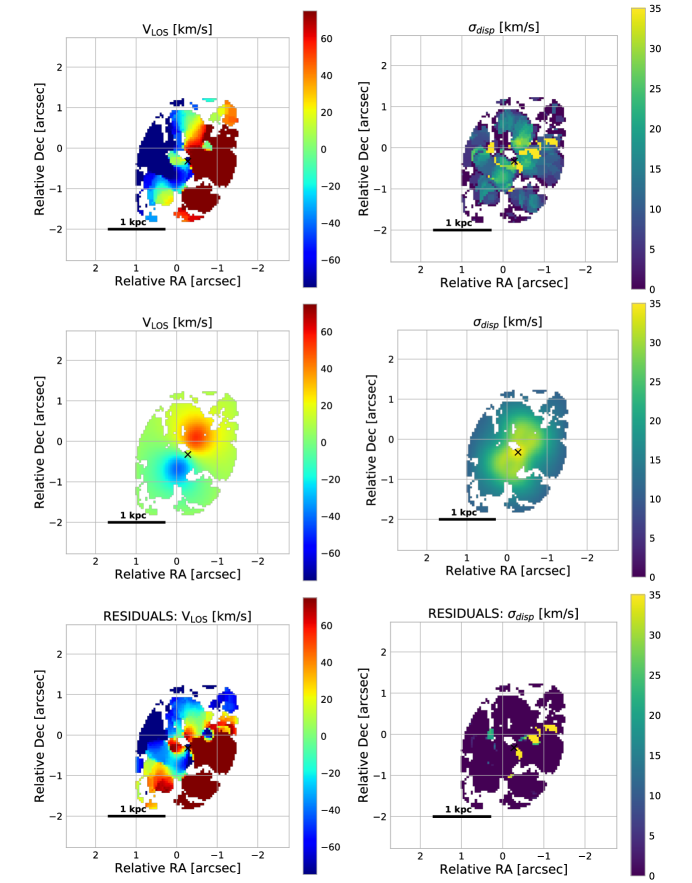
The mean-velocity map (moment 1 map, Fig. 2 top-left panel) shows a gradient oriented north-east to south-west along a position angle (PA) of 250 deg, with range from -200 to 200 km/s, which likely indicates an inclined rotating disc (PA in degrees is measured anti-clockwise from North).
Figure 2 (top-right panel) shows the CO(2-1) velocity dispersion (moment 2 map), , with values of 10-20 km/s in the outer regions. In the inner 1.4 1.4 (corresponding to 22 ), has a butterfly-shaped morphology with a = 80 km/s towards the central beam, where beam-smearing effects can boost the (e.g Davies et al. 2011). A more reliable estimate of the real in the nuclear region is 50-60 km/s, as measured in an annulus with 0.3 ¡ R ¡ 0.6 arcsec. We detect a region with enhanced = 30-40 km/s located south of the CO-depleted region, suggesting that also at this location dynamic perturbations are likely present.
4 Molecular Discs
Based on the moment maps we build a dynamical model of the system using (”3D-Based Analysis of Rotating Objects from Line Observations”, Di Teodoro & Fraternali 2015).
Any deviation from a rotating disc kinematics can then be identified by comparing the disc dynamical model with the observed data,
through the residual data-cube, that is obtained by subtracting the model from the observed data-cube.
We fitted a 3D tilted-ring model to the emission line data-cube to provide a first order dynamical model of the CO-emitting gaseous disc. In the first run, we allowed four parameters to vary: rotation velocity, velocity dispersion, the disc inclination and position angle. We fixed the kinematic center to the 1.2 mm continuum position (Sec. 3).
We then run the model again fixing the inclination, so only PA, rotation velocity and velocity dispersion are allowed to vary. The inclination from the minor/major axis ratio from UV imaging (GALEX archive) is deg, and we fix it to 44 deg in the model.
The first run produces residuals of amplitude about 5% in the moment 0 map, that further increase by adding a radial velocity component. The second run, with fixed inclination, produces residuals of amplitude about 2%, therefore we adopt the latter as best-fit disc model.
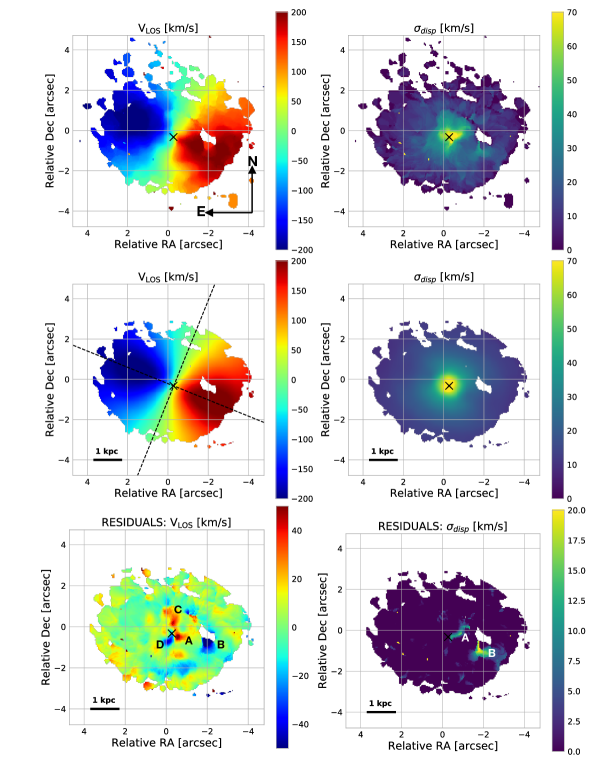
The disc model has a position angle PA = deg, a that ranges from -200 to 200 km/s and a velocity dispersion that decreases from 70 km/s in the inner region to 10 km/s in the outer part of the disc (Fig. 2, central panels).
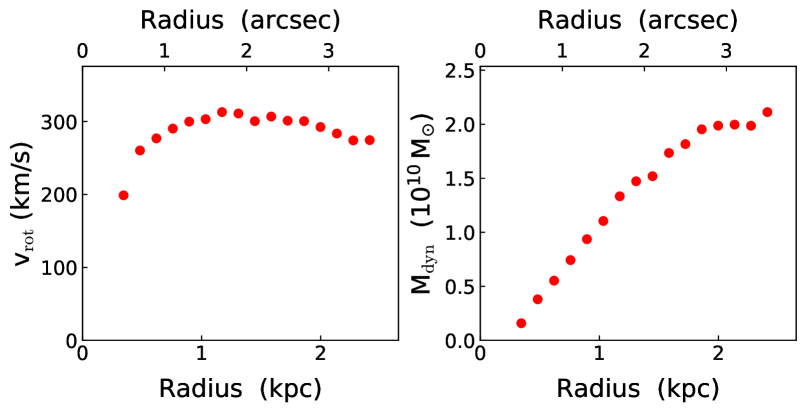
Fig.3 shows the rotation velocity (left panel), of the best fit disc model, and the virial dynamical mass (right panel) as a function of the radius out to 2.5 kpc.
The rotation velocity shows a maximum value of 300 km/s and the dynamical mass enclosed within the maximum radius is .
We computed the residual velocity and velocity dispersion maps by subtracting the disc model from the data (Fig. 2, bottom panels). Residual maps indicate that the model nicely describes the observed large-scale velocity gradient, from r1 arcsec to the outer boundary. Dynamical perturbations are detected in the residual velocity map (Fig. 2, bottom left panel) at positions A, C (redshifted), and B, D (blueshifted). In the velocity dispersion residual map (Fig. 2, bottom right panel), residuals are present only at positions A and B.
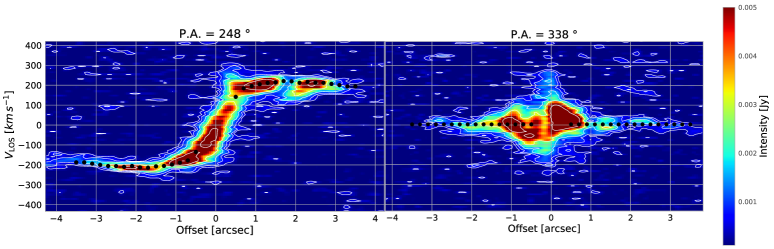
The position-velocity (PV) plots shown in Fig. 4 capture the main kinematics components seen in the moment maps and in the residual maps (Fig.2). The slices are taken through the continuum peak position, using a slit 0.45 arcsec wide (i.e. approximately the FWHM size of the synthetic beam major axis).
The PV diagram along the kinematic major axis (PA=248 deg) shows kinematic perturbations at offset 0.5 arcsec with 250 km/s (A), and at offset 2 arcsec with 150 km/s (B), on top of the typical disc rotation pattern.
The PV diagram along the kinematic mainor axis (PA = 338 deg) shows both blue-shifted and red-shifted non-rotational motions with velocities that reach 300 km/s and km/s in the inner 0.5 arcsec region (C,D).
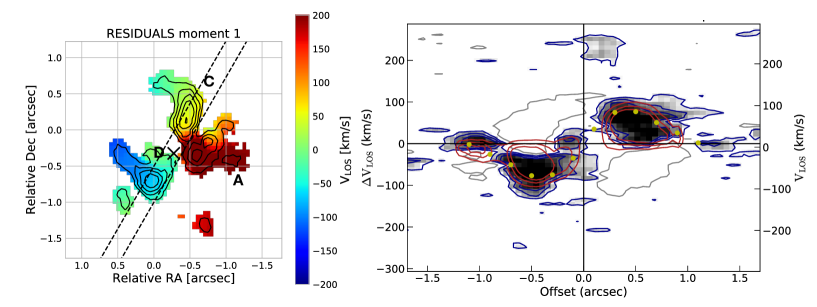
The perturbations C and D suggest the presence of a warped disc or bar. The nuclear region is barely resolved at the current angular resolution. Here we attempt to model it with a nuclear disc, as detailed in Appendix B. The modeling with a disc of inclination fixed to 66 deg and PA fixed to 330 deg, i.e. along the two brightest emission regions in the residual intensity map (C and D, black contours in Fig. 5 left panel), is able to account for and nicely model the residual emission (Fig. 5, right panel, and Fig. 6, top panel), suggesting the presence of a nuclear warped disc. We note that observations with higher angular resolution would be required to better assess the kinematic properties in this region. The modeling of the nuclear region does not impact the analysis of the molecular wind presented in the next Section.
5 Molecular Wind
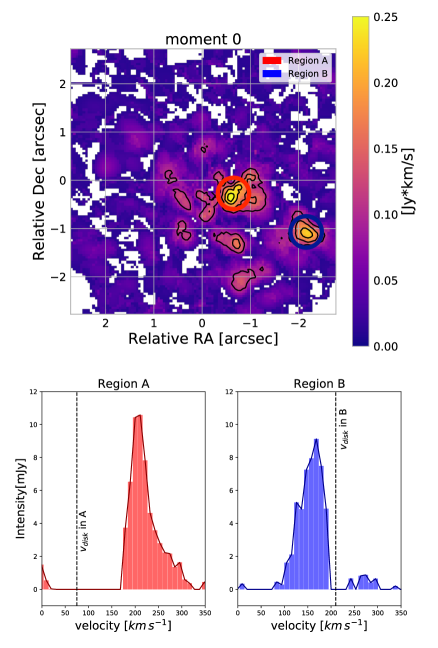
Regions A and B show residuals both in the velocity and in the velocity dispersion maps. Fig. 6, top panel, shows the intensity map of the residuals. The spectra extracted from A and B are shown in Fig. 6, bottom panels. The gas in region A has a peak velocity of 220 km/s, and a red tail reaching 300 km/s, whereas the gas in B is characterized by a peak velocity of about 170 km/s. We note that the disc rotational velocity at A and B is 70 and 210 km/s (dashed lines), respectively, thus showing that gas in these regions is not participating to the disc rotation, but it can be rather associated to a wind. The wind mass outflow rate is computed using the relation from Fiore et al. (2017), assuming a spherical sector:
| (1) |
where is the wind velocity, the velocity enclosing 98 of the cumulative velocity distribution of the outflowing gas (Bischetti et al. 2019), is the wind molecular mass, and is distance from the active nucleus reached by the wind. Table 2 gives , and for regions A and B. Because we do not know a-priori whether the gas in the wind is optically thin or thick, we derived the molecular mass range in A and B adopting a conversion factor for the optically thin (Morganti et al. 2015; Dasyra et al. 2016), and (Bolatto et al. 2013; Morganti et al. 2015) for the optically thick case. These assumptions imply wind masses in the ranges and , thus a molecular outflow rate in the range and for region A and B respectively. The lowest boundaries are pertinent to optically thin gas and thus represent lower limits to the molecular mass and outflow rate. These estimates are derived assuming AGN-driven winds because is the distance from the AGN. Should
We evaluated the escape velocity at A and B using the relation
| (2) |
where we used the dynamical mass derived from the best fit disc model (Fig. 3, right panel). We find that 140 km/s at A, that is significantly smaller than the wind velocity, suggesting that the outflowing gas can leave the innermost 300 pc region. The escape velocity at B is 227 km/s, similar to wind B velocity. Computing the time needed for the gas to travel from the center to the wind position and assuming a constant velocity equal to , we obtain 1.16 Myr to reach A, and 6.85 Myr to reach B. Therefore these two outflowing gas components might represent two consecutive episodes of winds launched at different times, or the same event with a decelerating wind (e.g. Fischer et al. 2013; Veilleux et al. 2020). Current data cannot discriminate between these two scenarios.

| Region | ||||||||
|---|---|---|---|---|---|---|---|---|
| [km/s] | [kpc] | [] | [] | [] | [ erg/s] | [km/s] | ||
| (1) | (2) | (3) | (4) | (5) | (6) | (7) | (8) | |
| A | 250 | 0.3 | 0.51 | 2.1-5.6 | 5.5-14.7 | 11-30 | 0.5 0.2 | 140 |
| B | 200 | 1.4 | 0.49 | 2.0-5.4 | 0.86-2.30 | 1.1-2.9 | 0.06 0.03 | 227 |
6 Discussion
Mrk509 is classified as a spheroid based on optical imaging (Ho & Kim 2014), and it hosts a ionised gas ring and disc, where star formation is currently active (Kriss et al. 2011; Fischer et al. 2015).
With its SFR of and the stellar mass of (Gruppioni et al. 2016, Appendix A), it sits on the Main Sequence of star-forming galaxies. Our observations show that Mrk509 hosts a molecular gas reservoir of within 5.2 kpc.
The stellar mass within the same region has been derived by scaling the total stellar mass assuming an exponential profile and the size of the galaxy in K band (33 kpc, NED). It turns out .
The molecular gas fraction , in the inner kpc, is then , consistent with that derived for local star-forming galaxies with the same stellar mass (e.g. Saintonge et al. 2011, 2017).
We find that the CO(2-1) moment 1 map shows a velocity gradient consistent with a inclined rotating disc with inclination consistent with that derived from UV imaging of the host galaxy. The derived dynamical mass is = (2.0 1.1) within a 2.6 kpc radius. The uncertainty is dominated by the uncertainty on the inclination. The dynamical mass is thus consistent with the .
Our dynamical modeling also suggests a possible warp in the disc towards the center, as reported by Combes (2020) in other nearby Seyfert galaxies. This nuclear region, however, remains marginally resolved in current observations, and we cannot exclude more complex structures, such as bars or rings.
The molecular disc kinematics and inclination are consistent with those reported for the ionised gas phase by Fischer et al. (2015) and Liu et al. (2015), who mapped the ionised disc on scales of up to 4 kpc, see Fig. 6 in Liu et al. (2015).
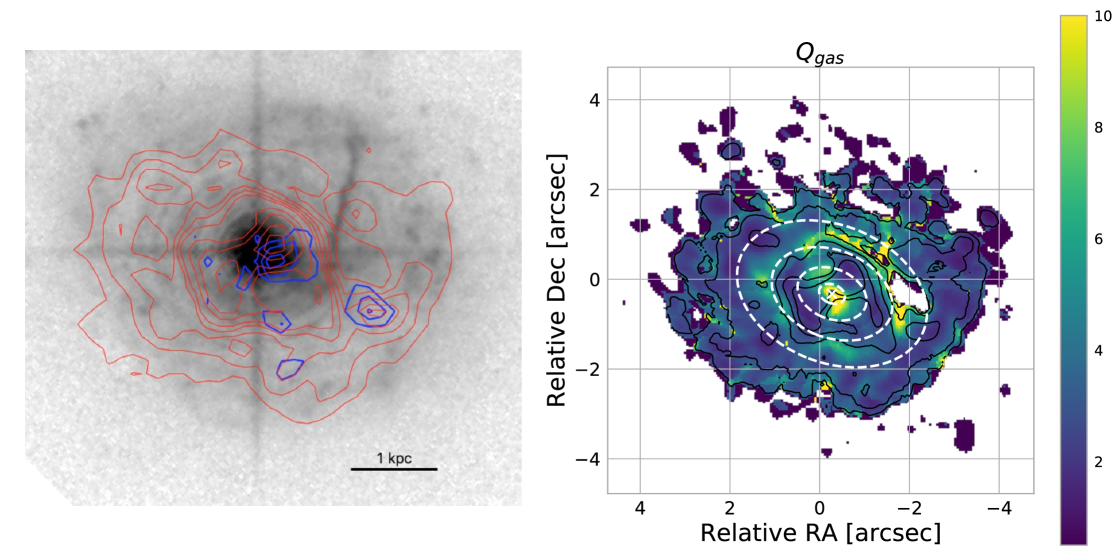
We compare our CO(2-1) moment 0 map with the HST image in FQ508N filter, which traces ionised gas emitting in the [OIII]5007Å, to investigate the relation between cold molecular and ionised gas distributions. Figure 7 left panel shows that the molecular gas (red contours) is detected at the position of the starburst ring.
The [OIII] image shows a linear tail extending out from the starburst ring toward north-west. The ”jut” of tail that seems to bend towards the nucleus is also visible. These two structures have been interpreted as due to a minor merger with a gas-rich dwarf galaxy (Fischer et al. 2015). In our ALMA data we do not detect CO-emitting gas at the position and velocity of the linear tail.
The 3 upper limit on the mass in the tail is , based on the r.m.s. of our observation, adopting a Milky Way conversion factor and FWHM = 50 km/s for the CO line (see Aalto et al. 2001). The limit appears consistent with a minor merger scenario (Knierman et al. 2013; van de Voort et al. 2018).
Both the tidal feature and the presence of a molecular disc with an ongoing starburst are in agreement with the scenario where galaxy interactions and mergers produce gas destabilization, and feed both star-formation and AGN activity (e.g. Menci et al. 2014, and refs therein) .
Assuming that most SFR occurs within the starburst ring, we derive a star-formation efficiency , consistent with that found for local early-type galaxies with recent minor mergers (Saintonge et al. 2012; Davis et al. 2015).
We quantify the disc stability against gravitational fragmentation, by deriving a map of the Toomre Q-parameter (Toomre 1964) for the cold molecular gas component, .
The Toomre parameter is related to the local gas velocity dispersion , the circular velocity , and the gas surface density at any given radius R, through the relation
| (3) |
where is a constant that varies from 1 (for a Keplerian rotation curve), 1.4 (for a flat rotation curve), to 2 (for a solid-body rotation curve), see Genzel et al. (2011, 2014) and refs therein. To obtain a map of we use , derived through the model of the whole disc, using the assumed inclination and best fit PA. We adopt =1 up to =1.1 arcsec, where the rotation curve is steep, and =1.4 at larger radii. The velocity dispersion and are calculated pixel by pixel from the moment 2 and 0 maps, respectively; the radius is deprojected. The map of is shown in Fig. 7 right panel, while in Table 3 we report , , and in 5 annulii between =0.3 and 0.8 arcsec, 0.8 and 1.4 arcsec, 1.4 and 2.2 arcsec (that includes a ring-like feature of enhanced visible in Fig. 2), 2.2 arcsec, and in the whole disc excluding the central region of 0.3 arcsec radius, to avoid the beam-smearing effect. We find values that range from 0.5 up to 10 and we note that exceeds 1 across most of the molecular disc. A similar range was reported by e.g. García-Burillo et al. (2003); Sani et al. (2012) in nearby Seyfert galaxies, and Hitschfeld et al. (2009) in M51. Where the value of the Q-parameter is higher than the critical value the disc is unstable against gravitational collapse. The commonly adopted critical value of is in the range 1-3 (Genzel et al. 2014; Leroy et al. 2008), whereas if one considers the total , including both the gas and stellar contribution, the critical value is (Aumer et al. 2010). The we find in Mrk 509 implies that the disc is unstable in its outer regions, across the starburst ring, whereas is stable against fragmentation at nucleus and in a lopsided ring-like structure located at arcsec from the AGN.
| Annulus | |||
| [km/s] | [] | ||
| (1) | (2) | (3) | (4) |
| 0.3 0.8 | 46.1 | 475 | 5.0 |
| 0.8 1.4 | 28.4 | 318 | 3.5 |
| 1.4 2.2 | 18.3 | 118 | 4.8 |
| 2.2 | 7.6 | 42 | 2.4 |
| 0.3 | 12.6 | 94 | 3.0 |
We find significant kinematic perturbations at different locations across the disc, where the molecular gas shows deviations from the disc rotation pattern. The first (Region A) is located at a distance of 300 pc from the nucleus, the second (Region B) further out at a distance of about 1.4 kpc.
In the proximity of Region B we detect a CO-depleted region (Fig. 6). This is close (in projection) to the location where the linear tail related to the merger event observed with HST crosses the disc. The CO-depleted region may be related to the merger event locally decreasing the CO in the disc, however the optical image does not show any lack of ionised gas there.
In Section 5, we showed that both A and B regions show non-circular gas motions, that are likely due to outflowing gas.
Regarding Region A, integral field spectroscopy (IFS) spectroscopy shows a [OIII] wind with velocity similar (Liu et al. 2015) to the molecular one, supporting the notion that this region hosts a multiphase wind. The ionised and molecular winds are co-spatial, within the accuracy allowed by the angular resolution of the data, suggesting a cooling sequence (Richings & Faucher-Giguere 2017; Menci et al. 2019).
Region B has a small projected distance from the tidal tail seen in [OIII]. The ionised gas velocity in the tidal tail is km/s, according to Liu et al. (2015), while it is 200 km/s for the molecular gas in B, and 250 km/s in A. Therefore it is unlikely that the molecular gas in A and B is related to the tidal tail.
It is likely that molecular gas in A and B is involved in an AGN-driven wind, whose total molecular outflow rate is in the range 6.4 - 17.0 , for the optically thin and thick cases respectively.
The contribution of Region B to the global outflow budget is a factor of 10 smaller than Region A, therefore including or excluding region B, does not change the main result of the work.
We computed the wind momentum load, that is the ratio between the outflow momentum flux, , and the radiative momentum flux, . We adopt a bolometric luminosity derived by Duras et al. (2020) from SED fitting and consistent with that derived by Gruppioni et al. (2016). The wind momentum load values obtained are reported in Fig. 8 for the different wind components: the three Ultra-fast Ouflow (UFO) components from Tombesi et al. (2010, 2011, 2012), the ionised gas winds from Liu et al. (2015), and the molecular winds from this work. The molecular wind A and the ionised gas wind show similar velocity and arise from approximately the same region, and also show similar mass outflow rates, suggesting that they might be part of a multiphase wind. The molecular wind A and the ionised wind are consistent with a momentum conserving driving (black dashed line), and are well below the expectation for energy conserving winds. Wind B has a much lower mass outflow rate. From current data we cannot discriminate if A and B components of the molecular wind are due to consecutive episodes or to the same event. Assuming that both the molecular components and the ionised wind detected by Liu et al. (2015) are part of the same multiphase wind, we derive a total mass outflow rate, molecular plus ionised, of . For comparison, the accretion rate onto the SMBH is , assuming an efficiency .
The total wind momentum load, 1.4 0.6 (magenta point) is below the energy conserving wind expectation, and compatible with a momentum conserving wind powered by the nuclear semi-relativistic wind probed by the UFOs. These momentum boost can also be attained by radiation pressure on dust (Ishibashi et al. 2021).
The wind mass-loading factor is , in agreement with what found for molecular winds in other Seyfert galaxies (e.g. Fiore et al. 2017).
In the following we discuss the possibility that the outflows are driven by energy injected by supernova (SN) explosion occurring in the starburst ring. To derive the mass outflow rate at B in this case, we adopt a radius kpc, that is half the projected size of the starburst ring. This implies by adopting equation 1, and .
Assuming that the total SFR (5 ) is homogeneously distributed across the ring, we consider a portion of the starburst ring equal to 1 tenth of the ring in area, and
we estimate a kinetic power of a SN-driven wind erg/s, assuming a SN rate of 0.02() (e.g. Veilleux et al. 2005).
Outflow B is then energetically consistent with a SN-driven wind originating from the starburst ring (Venturi et al. 2018; Leaman et al. 2019).
Regarding wind A, the SFR at its location cannot be resolved in current data, but it is most likely a small fraction of the total SFR which occurs mainly in the starburst ring. Therefore outflow A is most likely driven by the AGN.
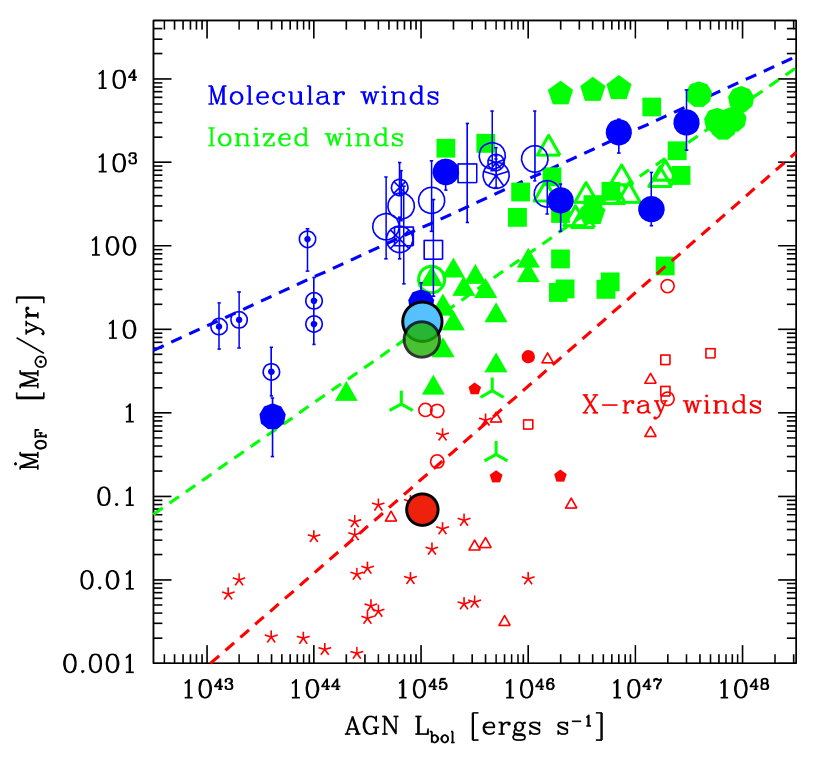
Figure 9 shows the outflow rate, , versus the AGN bolometric luminosity for Mrk 509 and a compilation of AGN adapted from Fiore et al. (2017). Mrk 509 shows a ionised wind and X-ray winds that are broadly consistent with the correlations found by Fiore et al. (2017), whereas its molecular outflow rate is significantly below the best-fit correlation of molecular winds. Indeed, the
ionised outflow rate is similar to the molecular one, unlike the average AGN with similar . We note, however, that the correlation is derived from a biased sample which collect mainly high luminosity objects and known massive winds, and therefore is probably biased towards positive detection, boosting the outflow rates. This highlights the importance of performing statistical studies on unbiased AGN samples to derive meaningful scaling relations. This study will be carried out by using the whole IBISCO sample in a separate publication.
7 Conclusions
We presented an analysis of the CO(2-1) line and 1.2 mm continuum of Mrk509, a Seyfert 1.5 galaxy drawn from the IBISCO sample of hard-X-ray selected local AGN. Mrk509 is optically classified as a spheroid and hosts ionised winds in different gas phases, from warm ionised gas wind traced by [OIII], to highly ionised UFOs seen in X-rays. We report the following findings:
-
1.
The galaxy hosts a molecular gas reservoir of within the inner 5.2 kpc, and partially overlapping with the starburst ring seen in HST optical imaging. In this region we estimate a molecular gas fraction , consistent with that of local star-forming galaxies with the same stellar mass (e.g. Saintonge et al. 2011, 2017). Both the signatures of a minor merger and the presence of a molecular disc with an ongoing starburst are in agreement with the scenario where galaxy interactions and mergers produce gas destabilization, and feed both star-formation and AGN activity. The star formation efficiency across the molecular disc and starburst ring, , is consistent with that found for local early-type galaxies with recent minor mergers.
-
2.
We quantify the disc stability by estimating the spatially-resolved Toomre Q-parameter for the cold molecular gas component, . We find that varies across the molecular disc in the range . The disk is unstable across the starburst ring, and stable against fragmentation at nucleus, in a lopsided ring-like structure located at arcsec from the AGN, and at the location of the molecular winds.
-
3.
The main velocity gradient detected in CO(2-1) is well modeled by a disc with = (2.01.1) within 5.2 kpc and inclination deg with respect to the line of sight. The CO kinematics in the nuclear region, r pc, is barely resolved at the current angular resolution and may be affected by a warped nuclear disc. Higher angular resolution observations may help to better constrain the gas distribution and kinematics in the nuclear region.
-
4.
We find significant perturbations of the molecular gas kinematics at two different locations in the disc, where the molecular gas shows deviations from the disc rotation, that we interpret as molecular winds. The wind A has a velocity of km/s and is located at a distance of 300 pc from the AGN, in the same region where a ionised gas wind is detected. The wind B is found at a distance of about 1.4 kpc, overlapping on the line of sight with the starburst ring, and at a small projected distance from the tidal tail. Its velocity km/s suggests that B is not related to the tidal tail. The total molecular outflow rate for A and B is in the range , for the optically thin and thick cases respectively, with outflow B constituting only a small fraction of the total outflow rate (about 10 ). The wind kinetic energy is consistent with a momentum-conserving wind driven by the AGN. The spatial overlap of the ionised and molecular winds in A, and their similar velocity, suggest a cooling sequence within a multi-phase AGN-driven wind. Whereas outflow B is consistent with a SN-driven wind originating in the starburst ring.
Acknowledgements.
We thank the referee for his/her careful reading and insightful suggestions that helped improving the paper. This paper makes use of the ALMA data from project: ADS/JAO.ALMA2017.1.01439.S. ALMA is a partnership of ESO (representing its member states), NSF (USA) and NINS (Japan), together with NRC (Canada), MOST and ASIAA (Taiwan), and KASI (Republic of Korea), in cooperation with the Republic of Chile. The Joint ALMA Observatory is operated by ESO, AUI/NRAO and NAOJ. The National Radio Astronomy Observatory is a facility of the National Science Foundation operated under cooperative agreement by Associated Universities, Inc. We acknowledge financial support from PRIN MIUR contract 2017PH3WAT, and PRIN MAIN STREAM INAF ”Black hole winds and the baryon cycle”.References
- Aalto et al. (2020) Aalto, S., Falstad, N., Muller, S., et al. 2020, A&A, 640, A104
- Aalto et al. (2001) Aalto, S., Hüttemeister, S., & Polatidis, A. G. 2001, A&A, 372, L29
- Accurso et al. (2017) Accurso, G., Saintonge, A., Catinella, B., et al. 2017, MNRAS, 470, 4750
- Alonso-Herrero et al. (2020) Alonso-Herrero, A., Pereira-Santaella, M., Rigopoulou, D., et al. 2020, A&A, 639, A43
- Audibert et al. (2020) Audibert, A., Combes, F., García-Burillo, S., & Dasyra, K. 2020, arXiv e-prints, arXiv:2010.01974
- Aumer et al. (2010) Aumer, M., Burkert, A., Johansson, P. H., & Genzel, R. 2010, ApJ, 719, 1230
- Bentz et al. (2009) Bentz, M. C., Peterson, B. M., Netzer, H., Pogge, R. W., & Vestergaard, M. 2009, ApJ, 697, 160
- Bischetti et al. (2019) Bischetti, M., Piconcelli, E., Feruglio, C., et al. 2019, A&A, 628, A118
- Bolatto et al. (2013) Bolatto, A. D., Wolfire, M., & Leroy, A. K. 2013, ARA&A, 51, 207
- Bruzual & Charlot (2003) Bruzual, G. & Charlot, S. 2003, MNRAS, 344, 1000
- Cappi et al. (2009) Cappi, M., Tombesi, F., Bianchi, S., et al. 2009, A&A, 504, 401
- Cicone et al. (2014) Cicone, C., Maiolino, R., Sturm, E., et al. 2014, A&A, 562, A21
- Combes (2019b) Combes, F. 2019b, arXiv e-prints, arXiv:1911.00707
- Combes (2020) Combes, F. 2020, arXiv e-prints, arXiv:2003.13280
- Combes et al. (2019a) Combes, F., García-Burillo, S., Audibert, A., et al. 2019a, A&A, 623, A79
- da Cunha et al. (2008) da Cunha, E., Charlot, S., & Elbaz, D. 2008, MNRAS, 388, 1595
- Dadina et al. (2005) Dadina, M., Cappi, M., Malaguti, G., Ponti, G., & de Rosa, A. 2005, A&A, 442, 461
- Dasyra & Combes (2012) Dasyra, K. M. & Combes, F. 2012, A&A, 541, L7
- Dasyra et al. (2014) Dasyra, K. M., Combes, F., Novak, G. S., et al. 2014, A&A, 565, A46
- Dasyra et al. (2016) Dasyra, K. M., Combes, F., Oosterloo, T., et al. 2016, A&A, 595, L7
- Davies et al. (2011) Davies, R., Förster Schreiber, N. M., Cresci, G., et al. 2011, ApJ, 741, 69
- Davis et al. (2015) Davis, T. A., Rowlands, K., Allison, J. R., et al. 2015, MNRAS, 449, 3503
- Detmers et al. (2011) Detmers, R. G., Kaastra, J. S., Steenbrugge, K. C., et al. 2011, A&A, 534, A38
- Di Teodoro & Fraternali (2015) Di Teodoro, E. M. & Fraternali, F. 2015, MNRAS, 451, 3021
- Duras et al. (2020) Duras, F., Bongiorno, A., Ricci, F., et al. 2020, A&A, 636, A73
- Ebrero et al. (2011) Ebrero, J., Kriss, G. A., Kaastra, J. S., et al. 2011, A&A, 534, A40
- Fabian (1999) Fabian, A. C. 1999, MNRAS, 308, L39
- Fabian (2012) Fabian, A. C. 2012, ARA&A, 50, 455
- Faucher-Giguère & Quataert (2012) Faucher-Giguère, C.-A. & Quataert, E. 2012, MNRAS, 425, 605
- Feltre et al. (2012) Feltre, A., Hatziminaoglou, E., Fritz, J., & Franceschini, A. 2012, MNRAS, 426, 120
- Fernández-Ontiveros et al. (2020) Fernández-Ontiveros, J. A., Dasyra, K. M., Hatziminaoglou, E., et al. 2020, A&A, 633, A127
- Ferrarese & Ford (2005) Ferrarese, L. & Ford, H. 2005, Space Sci. Rev., 116, 523
- Feruglio et al. (2020) Feruglio, C., Fabbiano, G., Bischetti, M., et al. 2020, ApJ, 890, 29
- Feruglio et al. (2017) Feruglio, C., Ferrara, A., Bischetti, M., et al. 2017, A&A, 608, A30
- Feruglio et al. (2015) Feruglio, C., Fiore, F., Carniani, S., et al. 2015, A&A, 583, A99
- Feruglio et al. (2010) Feruglio, C., Maiolino, R., Piconcelli, E., et al. 2010, A&A, 518, L155
- Fiore et al. (2017) Fiore, F., Feruglio, C., Shankar, F., et al. 2017, A&A, 601, A143
- Fischer et al. (2013) Fischer, T. C., Crenshaw, D. M., Kraemer, S. B., & Schmitt, H. R. 2013, ApJS, 209, 1
- Fischer et al. (2015) Fischer, T. C., Crenshaw, D. M., Kraemer, S. B., et al. 2015, ApJ, 799, 234
- Fluetsch et al. (2019) Fluetsch, A., Maiolino, R., Carniani, S., et al. 2019, MNRAS, 483, 4586
- Fritz et al. (2006) Fritz, J., Franceschini, A., & Hatziminaoglou, E. 2006, MNRAS, 366, 767
- García-Burillo et al. (2003) García-Burillo, S., Combes, F., Hunt, L. K., et al. 2003, A&A, 407, 485
- García-Burillo et al. (2019) García-Burillo, S., Combes, F., Ramos Almeida, C., et al. 2019, A&A, 632, A61
- García-Burillo et al. (2014) García-Burillo, S., Combes, F., Usero, A., et al. 2014, A&A, 567, A125
- García-Burillo et al. (2017) García-Burillo, S., Viti, S., Combes, F., et al. 2017, A&A, 608, A56
- Gebhardt et al. (2000) Gebhardt, K., Bender, R., Bower, G., et al. 2000, ApJ, 539, L13
- Genzel et al. (2014) Genzel, R., Förster Schreiber, N. M., Lang, P., et al. 2014, ApJ, 785, 75
- Genzel et al. (2011) Genzel, R., Newman, S., Jones, T., et al. 2011, ApJ, 733, 101
- Gruppioni et al. (2016) Gruppioni, C., Berta, S., Spinoglio, L., et al. 2016, MNRAS, 458, 4297
- Hitschfeld et al. (2009) Hitschfeld, M., Kramer, C., Schuster, K. F., Garcia-Burillo, S., & Stutzki, J. 2009, A&A, 495, 795
- Ho & Kim (2014) Ho, L. C. & Kim, M. 2014, ApJ, 789, 17
- Huchra et al. (1993) Huchra, J., Latham, D. W., da Costa, L. N., Pellegrini, P. S., & Willmer, C. N. A. 1993, AJ, 105, 1637
- Ishibashi et al. (2021) Ishibashi, W., Fabian, A. C., & Arakawa, N. 2021, arXiv e-prints, arXiv:2101.11645
- King (2003) King, A. 2003, ApJ, 596, L27
- King & Pounds (2015) King, A. & Pounds, K. 2015, ARA&A, 53, 115
- Knierman et al. (2013) Knierman, K. A., Scowen, P., Veach, T., et al. 2013, ApJ, 774, 125
- Kormendy & Ho (2013) Kormendy, J. & Ho, L. C. 2013, ARA&A, 51, 511
- Koss et al. (2017) Koss, M., Trakhtenbrot, B., Ricci, C., et al. 2017, ApJ, 850, 74
- Koss et al. (2020) Koss, M. J., Strittmatter, B., Lamperti, I., et al. 2020, arXiv e-prints, arXiv:2010.15849
- Kriss et al. (2019) Kriss, G. A., Arav, N., Edmonds, D., et al. 2019, A&A, 623, A82
- Kriss et al. (2011) Kriss, G. A., Arav, N., Kaastra, J. S., et al. 2011, A&A, 534, A41
- Leaman et al. (2019) Leaman, R., Fragkoudi, F., Querejeta, M., et al. 2019, MNRAS, 488, 3904
- Leroy et al. (2008) Leroy, A. K., Walter, F., Brinks, E., et al. 2008, AJ, 136, 2782
- Liu et al. (2015) Liu, G., Arav, N., & Rupke, D. S. N. 2015, ApJS, 221, 9
- Longinotti et al. (2018) Longinotti, A. L., Vega, O., Krongold, Y., et al. 2018, ApJ, 867, L11
- Lutz et al. (2020) Lutz, D., Sturm, E., Janssen, A., et al. 2020, A&A, 633, A134
- Malizia et al. (2012) Malizia, A., Bassani, L., Bazzano, A., et al. 2012, MNRAS, 426, 1750
- Marasco et al. (2020) Marasco, A., Cresci, G., Nardini, E., et al. 2020, A&A, 644, A15
- McMullin et al. (2007) McMullin, J. P., Waters, B., Schiebel, D., Young, W., & Golap, K. 2007, in Astronomical Society of the Pacific Conference Series, Vol. 376, Astronomical Data Analysis Software and Systems XVI, ed. R. A. Shaw, F. Hill, & D. J. Bell, 127
- Menci et al. (2019) Menci, N., Fiore, F., Feruglio, C., et al. 2019, ApJ, 877, 74
- Menci et al. (2014) Menci, N., Gatti, M., Fiore, F., & Lamastra, A. 2014, A&A, 569, A37
- Morganti et al. (2007) Morganti, R., Holt, J., Saripalli, L., Oosterloo, T. A., & Tadhunter, C. N. 2007, A&A, 476, 735
- Morganti et al. (2015) Morganti, R., Oosterloo, T., Oonk, J. B. R., Frieswijk, W., & Tadhunter, C. 2015, A&A, 580, A1
- Morganti et al. (2016) Morganti, R., Veilleux, S., Oosterloo, T., Teng, S. H., & Rupke, D. 2016, A&A, 593, A30
- Nardini et al. (2015) Nardini, E., Reeves, J. N., Gofford, J., et al. 2015, Science, 347, 860
- Oosterloo et al. (2017) Oosterloo, T., Raymond Oonk, J. B., Morganti, R., et al. 2017, A&A, 608, A38
- Phillips et al. (1983) Phillips, M. M., Baldwin, J. A., Atwood, B., & Carswell, R. F. 1983, ApJ, 274, 558
- Richings & Faucher-Giguere (2017) Richings, A. J. & Faucher-Giguere, C.-A. 2017, in The Galaxy Ecosystem. Flow of Baryons through Galaxies, 3
- Saintonge et al. (2017) Saintonge, A., Catinella, B., Tacconi, L. J., et al. 2017, ApJS, 233, 22
- Saintonge et al. (2011) Saintonge, A., Kauffmann, G., Kramer, C., et al. 2011, MNRAS, 415, 32
- Saintonge et al. (2012) Saintonge, A., Tacconi, L. J., Fabello, S., et al. 2012, ApJ, 758, 73
- Sani et al. (2012) Sani, E., Davies, R. I., Sternberg, A., et al. 2012, MNRAS, 424, 1963
- Shankar et al. (2017) Shankar, F., Bernardi, M., & Sheth, R. K. 2017, MNRAS, 466, 4029
- Shankar et al. (2016) Shankar, F., Bernardi, M., Sheth, R. K., et al. 2016, MNRAS, 460, 3119
- Shimizu et al. (2019) Shimizu, T. T., Davies, R. I., Lutz, D., et al. 2019, MNRAS, 490, 5860
- Shinozaki et al. (2006) Shinozaki, K., Miyaji, T., Ishisaki, Y., Ueda, Y., & Ogasaka, Y. 2006, AJ, 131, 2843
- Silk & Rees (1998) Silk, J. & Rees, M. J. 1998, A&A, 331, L1
- Smith et al. (2019) Smith, R. N., Tombesi, F., Veilleux, S., Lohfink, A. M., & Luminari, A. 2019, ApJ, 887, 69
- Solomon & Vanden Bout (2005) Solomon, P. M. & Vanden Bout, P. A. 2005, ARA&A, 43, 677
- Tadhunter et al. (2014) Tadhunter, C., Morganti, R., Rose, M., Oonk, J. B. R., & Oosterloo, T. 2014, Nature, 511, 440
- Tombesi et al. (2012) Tombesi, F., Cappi, M., Reeves, J. N., & Braito, V. 2012, MNRAS, 422, L1
- Tombesi et al. (2011) Tombesi, F., Cappi, M., Reeves, J. N., et al. 2011, ApJ, 742, 44
- Tombesi et al. (2010) Tombesi, F., Cappi, M., Reeves, J. N., et al. 2010, A&A, 521, A57
- Tombesi et al. (2015) Tombesi, F., Meléndez, M., Veilleux, S., et al. 2015, Nature, 519, 436
- Toomre (1964) Toomre, A. 1964, ApJ, 139, 1217
- van de Voort et al. (2018) van de Voort, F., Davis, T. A., Matsushita, S., et al. 2018, MNRAS, 476, 122
- Veilleux et al. (2005) Veilleux, S., Cecil, G., & Bland-Hawthorn, J. 2005, ARA&A, 43, 769
- Veilleux et al. (2020) Veilleux, S., Maiolino, R., Bolatto, A. D., & Aalto, S. 2020, A&A Rev., 28, 2
- Venturi et al. (2018) Venturi, G., Nardini, E., Marconi, A., et al. 2018, A&A, 619, A74
- Zubovas & King (2012) Zubovas, K. & King, A. 2012, ApJ, 745, L34
Appendix A Stellar Mass
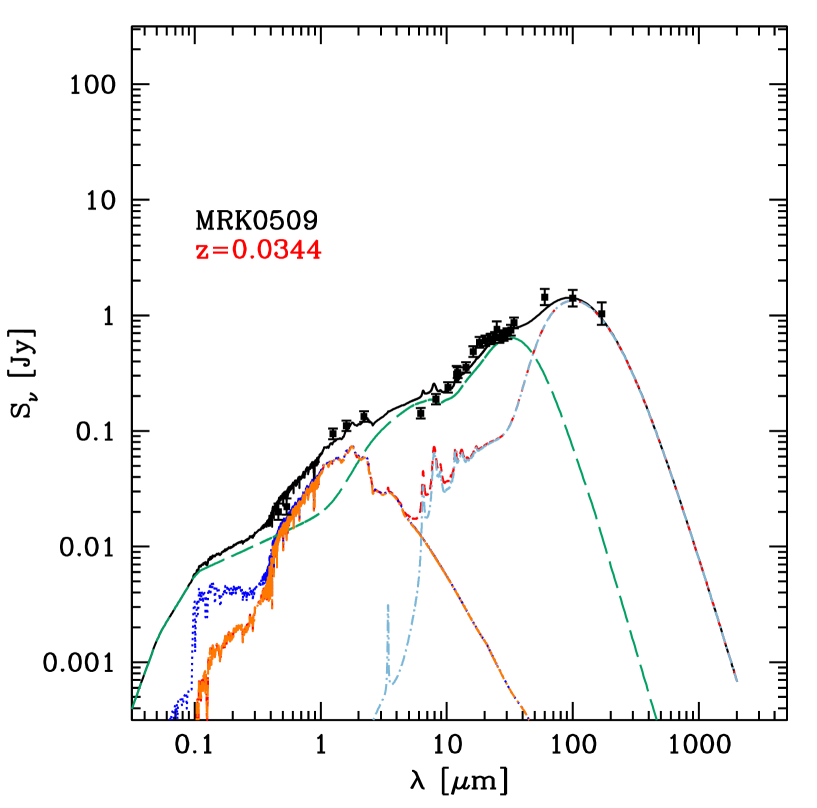
The rest-frame SED is fitted with a three components model using the approach described in Gruppioni et al. (2016). The adopted code combines three components simultaneously, i.e. the stellar component, the dusty star-formation part and the AGN/torus emission. The adopted libraries are the Bruzual & Charlot (2003) stellar library, the da Cunha et al. (2008) IR dust-emission library and the library of AGN tori by Fritz et al. (2006), updated by Feltre et al. (2012). The latter includes both the emission of the dusty torus, heated by the central AGN engine, and the emission of the accretion disc. The considered AGN models are based on a continuous distribution of dust across the torus. The torus emission is shown as green dashed line. The decomposition code provides a probability distribution function (PDF) in each photometric band and for each fit component, allowing an estimate of the uncertainty related to each decomposed contribution. In Fig. 10, we show the observed SED of Mrk509 with the galaxy and AGN components. We defer to Gruppioni et al. (2016) for further details about the SED decomposition method. This SED decomposition delivers the star-formation rate (Gruppioni et al. 2016), and the stellar mass (this work).
Appendix B Inner disc model
Based on the residual maps of the disc model (Section 3), we perform a dynamical modeling of the inner 1.5 kpc region, where the model of the large scale disc produces significant blue- and red-shifted residuals (Fig. 2). This nuclear region is barely resolved with the current angular resolution but we attempt to model it with a nuclear disc using the same technique as explained in Section 3. Given the limited signal-to-noise ratio and angular resolution we fix the inclination to 66 deg, derived from the minor/major axis ratio of the inner emitting region measured from the zeroth moment of the emission line data-cube. We fix the PA value to 330 deg, i.e. across the two brightest emission regions in the residual intensity map, Fig. 5. We allow two parameters to vary: the rotational velocity and the velocity dispersion with first guess values set to 80 and 50 km/s, respectively (Fig. 5 right panel). The moment 1 and 2 maps of this model are reported in Fig. 11 central panels. The right panel of Fig.5 shows the position velocity diagrams cut along the kinematic major axis (330 deg); where the grey-scale and blue contours refer to the data and the red contours to the model.