The first simultaneous X-ray broad-band view of Mrk 110 with XMM-Newton and NuSTAR
Abstract
Context. Soft and hard X-ray excesses, compared to the continuum power-law shape between 2-10 keV, are common features observed in the spectra of active galactic nuclei (AGN) and are associated with the accretion disc-corona system around the supermassive black hole. However, the dominant process at work is still highly debated and has been proposed to be either relativistic reflection or Comptonisation. Such an investigation can be problematic for AGN having significant intrinsic absorption, either cold or warm, which can severely distort the observed continuum. Therefore, AGN with no (or very weak) intrinsic absorption along the line of sight, called bare AGN, are the best targets to directly probe disc-corona systems.
Aims. We aim to characterise the main X-ray spectral physical components from the bright bare Broad Line Seyfert 1 AGN Mrk 110, and the physical process(es) at work in its disc-corona system viewed almost face-on.
Methods. We perform the X-ray broad-band spectral analysis thanks to two simultaneous XMM-Newton and NuSTAR observations performed on November 16-17 2019 and April 5-6 2020, we also use for the spectral analysis above 3 keV the deep NuSTAR observation obtained in January 2017.
Results. The broad-band X-ray spectra of Mrk 110 are characterised by the presence of a prominent and absorption-free smooth soft X-ray excess, moderately broad O vii and Fe K emission lines and a lack of a strong Compton hump. The continuum above 3 keV is very similar at both epochs, while some variability (stronger when brighter) is present for the soft X-ray excess. A combination of soft and hard Comptonisation by a warm and hot corona, respectively, plus mildly relativistic disc reflection reproduce the broadband X-ray continuum very well. The inferred warm corona temperature, kTwarm 0.3 keV, is similar to the values found in other sub-Eddington AGN, whereas the hot corona temperature, kThot 21–31 keV (depending mainly on the assumed hot corona geometry), is found to be in the lower range of the values measured in AGN.
Key Words.:
X-rays: individuals: Mrk 110 – Galaxies: active – (Galaxies:) quasars: general – Radiation mechanism: general – Accretion, accretion discs –1 Introduction
In the standard picture, the emission of an active galactic nucleus
(AGN) stems from an accretion disc around a supermassive black hole (SMBH) with
mass spanning from a few millions to billions of solar masses.
X-ray spectra offer a unique potential to probe matter very close
to the black hole such as the disc-corona system.
The X-ray spectra of AGN usually exhibit, in addition to a power-law continuum between 2 and 10 keV,
one or more of the following components :
a soft X-ray excess below 2 keV, a Fe K line complex near 6.4 keV, and a Compton scattering hump
peaking near 20–30 keV.
However, the geometry of the disc-corona system is still highly debated
as well as the dominant emission process at work:
either relativistic reflection resulting from the illumination of the accretion disc by a hot corona,
or Comptonisation of seed photons from the accretion disc by a warm/hot corona
(e.g., Magdziarz et al., 1998; Porquet et al., 2004; Crummy et al., 2006; Bianchi et al., 2009; Fabian et al., 2012; Done et al., 2012; Gliozzi et al., 2013; Petrucci et al., 2018; Gliozzi & Williams, 2020; Waddell & Gallo, 2020).
Moreover, some AGN exhibit warm absorbers along the line-of-sight that can
severely complicate the X-ray data analysis.
Therefore, bare AGN that show no (or very weak) X-ray
warm absorbers are the best targets to directly investigate the process(es) at work in the vicinity of SMBHs (Porquet et al., 2018).
| Mission | Obs. ID | Obs. start (UTC) | Obs. end (UTC) | Exp. (ks) | count s-1(a) |
| NuSTAR | 60502022002 | 2019 November 16 – 03:31:09 | 2019 November 18 – 00:56:09 | 86.8 | 0.76 |
| XMM-Newton | 0852590101 | 2019 November 17 – 09:02:57 | 2019 November 17 – 21:24:37 | 44.5 | 21.2 |
| NuSTAR | 60502022004 | 2020 April 5 – 14:26:09 | 2020 April 7 – 13:26:09 | 88.7 | 0.66 |
| XMM-Newton | 0852590201 | 2020 April 6 – 22:26:50 | 2020 April 7 – 11:55:10 | 48.5 | 16.5 |
| NuSTAR | 60201025002 | 2017 January 23 – 19:11:09 | 2017 January 28 06:41:09 | 184.6 | 1.08 |
The bright bare AGN Mrk 110 (z=0.035291) has been classified as a Narrow Line Seyfert 1 (NLS1) due to its
relatively narrow optical emission lines (2000 km/s FWHM) emitted by the broad-line region (BLR)
(Osterbrock & Pogge, 1985; Goodrich, 1989).
However, two much broader and redshifted line components are also observed (5000–6000 km s-1 and 3340 km s-1; Bischoff & Kollatschny 1999; Véron-Cetty et al. 2007).
In addition, contrary to NLS1s, Mrk 110 displays an unusually large
[O iii]5007/H ratio and very weak Fe ii
emission, which is more consistent with a Broad Line Seyfert 1 (BLS1),
and indicates a low Eddington ratio (Boroson & Green, 1992; Grupe, 2004; Véron-Cetty et al., 2007).
Its X-ray photon index, soft X-ray excess strength and X-ray variability are similar to that found
for BLS1s (Porquet et al., 2004; Boller et al., 2007; Piconcelli et al., 2005; Zhou & Zhang, 2010; Ponti et al., 2012; Gliozzi & Williams, 2020).
It hosts a SMBH with a mean mass value of Mgrav=1.40.3108 M⊙
measured from the detection of gravitational redshifted emission in the variable component of all of the broad optical lines (Kollatschny, 2003; Liu et al., 2017).
In contrast to the virial method, for which a much lower black hole mass has been estimated,
this gravitational method is independent of any assumption on the BLR geometry, such as its inclination angle.
Indeed, as argued by Liu et al. (2017), the large discrepancy between Mvir and Mgrav for Mrk 110 is explained by the
use of a virial factor of 1 to infer Mvir, which is equivalent for a geometrically thin disc-like BLR to an inclination angle =30 degrees (=1/(4 sin); the squared of Eq. 4 of Decarli et al. 2008).
Therefore, the 8 times lower virial mass of Mrk 110 compared to its gravitational mass is explained by 8–16 (Liu et al., 2017), that is to say a BLR-disc system seen almost face-on with an inclination of 7–10 degrees (see also Bian & Zhao 2002; Kollatschny 2003).
Consistent black hole mass values to Mgrav have been inferred for Mrk 110
from different independent methods, such as optical spectro-polarimetric observations
(Afanasiev et al., 2019), X-ray excess variance (Ponti et al., 2012), and X-ray scaling method (Gliozzi et al., 2011; Williams et al., 2018).
From its optical/X-ray properties, black hole mass and accretion rate, Mrk 110 is then a BLS1.
Reeves et al. (2021b) found that the RGS spectra of Mrk 110 obtained between 2004 and 2020
exhibit no significant intrinsic X-ray warm absorption with an upper limit for its column density of only 2.61020 cm-2.
This points out that Mrk 110 is a bare AGN whatever its flux level is.
Moreover, they confirm the presence of a broad O vii soft X-ray emission line, first identified by Boller et al. (2007).
For the first time, Reeves et al. (2021b) report that the O vii line flux varies significantly with the soft X-ray continuum flux level,
being brightest when the continuum flux is highest, similar to the reported behaviour of the optical He ii line (Véron-Cetty et al., 2007).
This O vii line originates from the accretion disc at a distance of a few tens of gravitational radii.
From the spectral analysis a very stringent constraint on the inclination angle of the accretion disc
has been measured, 9.9 degrees, which is consistent with an almost face-on view, as also inferred from the optical emission lines emitted by the disc-like BLR (Bian & Zhao, 2002; Kollatschny, 2003; Liu et al., 2017).
In this paper, we report the X-ray broad-band spectral analysis of the first two simultaneous XMM-Newton and NuSTAR observations of Mrk 110, performed on November 16-17 2019 and April 5-6 2020. In section 2, the data reduction and analysis method of the dataset are presented. The data analysis above 3 keV also uses the deep NuSTAR observation performed in January 2017 (section 4). The X-ray broad-band spectra analysis using a combination of Comptonisation and relativistic reflection models is reported (section 5). Finally, the main results are summarised and discussed in section 6.
2 Observations, data reduction and analysis method
2.1 XMM-Newton and NuSTAR data reduction
The log of the XMM-Newton and NuSTAR simultaneous observations of Mrk 110 (NuSTAR cycle-5; PI: D. Porquet) used in this work is reported in Table 1. For the data analysis above 3 keV (4), we also use the deep NuSTAR observation performed in January 2017.
The XMM-Newton/EPIC event files were reprocessed with the Science Analysis System (SAS, version 18.0.0), applying the latest calibration available on 2021 February 24. Due to the high source brightness, the EPIC instruments were operated in the Small Window mode. Only the EPIC/pn (Strüder et al., 2001) data are used (selecting the event patterns 0–4, that is to say, single and double events) since they do not suffer from pile-up (contrary to the MOS data) and they have a much better sensitivity above 6 keV. The pn spectra were extracted from a circular region centered on Mrk 110, with a radius of 35 to avoid the edge of the chip. The background spectra were extracted from a rectangular region in the lower part of the small window that contains no (or negligible) source photons. The total net exposure times, obtained after the correction for dead time and background flaring, are reported in Table 1. Redistribution matrix files (rmf) and ancillary response files (arf) were generated with the SAS tasks rmfgen and arfgen, and were binned in order to over-sample the instrumental resolution by at least a factor of three, with no impact on the fit results. As shown in Lobban et al. (2021, in prep.), there is some flux variability during each XMM-Newton observation and between them. However, the spectral variability within any single observation is slow and moderate, therefore we use the pn time-averaged spectra for each epoch. Finally, the background-corrected pn spectra were binned in order to have a signal-to-noise ratio greater than four in each spectral channel.
NuSTAR (Harrison et al., 2013) observed Mrk 110 with its two co-aligned X-ray telescopes with corresponding Focal Plane Modules A (FPMA) and B (FPMB). The level 1 data products were processed with the NuSTAR Data Analysis Software (NuSTARDAS) package (version 2.0.0; 2020 June 19). Cleaned event files (level 2 data products) were produced and calibrated using standard filtering criteria with the nupipeline task and the calibration files available in the NuSTAR calibration database (CALDB: 20210210). Extraction radii for both the source and the background spectra were arcseconds. The corresponding net exposure time for the observations with FPMA are reported in Table 1. The processed rmf and arf files are provided on a linear grid of 40 eV steps. As the FWHM energy resolution of NuSTAR is 400 eV below 50 keV and increases to 1 keV at 86 keV (Harrison et al., 2013), we re-binned the rmf and arf files in energy and channel space by a factor of 4 to over-sample the instrumental energy resolution by at least a factor of 2.5. The background-corrected NuSTAR spectra were finally binned in order to have a signal-to-noise ratio greater than five in each spectral channel.
2.2 Spectral analysis method
The xspec v12.11.1 software package (Arnaud, 1996) was used for the spectral analysis. Since Reeves et al. (2021b) found that there is no additional absorption compared to the Galactic one, we fix it in all forthcoming modelling at 1.271020 cm-2 (HI4PI Collaboration et al., 2016). We used the X-ray absorption model tbnew (version 2.3.2) from Wilms et al. (2000), applying their interstellar medium (ISM) elemental abundances and the cross-sections from Verner et al. (1996). We allow for cross-calibration uncertainties between the two NuSTAR spectra and the XMM-Newton/pn spectra by including in the fit a cross-normalization factor for the pair of NuSTAR FPMA and FPMB spectra, with respect to the pn spectra. Except in 3, the inclination angle of the accretion disc is fixed at 9.9 degrees (Reeves et al., 2021b). We use minimization throughout, quoting errors with 90% confidence intervals for one interesting parameter (=2.71). Default values of H0=67.66 km s-1 Mpc-1, =0.3111, and are assumed (Planck Collaboration et al., 2020).
 |
 |
3 Main X-ray spectral components of the 2019 and 2020 XMM-Newton and NuSTAR observations
In order to characterise the main X-ray components of the
spectra, we fit the two simultaneous XMM-Newton/pn and NuSTAR spectra
between 3–5 keV (AGN rest-frame) using a power-law with Galactic absorption.
We find photon indices of 1.700.07 and 1.690.07 for November 2019 and April 2010, respectively.
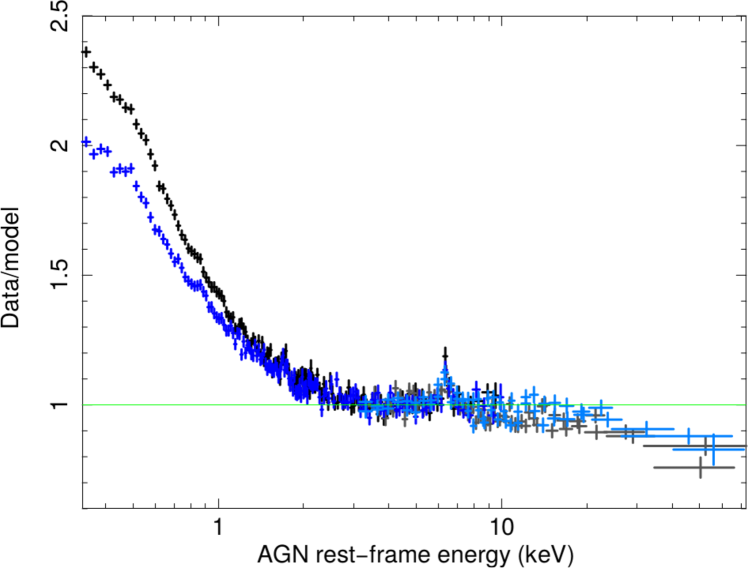
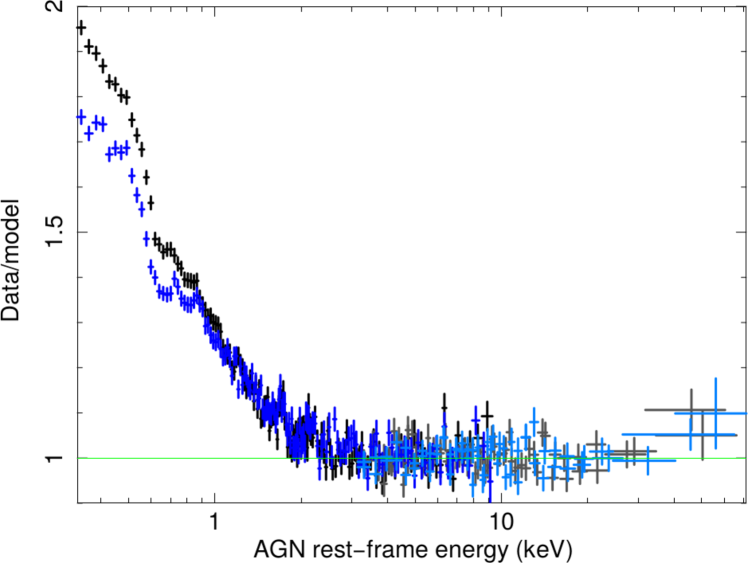
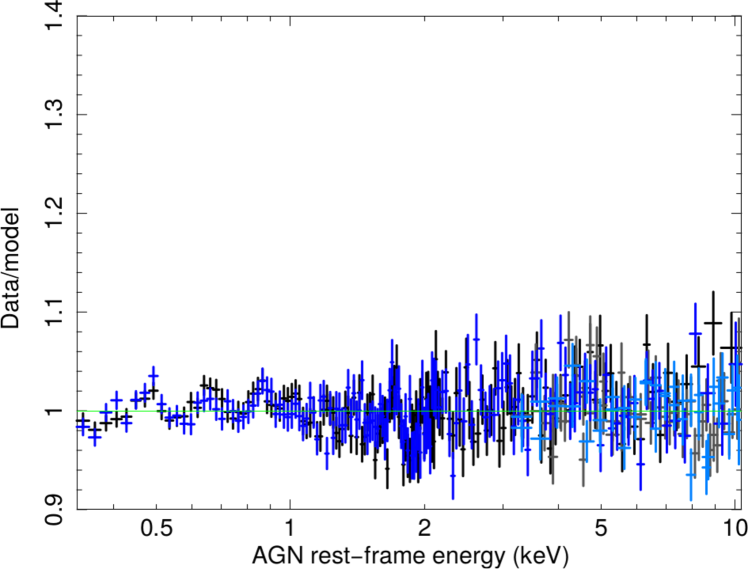
As illustrated in Fig. 1 (top panel), the extrapolation of this fit over the full energy range shows a prominent and absorption-free smooth soft X-ray excess below 2 keV which is variable between the two
epochs, with the highest flux observation (2019) exhibiting the largest soft X-ray excess.
Mrk 110 does not display any Compton hump, which suggests a weak (or even a lack of) relativistic reflection component;
Mrk 110 has a flat hard X-ray shape with a notable deficit above 30 keV that indicates a low high-energy cut-off,
that is to say, a low hot corona temperature.
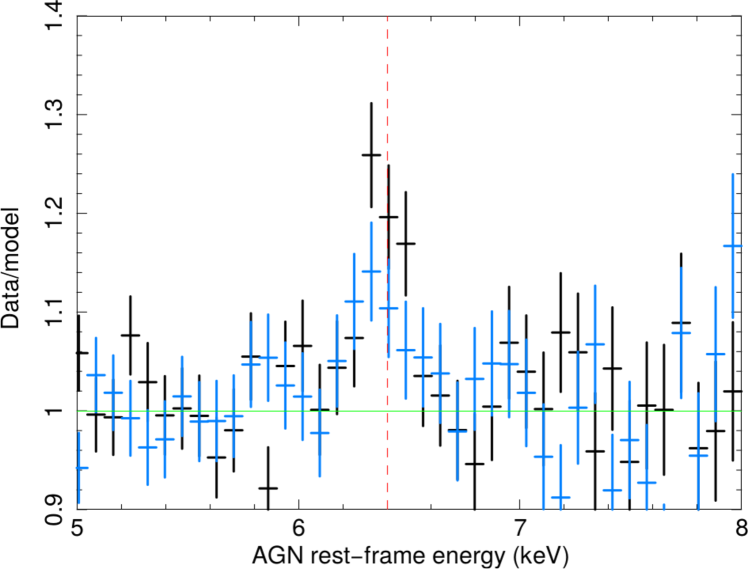
The Fe K line profile is found to be consistent between these two epochs, though the flux of the latter observation is lower (Fig. 1, bottom panel). Aiming to characterise this Fe K complex, we first fit the two pn spectra between 3 and 10 keV with a power-law with Galactic absorption and a Gaussian line. The energy and width () of the line are tied between both observations. We find a good fit with E=6.360.03 keV and 0.106 keV (/d.o.f.=585.1/669). The equivalent widths (EW) are 5816 eV and 41 eV for 2019 and 2020, respectively. The mean value of the line energy is slightly lower than that expected from the neutral Fe K fluorescence line in the AGN rest-frame. We checked that this is not due to a gain issue by analysing other AGN observed at similar periods using the small window mode. Even if the line width is not constrained, its high upper limit and the slightly lower line energy might indicate that a mild relativistic reflection component is present. The upper limit to the line width corresponds to a FWHM velocity width, of 12000 km s-1, which is compatible with the widths of the accretion disc O vii emission line in the high resolution RGS spectra, for which the inner radius of the line emission is inferred to lie between about 20–100 from the black hole (Reeves et al., 2021b). We note that since the accretion disc is seen almost face-on, the width of lines emitted above a few 10s of appears much narrower than for systems viewed at higher inclination angles, such as found in the bare AGN Ark 120 for the which the system is observed with an inclination angle of 30 degrees (Porquet et al., 2018, 2019). This explains the moderate value of the width upper limit for Mrk 110. Moreover, the ionisation parameter of the medium from which the O vii emission line originates, log 1.2, is expected to also give rise to a neutral Fe K emission line.
Therefore, we now fit the two pn spectra between 3 and 10 keV using a power-law with Galactic absorption, a narrow neutral Fe K core (=6.4 keV and =0 eV), and a disc line model (relline; Dauser et al. 2010, 2013) to account for the mildly broad line. For the latter component, the energy was fixed at 6.4 keV and the spin at zero (since it is not constrained). All parameters of the Fe K narrow component and the emissivity index for the mild relativistic Fe K line component are tied between the two epochs. From this modelling (/d.o.f.=585.4/668), we infer an accretion disc emissivity index lower than 2.1 and a disc inclination lower than 24.6 degrees, which is consistent with the inclination angle inferred from the variable O vii soft X-ray emission line () arising from the accretion disc too (Reeves et al., 2021b). For the narrow core of the Fe K line, we measure a EWn 20 eV, which is in the lower range of the values found for type-1 AGN (30–200 eV; Liu & Wang 2010; Shu et al. 2010; Fukazawa et al. 2011; Ricci et al. 2014). This is consistent with the very weak covering factor of 0.06 for the putative torus, which is inferred from the ratio of the infrared to the bolometric luminosity of the source (Ezhikode et al., 2017). Moreover, the torus covering factor measured for Mrk 110 is one of the lowest reported in Ezhikode et al. (2017)’s sample; this is also in agreement with the lack of Compton hump. The equivalent widths of the moderately broad Fe K line are =61 eV and =43 eV for 2019 and 2020, respectively. Likewise, if we allow the inner disc radius to be free to vary and assume a standard value of three for the disc emissivity index, as well as fixing the inclination angle at 9.9 degrees (/d.o.f.=585.1/668), we infer =120 Rg. This strengthens that the moderately broad Fe line could originate from the accretion disc but not too close to ISCO, as was found for the O vii soft X-ray emission line (Reeves et al., 2021b). Its origin from the outer accretion disc is also consistent with the timing analysis reported in Lobban et al. (2021, in prep.) where a hint of an extra variability is found at the Fe K complex energy range in the fractional variability spectra.
 |
 |
4 Spectral analysis above 3 keV at three epochs: 2017, 2019 and 2020
In this section, we focus on the hard X-ray shape of Mrk 110
using the simultaneous XMM-Newton and NuSTAR data above 3 keV
to prevent the fit to be driven by the soft X-ray emission.
We also here include the deep NuSTAR observation of
Mrk 110 performed in January 2017 (Ezhikode et al., 2020; Panagiotou & Walter, 2020).
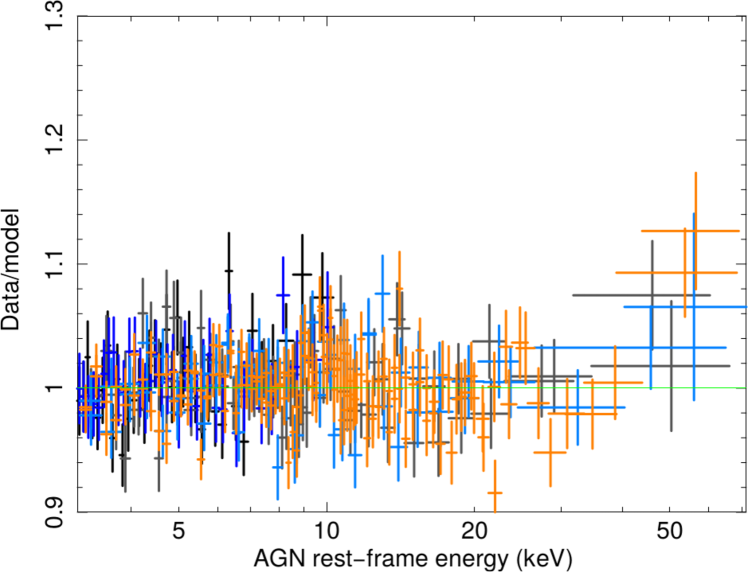
We first fit the data of these three epochs with a phenomenological model
combining a power law () continuum with an exponential cut-off
at high energy () and a Gaussian line.
The line energy and its width are assumed to be constant between the three epochs,
while its normalisation is allowed to vary.
A very good fit is found as reported in Table 2.
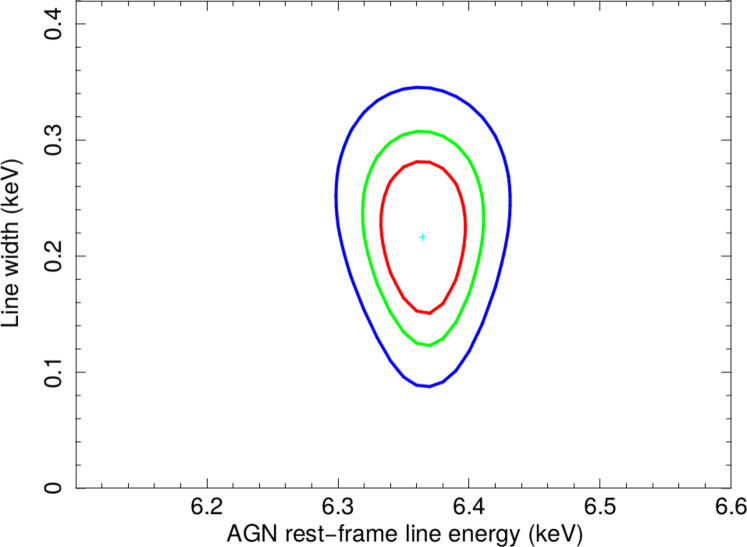
Thanks to the use of both XMM-Newton and NuSTAR data over the 3–79 keV and
the deep 2017 NuSTAR data, both the energy and width of the Fe K
line are well constrained, as illustrated by the 2D contour plot displayed in Fig. 2.
The AGN rest-frame line energy is slightly redshifted toward 6.4 keV as previously found
with the pn data, and line width corresponds to a FWHM of 22 000 km s-1.
This confirms that a mild relativistic reflection component is present.
Now, we consider more physical models in order to determine both the hot corona properties and the disc reflection contribution. For this purpose, we use models that combine the primary continuum shape (hot corona) and the relativistic reflection contribution: relxill/relxillcp111https://www.sternwarte.uni-erlangen.de/dauser/research/relxill/ (version 1.4.3; Dauser et al., 2010; García et al., 2016) and reflkerr222The usage notes as well as the full description of the models and their associated parameters are reported at https://users.camk.edu.pl/mitsza/reflkerr/reflkerr.pdf model. (version 2019; Niedźwiecki et al., 2019).
Since the lamppost geometry does not allow us to obtain satisfactory fits, we only report below the results for a coronal geometry. The single power-law disc emissivity index (; with emissivity ) is fixed at the standard value of three, while the inner radius of the reflection component (, expressed in units of ) is allowed to vary. The inclination of the accretion disc is fixed at 9.9 degrees and the iron abundance is set to unity. Since the spin value is not constrained, we fix it at zero.
| Parameters | 2019 Nov | 2020 Apr | 2017 Jan |
|---|---|---|---|
| NuSTAR | NuSTAR | NuSTAR | |
| +XMM | +XMM | ||
| zcutoffpl + zga | |||
| (keV) | 187 | 216 | 148 |
| 1.740.01 | 1.690.02 | 1.720.01 | |
| (10-3) | 7.00.2 | 5.70.1 | 10.00.2 |
| (keV) | 6.37 (t) | ||
| (keV) | 0.22 (t) | ||
| (10-5) | 2.50.4 | 2.0 | 3.00.4 |
| /d.o.f. () | 1801.6/1817 (0.99) | ||
| relxill | |||
| (keV) | 113 | 126 | 117 |
| 1.73 | 1.69 | 1.74 | |
| () | 25 | 24 | 45 |
| log (erg cm s-1) | 2.90.2 | 2.90.2 | 2.80.1 |
| 0.160.03 | 0.15 | 0.12 | |
| (10-4) | 1.30.1 | 1.30.1 | 2.10.1 |
| /d.o.f. () | 1843.3/1813 (1.02) | ||
| relxillcp | |||
| (keV) | 26 | 26 | 26 |
| 1.82 | 1.77 | 1.810.01 | |
| () | 23 | 23 | 37 |
| log (erg cm s-1) | 3.0 | 3.10.2 | 3.0 |
| 0.140.03 | 0.130.03 | 0.09 | |
| (10-4) | 1.30.1 | 1.20.1 | 2.00.1 |
| /d.o.f. () | 1929.7/1813 (1.06) | ||
| reflkerr (slab geometry) | |||
| (keV) | 304 | 31 | 30 |
| 2.20.2 | 2.20.1 | 2.20.1 | |
| () | 26 | 269 | 42 |
| log (erg cm s-1) | 3.1 | 3.1 | 2.8 |
| 0.22 | 0.210.02 | 0.17 | |
| (10-3) | 6.40.2 | 5.3 | 10.1 |
| /d.o.f. () | 1850.4/1813 (1.02) | ||
| reflkerr (spherical geometry) | |||
| (keV) | 221 | 211 | 221 |
| 6.1 | 6.9 | 5.9 | |
| () | 25 | 22 | 31 |
| log (erg cm s-1) | 3.10.1 | 3.40.1 | 2.80.1 |
| 0.120.02 | 0.16 | 0.09 | |
| (10-3) | 6.7 | 4.8 | 10.70.1 |
| /d.o.f. () | 1913.5/1813 (1.05) | ||
| (erg cm-2 s-1) | 6.910-11 | 6.210-11 | 9.510-11 |
| (erg s-1) | 2.01044 | 1.81044 | 2.71044 |
 |
 |
The relxill model allows for relativistic reflection assuming a primary power law () continuum with an exponential cut-off at high energy (). A good fit is found (Table 2). The inner radii, where the reflection occurs, are inferred to be a few tens of . Moreover, the inferred very small reflection fraction values (ratio of intensity emitted towards the disc compared to that escaping to infinity) of 0.1–0.2, and the high energy cut-off values of 110–130 keV for the three epochs indicate that the lack of Compton hump is due to the weak reflection strength combined with the presence of a moderately low high-energy cut-off value.
We now investigate relativistic reflection models with a primary Comptonisation continuum shape, which is more physical and has a sharper high-energy roll-over compared to an exponential cut-off power-law. In addition, such models have the advantage of having the hot corona temperature () as a physical parameter rather than a phenomenological exponential cut-off energy.
We first apply the relxillcp model, which uses the nthcomp Comptonisation model (Zdziarski et al., 1996; Życki et al., 1999) as the incident spectrum.
The other physical parameters are the same as those in the relxill model presented above.
We find a good fit and infer similar hot corona temperatures of 26 keV for all three epochs (Table 2).
Then, we consider the reflkerr where the hard X-ray Comptonisation spectrum is computed with the compps model (Poutanen & Svensson, 1996), which appears to be a better description of thermal Comptonisation when compared to Monte Carlo simulations (Zdziarski et al., 2020). Moreover, reflkerr has, as physical parameter, either the Compton parameter () or the optical depth (). We choose to perform the fit with the optical depth as the direct inferred parameter. The temperature of the thermal seed photons () Comptonised by the hot corona is an explicit physical parameter of this model. Here, we assume that the seed photons are provided by the cold disc, then is fixed at 10 eV corresponding to the expected maximum temperature of the accretion disc around a black hole mass of 1.4108 M⊙ accreting at a 10% Eddington rate. In addition, reflkerr allows us to choose either a slab or a spherical geometry for the hot corona. The latter corresponds to numerous active sphere regions above the disc surface. The hard X-ray shape of the reflected component is calculated using ireflect convolved with compps rather than using xillvercp (see Niedźwiecki et al. 2019 for detailed explanations). Both models give good fits (Table 2, Fig. 3), albeit a larger value for the spherical geometry. Similar values of the hot corona temperature are measured for the three epochs: 30–31 keV and 21–22 keV for the slab and spherical geometries, respectively.
From , we can infer the corresponding Compton-parameter of the hot corona () using the relation =4(/511 keV) (Beloborodov, 1999). This correspond to 0.5 and 1.1 for the slab and spherical geometries, respectively.
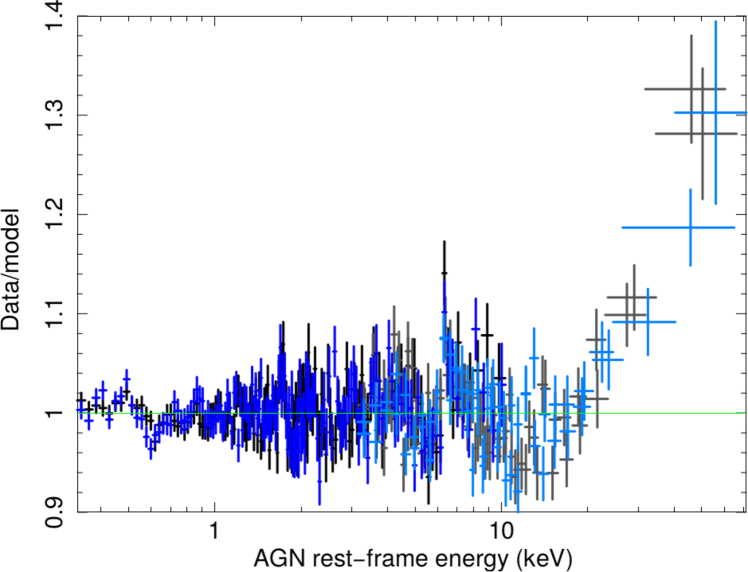
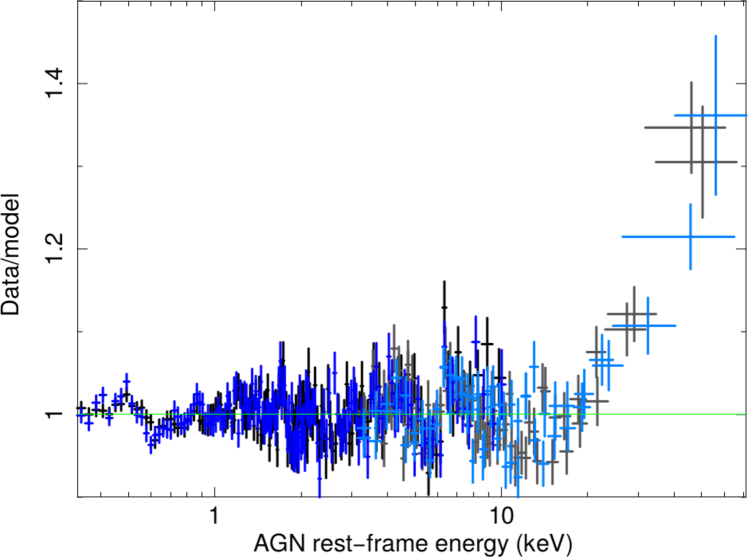
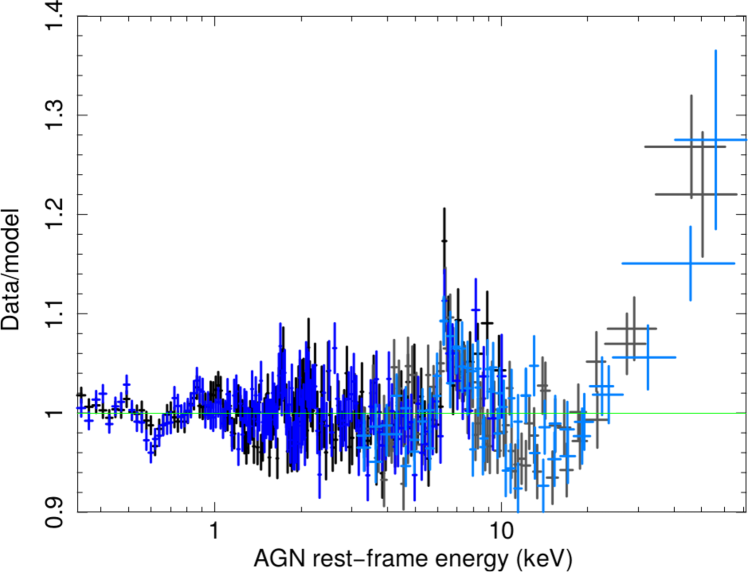
The extrapolation of the fits down to 0.3 keV for the 2019 and 2020 observations shows that the soft excess is not accounted for by any of these models, leaving a huge positive residual below 2 keV. Fig. 4 (top panel) displays the extrapolation of the fit with the relxill model for illustration purposes. We notice that over the 0.3–10 keV energy range, the relxill model provides a good fit (Table 4, Fig. 7), while when this model is applied to the whole 0.3–79 keV X-ray broad-band range, it fails to both reproduce the soft and hard X-ray shapes (Fig. 4, bottom panel). Similar results are found for other relativistic models (see appendix A for more details).
5 The X-ray broad band analysis of the 2019 and 2020 observations: A mixed Comptonisation and mild relativistic reflection modelling
We now aim to reproduce the X-ray broad-band spectra of Mrk 110 with a model where Comptonisation is the dominant process combined with a moderate relativistic reflection component (3; Reeves et al. 2021b). Indeed, as shown above, relativistic reflection alone is not able to explain the soft X-ray excess, thereby we investigate the alternative scenario where it (mainly) originates from a warm corona.
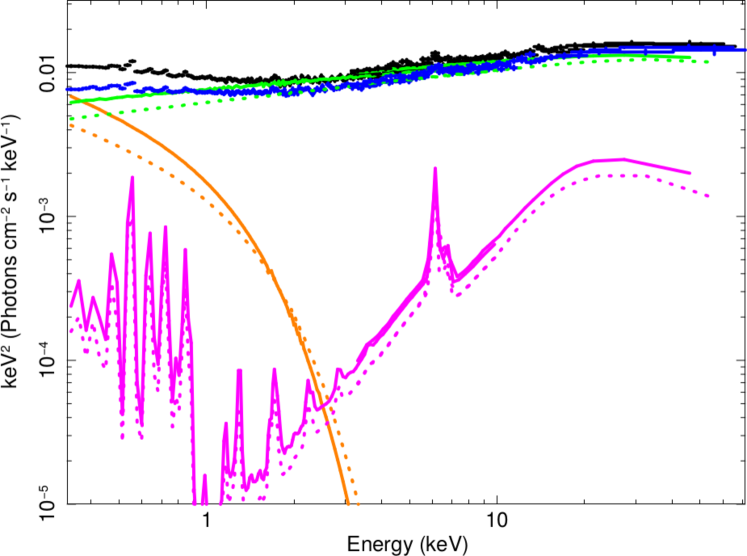
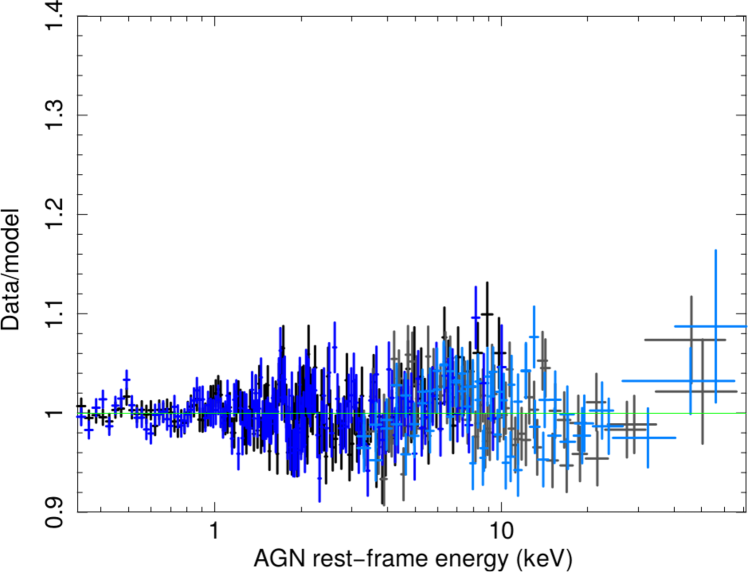
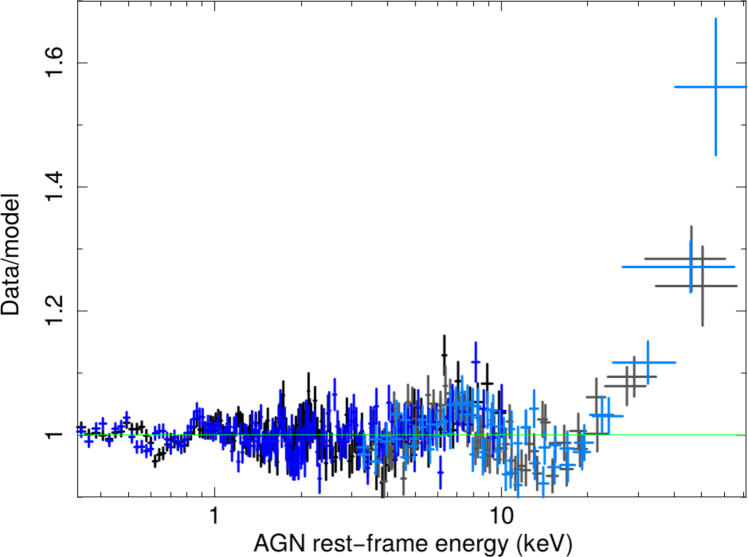
We apply to the two simultaneous XMM-Newton and NuSTAR spectra the following model: tbnew(Gal)[comptt(warm corona) + reflkerr(hot corona) + reflkerr(reflection)]. Since the compps model cannot be used for coronal temperature value of a few 100s of keV, we instead make use of the comptt model to take for the warm corona contribution and infer its temperature, , and optical depth, (Titarchuk, 1994). The reflkerr model is split into two components in order to disentangle and display the contributions of the hot corona and of the moderate relativistic reflection. For the former, the reflection strength is set to zero to only calculate the emission from the hot corona, while for the latter it is set to a negative value (here set to -0.2; 4) in order to only return the reflection component due to the illumination of the accretion disc by the hot corona. As in 4, we fix the seed photon temperature () at 10 eV corresponding to the maximum temperature expected from the cold disc. A slab geometry for the hot corona is assumed. The other parameters of the two reflkerr components are tied together for each epoch; we also set the emissivity index to the standard value of three and allow the inner radius, where the relativistic reflection occurs, to be free to vary. The hot corona temperature values have been fixed at those found in section 4. The disc inclination degree is still set to 9.9 degrees. The spin value is not constrained and then fixed at zero, but we checked that taking other values has no significant impact on other inferred parameter values. Since we previously found that the contribution of the molecular torus is negligible, we do not include it. We obtain an overall very good fit for the full X-ray broad-band energy range for both epochs (Fig. 5 top panel; Table 3). The inferred ionization parameter, =1.10.1, for the accretion disc agrees very well with that found for the O vii soft X-ray emission line ( 1.2; Reeves et al. 2021b), and is also consistent with the emission of the moderately broad neutral Fe K emission line too (Fig. 5, bottom panel, magenta curves). We derive warm Comptonised plasma temperature values of 0.3 keV and high optical depth values of 13 for the two epochs (Table 3). The variability of the soft X-ray excess between both epochs appears to be driven by its flux variability, being stronger when brighter (at 5.5 confidence level for the normalisation) rather than by any statistical change of its physical parameters.
| 2019 Nov | 2020 April | |
| (keV) | 0.260.02 | 0.300.03 |
| 13.8 | 12.9 | |
| 4.0 | 2.0 | |
| (keV) | 30 (f) | 31 (f) |
| 2.10.2 | 2.10.1 | |
| 7.60.110-3 | 6.20.110-3 | |
| log (erg cm s-1) | 1.10.1 (t) | |
| () | 58 | 35 |
| -0.2 (f) | -0.2 (f) | |
| 1.30.210-2 | 0.90.210-2 | |
| (a) | 11.010-11 | 9.110-11 |
| (b) | 3.21044 | 2.61044 |
| /d.o.f. | 1755.5/1620 | |
| 1.08 | ||
 |
 |
 |
Since there is a significant soft X-ray excess mainly due to the warm corona, these soft X-ray photons may be Comptonised by the hot corona too, as was found for PKS 0558-504 (Gliozzi et al., 2013). Therefore, we allow the input seed photon temperature, , to vary, but noting that it is tied between the 2019 and 2020 epochs due to the lack of significant variability of the temperature of the soft excess. The ionization parameter of the accretion disc is fixed at log =1.1, as was found above. The resulting seed photon temperature is =754 eV, which is much higher than the maximum temperature of an accretion disc around a supermassive black hole of mass 108 M⊙ and instead corresponds to a black hole mass of about three decades lower and accreting near Eddington. This value could instead represent an intermediate temperature between the seed photons from the cold disc and from the warm corona. Therefore, the seed photons Comptonised by the electrons of the hot corona may be provided by a combination of both the cold disc and the warm corona. This is strengthened by the correlation between both the hard and soft X-ray fluxes and the X-ray and UV fluxes inferred from the long-term Swift monitoring of Mrk 110 (Lobban et al. 2021, in prep.).
6 Summary and discussion
This paper presents the X-ray spectral analysis of two first simultaneous XMM-Newton and NuSTAR observations
of Mrk 110 performed within about a half-year interval on 2019 November 16–17 and in 2020 April 5–6.
A prominent and absorption-free smooth soft X-ray excess is observed in both observations, with the strongest one seen during the brightest observation (2019). This confirmed the presence of such a feature reported for the 2004 XMM-Newton observation that caught the source in a slightly higher-flux state (Boller et al., 2007; Boissay et al., 2016; Jiang et al., 2019; Gliozzi & Williams, 2020). A very similar spectral shape is found above 2–3 keV for both the continuum and the Fe K emission line.
The AGN rest-frame peak energy of the Fe K line is slightly redshifted toward 6.4 keV (=6.37 keV) and its width (FWHM=22 000 km s-1) indicates that the Fe K line could originate from the accretion disc, as inferred for the O vii soft X-ray emission line with the RGS data analysis (Reeves et al., 2021b). The Fe K profile is mainly produced by moderately broadened reflection arising from an almost face-on accretion disc. Indeed, only a very weak possible additional contribution from the molecular torus ( 20 eV) is found, as expected from the very small total luminosity of the torus measured by Ezhikode et al. (2017) which is one of the lowest found in their sample. Only much higher spectral resolution near 6.4 keV – as targeted by the future, calorimeter resolution, X-ray missions XRISM (XRISM Science Team, 2020) and ATHENA (Barret et al., 2018) – will provide an accurate determination of the genuine possible contributions of the BLR and torus regions.
The photon indices are found to be 1.7–1.8, confirming previous
measurements found with the 2004 XMM-Newton (Boller et al., 2007),
the 2007 Suzaku (Patrick et al., 2012; Walton et al., 2013; Mantovani et al., 2016; Waddell & Gallo, 2020), and the 2017 NuSTAR (Ezhikode et al., 2020; Panagiotou & Walter, 2020) observations.
Such values are much flatter than what are commonly observed in NLS1s, but are consistent with BLS1s (e.g., Porquet et al., 2004; Zhou & Zhang, 2010; Waddell & Gallo, 2020; Gliozzi & Williams, 2020). This is in agreement with the BLS1 classification of Mrk 110 (see 1), rather than a NLS1 one which is still commonly assumed in the literature.
Moreover, no Compton hump is observed in the NuSTAR spectra, with instead a flat spectrum and
a hard X-ray deficit above 30 keV, as was found previously for the deep January 2017 NuSTAR observation,
which caught the source in a slightly higher flux level (Panagiotou & Walter, 2020; Ezhikode et al., 2020).
The spectral analysis above 3 keV allows us to characterise the hot corona and the relativistic reflection emission properties. The deep January 2017 NuSTAR observation was also included in the simultaneous fit (Ezhikode et al., 2020; Panagiotou & Walter, 2020). From the relxill reflection model, assuming a primary exponential cut-off power-law continuum, we find moderate reflection strengths, 0.1–0.2, and high cut-off energies at 110–120 keV. These values are in very good agreement with those measured from the average long-term Swift BAT spectrum (Vincentelli et al., 2021). Applying relativistic reflection models assuming a primary Comptonisation continuum, we infer the hot corona temperature to be 26–31 keV ( 21–22 keV) and the optical depth to be 2 ( 6–7) for the slab (or spherical) geometry. From the spectral analysis, it is not possible to discriminate between either of the hot corona geometries, although the slab geometry provides a better fit. In the near future, X-ray polarimetry is expected to play an important role in such a framework (e.g., Schnittman & Krolik, 2010; Beheshtipour et al., 2017; Tamborra et al., 2018; Marinucci et al., 2019), thanks to, for example, IXPE (Weisskopf et al., 2016) and eXTP (Zhang et al., 2016). While the corona temperatures found for Mrk 110 are broadly consistent with the average ones found by Middei et al. (2019) from a sample of 26 AGN (with ¡¿=5021 keV and ¡¿=5323 keV for the slab and spherical geometry, respectively), it is likely to be located in the lower range of this distribution. However, its hot coronal temperature is not as low as the temperatures inferred for some AGN with much lower high-energy cut-offs, such as GRS 1734-292 (Tortosa et al., 2017), Ark 564 (Kara et al., 2017), and PDS 456 (Reeves et al., 2021a), where could be as low as 15 keV.
The lack of variability of the cut-off energy and of the hot corona temperature
may be due to the fact that during the 2017, 2019 and 2020 NuSTAR
observations the source was caught in a very similar hard X-ray flux state
with a 3–79 keV flux variability of only 1.5 between the 2017 and 2020 observations.
Therefore, any possible ‘hotter/cooler-when-brighter’
behavior cannot be confirmed here (Keek & Ballantyne, 2016; Ursini et al., 2016; Zhang et al., 2018; Middei et al., 2019; Kang et al., 2021).
Further broad-band X-ray monitoring, using the unique synergy of XMM-Newton and NuSTAR,
of this bright source, is mandatory for any definitive statement
about the physical and/or geometrical changes of the hot corona.
In particular, the observations would need to sample a larger flux range, as is observed
in the long-term Swift monitoring of Mrk 110 (Vincentelli et al., 2021, Lobban et al. 2021, in prep.).
The X-ray broad-band analysis shows that relativistic reflection models due to illumination on a constant density accretion disc alone cannot explain the X-ray broad-band XMM-Newton/NuSTAR spectra of Mrk 110 (appendix A); while,
data below 10 keV does not allow us to rule out pure relativistic reflection models (Fig. 7).
This confirms that X-ray broad-band spectra are mandatory to determine the physical processes at work
in disc-corona systems in AGN and their relative contributions (Matt et al., 2014; Porquet et al., 2018; Middei et al., 2020; Ursini et al., 2020; Walton et al., 2020).
Instead, the broad-band energy analysis demonstrates that warm and hot Comptonisation are the dominant processes,
though a moderate relativistic reflection component is also present.
The latter occurs at distance of a few 10s of (see 4 and Reeves et al. 2021b) and is responsible for both the moderately broad O vii and Fe K emission lines.
We also find that both the cold disc and the warm corona can provide seed photons to the hot corona.
Such a model combining Comptonisation and relativistic reflection has been proven to explain well the X-ray broad-band
spectra of several other AGN, such as: Ark 120 (Porquet et al., 2018), Fairall 9 (Lohfink et al., 2016),
Ton S180 (Matzeu et al., 2020), and ESO 362-G18 (Xu et al., 2021).
In a forthcoming article, we will study the spectral energy distribution of Mrk 110 from optical/UV to hard X-ray excess, as done previously done for the bare AGN Ark 120 (Porquet et al., 2019). This will allows us to take both the geometry and energetic of the warm/hot corona and the outer disc into account, to determine the accretion rate and to measure the black hole spin (e.g., Done et al., 2012; Kubota & Done, 2018).
The physical properties of the warm corona ( 0.3 keV, 13)
are compatible during both the 2019 and 2020 XMM/NuSTAR observations of Mrk 110, with only the warm corona flux
found to be significantly different (at 5.5 confidence level).
They are also consistent with those measured ( 0.3–1 keV, 10–20) in XMM-Newton AGN samples (e.g., Porquet et al., 2004; Bianchi et al., 2009), and in several individual X-ray broad-band spectral analysis of AGN, such as: Mrk 509 (Petrucci et al., 2013; Mehdipour et al., 2015), Ark 120 (Matt et al., 2014; Porquet et al., 2018), HE 1143-1810 (Ursini et al., 2020), NGC 4593 (Middei et al., 2019), Mrk 359 (Middei et al., 2020), TON S180 (Matzeu et al., 2020), and ESO 511-G030 (Ghosh & Laha, 2021).
Very recent state-of-the-art simulations have been performed showing
that a warm corona with such properties can indeed exist,
until sufficient internal mechanical heating is present, and that warm and hot coronae can co-exist (Petrucci et al., 2018, 2020; Ballantyne, 2020; Ballantyne & Xiang, 2020).
Moreover, these authors found that no strong absorption/emission lines are formed
which can well explain the absorption-free smooth soft X-ray shape
observed in bare AGN, or in most other AGN when the warm absorber and any
moderate relativistic reflection contributions have been removed.
Acknowledgements.
D. Porquet dedicates this paper to her friend and colleague, Cécile Renault, who has sadly passed away on April 2021. The authors thank the anonymous referee for useful and constructive comments. The paper is based on observations obtained with the XMM-Newton, and ESA science mission with instruments and contributions directly funded by ESA member states and the USA (NASA). This work made use of data from the NuSTAR mission, a project led by the California Institute of Technology, managed by the Jet Propulsion Laboratory, and funded by NASA. This research has made use of the NuSTAR Data Analysis Software (NuSTARDAS) jointly developed by the ASI Science Data Center and the California Institute of Technology. This work was supported by CNES.References
- Afanasiev et al. (2019) Afanasiev, V. L., Popović, L. Č., & Shapovalova, A. I. 2019, MNRAS, 482, 4985
- Arnaud (1996) Arnaud, K. A. 1996, in ASP Conf. Ser. 101: Astronomical Data Analysis Software and Systems V, ed. G. H. Jacoby & J. Barnes, 17
- Ballantyne (2020) Ballantyne, D. R. 2020, MNRAS, 491, 3553
- Ballantyne & Xiang (2020) Ballantyne, D. R. & Xiang, X. 2020, MNRAS, 496, 4255
- Baloković et al. (2018) Baloković, M., Brightman, M., Harrison, F. A., et al. 2018, ApJ, 854, 42
- Baloković et al. (2019) Baloković, M., García, J. A., & Cabral, S. E. 2019, Research Notes of the American Astronomical Society, 3, 173
- Barret et al. (2018) Barret, D., Lam Trong, T., den Herder, J.-W., et al. 2018, in Society of Photo-Optical Instrumentation Engineers (SPIE) Conference Series, Vol. 10699, Space Telescopes and Instrumentation 2018: Ultraviolet to Gamma Ray, ed. J.-W. A. den Herder, S. Nikzad, & K. Nakazawa, 106991G
- Beheshtipour et al. (2017) Beheshtipour, B., Krawczynski, H., & Malzac, J. 2017, ApJ, 850, 14
- Beloborodov (1999) Beloborodov, A. M. 1999, in Astronomical Society of the Pacific Conference Series, Vol. 161, High Energy Processes in Accreting Black Holes, ed. J. Poutanen & R. Svensson, 295
- Bian & Zhao (2002) Bian, W. & Zhao, Y. 2002, A&A, 395, 465
- Bianchi et al. (2009) Bianchi, S., Guainazzi, M., Matt, G., Fonseca Bonilla, N., & Ponti, G. 2009, A&A, 495, 421
- Bischoff & Kollatschny (1999) Bischoff, K. & Kollatschny, W. 1999, A&A, 345, 49
- Boissay et al. (2016) Boissay, R., Ricci, C., & Paltani, S. 2016, A&A, 588, A70
- Boller et al. (2007) Boller, T., Balestra, I., & Kollatschny, W. 2007, A&A, 465, 87
- Boroson & Green (1992) Boroson, T. A. & Green, R. F. 1992, ApJS, 80, 109
- Crummy et al. (2006) Crummy, J., Fabian, A. C., Gallo, L., & Ross, R. R. 2006, MNRAS, 365, 1067
- Dauser et al. (2013) Dauser, T., Garcia, J., Wilms, J., et al. 2013, MNRAS, 430, 1694
- Dauser et al. (2010) Dauser, T., Wilms, J., Reynolds, C. S., & Brenneman, L. W. 2010, MNRAS, 409, 1534
- Decarli et al. (2008) Decarli, R., Dotti, M., Fontana, M., & Haardt, F. 2008, MNRAS, 386, L15
- Done et al. (2012) Done, C., Davis, S. W., Jin, C., Blaes, O., & Ward, M. 2012, MNRAS, 2196
- Ezhikode et al. (2020) Ezhikode, S. H., Dewangan, G. C., Misra, R., & Philip, N. S. 2020, MNRAS, 495, 3373
- Ezhikode et al. (2017) Ezhikode, S. H., Gandhi, P., Done, C., et al. 2017, MNRAS, 472, 3492
- Fabian et al. (2012) Fabian, A. C., Zoghbi, A., Wilkins, D., et al. 2012, MNRAS, 419, 116
- Fukazawa et al. (2011) Fukazawa, Y., Hiragi, K., Mizuno, M., et al. 2011, ApJ, 727, 19
- Fürst et al. (2015) Fürst, F., Nowak, M. A., Tomsick, J. A., et al. 2015, ApJ, 808, 122
- García et al. (2016) García, J. A., Fabian, A. C., Kallman, T. R., et al. 2016, MNRAS, 462, 751
- Ghosh & Laha (2021) Ghosh, R. & Laha, S. 2021, ApJ, 908, 198
- Gliozzi et al. (2013) Gliozzi, M., Papadakis, I. E., Grupe, D., Brinkmann, W. P., & Räth, C. 2013, MNRAS, 433, 1709
- Gliozzi et al. (2011) Gliozzi, M., Titarchuk, L., Satyapal, S., Price, D., & Jang, I. 2011, ApJ, 735, 16
- Gliozzi & Williams (2020) Gliozzi, M. & Williams, J. K. 2020, MNRAS, 491, 532
- Goodrich (1989) Goodrich, R. W. 1989, ApJ, 342, 224
- Grupe (2004) Grupe, D. 2004, AJ, 127, 1799
- Harrison et al. (2013) Harrison, F. A., Craig, W. W., Christensen, F. E., et al. 2013, ApJ, 770, 103
- HI4PI Collaboration et al. (2016) HI4PI Collaboration, Ben Bekhti, N., Flöer, L., et al. 2016, A&A, 594, A116
- Jiang et al. (2019) Jiang, J., Fabian, A. C., Dauser, T., et al. 2019, MNRAS, 489, 3436
- Kang et al. (2021) Kang, J.-L., Wang, J.-X., & Kang, W.-Y. 2021, MNRAS, 502, 80
- Kara et al. (2017) Kara, E., García, J. A., Lohfink, A., et al. 2017, MNRAS, 468, 3489
- Keek & Ballantyne (2016) Keek, L. & Ballantyne, D. R. 2016, MNRAS, 456, 2722
- Kollatschny (2003) Kollatschny, W. 2003, A&A, 412, L61
- Kubota & Done (2018) Kubota, A. & Done, C. 2018, MNRAS, 480, 1247
- Liu et al. (2017) Liu, H. T., Feng, H. C., & Bai, J. M. 2017, MNRAS, 466, 3323
- Liu & Wang (2010) Liu, T. & Wang, J.-X. 2010, ApJ, 725, 2381
- Lohfink et al. (2016) Lohfink, A. M., Reynolds, C. S., Pinto, C., et al. 2016, ApJ, 821, 11
- Magdziarz et al. (1998) Magdziarz, P., Blaes, O. M., Zdziarski, A. A., Johnson, W. N., & Smith, D. A. 1998, MNRAS, 301, 179
- Mantovani et al. (2016) Mantovani, G., Nandra, K., & Ponti, G. 2016, MNRAS, 458, 4198
- Marinucci et al. (2019) Marinucci, A., Porquet, D., Tamborra, F., et al. 2019, A&A, 623, A12
- Matt et al. (2014) Matt, G., Marinucci, A., Guainazzi, M., et al. 2014, MNRAS, 439, 3016
- Matzeu et al. (2020) Matzeu, G. A., Nardini, E., Parker, M. L., et al. 2020, MNRAS, 497, 2352
- Mehdipour et al. (2015) Mehdipour, M., Kaastra, J. S., Kriss, G. A., et al. 2015, A&A, 575, A22
- Middei et al. (2019) Middei, R., Bianchi, S., Petrucci, P. O., et al. 2019, MNRAS, 483, 4695
- Middei et al. (2020) Middei, R., Petrucci, P. O., Bianchi, S., et al. 2020, A&A, 640, A99
- Murphy & Yaqoob (2009) Murphy, K. D. & Yaqoob, T. 2009, MNRAS, 397, 1549
- Niedźwiecki et al. (2019) Niedźwiecki, A., Szanecki, M., & Zdziarski, A. A. 2019, MNRAS, 485, 2942
- Osterbrock & Pogge (1985) Osterbrock, D. E. & Pogge, R. W. 1985, ApJ, 297, 166
- Panagiotou & Walter (2020) Panagiotou, C. & Walter, R. 2020, A&A, 640, A31
- Patrick et al. (2012) Patrick, A. R., Reeves, J. N., Porquet, D., et al. 2012, MNRAS, 426, 2522
- Petrucci et al. (2020) Petrucci, P. O., Gronkiewicz, D., Rozanska, A., et al. 2020, A&A, 634, A85
- Petrucci et al. (2013) Petrucci, P.-O., Paltani, S., Malzac, J., et al. 2013, A&A, 549, A73
- Petrucci et al. (2018) Petrucci, P.-O., Ursini, F., De Rosa, A., et al. 2018, A&A, 611, A59
- Piconcelli et al. (2005) Piconcelli, E., Jimenez-Bailón, E., Guainazzi, M., et al. 2005, A&A, 432, 15
- Planck Collaboration et al. (2020) Planck Collaboration, Aghanim, N., Akrami, Y., et al. 2020, A&A, 641, A6
- Ponti et al. (2012) Ponti, G., Papadakis, I., Bianchi, S., et al. 2012, A&A, 542, A83
- Porquet et al. (2019) Porquet, D., Done, C., Reeves, J. N., et al. 2019, A&A, 623, A11
- Porquet et al. (2018) Porquet, D., Reeves, J. N., Matt, G., et al. 2018, A&A, 609, A42
- Porquet et al. (2004) Porquet, D., Reeves, J. N., O’Brien, P., & Brinkmann, W. 2004, A&A, 422, 85
- Poutanen & Svensson (1996) Poutanen, J. & Svensson, R. 1996, ApJ, 470, 249
- Reeves et al. (2021a) Reeves, J. N., Braito, V., Porquet, D., et al. 2021a, MNRAS, 500, 1974
- Reeves et al. (2021b) Reeves, J. N., Porquet, D., Braito, V., Grosso, N., & Lobban, A. 2021b, A&A, 649, L3
- Ricci et al. (2014) Ricci, C., Ueda, Y., Ichikawa, K., et al. 2014, A&A, 567, A142
- Schnittman & Krolik (2010) Schnittman, J. D. & Krolik, J. H. 2010, ApJ, 712, 908
- Shu et al. (2010) Shu, X. W., Yaqoob, T., & Wang, J. X. 2010, ApJS, 187, 581
- Steiner et al. (2017) Steiner, J. F., García, J. A., Eikmann, W., et al. 2017, ApJ, 836, 119
- Strüder et al. (2001) Strüder, L., Briel, U., Dennerl, K., et al. 2001, A&A, 365, L18
- Tamborra et al. (2018) Tamborra, F., Matt, G., Bianchi, S., & Dovčiak, M. 2018, A&A, 619, A105
- Titarchuk (1994) Titarchuk, L. 1994, ApJ, 434, 570
- Tortosa et al. (2017) Tortosa, A., Marinucci, A., Matt, G., et al. 2017, MNRAS, 466, 4193
- Ursini et al. (2020) Ursini, F., Petrucci, P. O., Bianchi, S., et al. 2020, A&A, 634, A92
- Ursini et al. (2016) Ursini, F., Petrucci, P.-O., Matt, G., et al. 2016, MNRAS, 463, 382
- Verner et al. (1996) Verner, D. A., Ferland, G. J., Korista, K. T., & Yakovlev, D. G. 1996, ApJ, 465, 487
- Véron-Cetty et al. (2007) Véron-Cetty, M. P., Véron, P., Joly, M., & Kollatschny, W. 2007, A&A, 475, 487
- Vincentelli et al. (2021) Vincentelli, F. M., McHardy, I., Cackett, E. M., et al. 2021, MNRAS, 504, 4337
- Waddell & Gallo (2020) Waddell, S. G. H. & Gallo, L. C. 2020, MNRAS, 498, 5207
- Walton et al. (2020) Walton, D. J., Alston, W. N., Kosec, P., et al. 2020, MNRAS, 499, 1480
- Walton et al. (2013) Walton, D. J., Nardini, E., Fabian, A. C., Gallo, L. C., & Reis, R. C. 2013, MNRAS, 428, 2901
- Weisskopf et al. (2016) Weisskopf, M. C., Ramsey, B., O’Dell, S., et al. 2016, in Proc. SPIE, Vol. 9905, Space Telescopes and Instrumentation 2016: Ultraviolet to Gamma Ray, 990517
- Williams et al. (2018) Williams, J. K., Gliozzi, M., & Rudzinsky, R. V. 2018, MNRAS, 480, 96
- Wilms et al. (2000) Wilms, J., Allen, A., & McCray, R. 2000, ApJ, 542, 914
- XRISM Science Team (2020) XRISM Science Team. 2020, arXiv e-prints, arXiv:2003.04962
- Xu et al. (2021) Xu, Y., García, J. A., Walton, D. J., et al. 2021, ApJ, 913, 13
- Zdziarski et al. (1996) Zdziarski, A. A., Johnson, W. N., & Magdziarz, P. 1996, MNRAS, 283, 193
- Zdziarski et al. (2020) Zdziarski, A. A., Szanecki, M., Poutanen, J., Gierliński, M., & Biernacki, P. 2020, MNRAS, 492, 5234
- Zhang et al. (2018) Zhang, J.-X., Wang, J.-X., & Zhu, F.-F. 2018, ApJ, 863, 71
- Zhang et al. (2016) Zhang, S. N., Feroci, M., Santangelo, A., et al. 2016, in Society of Photo-Optical Instrumentation Engineers (SPIE) Conference Series, Vol. 9905, Space Telescopes and Instrumentation 2016: Ultraviolet to Gamma Ray, ed. J.-W. A. den Herder, T. Takahashi, & M. Bautz, 99051Q
- Zhou & Zhang (2010) Zhou, X.-L. & Zhang, S.-N. 2010, ApJ, 713, L11
- Życki et al. (1999) Życki, P. T., Done, C., & Smith, D. A. 1999, MNRAS, 309, 561
Appendix A Results of relativistic reflection modelling over the full X-ray broad-band range
In this appendix, we report the spectral analysis of the two simultaneous XMM-Newton and NuSTAR observations, considering only relativistic reflection models.
The fit using the relxill model between 0.3 and 10 keV provides a good statistical fit (Table 4, Fig. 7). However, it fails to reproduce the hard X-ray shape when data above 10 keV are included in the fit (Fig. 4, bottom panel), with very significant positive hard X-ray residuals for both observations above 30 keV (/d.o.f.=1954.8/1617, = 1.21). Since the fit is driven by the smooth soft X-ray emission, high values for the disc emissivity index, the photon power-law index and the reflection strength are required to reproduce it (Table 4, third column), at odds with the low values required to explain the data above 3 keV (Table 2).
We then investigate the scenario whereby the incident continuum of the relativistic component can be different from the direct observed one, as was proposed by Fürst et al. (2015) (though see also Steiner et al. 2017) to explain the X-ray spectrum of the X-ray binary GX 339-4 in low-luminosity, hard states. However, this requires a very significant divergence between the incident and observed spectral indices with =0.7 (at 22 confidence level) and =0.9 (at 14 confidence level) for the 2019 and 2020 observations, respectively. This means that this scenario appears highly unlikely to explain these observations of Mrk 110.
Alternatively, we investigate whether the broad-band X-ray spectra can be explained by a
lamppost geometry for the corona,
different disc properties (disc ionization gradient, density)
and/or a different continuum shape (Comptonisation).
Even relativistic reflection from two different medium properties, allowing for different ionisation parameters, have been investigated.
The modelling is performed thanks to the various available relxill model flavors.
However, none of them is able to simultaneously account for the soft X-ray excess and the hard X-ray emission shape
in both the 2019 and 2020 XMM-Newton and NuSTAR observations.
Similar results are found using the relativistic modelling package reflkerr (Niedźwiecki et al. 2019)
assuming either a coronal geometry (reflkerr) or a lamppost geometry (reflkerr_lp).
We note that even upon using an unblurred reflection component to take into account the very weak molecular torus contribution
– using xillver, mytorus (Murphy & Yaqoob 2009), or borus12 (Baloković et al. 2018, 2019) –
does not help to remove these huge hard X-ray residuals.
| Parameters | 0.3–10 keV | Full range |
|---|---|---|
| 0.981 | 0.996 | |
| 0.53 | 3.4 | |
| 2019 Nov | ||
| 7.7 | 8.2 | |
| 2.00.2 | 3.40.1 | |
| ()(a) | 3.8 | 2.90.1 |
| 2.280.01 | 1.99 | |
| (keV) | 113 (f) | 941 |
| log (erg cm s-1) | 0.04 | 3.00.1 |
| 6.8 | 4.9 | |
| 1.110-4 | 9.00.110-5 | |
| 2020 April | ||
| 7.7 | 8.1 | |
| 2.20.2 | 3.40.1 | |
| ()(a) | 3.4 | 2.8 |
| 2.16 | 1.900.01 | |
| (keV) | 126 (f) | 976 |
| log (erg cm s-1) | 0.09 | 3.00.1 |
| 4.9 | 2.90.1 | |
| 8.80.110-5 | 10.10.110-5 | |
| /d.o.f. | 1181.9/1099 | 1954.8/1617 |
| 1.08 | 1.21 | |
 |
Some examples of the above models are described below for illustration purposes (Table 5, Fig. 8):
-
•
Higher disc density: As demonstrated by García et al. (2016) (see also Jiang et al. 2019) high-density accretion disc models can lead to a larger soft excess compared to those in lower density discs. Therefore, we investigate whether the strong soft X-ray excess found in Mrk 110 can be explained by a higher accretion-disc density compared to the relxill model, which assumes a fixed constant disc density of 1015 cm-3. We use the relxilld model, which allows the density to be free to vary between 1015 cm-3 and 1019 cm-3. For this model the cut-off energy value is fixed at 300 keV and cannot be allowed to vary.
-
•
Lamppost geometry: The relxill model assumes a coronal geometry for the disc emissivity. Here, we test the alternative disc emissivity, that is to say the lamppost geometry using relxilllpion, with the X-ray point source being located at height above the black hole and outflowing at a velocity =/. Moreover, this model allows for a disc ionization gradient along the radial distance with a power-law shape, .
-
•
The reflkerr code: We also use the alternative relativistic reflection model (Niedźwiecki et al. 2019). We apply the reflkerrd model where the incident continuum is due to Comptonisation and a corona disc geometry is assumed. The disc density can vary between 1015 cm-3 and 1019 cm-3.
None of the above models provides a satisfactory account of both the soft and hard X-ray spectra of Mrk 110. Indeed large hard X-ray excess are found (as per Fig.8) for all the cases considered and the models cannot simultaneously fit the soft excess, while at the same time correctly account for the hard X-ray spectral shape. Thus, it appears most likely that the broad band X-ray spectra of Mrk 110 require the presence of both soft and hard Comptonisation to explain the spectral curvature, as is discussed in the main text.
 |
 |
 |
| Parameters | relxilld | relxilllpion | reflkerrd |
|---|---|---|---|
| 0.9930.001 | 0.9970.001 | 0.991 | |
| 4.50.1 | 2.1 | 2.90.2 | |
| log Ndisc (cm-3) | 17.00.1 | 17.10.1 | |
| ()(a) | 0.070.01 | ||
| (b) | 0.02 | ||
| 2019 Nov | |||
| 8.30.1 | 4.80.1 | ||
| 3.40.1 | 2.30.1 | ||
| (c) | 2.60.1 | 13.4 | |
| (c) | 1.2 | ||
| 1.920.01 | 2.010.01 | ||
| (keV) | 882 | ||
| 0.440.01 | |||
| (keV) | 300 (f) | 872 | |
| log (erg cm s-1) | 3.00.1 | 2.70.1 | 2.60.1 |
| 3.80.1 | 1.20.1 | ||
| 9.010-5 | 0.280.1 | 6.60.110-3 | |
| 2020 April | |||
| 8.00.1 | 4.50.1 | ||
| 3.30.1 | 2.10.1 | ||
| 2.70.1 | 10.3 | ||
| (c) | 1.1 | ||
| 1.840.01 | 1.880.01 | ||
| (keV) | 762 | ||
| 0.370.01 | |||
| (keV) | 300 (f) | 451 | |
| log (erg cm s-1) | 3.00.1 | 2.90.1 | 0.30.1 |
| 2.60.1 | 2.20.1 | ||
| 9.30.110-5 | 0.42 | 7.30.110-3 | |
| /d.o.f. | 2001.7/1618 | 2045.9/1621 | 2065.4/1616 |
| 1.24 | 1.26 | 1.28 | |