Sublattice spin reversal and field induced Fe3+ spin-canting across the magnetic compensation temperature in Y1.5Gd1.5Fe5O12 rare-earth iron garnet
Abstract
In the present work Fe3+ sublattice spin reversal and Fe3+ spin-canting across the magnetic compensation temperature (TComp) are demonstrated in polycrystalline Y1.5Gd1.5Fe5O12 (YGdIG) by means of in-field Mssbauer spectroscopy measurements. Corroborating in-field Mssbauer measurements, both Fe3+ & Gd3+ sublattice spin reversal has also been manifested with x-ray magnetic circular dichroism (XMCD) measurement in hard x-ray region. Moreover from in-field Mssbauer measurements, estimation and analysis of effective internal hyperfine field (Heff), relative intensity of absorption lines in a sextet elucidated unambiguously the signatures of Fe3+ spin reversal, their continuous transition and field induced spin-canting of Fe3+ sublattices across TComp. Further, Fe K- (Gd L3-) edge XMCD signal is observed to consist of additional spectral features, those are identified from Gd3+ (Fe3+) magnetic ordering, enabling us the extraction of both the sublattices (Fe3+ & Gd3+) information from a single edge analysis. The evolution of the magnetic moments as a function of temperature for both magnetic sublattices extracted either at the Fe K- or Gd L3-edge agree quite well with values that are extracted from bulk magnetization data of YGdIG and YIG (Y3Fe5O12). These measurements pave new avenues to investigate how the magnetic behavior of such complex system acts across the compensation point.
I Introduction
Rare-earth iron garnets (RIG), R3Fe5O12, where R is rare-earth (Y, & La-Lu) have become an important class of ferrimagnetic oxide materials finding a significant role in many microwave, bubble memories and magneto-optical device applications [1, 2, 3, 4]. Remarkable intriguing magnetic properties and their chemical stability with a large variety of elemental substitutions are one of the prime reasons for exploring these materials by various groups since their discovery [5, 6, 7, 8, 9, 10, 11]. Among these RIG systems, yttrium iron garnet (Y3Fe5O12, YIG) received a renewed attention in recent years owing to its low damping, low optical absorption, magneto-optical switching, thermoelectric generation in spin Seebeck insulators and other spintronics, magneonic based application [12, 13, 14, 15]. Doping of magnetic light rare-earths (e.g., Ce, Nd and Gd) or even heavier metals, such as Bi atoms, on the yttrium sites yield a significantly enhanced visible to near-infrared FaradayKerr rotation and magneto-optical (MO) figure of merit, without losing their magnetic insulator character [16, 17, 18, 19, 20].
RIG consist of three different magnetic ions viz., two in-equivalent Fe3+ions located at tetrahedral (d-) and octahedral (a-) oxygen polyhedron and the third one is the R3+ ion situated at dodecahedral (c) oxygen polyhedron [5]. The d- and a- site Fe3+ are always coupled anti-parallel and the resultant moment of Fe3+ is also coupled anti-parallel with the R3+. These two magnetic sublattices exhibit quite a different temperature dependance and as a result there exists a point in temperature at which the resultant Fe3+ magnetic moments are equal and opposite to the R3+ magnetic moments resulting in zero total magnetization [6], known as magnetic compensation temperature (TComp). Therefore, a thorough understanding of the macroscopic magnetic properties in RIG compounds is achieved from the knowledge of the different sublattices magnetization [21, 22, 23, 24, 25, 26, 27].
Usually at low temperatures i.e., TTComp the R3+ moments dominate the macroscopic magnetic properties and align along the externally applied magnetic field (Hext), whereas for intermediate temperature, TCompTTC (Curie temperature) it is the resultant Fe3+ moments which will dominate and align along the Hext. The net magnetization (M) always align along the Hext. Therefore, the magnetic sub-lattices rearrange accordingly whether the temperature of the system is below or above the TComp as shown schematically in Figure. 1. Now, if the R-atom is non-magnetic (like as in YIG systems) or for temperatures above the TComp, the dominant Fe3+ at d- sites decide the resultant magnetization direction, whereas for temperatures below TComp, the d- site Fe3+ moments will be in opposite direction to Hext. However, the competition between Hext that always tend to align all the moments parallel to it and the strong anti-ferromagnetic super-exchange interaction between the sublattices result field induced spin-canted phase (between magnetic R3+ and resultant Fe3+) close to TComp, which is shown to be a second-order phase transition in literature [23, 21, 22].


In this context, the in-field Mssbauer spectroscopy is an ideal method to track the evolution of Fe3+ sublattice magnetization, demonstrate their inversion across TComp and also probe the spin-canting unambiguously by analyzing the variation of effective internal field (Heff), which is the vector sum of internal hyperfine field (Hint), Hext & the relative line intensities in a given six-line pattern [28, 29]. However, there seems to be no systematic in-field Mssbauer study across TComp in RIG systems in literature. Most of the Mssbauer literature focused on the estimation of cation distribution in RIG systems, except the work of Stadnik et al., and Seidel et al [30, 31]. Seidel et al., reported that there is no spin-canting in Gd3Fe5O12 across TComp with zero-field Mssbauer measurements [30] and Stadnik et al., reported canting of the Fe3+ spins in Sc doped Eu3Fe5O12 with in-field Mssbauer measurements [31].
The in-field Mssbauer measurements reported in this paper, are further complimented by x-ray magnetic circular dichroism (XMCD) measurements. In RIG systems, most of the XMCD investigation is focused on the transition metal (TM) L2,3 (2p3d) and R- M4,5 (3d4f) absorption edges, since in both cases the magnetism is directly probed via electric-dipole transitions [24, 25]. Recently studies have shown that due to significant improvement in the 3rd generation synchrotron, the XMCD method is also possible to be carried out with much higher signal to noise ratio even at hard x-rays regime i.e., across the Fe-K and R L-edges [32]. Further it is shown in the previous literature that Fe K-edge (R L-edge) XMCD signal is strongly influenced by the R-atom (Fe-atom) magnetic ordering in rare-earth iron compounds such as RFe2, NdFeB and RIGs. Therefore, by performing XMCD measurements in hard x-ray region across a single edge, one would be able to get the element specific magnetic information from both Fe and R sublattices in these type of compounds [21, 33, 34, 22, 35].

The present work reports the temperature dependent in-field Mssbauer spectroscopy and XMCD measurements on polycrystalline Y1.5Gd1.5Fe5O12 (YGdIG) and Y3Fe5O12 (YIG) samples with the aim of tracing sublattice spin across TComp, looking for the possible spin-canting across TComp and decomposition of XMCD data into Gd-like and Fe-like spectra from a single edge (i.e., Gd L3-edge or Fe K-edge) measurement.
II Experimental
Polycrystalline Y1.5Gd1.5Fe5O12 and Y3Fe5O12 samples are prepared with conventional solid-state-reaction method starting with high purity (99.9%) oxide precursors. The structural characterization of the prepared samples is carried out with Brucker D8-Discover x-ray diffraction system equipped with LynxEye detector and Cu-K source. Mssbauer measurements are carried out in transmission mode using a standard PC-based Mssbauer spectrometer equipped with a WissEl velocity drive in constant acceleration mode. The velocity calibration of the spectrometer is done with natural iron absorber at room temperature. For the low temperature high magnetic field Mssbauer measurements, the sample is placed inside a Janis superconducting magnet and an Hext is applied parallel to the -rays. Bulk magnetization measurements are performed with vibrating sample magnetometer (VSM). X-ray absorption spectroscopy (XAS) measurements are carried out at beamline P09 at PETRA III (DESY) at low temperature at the Gd L3 and Fe K-absorption edges in transmission geometry in which both incident and transmitted x-ray beams are recorded using silicon photo-diodes. The pellets, prepared from samples with suitable amount of boron nitrate add-mixer, are cooled down by an ARS cryostat with temperature range between 5 to 300 K. XASXMCD measurements were performed fast-switching the beam helicity between left and right circular polarization to improve the signal-to-noise ratio. The dichroic signal is revealed when the difference in the absorption spectra for left and right circularly polarized radiation is performed [36]. In order to align the domains and to correct for nonmagnetic artifacts in the XMCD data, an external magnetic field of approximately 1 T was applied parallel and antiparallel to the incident beam wave vector .
III Results
III.1 Structural and magnetic characterization
Figure. 2(a) shows the XRD patterns of the YIG and YGdIG samples and the data confirms the phase purity of the prepared samples. Further, the XRD data is analyzed with FullProf Rietveld refinement [37] program considering the Ia-3d space-group for the estimation of lattice parameters and the obtained lattice parameters are 12.374(1) and 12.424(1) for YIG and YGdIG, respectively, which also match with the literature [38]. Figure. 2(b) shows the temperature dependent (M-T) magnetization data of the YIG and YGdIG samples. One can clearly see the magnetic compensation temperature (TComp) for YGdIG at about 126 K and no such signature is seen for YIG as expected. Since, the bulk magnetization data of YIG is considered to be coming only from Fe3+ moments this gives a rough idea about the contribution of Fe3+ sublattice to the total magnetization in YGdIG. So, one can get an estimated contribution of Gd3+ sublattice to the overall moment in YGdIG by suitably subtracting the bulk magnetization data of YGdIG from YIG data. This method is employed to cross-check the reliability of the XMCD data analysis results as discussed in the later sections.


| T (K) | (mm/s) | E(mm/s) | Hint(T) | A23 | % Area | Fe3+ |
|---|---|---|---|---|---|---|
| 0.01 | 0.02 | 0.1 | 2 | Site | ||
| 5 | 0.29 | 0.01 | 49.5 | 2.00 | 58 | d |
| 0.57 | 0.11 | 56.9 | 2.00 | 42 | a | |
| 116 | 0.27 | 0.01 | 48.5 | 2.00 | 58 | d |
| 0.56 | 0.10 | 56.4 | 2.00 | 42 | a | |
| 125 | 0.26 | -0.01 | 48.3 | 2.00 | 57 | d |
| 0.56 | 0.13 | 56.4 | 2.00 | 43 | a | |
| 127 | 0.26 | 0.02 | 48.4 | 2.00 | 57 | d |
| 0.55 | 0.08 | 56.3 | 2.00 | 43 | a | |
| 136 | 0.26 | 0.01 | 48.4 | 2.00 | 58 | d |
| 0.54 | 0.09 | 56.3 | 2.00 | 42 | a | |
| 150 | 0.25 | 0.01 | 48.2 | 2.00 | 59 | d |
| 0.55 | 0.08 | 56.3 | 2.00 | 41 | a |
| T (K) | Heff(T) | A23 | % Area | Fe3+ | Phase | |
|---|---|---|---|---|---|---|
| 0.1 | 0.1 | 2 | Site | |||
| 5 | 53.2 | 0.00 | 58 | d | FePhase1 | |
| 54.9 | 0.00 | 42 | a | FePhase1 | ||
| 130 | 51.6 | 1.22 | 25 | d | FePhase1 | |
| 53.8 | 1.22 | 17 | a | FePhase1 | ||
| 45.3 | 1.22 | 34 | d | FePhase2 | ||
| 61.1 | 1.22 | 24 | a | FePhase2 | ||
| 150 | 43.6 | 0.10 | 59 | d | FePhase2 | |
| 61.1 | 0.10 | 41 | a | FePhase2 |
III.2 Mssbauer spectroscopy results
Figure. 3 shows the temperature dependent Mssbauer spectra of YGdIG measured across TComp. One can clearly see two components corresponding to Fe3+ sublattices located at d- and a- sites and the obtained hyperfine parameters match with literature values of garnet [40, 30, 41]. Values of Hint, area fraction and A23 are shown in Table-1. Further, the area fraction of Fe3+ at d- and a- sites is found to remain same at all the temperatures and the values of A23 (area ratio of second and third lines in a given sextet) is fixed as 2.0 in accordance with the random distribution of corresponding to the powder samples measured in zero-field conditions [28]. However, the in-field Mssbauer measurements across TComp with 5 T external magnetic field applied parallel to the -rays, as shown in Figure. 4, reveal a very interesting information regarding the reversal of Fe3+ moments, spin-canting etc., as elaborated in section-IV.


III.3 Hard x-ray magnetic circular dichroism (XMCD) results
Figures. 5 and 6 show the XMCD data measured at the Fe K- and Gd L3- edges of YGdIG sample at different temperatures. For the comparison purpose, the Fe K-edge XMCD data of YIG sample is also shown in Figure. 5. As a representative, XAS data collected at the Fe K-edge and at the Gd L3- edges for the YGdIG sample are also shown in Figure. 5 (a) and 6 (a), respectively. A clear reversal of XMCD signals at Fe K- and Gd L3- edges are observed in YGdIG sample when measured at 5 and 290 K i.e., far below and above the TComp. Additional features that are only observed in the Fe K-edge spectra of YGdIG in between 7141 and 7154 eV photon energy, could be due to induced signal of Gd magnetic moments. It may be noted that such a clear signal of rare-earth contribution in Fe K-edge XMCD data was not detected previously in RIG systems, even though the opposite case i.e., Fe contribution in rare-earth L-edge XMCD is observed in many RIG systems [42, 43, 44, 22]. However, unlike RIG systems, the rare-earth contribution was observed at Fe K-edge XMCD data in rare-earth transition metal intermetallics (RTI), which could be due to the fact that the R(5d) electronic orbitals hybridize with the outermost states of absorbing Fe(3d) in RTI systems whereas it is mediated via oxygen in case of RIG systems [33, 34, 21]. The direct subtraction method from a reference spectrum (YIG, where Y nonmagnetic at c- site) is employed to separate out the Gd contribution at every temperature, as shown in Figure. 5(i)-(p), and is further discussed in the following sections.
Gd L3- edge XMCD spectrum can broadly be characterized by the structures labeled as P1, P2, and P3 (Figure. 6). The peak P1, in the lower energy region that is eventually buried in the profile of peak P2 at low temperatures, can be ascribed to the Fe contribution that becomes visible at temperatures higher than TComp where Gd magnetic moments are weak. Whereas, P2 and P3 mainly originate from the Gd electronic states [42, 43, 44]. The Gd L3- edge XMCD spectra are analyzed with singular value decomposition (SVD) method to extract the Fe3+ contribution as discussed in the following section.
IV Discussions
The in-field Mssbauer data (Figure. 4) is analyzed considering two Fe sites at temperatures well below and above TComp (5, 100 and 150 K) which correspond to d- and a- sites of Fe3+. Representative Heff values for some of the temperatures are shown in Table-II. .Hext will be added (subtracted) to the Hint of a- site above (below) the TComp and it will be vice versa for the d- site as shown schematically in Figure. 1. Hence, the Hext for the two spectral components corresponding to d- and a- sites will be very close to each other below TComp, whereas significant difference will be observed above TComp. As a result of this, one would observe well resolved two sextets corresponding to d- and a- sites above TComp and a single broad sextet due to the overlapping components below TComp as shown in Figure. 4, specifically at temperatures of 150 K and 5 K. Therefore, the obtained Heff values which is the vector sum of Hint and Hext unambiguously demonstrates the reversal of Fe3+ sublattice across TComp in YGdIG, which can be generalized to all RIG systems exhibiting magnetic compensation.
However, an inspection of the in-field Mssbauer data close to TComp reveal the presence of more than two components. This is very clearly seen at 127, 130, 136 K and a careful inspection also reveals the presence of these components at 116 and 120 K as shown in Figure. 4. The spectra could be resolved into four sites corresponding to four Fe3+ sublattices of two ferrimagnetic phases of YGdIG i.e., the phases with resultant Fe3+ moment aligned along (Fephase1) and opposite (Fephase2) to Hext across TComp. As mentioned in the preceding section, the significant contrast between these two phases in terms of Heff enable the quantitative study of their evolution with temperature. In view of this, the data at these temperatures is fitted with four sextets and the obtained phase fractions of these two phases (Fephase1, Fephase2) is plotted in Figure. 7. As the temperature is changing, one can see that there is a gradual change in the area fraction of these phases indicating a continuous spin reversal across TComp.

In addition to this information, the inspection of in-field Mssbauer data close to TComp reveal the presence of considerable intensity for the second and fifth lines (corresponding to m=0 transitions) of a given sextet unlike the data of 5, 100 and 150 K i.e., well below and above TComp. Quantitatively this is estimated by A23 parameter for given sextet and the value of A23 is found to be zero at temperatures 5, 100 and 150 K indicating a collinear magnetic structure of Fe3+ [28]. However, the in-field Mssbauer data close to TComp is fitted keeping A23 parameter as variable and is constrained to be same for all the sites. The obtained variation of A23 as a function of temperature is also shown in Figure. 7 and it is interesting to note that the magnetic structure deviates from collinear configuration as one approaches TComp. This is considered to be a signature of spin-canting as shown recently from the magnetic circular dichroism [22] and spin Hall magnetoresistance [45] experiments. Considering two-sublattice model (Fe3+ and R3+ sublattices), simulated magnetic field versus temperature (H-T) phase diagram of compensated RIG systems clearly show the region of collinear, canted ferrimagnetic and aligned phases [23, 21, 45, 22]. The present in-field Mssbauer study indicates the presence of such canted phases across TComp unambiguously. Across this region of temperatures, the two Fephase1 and Fephase2 phases are mixed up with forming similar but opposite angle at a given temperature with respect to Hext. As a consequence, resultant Fe moment exhibits a continuous rotation across this canted region in accordance with the two sublattice model as shown schematically in Fig. 4. It may be emphasized here that even the XMCD data might not be able to distinguish the mixing of these two components as it measures resultant projection of the Fe magnetic moments along the beam direction.

Apart from showing a clear reversal of the magnetic signals at the Fe K- and the Gd L3- edges in YGdIG acorss the TComp, the XMCD spectra reported in Figure. 5and 6 are employed to extract quantitative information about both the sublattices magnetization from a single absorption edge measurement. Mainly two approaches are used in literature to extract the spectral contributions of different sublattices from such complicated XMCD data [33, 44]. Subtraction method in which the magnetic dichroic signal from the investigated system is subtracted from a reference sample has been extensively exploited and has provided very reliable interpretation [33].In our present work, XMCD spectra obtained at the Fe K-edge for the YIG sample are considered as reference to estimate the magnetic contribution from the Gd ions at the Fe K-edge. Using this simple methodology, the Gd magnetic contribution can be obsevred via XMCD at the Fe K-edge as shown in Figure. 5(i)-(p).
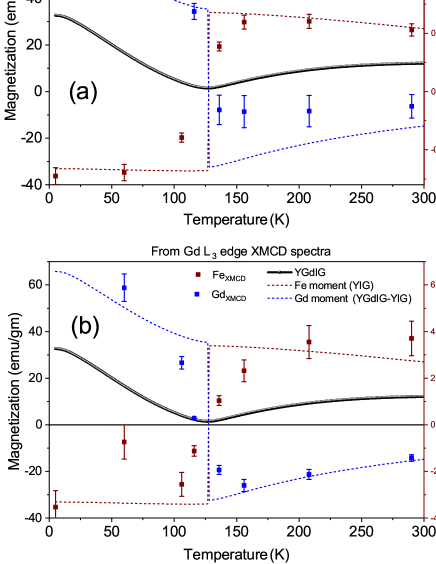
In order to check the reliability of thus obtained Gd3+ contribution, the total area of these features observed at the Fe K post-edge are compared with the temperature variation of Gd3+ moment, as calculated from temperature dependent bulk magnetization data of YGdIG and YIG.The results using this approach are summarized in Fig. 9(a). The bulk magnetization data of YIG is considered to have its origin basically from the Fe3+ ions since we can assume that both Y3+ and O2- ions have negligible magnetic moments and their hybridization with the Fe3+ ions does not play an important role to the total magnetism of the system. Therefore, subtracting bulk magnetization data of YGdIG from the YIG data (Fig. 2), results magnetic signal which is primarily from the Gd3+ ions. The sign of the obtained sublattice magnetization as a function of temperature is changed according to their magnetization direction w.r.t Hext across TComp(Fig. 9 dashed line). The extracted Gd3+ XMCD amplitude (blue dot Fig. 9(a)) from Fe K edge XMCD data (using direct subtraction method) almost follow the trend of Gd3+ moment variation as a function of temperature below the TComp. However, above TComp Gd3+ magnetic contribution to Fe K-edge XMCD data is weaker and hence giving discrepancy to the comparison. We have also compared Fe XMCD value (red symbols in Fig. 9(a), peak height of the XMCD dispersion spectra located at the pre-edge region ( 7115 eV) with the temperature variation of the Fe-only magnetization data from the YIG sample and it was observed similar trend (red dashed line) as shown in Fig. 9(a).
As mentioned above the direct subtraction method or linear combination fit according to individual magnetic moment value as function of temperature are mostly employed in literature to decompose the XMCD spectra of RIG and RTI systesm [33, 44]. However, recently it is shown that the application of singular value decomposition (SVD) rationalizes previous approaches in a more general framework and simplifies the exploration of magnetic phase diagram of such compounds [22, 35]. One can analyze the shape and amplitude of the hidden components in XMCD data from correlated data set. Cornellius et al., successfully analyzed and separated Fe contribution from the Er L2,3 edges using SVD method [22]. The same procedure is adopted in the present work also to de-convolute Fe3+ contribution from temperature dependence Gd L3 edge XMCD data set (Figure. 6).
According to SVD theorem any data matrix A(mn) can be decomposed into three matrices as A=UVT where and are orthogonal matrices and is diagonal matrix of singular values. We have used eight XMCD spectra of Gd L3- edge over the temperature range (5-300 K) to form data matrix A and MATLAB software is used to perform the SVD on the data matrix A to find the U, V, . Only the first two eigenvectors or basis which are dominated over the noise level are used to reconstruct the original data as shown in Figure. 8. The reconstructed plot along with separated Fe and Gd like components to the original Gd L3- edge XMCD data are shown in Figure. 6. It is to be mentioned that spectral features of Fe contribution from Gd L3- edge XMCD obtained by SVD in the present work match with previous literature[22, 44] and the XMCD signal amplitude (red symbols), as shown in Fig. 9(b), is also following the similar temperature variation as of Fe sublattice magnetization data (red dashed line) from YIG in terms of its magnitude and direction. The SVD separated Gd XMCD amplitudes (blue symbols) at indicated temperature and corresponding temperature variation of Gd only sublattice magnetization (blue dashed line) are also shown in the Fig. 9(b).
V Conclusions
In conclusion, in the present work in-field Mssbauer spectroscopy is employed to demonstrate the Fe3+ spin reversal and signatures of spin-canting across the magnetic compensation temperature (TComp) in Y1.5Gd1.5Fe5O12. The Mssbauer data also clearly demonstrate the continuous rotation of Fe3+ moment across the Tcomp, which is nothing but a second order field induced phase transition. Inversion of sublattice spin across the TComp is also confirmed by Fe K- and Gd L3- edge XMCD data.
The quantitative estimation of the two sublattice contribution viz., Fe3+ and Gd3+ to the net magnetization is separated out from XMCD spectra collected from either Fe K- or Gd L3- edge using direct subtraction method from reference spectrum and SVD method, respectively i.e., in RIG systems one can probe both Fe3+ and Gd3+ magnetism from only single edge XMCD measurements in the hard x-ray region.
VI Acknowledgments
We acknowledge DESY (Hamburg, Germany), a member of the Helmholtz Association HGF, for the provision of experimental facilities. Parts of this research were carried out at beamline P09. Beamtime was allocated for proposal I-20180676 within the India@DESY collaboration in Photon Science. VRR and MK would like to acknowledge the financial support by the Department of Science and Technology (Government of India) provided within the framework of the India-DESY Collaboration. MK thank Mr. Anil Gome and Mr. Deepak Prajapat for the help with LTHM Mssbauer measurements. Mr. Kranti Kumar Sharma is thanked for M-T data.
References
- Sekijima et al. [1999] T. Sekijima, H. Kishimoto, T. Fujii, K. Wakino, and M. Okada, Magnetic, optical and microwave properties of rare-earth-substituted fibrous yttrium iron garnet single crystals grown by floating zone method, Japanese journal of applied physics 38, 5874 (1999).
- Hagedorn et al. [1975] F. Hagedorn, S. Blank, and R. Peirce, Dynamic conversion of magnetic bubble domain walls at megahertz frequencies in epitaxial garnet films, Applied Physics Letters 26, 206 (1975).
- Bobeck et al. [1975] A. H. Bobeck, P. I. Bonyhard, and J. E. Geusic, Magnetic bubbles—an emerging new memory technology, Proceedings of the IEEE 63, 1176 (1975).
- Booth and White [1984] R. Booth and E. White, Magneto-optic properties of rare earth iron garnet crystals in the wavelength range 1.1-1.7 m and their use in device fabrication, Journal of Physics D: Applied Physics 17, 579 (1984).
- Néel [1971] L. Néel, Magnetism and local molecular field, Science 174, 985 (1971).
- Geller et al. [1965] S. Geller, J. Remeika, R. Sherwood, H. Williams, and G. Espinosa, Magnetic study of the heavier rare-earth iron garnets, Physical Review 137, A1034 (1965).
- Myers et al. [1968] S. M. Myers, R. Gonano, and H. Meyer, Sublattice magnetization of several rare-earth iron garnets, Physical Review 170, 513 (1968).
- van der Laan et al. [1986] G. van der Laan, B. T. Thole, G. A. Sawatzky, J. B. Goedkoop, J. C. Fuggle, J.-M. Esteva, R. Karnatak, J. Remeika, and H. A. Dabkowska, Experimental proof of magnetic x-ray dichroism, Physical Review B 34, 6529 (1986).
- Campbell et al. [2020] D. Campbell, C. Xu, T. Bayaraa, and L. Bellaiche, Finite-temperature properties of rare-earth iron garnets in a magnetic field, Physical Review B 102, 144406 (2020).
- Bayaraa et al. [2019] T. Bayaraa, C. Xu, D. Campbell, and L. Bellaiche, Tuning magnetization compensation and curie temperatures in epitaxial rare earth iron garnet films, Physical Review B 100, 214412 (2019).
- Bayaraa et al. [2020] T. Bayaraa, C. Xu, Y. Yang, H. Xiang, and L. Bellaiche, Magnetic-domain-wall-induced electrical polarization in rare-earth iron garnet systems: A first-principles study, Physical Review Letters 125, 067602 (2020).
- Cornelissen and Van Wees [2016] L. Cornelissen and B. Van Wees, Magnetic field dependence of the magnon spin diffusion length in the magnetic insulator yttrium iron garnet, Physical Review B 93, 020403 (2016).
- Stupakiewicz et al. [2019] A. Stupakiewicz, K. Szerenos, M. Davydova, K. Zvezdin, A. Zvezdin, A. Kirilyuk, and A. Kimel, Selection rules for all-optical magnetic recording in iron garnet, Nature communications 10, 1 (2019).
- Uchida et al. [2010] K.-i. Uchida, J. Xiao, H. Adachi, J.-i. Ohe, S. Takahashi, J. Ieda, T. Ota, Y. Kajiwara, H. Umezawa, H. Kawai, et al., Spin seebeck insulator, Nature materials 9, 894 (2010).
- Wu et al. [2018] H. Wu, L. Huang, C. Fang, B. Yang, C. Wan, G. Yu, J. Feng, H. Wei, and X. Han, Magnon valve effect between two magnetic insulators, Physical review letters 120, 097205 (2018).
- Kehlberger et al. [2015] A. Kehlberger, K. Richter, M. C. Onbasli, G. Jakob, D. H. Kim, T. Goto, C. A. Ross, G. Götz, G. Reiss, T. Kuschel, et al., Enhanced magneto-optic kerr effect and magnetic properties of epitaxial thin films, Physical Review Applied 4, 014008 (2015).
- Shahrokhvand et al. [2012] S. Shahrokhvand, A. Rozatian, M. Mozaffari, S. Hamidi, and M. Tehranchi, Preparation and investigation of Ce:YIG thin films with a high magneto-optical figure of merit, Journal of Physics D: Applied Physics 45, 235001 (2012).
- Kuila et al. [2021] M. Kuila, U. Deshpande, R. Choudhary, P. Rajput, D. Phase, and V. Raghavendra Reddy, Study of magneto-optical activity in cerium substituted yttrium iron garnet (Ce:YIG) epitaxial thin films, Journal of Applied Physics 129, 093903 (2021).
- Egashira et al. [1971] K. Egashira, T. Manabe, and H. Katsuraki, Effects of foreign and ions on the magneto-optical properties of gadolinium iron garnet, Journal of Applied Physics 42, 4334 (1971).
- Vertruyen et al. [2008] B. Vertruyen, R. Cloots, J. Abell, T. Jackson, R. Da Silva, E. Popova, and N. Keller, Curie temperature, exchange integrals, and magneto-optical properties in off-stoichiometric bismuth iron garnet epitaxial films, Physical Review B 78, 094429 (2008).
- Strohm et al. [2012] C. Strohm, T. Roth, C. Detlefs, P. van der Linden, and O. Mathon, Element-selective magnetometry in ferrimagnetic erbium iron garnet, Physical Review B 86, 214421 (2012).
- Strohm et al. [2019] C. Strohm, P. Van Der Linden, O. Mathon, and S. Pascarelli, Simultaneous observation of the er-and fe-sublattice magnetization of ferrimagnetic in high magnetic fields using x-ray magnetic circular dichroism at the Er edges, Physical review letters 122, 127204 (2019).
- Clark and Callen [1968] A. E. Clark and E. Callen, Néel ferrimagnets in large magnetic fields, Journal of Applied Physics 39, 5972 (1968).
- Rudolf et al. [1992] P. Rudolf, F. Sette, L. Tjeng, G. Meigs, and C. Chen, Magnetic moments in a gadolinium iron garnet studied by soft-x-ray magnetic circular dichroism, Journal of magnetism and magnetic materials 109, 109 (1992).
- Goering et al. [2001] E. Goering, S. Gold, and G. Schutz, Ho-Fe-garnet soft xmcd measurements below and above the compensation temperature, Journal of synchrotron radiation 8, 422 (2001).
- Deb et al. [2019] M. Deb, E. Popova, and N. Keller, Different magneto-optical response of magnetic sublattices as a function of temperature in ferrimagnetic bismuth iron garnet films, Physical Review B 100, 224410 (2019).
- Casals et al. [2016] B. Casals, M. Espínola, R. Cichelero, S. Geprägs, M. Opel, R. Gross, G. Herranz, and J. Fontcuberta, Untangling the contributions of cerium and iron to the magnetism of Ce-doped yttrium iron garnet, Applied Physics Letters 108, 102407 (2016).
- Chappert [1974] J. Chappert, High field mössbauer spectroscopy, Le Journal de Physique Colloques 35, C6 (1974).
- Chinnasamy et al. [2001] C. Chinnasamy, A. Narayanasamy, N. Ponpandian, K. Chattopadhyay, K. Shinoda, B. Jeyadevan, K. Tohji, K. Nakatsuka, T. Furubayashi, and I. Nakatani, Mixed spinel structure in nanocrystalline , Physical Review B 63, 184108 (2001).
- Seidel et al. [1992] A. Seidel, L. Häggström, and D. Rodić, Search for spin canting in gadolinium iron garnet using the mössbauer technique, Hyperfine Interactions 73, 265 (1992).
- Stadnik [1983] Z. Stadnik, Magnetic properties of Eu-Sc-Fe garnets studied with the mössbauer effect, Journal of magnetism and magnetic materials 37, 138 (1983).
- Rogalev and Wilhelm [2015] A. Rogalev and F. Wilhelm, Magnetic circular dichroism in the hard x-ray range, The Physics of Metals and Metallography 116, 1285 (2015).
- Chaboy et al. [2007] J. Chaboy, C. Piquer, N. Plugaru, F. Bartolomé, M. Laguna-Marco, and F. Plazaola, Fe57 mössbauer and x-ray magnetic circular dichroism study of magnetic compensation of the rare-earth sublattice in compounds, Physical Review B 76, 134408 (2007).
- Laguna-Marco et al. [2008] M. Laguna-Marco, J. Chaboy, and C. Piquer, Experimental determination of the R(5d)-T(3d) hybridization in rare-earth intermetallics, Physical Review B 77, 125132 (2008).
- Gorbunov et al. [2019] D. Gorbunov, C. Strohm, M. Henriques, P. van der Linden, B. Pedersen, N. Mushnikov, E. Rosenfeld, V. Petříček, O. Mathon, J. Wosnitza, et al., Microscopic nature of the first-order field-induced phase transition in the strongly anisotropic ferrimagnet , Physical review letters 122, 127205 (2019).
- Strempfer et al. [2016] J. Strempfer, J. Mardegan, S. Francoual, L. Veiga, L. Bouchenoire, T. Spitzbart, and H. Zink, Fast helicity switching of x-ray circular polarization at beamline P09 at PETRA III, in AIP conference proceedings, Vol. 1741 (AIP Publishing LLC, 2016) p. 030017.
- Rodriguez-Carvajal [1990] J. Rodriguez-Carvajal, Fullprof: a program for rietveld refinement and pattern matching analysis, in satellite meeting on powder diffraction of the XV congress of the IUCr, Vol. 127 (Toulouse, France:[sn], 1990).
- Strocka et al. [1978] B. Strocka, P. Holst, and W. Tolksdorf, An empirical formula for the calculation of lattice constants of oxide garnets based on substituted yttrium-and gadolinium-iron garnets, Philips Journal of Research 33, 186 (1978).
- Knudsen and Mørup [1980] J. Knudsen and S. Mørup, The influence of the demagnetizing field on the magnetic spliting of mössbauer spectra, Le Journal de Physique Colloques 41, C1 (1980).
- Lataifeh and Lehlooh [1996] M. S. Lataifeh and A.-F. D. Lehlooh, Mossbauer spectroscopy study of substituted yttrium iron garnets, Solid state communications 97, 805 (1996).
- Chinnasamy et al. [2010] C. Chinnasamy, J. Greneche, M. Guillot, B. Latha, T. Sakai, C. Vittoria, and V. Harris, Structural and size dependent magnetic properties of single phase nanostructured gadolinium-iron-garnet under high magnetic field of 32 Tesla, Journal of Applied Physics 107, 09A512 (2010).
- Kawamura et al. [2001] N. Kawamura, M. Suzuki, H. Maruyama, and T. Ishikawa, Variation of xmcd spectrum with temperature at R -edges in (R= Gd and Er), Journal of synchrotron radiation 8, 425 (2001).
- Maruyama and Kawamura [2004] H. Maruyama and N. Kawamura, Xmcd study of electronic states in rare-earth iron garnet, Journal of electron spectroscopy and related phenomena 136, 135 (2004).
- Miyagawa et al. [2005] H. Miyagawa, N. Kawamura, and M. Suzuki, Temperature dependence of x-ray magnetic circular dichroism in rare earth iron garnets (rare earth= Gd,Dy and Sm), Physica Scripta 2005, 616 (2005).
- Ganzhorn et al. [2016] K. Ganzhorn, J. Barker, R. Schlitz, B. A. Piot, K. Ollefs, F. Guillou, F. Wilhelm, A. Rogalev, M. Opel, M. Althammer, et al., Spin hall magnetoresistance in a canted ferrimagnet, Physical Review B 94, 094401 (2016).