On the Performance Analysis of the Adversarial System Variant Approximation Method to Quantify Process Model Generalization
Abstract
Process mining algorithms discover a process model from an event log. The resulting process model is supposed to describe all possible event sequences of the underlying system. Generalization is a process model quality dimension of interest. A generalization metric should quantify the extent to which a process model represents the observed event sequences contained in the event log and the unobserved event sequences of the system. Most of the available metrics in the literature cannot properly quantify the generalization of a process model. A recently published method [1] called Adversarial System Variant Approximation leverages Generative Adversarial Networks to approximate the underlying event sequence distribution of a system from an event log. While this method demonstrated performance gains over existing methods in measuring the generalization of process models, its experimental evaluations have been performed under ideal conditions. This paper experimentally investigates the performance of Adversarial System Variant Approximation under non-ideal conditions such as biased and limited event logs. Moreover, experiments are performed to investigate the originally proposed sampling hyperparameter value of the method on its performance to measure the generalization. The results confirm the need to raise awareness about the working conditions of the Adversarial System Variant Approximation method. The outcomes of this paper also serve to initiate future research directions.
Index Terms:
Process Mining, Generalization, Conformance Checking, Sequence Generative Adversarial NetworksI Introduction
In recent years, process mining has developed into a major research discipline. Significant research effort has been spent on the automated discovery of process models from event logs, i.e. process discovery, and the quality assessment of such models, called conformance checking. While the focus of conformance checking has been mainly on measuring how well a discovered process model reflects event sequences that are recorded in an event log, measuring the extent to which a process model generalizes the possible event sequences of the system, from which the event log originates, has been neglected. The origin of such event logs are usually real-world systems that are applied in domains such as e.g. business processes [2], manufacturing [3, 4] or healthcare [5, 6, 7]. Research studies have shown that measuring the generalization of discovered process models is of importance [8] and that only a few proposed methods focus on this objective. At the same time, the research community is aware that the existing methods do not fully address the required needs and present individual major shortcomings [9, 10].
Adversarial System Variant Approximation (AVATAR) is a novel methodology [1] to overcome some of the known issues in measuring generalization. This method leverages a Generative Adversarial Network (GAN) to train a neural network on the same event log that is used to discover a process model. AVATAR is based on the fact that GANs successfully demonstrated the ability to unveil underlying data distributions in domains such as computer vision [11] and transfers the approach to the context of measuring the generalization of process models. By sampling from the GAN that is trained on the event log, a baseline of supposedly generalizing event sequences is obtained. Experimental evaluations have been performed using ground truth systems. These evaluations have shown that the GAN of AVATAR can model observed event sequences that are contained in the event log and unobserved event sequences of the ground truth system more accurately than state-of-the-art process discovery algorithms.
Whereas the experimental evaluation of AVATAR demonstrated that GANs are suitable and promising neural network architectures that can be used to measure the generalization of a process model, further research is required to understand the working conditions of those GANs in depth. This is of utmost importance to improve and mature the AVATAR methodology. This paper contributes to this objective by conducting performance analyses on the GANs of AVATAR using the same ground truth systems that were used in the original publication. First, the performance analyses include an experimental evaluation of the proposed sampling hyperparameter value of of the GAN of AVATAR since a comprehensive analysis remains unpublished to date. Second, experiments are performed on limited event log sizes. The original publication used a constant 70% split ratio of the event sequences of the ground truth systems that were used as the event log for process discovery and AVATAR. Under real-world conditions, such a constant 70% split ratio is usually infeasable. Hence, it is necessary to investigate the GAN performance of AVATAR with different split ratios. Third, an experimental evaluation is performed on the robustness of AVATAR towards bias. Specifically, this paper investigates if event logs that are biased affect the ability of the GAN to unveil unobserved event sequences from the ground truth system. The results of the experiments are used to draw conclusions and to raise awareness about the working conditions of the GANs of AVATAR. This in turn provides future research directions to mature the AVATAR methodology.
The paper is structured as follows. Related work including an introduction of the AVATAR methodology is described in Section II, followed by an introduction of notations that are used throughout the paper in Section III. The research questions of this paper are elaborated in Section IV. Section V introduces the experimental setups, followed by a discussion of the obtained results in Section VI. Section VII concludes the paper and provides future research directions.
II Related Work
The content of this section is two-fold. First, a brief introduction to generalization metrics and their historical development is provided in Section II-A. Second, an introduction of the novel AVATAR method is provided in Section II-B.
II-A Generalization Metric
Generalization describes that a process model, such as a Petri net, models ideally all possible event sequences of a system that can realistically occur. This means that a process model should allow for the event sequences that are recorded in an event log when observing a system under investigation. These event sequences are usually used to automatically discover a process model using a process discovery algorithm. Additionally, the process model should not allow for unrealistic event sequences beyond the observed ones. It is obvious that the difficulty of measuring the generalization of a process model reduces to classifying if given unobserved event sequences are either realistic or unrealistic in the context of the system under investigation.
A significant amount of research has been spent on measuring how well a process model allows for event sequences contained in an event log (i.e. measuring the fitness) and how well a process model restricts to allow for event sequences beyond the ones contained in an event log (i.e. measuring the precision). However, research on measuring the generalization of process models is scarce due to the difficulty of deriving realistic and unobserved event sequences from an event log. Nonetheless, the process mining research community is aware that the quality dimension of generalization is of importance [12, 9, 10].
Historically, one of the first approaches to quantify the extent to which a process model generalizes event sequences beyond the ones contained in an event log has been introduced by Buijs et al. [13]. The proposed approach is based on quantifying the trustworthiness of the precision of a process model using alignments. Highly frequent used areas of a process model are considered well generalizing whereas low frequent parts of the model are less generalizing.
Van der Aalst et al. [14] built a measurement to quantify that a process model does not overfit on a given event log. Specifically, their approach is based on the probability of observing a new event in any given state of the model based on the observations contained in the event log. If the likelihood of observing a new event in a given state is small, then the generalization is good.
Brouck et al. [15] introduced a method to measure the generalization of a process model using weighted artificial negative events. In comparison to an actual event, an artificial negative event prevents the occurrence of a specific event at a given time. This concept enables to derive allowed and disallowed generalized event sequences.
A further method has been proposed by van Dongen et al. [16]. This method is based on anti-alignments which are event sequences that are disparate from a set of given event sequences. This notion is used to measure the generalization by relating the state space of a process model. A generalizing process model has therefore a maximally different set of anti-alignments without introducing unseen states.
A comparative study has been conducted by Janssenswillen et al. [17]. Their investigations lead to the conclusion that metrics that quantify the generalization with respect to a given event log do usually not assess the quality of a process model concerning the underlying system correctly. Hence, generalization metrics need to be developed that do not solely relate modeled event sequences to the sequences contained in an event log. Such metrics should be evaluated using ground truth systems.
II-B Adversarial System Variant Approximation
AVATAR is a recently proposed approach to quantify the extent to which a process model generalizes [1]. The idea of this method is to unveil realistic but unobserved event sequences of a system using Generative Adversarial Networks (GANs) [11]. If it is possible to confidently model unobserved event sequences using GANs, then measuring the generalization reduces to measuring the fitness and precision of a process model using the observed event log in combination with the unobserved event sequences that are modeled by the GAN. This is motivated by the generalization capabilities of GANs [18].
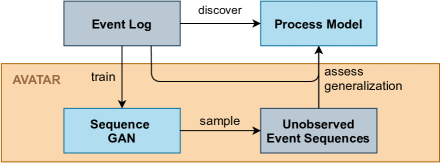
A flow chart of the methodology is provided in Figure 1. A given set of event sequences that is used for automated process discovery is also used to train a Sequence GAN. AVATAR leverages a RelGAN [19] architecture that is enhanced with an additional standard discriminator neural network. A major hyperparameter of this Sequence GAN architecture is the temperature control of the RelGAN that controls the tradeoff between sample diversity and quality. The trained Sequence GAN is then used to sample unobserved event sequences. AVATAR proposes therefore two sampling methodologies. The first is naive sampling controlled by the hyperparameter which means that samples are drawn from the generator of the Sequence GAN. The intuition is that the number of unique event sequences converges with an increasing number of sampling iterations. This also means that the relative frequency of an event sequence indicates the modeling confidence of this particular event sequence. The second sampling methodology uses the Metropolis-Hastings algorithm [20] and is inspired by the work of Turner et al. [21]. It is assumed that by sampling from the Sequence GAN, the unobserved event sequences of a system can be unveiled. In this case, quantifying the generalization of a process model reduces to measuring the fitness and precision of the process model with respect to the set of observed and approximated unobserved event sequences from the GAN.
The AVATAR methodology has been statistically evaluated using the finite set of event sequences of ground truth Petri nets. These Petri nets were created artificially as part of a comparative study of process discovery quality measures [17] and are publicly available111https://github.com/gertjanssenswillen/processquality/. Each of the Petri nets has different characteristics. of the Petri nets can be classified as moderate complex with a small number of transitions and comparatively few parallelisms whereas Petri nets are highly complex with a larger number of transitions and parallel structures. The highly complex Petri nets are supposed to reflect the complexity of real-world systems. For each ground truth Petri net, a random and unbiased 70% random split of the modeled unique event sequences was considered as an event log. These event logs were used to discover process models using two process discovery algorithms [22, 23]. The remaining 30% were withheld as the set of unobserved event sequences that the GAN should be able to model.
The results of the experimental evaluation showed that Sequence GANs are well suited to obtain realistic unobserved event sequences with a relatively small number of unrealistic event sequences. Moreover, the AVATAR generalization scores were compared to existing generalization metrics on the discovered process models. The obtained AVATAR scores on those models were perceived more appropriate than the scores of existing generalization measures based on the ground truth event sequence information. All experimental results were obtained under ideal working conditions.
III Notations
The notations that are used throughout this paper are based on and consistent with the ones of the original AVATAR publication. Hence, the reader is referred to [1] for detailed introductions and definitions.
A system is denoted by . An event describes an instantaneous change of the state of where is the finite set of all possible events. The cardinality of a set is denoted by . An event instance is a vector and describes the occurrence of a specific along with its occurrence timestamp and optional additional information. A trace is a finite and chronologically ordered sequence of event instances. A variant is a sequence of events where is the infinite set of all variants. A trace maps to exactly one variant. Whereas an event log is a set of traces, denoted by , a variant log is a sample of variants denoted by . A unique variant log is denoted by and equals to the set of . The set of all variants that can be observed during the runtime of is denoted by . The functions and return the maximum and mean variant lengths of a given set of variants, respectively.
Following the AVATAR methodology, an SGAN architecture is trained on with a hyperparameter . The trained GAN can be used to naivey sample variants and is denoted by . The number of sampling iterations from is denoted by .
When training a GAN, all variants of are considered. A subset of variants might exist such that ) and (. Ideally, when sampling times from , it is desired to obtain an estimated set of system variants, i.e. that equals to . How well the GAN performs to reach to this goal is quantified using the true positive ratios described in Equation 1.
| (1) |
describes the proportion of realistic variants sampled using over all possible system variants. describes the ratio of sampled variants using over all unobserved variants. Moreover, the number of unique sampled variants is recorded. Ideally, and should equal to while the number of unique sampled variants should equal to .
| (2) |
The score function described in Equation 2 is used, as proposed in [1], to quantify how well the GAN of AVATAR performs. This function addresses the imbalance of and . The maximum score value equals and is reached at .
IV Problem Statement
The AVATAR methodology [1] demonstrated successfully that Sequence GANs can model which builds a foundation to measure the generalization of process models. The evaluation setup of AVATAR consisted of a 70/30 split ratio of to obtain and and a sampling hyperparameter that was set to for each of the 15 ground truth systems. This setup raises multiple research questions, including the following.
RQ1: Is the hyperparameter with a value of optimally defined and is there a relationship between and the GAN performance of AVATAR? The hyperparameter describes the number of variants that are drawn naively from the trained Sequence GAN without leveraging the Metropolis-Hastings algorithm. Whereas [1] states that preliminary results showed that setting to the value of is a good choice, a proven justification for this value is missing. Moreover, it remains unclear if there a relationship between and the performance of the GAN of AVATAR exists. Therefore, this paper experimentally assesses the performance of the GANs with multiple multiple values for to validate the statement made in the original publication and to investigate the relationship between the system, , and the GAN performance to model .
RQ2: How does the size of relate to the performance of modeling ? The AVATAR methodology has been evaluated using a constant 70/30 split ratio of to obtain and across all used ground truth systems. However, it remains unclear how the GAN of AVATAR performs if less information of a system is given. In real-world scenarios, an exact 70% split of all possible variants of a system is usually unrealistic. The ratio of variants contained in to all variants in can be guessed at its best. Hence, this paper experimentally assesses the performance of the GANs of AVATAR at different split ratios to investigate the working conditions of AVATAR when the given event log size is limited.
RQ3: Are the GANs of AVATAR sensitive to biased variant logs? The GANs of AVATAR have been evaluated using a random and unbiased split of . In real-world scenarios though, might be biased due to a limited observation duration of the system or adverse environmental situations. Whereas research has been conducted on the impact of biased event logs on process discovery algorithms [24], it remains unclear how the GANs of AVATAR perform when being trained on a biased set of variants. Bias can be expressed e.g. in terms of variant lengths. In this paper, preliminary experiments are performed to investigate if the performance of the GANs are affected when being trained on specific biased variant logs.
V Experimental Setup
This section describes the experimental setups. The corresponding source code including the obtained results are publicly available on Github222https://github.com/ProminentLab/AVATAR.
V-A Sampling Hyperparameter
To investigate the relationship between and the performance of the Sequence GANs of AVATAR (RQ1), multiple values for are investigated. Specifically, is set to , , , , up to , with an increment of each. This includes the originally proposed value. These specific values are chosen such that performance changes can be observed when increasing and decreasing the proposed value of . It is expected that the performance of the GANs decreases with a very small value, such as , but it remains unclear if the performance increases with an increased value of . It is not expected that a granularity finer than will unveil significant differences.
Training and sampling of the Sequence GANs is performed on the five highly complex Petri net ground truth system that were also used to evaluate the AVATAR methodology according to the original publication. These systems are denoted as and correspond to Systems 11-15 in [1]. For each of the five systems, two Sequence GANs are trained with and , respectively. These GANs are trained using a random 70% split of which corresponds to . The remaining 30% results in and are used to evaluate the performance of the Sequence GAN to approximate the unobserved system variants, as in the original publication. This is called a 70/30 split ratio. The setup results in ten different Sequence GAN models and, due to to different values for , in a total of 110 observation values for evaluation.
V-B Variant Log Size
To investigate the performance of the GANs of AVATAR when limited variant log sizes are given (RQ2), two Sequence GANs per system are trained with different split ratios compared to the 70/30 ratio of the original evaluation. In this setup, the 70/30 split ratio is used as a baseline for comparison. Moreover, experiments are performed using 10/90, 20/80, 30/70, 40/60, 50/50, and 60/40 split ratios. It is expected that the performance of the GANs in modeling decreases with smaller values. As before, the systems are used for experimental evaluation due to their realistic complexity. The Sequence GANs are trained with and to be consistent with the original AVATAR work. This results in 140 Sequence GANs for evaluation. Variants are generated from the Sequence GANs using the originally proposed value. Statistics on the variant sets that are used for this experiment are shown in Table I.
| Identifier | Setup | |||||||
| pb_system_1_5 | baseline 70/30 | 14 | 680 | 18 | 476 | 13.51 | 204 | 13.67 |
| 10/90 | 68 | 13.26 | 612 | 13.59 | ||||
| 20/80 | 136 | 13.51 | 544 | 13.57 | ||||
| 30/70 | 204 | 13.94 | 476 | 13.40 | ||||
| 40/60 | 272 | 13.46 | 408 | 13.63 | ||||
| 50/50 | 340 | 13.65 | 340 | 13.47 | ||||
| 40/60 | 408 | 13.56 | 272 | 13.56 | ||||
| pb_system_2_4 | baseline 70/30 | 15 | 507 | 43 | 355 | 30.98 | 152 | 31.30 |
| 10/90 | 51 | 31.14 | 456 | 31.07 | ||||
| 20/80 | 102 | 31.04 | 405 | 31.08 | ||||
| 30/70 | 152 | 31.43 | 355 | 30.92 | ||||
| 40/60 | 203 | 30.80 | 304 | 31.25 | ||||
| 50/50 | 254 | 31.48 | 253 | 30.67 | ||||
| 40/60 | 304 | 30.71 | 203 | 31.62 | ||||
| pb_system_3_6 | baseline 70/30 | 10 | 780 | 16 | 546 | 10.26 | 234 | 10.28 |
| 10/90 | 78 | 10.51 | 702 | 10.24 | ||||
| 20/80 | 156 | 10.26 | 624 | 10.27 | ||||
| 30/70 | 234 | 10.27 | 546 | 10.26 | ||||
| 40/60 | 312 | 10.28 | 468 | 10.26 | ||||
| 50/50 | 390 | 10.17 | 390 | 10.36 | ||||
| 40/60 | 468 | 10.28 | 312 | 10.25 | ||||
| pb_system_4_1 | baseline 70/30 | 15 | 688 | 28 | 481 | 21.64 | 207 | 21.98 |
| 10/90 | 69 | 21.58 | 619 | 21.76 | ||||
| 20/80 | 138 | 22.02 | 550 | 21.67 | ||||
| 30/70 | 207 | 22.05 | 481 | 21.60 | ||||
| 40/60 | 275 | 21.69 | 413 | 21.77 | ||||
| 50/50 | 344 | 21.68 | 344 | 21.80 | ||||
| 40/60 | 413 | 21.80 | 275 | 21.65 | ||||
| pb_system_5_3 | baseline 70/30 | 14 | 415 | 21 | 290 | 14.65 | 125 | 14.88 |
| 10/90 | 42 | 14.40 | 373 | 14.75 | ||||
| 20/80 | 83 | 15.42 | 332 | 14.54 | ||||
| 30/70 | 125 | 14.49 | 290 | 14.82 | ||||
| 40/60 | 166 | 14.37 | 249 | 14.95 | ||||
| 50/50 | 208 | 14.43 | 207 | 15.01 | ||||
| 40/60 | 249 | 14.66 | 166 | 14.80 | ||||
V-C Biased Variant Logs
This experiment investigates the performance of the GANs of AVATAR in detecting when being trained on a biased to provide an answer to RQ3. Bias is expressed using the length of variants. The baseline is obtained using a random and unbiased 70/30 split ratio on such that and are almost equal. Four bias setups are defined and denoted by to .
The first bias setup is defined such that contains the shortest 70% of and contains the remaining 30%. This means that a Sequence GAN is trained on short variants only and is supposed to generalize long variants, too.
Similarly, the second bias setup is defined such that contains the longest 70% of and contains the remaining variants. In this case, a Sequence GAN is trained on long variants and is supposed to generalize short variants.
The third and fourth setups and are leaky variations of and , respectively. For both setups, 20% of the variants in are randomly exchanged with a randomly chosen variant from . This means that the corresponding Sequence GAN is not trained on strictly short or strictly long variants. However, bias in terms of the lengths of variants contained in and persists.
For all setups to , the longest possible variant of a corresponding system is contained in rather than . This is required to satisfy the assumption that the maximum possible system variant length is known to train a GAN of AVATAR. Therefore, at least one variant with a length equal to must be known.
Like before, two Sequence GANs are trained with and , respectively, for each of the systems and each setup. Consequently, the total number of Sequence GAN models under investigation equals 50. Table II shows the variant set statistics for each system and setup under investigation.
| Identifier | Setup | |||||||
| baseline | 14 | 680 | 18 | 476 | 13.51 | 204 | 13.67 | |
| 14 | 680 | 18 | 477 | 12.72 | 203 | 15.54 | ||
| 14 | 680 | 18 | 476 | 14.62 | 204 | 11.08 | ||
| 14 | 680 | 18 | 477 | 13.03 | 203 | 14.81 | ||
| 14 | 680 | 18 | 476 | 14.27 | 204 | 11.90 | ||
| baseline | 15 | 507 | 43 | 355 | 30.98 | 152 | 31.30 | |
| 15 | 507 | 43 | 356 | 27.96 | 151 | 38.41 | ||
| 15 | 507 | 43 | 355 | 34.28 | 152 | 23.59 | ||
| 15 | 507 | 43 | 356 | 29.01 | 151 | 35.93 | ||
| 15 | 507 | 43 | 355 | 33.32 | 152 | 25.82 | ||
| baseline | 10 | 780 | 16 | 546 | 10.26 | 234 | 10.28 | |
| 10 | 780 | 16 | 547 | 8.92 | 233 | 13.43 | ||
| 10 | 780 | 16 | 546 | 11.61 | 234 | 7.13 | ||
| 10 | 780 | 16 | 547 | 9.44 | 233 | 12.20 | ||
| 10 | 780 | 16 | 546 | 11.15 | 234 | 8.21 | ||
| baseline | 15 | 688 | 28 | 481 | 21.64 | 207 | 21.98 | |
| 15 | 688 | 28 | 482 | 19.91 | 206 | 26.01 | ||
| 15 | 688 | 28 | 481 | 23.74 | 207 | 17.05 | ||
| 15 | 688 | 28 | 482 | 20.64 | 206 | 24.31 | ||
| 15 | 688 | 28 | 481 | 23.17 | 207 | 18.40 | ||
| baseline | 14 | 415 | 21 | 290 | 14.65 | 125 | 14.88 | |
| 14 | 415 | 21 | 291 | 12.94 | 124 | 18.90 | ||
| 14 | 415 | 21 | 290 | 16.80 | 125 | 9.84 | ||
| 14 | 415 | 21 | 291 | 13.81 | 124 | 16.86 | ||
| 14 | 415 | 21 | 290 | 16.05 | 125 | 11.59 | ||
VI Results
This section describes and discusses the obtained results of the experiments that are defined above.
VI-A Sampling Hyperparameter Results
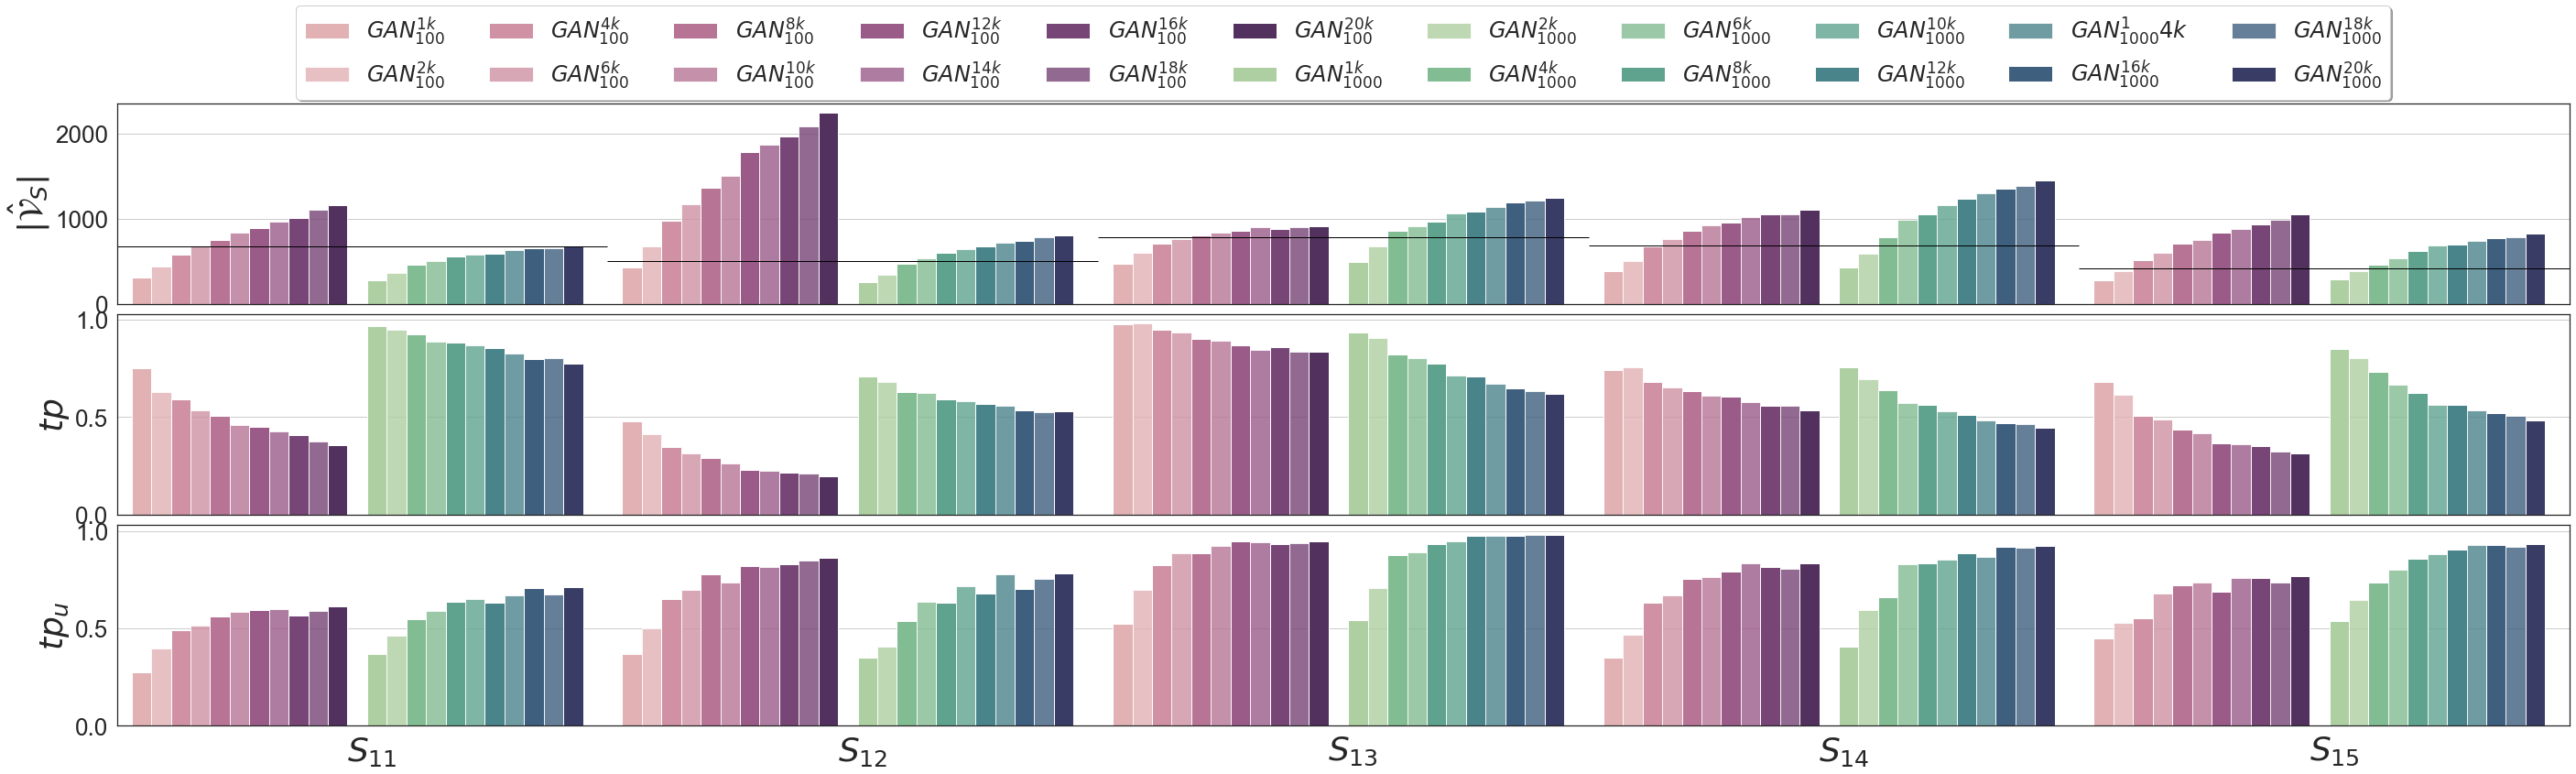
The obtained results are visualized in Figure 2. For and , it can be observed that the number of approximated system variants increases with the value of . This GAN setup is closest to the desired value when using . In the meantime, the ratio decreases with an increasing value of . With an increasing value of , the ratio converges to . Similar behavior can be observed for the Sequence GANs for . However, with , already exceeds the desired value of . Accordingly, decreases and converges with increasing to about . The overestimation of variants can be explained by the complexity of the underlying system. is the most complex system with unique events and a maximum variant length of . The second most complex system is with a much smaller maximum variant length. Accordingly, the Sequence GANs of are better in approximating compared to the ones of . Systems perform similarly to with an optimal variant number approximation around . The ratios usually seem to converge around and .
The results look similar for GANs with . In general, is overestimated with an increasing value of and when using a value that is larger than . Only for , the corresponding Sequence GAN underestimates the number of samples when using any of the considered values for . However, for , almost perfectly estimates with a decently high and ratio. In general, the ratio reduces with a more gentle slope compared to while converges to a fixed value similar to . The convergence value lies between and
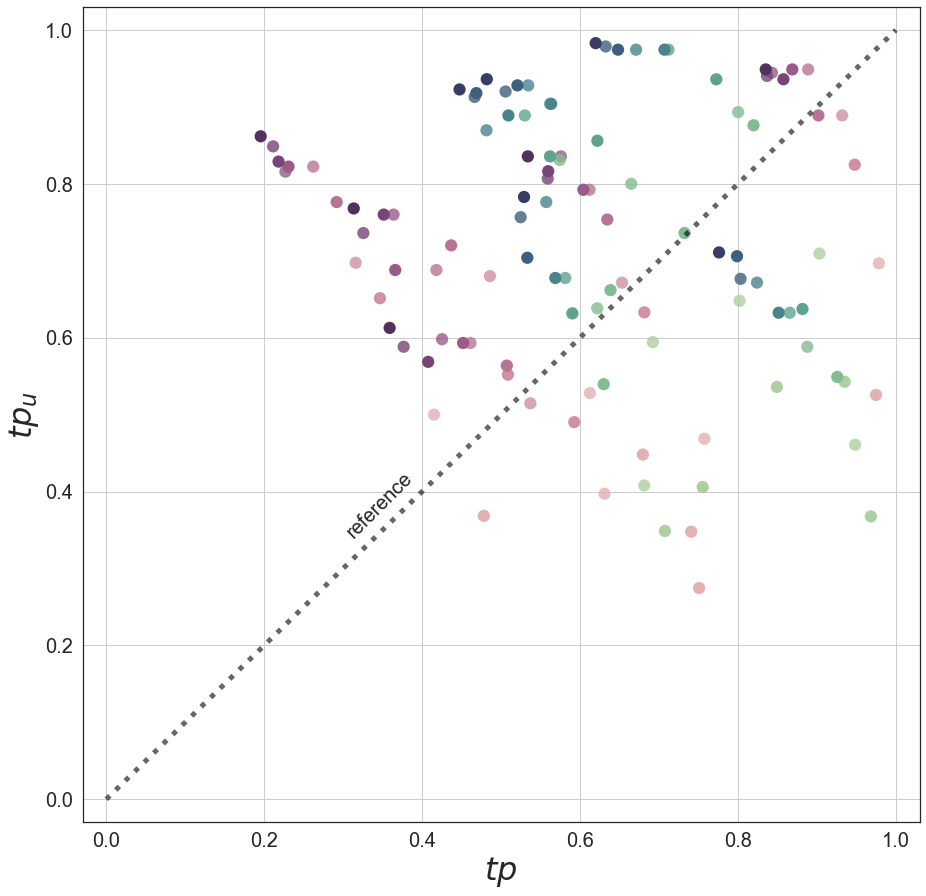
Figure 4 shows the corresponding scores to address the tradeoff between and . It can be observed that for smaller values of , the resulting score lies mostly in the upper right area, but below the reference line. In comparison, for larger values, the resulting score lies above the reference line. Generally, the best scores are obtained for intermediate values of . This indicates a quadratic relationship between and .
Since it can be observed that the performance of the GANs on more complex systems, such as , can be weaker, a linear regression model is fit using the features , , and to model the resulting scoring value for . With linear features, this leads to a and value of indicating a bad fit. With the corresponding quadratic features, the score improves to . This underscores the quadratic relationship that could be an initial step to develop a rule-of-thumb to select an individual and optimized value for . The required values for , and a desired minimum score value can be guessed by using expert knowledge.
The median value of the best obtained scores for the Sequence GAN models under consideration equals . This validates the general suitability of as proposed in [1] and answers RQ1.
VI-B Variant Log Size Results
The obtained results are visualized in Figure 3. For the GANs that were trained using , it can be generally noted that fewer unique variants are sampled with decreasing sizes of . At the same time, it can also be observed that and generally tend to decrease. A similar, but less significant behavior can be observed for the Sequence GANs that are trained using . This confirms the expectations.
The same trend can be observed when visualizing the 90% confidence intervals (CI) of the obtained scores for each Sequence GAN and variant log size setup over all systems, as visualized in Figure 6. Whereas this visualization cannot provide statistical proof due to the small sample size, it nonetheless shows the decreasing trend satisfyingly. Moreover, since the CIs for a 10/90 split ratio and the baseline 70/30 split ratio for both Sequence GAN setups are non-overlapping, it can be concluded that a 10/90 split ratio performs statistically poorer than a 70/30 split ratio with confidence.
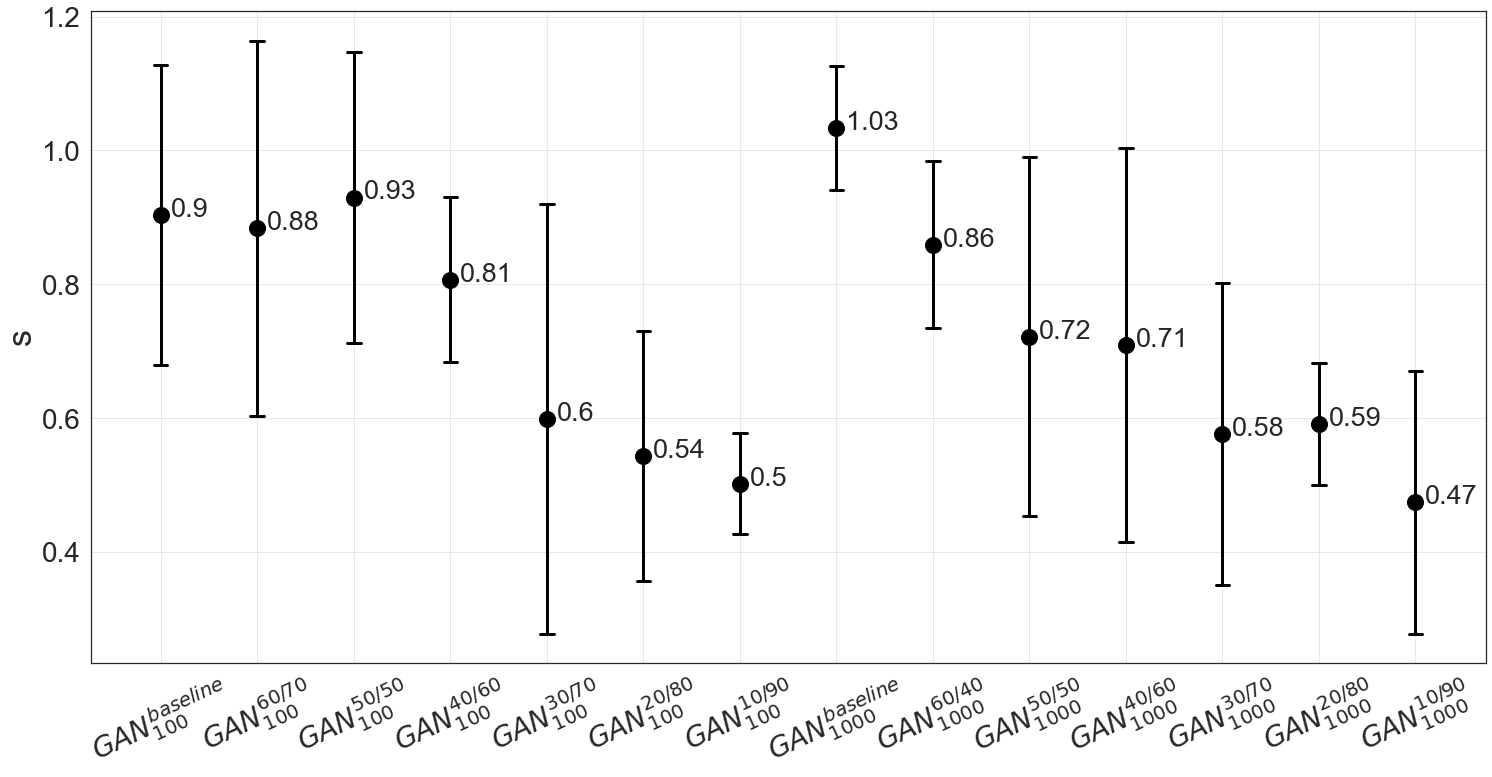
To provide an answer to RQ2, the GAN performance decreases with a decreasing number of observed variants contained in relative to . These experiments prove that the Sequence GANs of AVATAR trained with a 70/30 split ratio perform statistically significantly better compared to a 10/90 split ratio. For , the experiments show that a 70/30 split ratio leads to statistically significantly better performance compared to 30/70, 20/80, and 10/90 split ratios. However, it needs to be highlighted that further experiments with a larger sample size are required to provide a stronger validation of the statements.
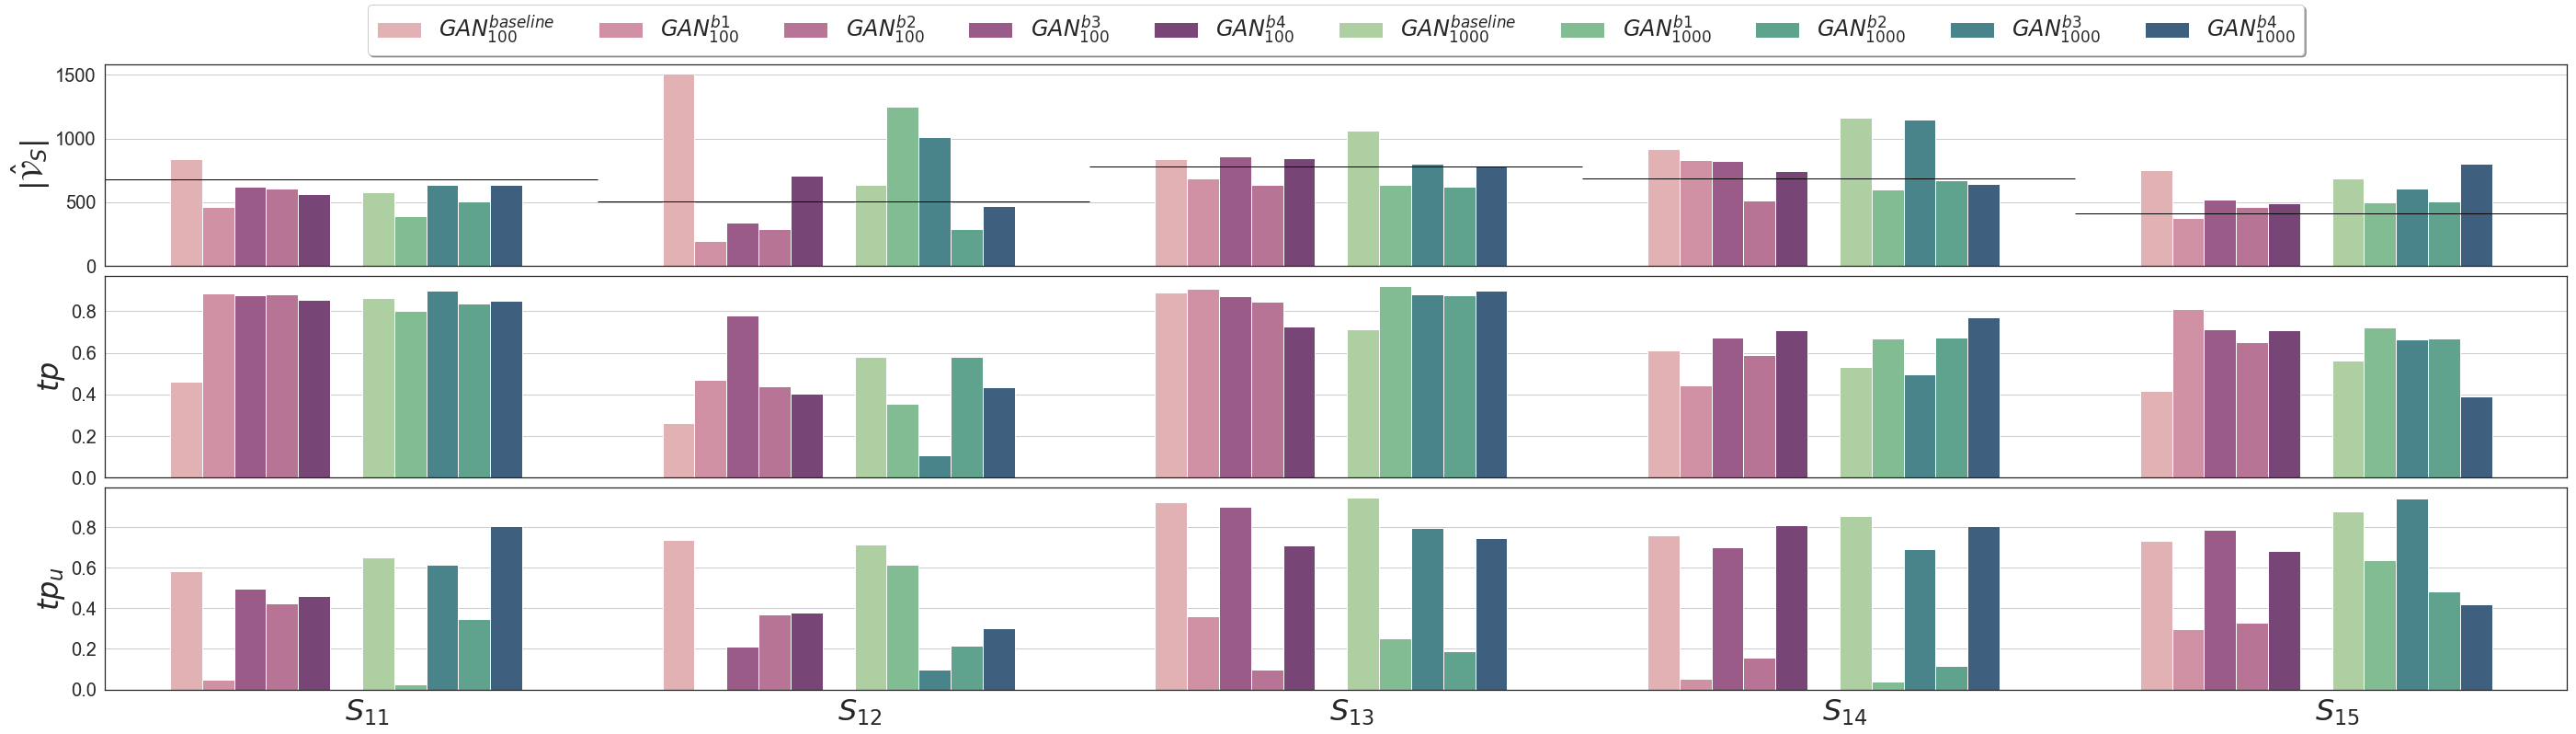
VI-C Biased Variant Log Results
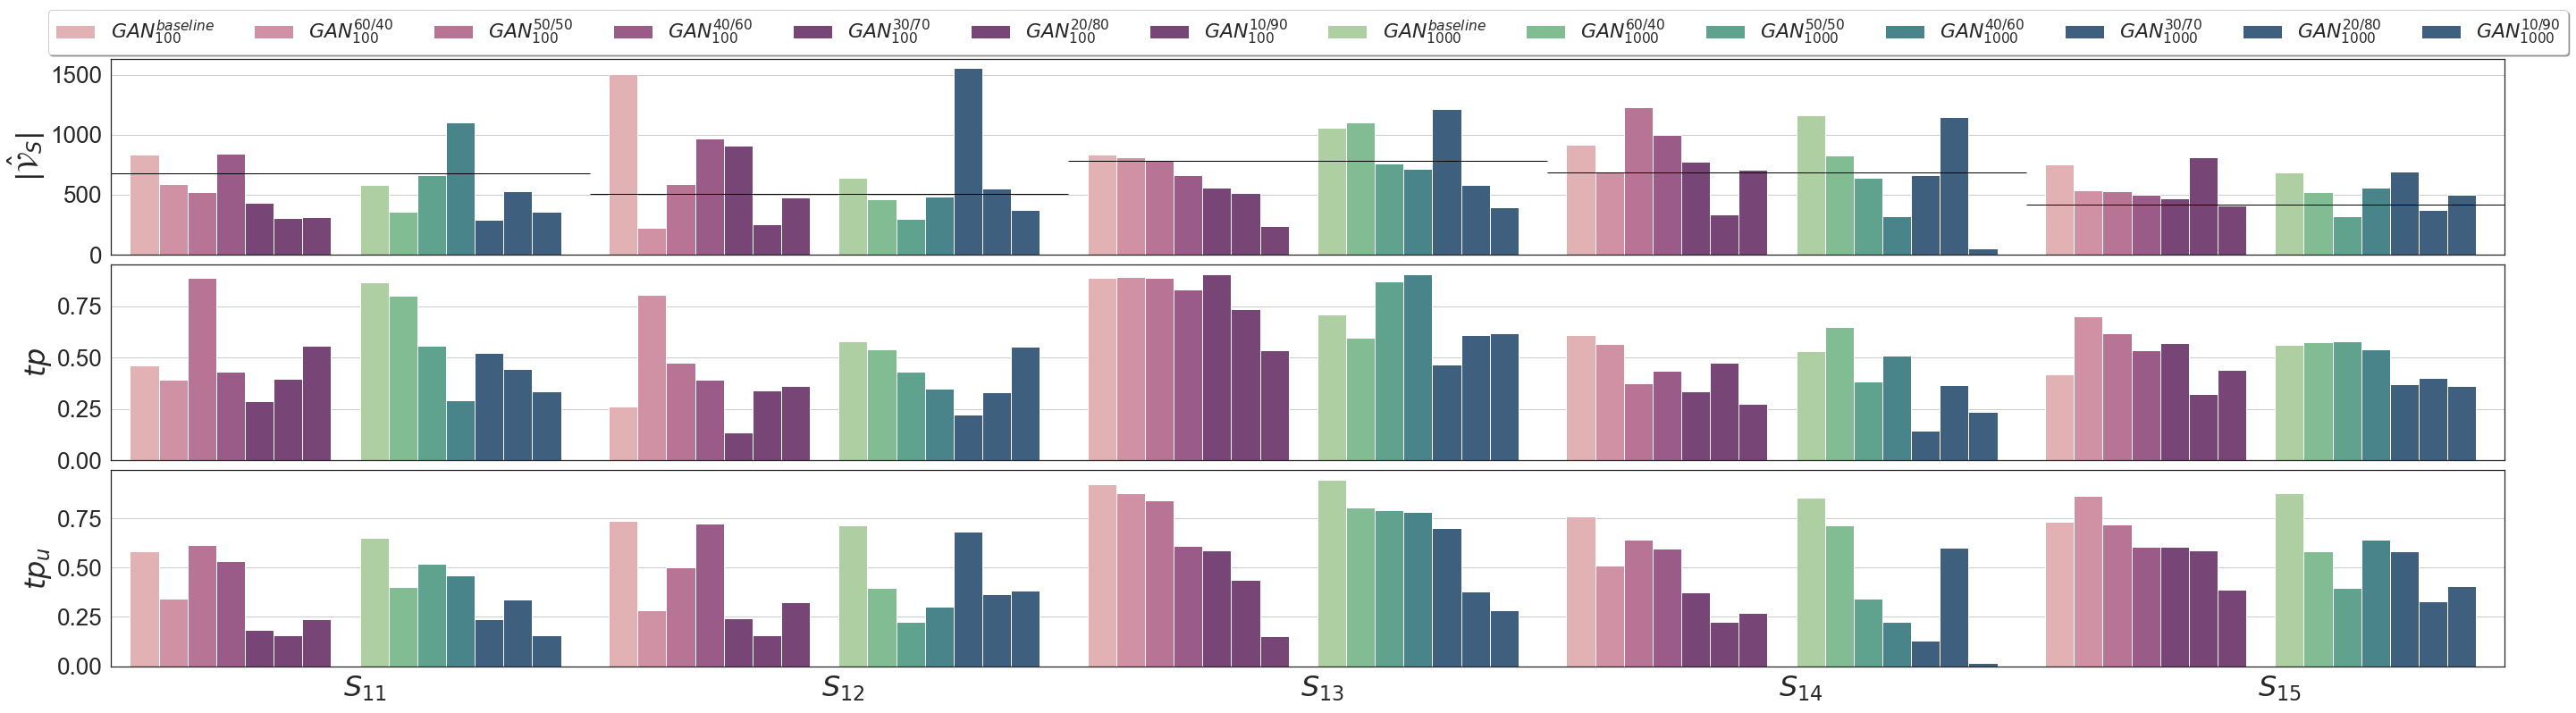
The results of the biased variant log experiments are visualized in Figure 5. It can be observed that for all systems, the Sequence GAN using on the biased setup performs poorly. However, when training using , the performance seems to be increasing. It can be noticed that the parameter seems to have an impact on the performance when is biased. However, the details of the impact remain unclear. Overall, the Sequence GANs trained with seem to perform better in general based on the result visualization in Figure 5.
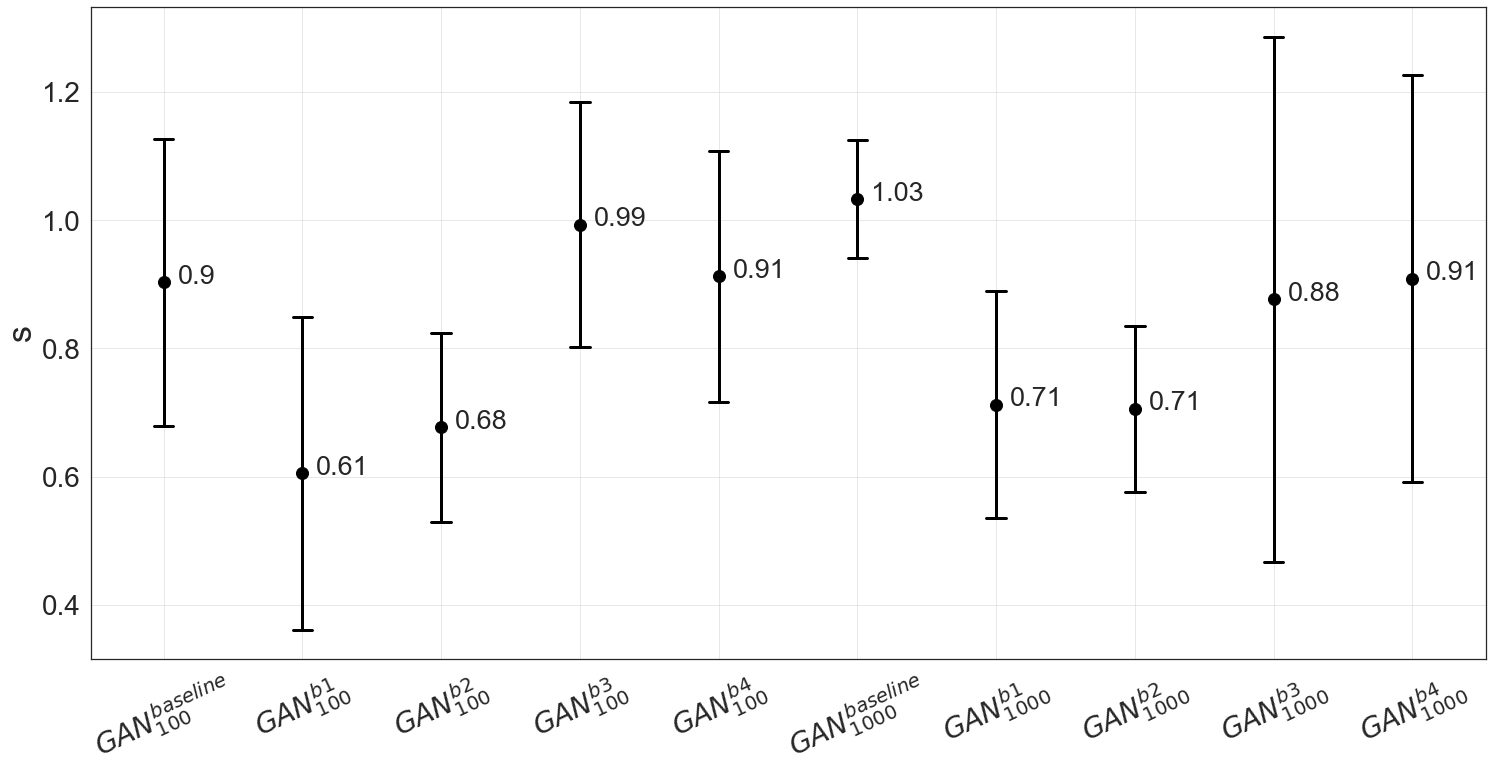
Furthermore, the GAN performance of AVATAR seems to increase when is less restrictively biased, i.e. with the setups and compared to and , respectively. Additionally, seems to perform better than , and performs better than . This indicates that less bias leads to better performance. The same can be observed when visualizing the CIs of the scores per Sequence GAN setup over all systems, as visualized in Figure 7. Comments on the statistical significance of each CI cannot be made due to the small sample size. However, the CI mean values indicate the trend that is described above. The baseline Sequence GANs are overall the best-performing models. When introducing leaky bias with the setups and , the performance reduces on average. Strict bias, such as with setups and , leads to a further decrease of performance in unveiling . The large confidence intervals for the Sequence GANs trained using and using the setups and can be either a randomness artifact or a sign that the hyperparameter can accommodate for non-strict bias in specific situations.
To answer to RQ3, the GANs of AVATAR are sensitive to bias and perform with a score value which decreases proportionally to the significance of present variant length bias in . Further experiments with a larger sample size of ground truth systems are anticipated to provide statistical evidence and insights on the potential impact of the hyperparameter to accommodate for bias.
VII Conclusion
This paper investigated the performance of the GANs of the AVATAR method under non-ideal conditions to raise awareness about the working conditions of the methodology to quantify process model generalization. Specifically, the sampling hyperparameter and the sensitivity of the Sequence GANs of AVATAR to limited and biased event logs have been analyzed. Answers to three RQs are provided based on the obtained results.
Regarding RQ1, the experiments have shown that is generally a good choice. However, an individual value for is required depending on the underlying system complexity to fine-tune the GAN performance. Linear regression with quadratic features indicated a good fit to estimate an optimized value for given the desired performance score , the total number of system variants, and the maximum variant length of the underlying system. For RQ2, the GAN performance in modeling generally tends to decrease when fewer variants of the system are contained in . Finally, the GANs of AVATAR seem to be sensitive towards biased variant logs, as an answer to RQ3. The performance of the underlying Sequence GANs decreases the more significant the bias in is. Moreover, the experimental results show the potential that the Sequence GAN hyperparameter might be able to accommodate for bias in specific situations.
While the experimental results unequivocally highlight certain conditions of the GANs that need to be considered when applying AVATAR, detailed statistical evidence remains mostly missing due to limited sample sizes. Hence, the results of this paper should raise awareness to the research community and provide the following three research directions. First, the results of the hyperparameter investigations motivate future experimental evaluations to derive a rule-of-thumb to select an optimal value . This requires an experimental evaluation using a large set of different ground truth systems to derive a robust rule-of-thumb. Second, a larger set of experiments need to be conducted to investigate the required variant log size to train a converging GAN such that AVATAR can be applied confidently. Third, the bias sensitivity of the GANs of AVATAR needs to be investigated with a larger set of ground truth systems and with different hyperparameter values to unveil a potential relationship between and the GAN sensitivity towards bias.
References
- [1] J. Theis and H. Darabi, “Adversarial System Variant Approximation to Quantify Process Model Generalization,” IEEE Access, vol. 8, pp. 194 410–194 427, 2020.
- [2] W. M. Van der Aalst, H. A. Reijers, A. J. Weijters, B. F. van Dongen, A. A. De Medeiros, M. Song, and H. Verbeek, “Business process mining: An industrial application,” Information Systems, vol. 32, no. 5, pp. 713–732, 2007.
- [3] H. Yang, M. Park, M. Cho, M. Song, and S. Kim, “A system architecture for manufacturing process analysis based on big data and process mining techniques,” in 2014 IEEE International Conference on Big Data (Big Data). IEEE, 2014, pp. 1024–1029.
- [4] J. Theis, I. Mokhtarian, and H. Darabi, “Process Mining of Programmable Logic Controllers: Input/Output Event Logs,” in 2019 IEEE 15th International Conference on Automation Science and Engineering (CASE), Aug 2019, pp. 216–221.
- [5] M. Ghasemi and D. Amyot, “Process Mining in Healthcare: A Systematised Literature Review,” International Journal of Electronic Healthcare, vol. 9, no. 1, pp. 60–88, 2016.
- [6] H. Darabi, W. L. Galanter, J. Y. Lin, U. Buy, and R. Sampath, “Modeling and integration of hospital information systems with Petri nets,” in 2009 IEEE/INFORMS International Conference on Service Operations, Logistics and Informatics, July 2009, pp. 190–195.
- [7] J. Theis, W. Galanter, A. Boyd, and H. Darabi, “Improving the In-Hospital Mortality Prediction of Diabetes ICU Patients Using a Process Mining/Deep Learning Architecture,” IEEE Journal of Biomedical and Health Informatics, 2021.
- [8] J.-R. Rehse, P. Fettke, and P. Loos, “Process Mining and the Black Swan: An Empirical Analysis of the Influence of Unobserved Behavior on the Quality of Mined Process Models,” in International Conference on Business Process Management. Springer, 2017, pp. 256–268.
- [9] A. F. Syring, N. Tax, and W. M. van der Aalst, “Evaluating Conformance Measures in Process Mining Using Conformance Propositions,” in Transactions on Petri Nets and Other Models of Concurrency XIV. Springer, 2019, pp. 192–221.
- [10] G. Janssenswillen and B. Depaire, “Towards Confirmatory Process Discovery: Making Assertions About the Underlying System,” Business & Information Systems Engineering, vol. 61, no. 6, pp. 713–728, 2019.
- [11] I. Goodfellow, J. Pouget-Abadie, M. Mirza, B. Xu, D. Warde-Farley, S. Ozair, A. Courville, and Y. Bengio, “Generative Adversarial Nets,” in Advances in Neural Information Processing Systems, 2014, pp. 2672–2680.
- [12] J. C. Buijs, B. F. Van Dongen, and W. M. Van Der Aalst, “Quality Dimensions in Process Discovery: The Importance of Fitness, Precision, Generalization and Simplicity,” International Journal of Cooperative Information Systems, vol. 23, no. 1, p. 1440001, 2014.
- [13] J. C. Buijs, B. F. Van Dongen, and W. M. van Der Aalst, “On the Role of Fitness, Precision, Generalization and Simplicity in Process Discovery,” in OTM Confederated International Conferences ”On the Move to Meaningful Internet Systems”. Springer, 2012, pp. 305–322.
- [14] W. Van der Aalst, A. Adriansyah, and B. Van Dongen, “Replaying History on Process Models for Conformance Checking and Performance Analysis,” Wiley Interdisciplinary Reviews: Data Mining and Knowledge Discovery, vol. 2, no. 2, pp. 182–192, 2012.
- [15] S. K. vanden Broucke, J. De Weerdt, J. Vanthienen, and B. Baesens, “Determining Process Model Precision and Generalization with Weighted Artificial Negative Events,” IEEE Transactions on Knowledge and Data Engineering, vol. 26, no. 8, pp. 1877–1889, 2013.
- [16] B. F. van Dongen, J. Carmona, and T. Chatain, “A Unified Approach for Measuring Precision and Generalization Based on Anti-alignments,” in International Conference on Business Process Management. Springer, 2016, pp. 39–56.
- [17] G. Janssenswillen, N. Donders, T. Jouck, and B. Depaire, “A comparative study of existing quality measures for process discovery,” Information Systems, vol. 71, pp. 1–15, 11 2017.
- [18] S. Arora, R. Ge, Y. Liang, T. Ma, and Y. Zhang, “Generalization and Equilibrium in Generative Adversarial Nets (GANs),” in Proceedings of the 34th International Conference on Machine Learning-Volume 70. JMLR. org, 2017, pp. 224–232.
- [19] W. Nie, N. Narodytska, and A. Patel, “RelGAN: Relational Generative Adversarial Networks for Text Generation,” in International Conference on Learning Representations, 2018.
- [20] N. Metropolis, A. W. Rosenbluth, M. N. Rosenbluth, A. H. Teller, and E. Teller, “Equation of State Calculations by Fast Computing Machines,” The Journal of Chemical Physics, vol. 21, no. 6, pp. 1087–1092, 1953.
- [21] R. Turner, J. Hung, E. Frank, Y. Saatchi, and J. Yosinski, “Metropolis-Hastings Generative Adversarial Networks,” in International Conference on Machine Learning, 2019, pp. 6345–6353.
- [22] S. K. vanden Broucke and J. De Weerdt, “Fodina: A robust and flexible heuristic process discovery technique,” Decision Support Systems, vol. 100, pp. 109–118, 2017.
- [23] A. Augusto, R. Conforti, M. Dumas, M. La Rosa, and A. Polyvyanyy, “Split miner: automated discovery of accurate and simple business process models from event logs,” Knowledge and Information Systems, vol. 59, no. 2, pp. 251–284, 2019.
- [24] M. F. Sani, S. J. van Zelst, and W. M. van der Aalst, “The impact of biased sampling of event logs on the performance of process discovery,” Computing, pp. 1–20, 2021.