Constraining positron emission from pulsar populations with AMS-02 data
Abstract
The cosmic-ray flux of positrons is measured with high precision by the space-borne particle spectrometer AMS-02. The hypothesis that pulsar wind nebulae (PWNe) can significantly contribute to the excess of the positron () cosmic-ray flux has been consolidated after the observation of a -ray emission at TeV energies of a few degree size around Geminga and Monogem PWNe. In this work we undertake massive simulations of Galactic pulsars populations, adopting different distributions for their position in the Galaxy, intrinsic physical properties, pair emission models, in order to overcome the incompleteness of the ATNF catalog. We fit the AMS-02 data together with a secondary component due to collisions of primary cosmic rays with the interstellar medium. We find that several mock galaxies have a pulsar population able to explain the observed flux, typically by few, bright sources. We determine the physical parameters of the pulsars dominating the flux, and assess the impact of different assumptions on radial distributions, spin-down properties, Galactic propagation scenarios and emission time.
1 Introduction
The observation of high-energetic cosmic-ray (CR) positrons () first by PAMELA [1] and Fermi-LAT [2] and then with unprecedented precision by AMS-02 [3] suggests the presence of primary sources in our Galaxy, as the observed flux exceeds the so-called secondary flux produced by inelastic collisions of CR nuclei in the interstellar medium (ISM) above about 10 GeV, see e.g. [4, 5]. Given the intense radiative losses suffered by high energetic electrons and positrons () while propagating in the Galaxy, AMS-02 observations require this primary source to be local, i.e. located within a few kpc from the Earth. Among the investigated explanations [6, 7, 8, 9, 10, 11, 12, 13, 14, 15, 16, 17, 18, 19, 20], pulsars have been consolidating as significant factories of high-energy CR in the Galaxy, and thus as main candidates to explain the excess.
First, the pulsar spin-down mechanism effectively produces pairs, which are possibly accelerated to multi-TeV energies at the termination shock between the relativistic wind and the surrounding medium (see [21, 22] for recent reviews on the acceleration mechanism). Secondly, observations of pulsars and their surrounding environment, including their pulsar wind nebula (PWN), across the entire electromagnetic spectrum reveal accelerated at very-high-energies and generating photons through synchrotron and inverse Compton scattering (ICS) processes [23, 24]. In particular, the observation of gamma-ray halos at TeV energies of a few degree size around two nearby pulsars, Geminga and Monogem, reported by Milagro [25] and HAWC [26] further corroborates the presence of accelerated, then escaped, by their PWNe at few tens of parsec away from the pulsar location. The observed emission is interpreted as coming from CR escaping from the PWN system and ICS low-energy photons of the interstellar radiation field (ISRF). Similar extended gamma-ray halos surrounding pulsars have been recently observed by HAWC, by LHAASO at even higher energies [27, 28], and also by Fermi-LAT at tens of GeV implying even larger angular scales [29], suggesting that they might be a general feature of Galactic pulsars [30, 31, 32]. While the mechanism shaping transport in these halos, and consequently the gamma-ray emission, is not yet fully understood [33, 34, 35, 36, 37], the observed extension is well above the typical PWN size inferred at radio and X-ray wavelengths [31].
Finally, several independent works have demonstrated that pulsar models can provide a good description of AMS-02 and data. This conclusion has been reached both by considering the contribution of few nearby sources, as well as the cumulative emission from pulsars as observed in existing catalogs [6, 15, 14, 38, 39, 40] or in simulations [18, 41], and including or not possible effects from suppressed diffusion around sources [42]. While energy losses limit the distance traveled by high-energy to few hundreds of parsecs, where we expect few Galactic sources contributing significantly, current source catalogs might be not complete. Previous computations, such as [14], calculating the contribution of from the ATNF catalog sources could therefore suffer for underestimation due to the incompleteness of the catalog. Simulations of the Galactic source population of pulsars are needed to extensively test the pulsar interpretation of the observed flux in order to overcome the limitations of previous studies.
The details of the production, acceleration and release from pulsars and their PWN are yet not fully understood [22], as well as the spatial and energetic distribution of pulsar [43, 44]. CR are indeed a golden channel to study primary sources, and in particular PWNe. The CR are mainly produced by supernova remnants (SNRs), while the pulsar contribution is predicted subdominant [41, 40]. High-precision data can now be used to constrain the main properties of the Galactic pulsar population and of the PWN acceleration. Recent works have investigated through simulations of pulsar populations the interpretation of AMS-02 data [18, 42, 41]. Here, we build upon previous works and extend them significantly in various novel aspects. We simulate a large number of realizations for Galactic pulsar populations, implementing different updated models for the source distribution, particle injection and propagation which reproduce ATNF catalog observations, instead of ad-hoc realizations of pulsar properties. For each mock galaxy, we compute the CR flux at the Earth from the resulting PWNe population. We then fit our predictions to the AMS-02 data in order to determine the physical parameters of these populations. We also inspect the properties of individual sources which are able to explain the observed flux. We simulate sources following different spatial distributions in the Galactic spiral arms, and investigating the effect of the radial distribution of sources. We also asses the impact of different assumptions on the spin-down properties, of propagation scenarios and emission properties. Finally, we measure the average number of sources necessary to fill the gap between the secondary flux and AMS-02 data.
The fluxes from Galactic pulsars are expected to contribute to the data on the spectrum as well. Many authors in recent years (e.g. [45, 41]) included the contribution from catalog pulsar or simulations to model the data of Fermi-LAT [46], AMS-02 [47, 3], DAMPE [48] and CALET [49]. However, the AMS-02 data up to 1 TeV are currently the most precise observable to constrain the characteristics of Galactic pulsar populations, being this the main scope of the present paper. The data is indeed dominated by the produced by supernova remnants (SNR), that should be carefully modeled. This is beyond the scope of this paper, also because of the increasing of the number of variables that should be taken into account. The remainder of the paper is organized as follows. In Section 2 our modeling for the production from a single PWN, and the basics of propagation in our Galaxy are illustrated. The strategies to simulate the Galactic pulsar populations and the different setups investigated are introduced in Section 3. The fit to AMS-02 data and the consequences for the pulsar characteristics of our minimization analysis are illustrated in Section 4, before concluding in Section 5.
2 Positrons from Galactic pulsars
In this Section we illustrate our model for the production from PWNe, while the strategies to simulate a Galactic pulsar population will be introduced in the next Section. We also briefly remind here the basics of propagation in our Galaxy.
2.1 Injection of from pulsars
We recall here the main aspects for the emission of from pulsars and their PWNe into the ISM. The formalism is presented in [29], to which we refer for further details. Pulsars are rotating neutron stars with a strong surface magnetic field, and magnetic dipole radiation is believed to provide a good description for its observed loss of rotational energy [21, 22]. We consider a model in which are continuously injected at a rate that follows the pulsar spin-down energy. 111While ’pulsar’ and ’PWN’ have both been used in literature to indicate the source, we here use ’pulsar’ when referring to the simulated properties of pulsar at birth, while PWN is used when referring to the primary source. This scenario is indeed required to generate the TeV photons detected by Milagro and HAWC for Geminga and Monogem [50, 29, 51]. The injection spectrum of at energy and time is described as:
| (2.1) |
where the cut-off energy is fixed at TeV, GeV and is the spectral index. The magnetic dipole braking is described by the function:
| (2.2) |
where is the characteristic time scale and defines the magnetic braking index. Alternatively the injection spectrum can be parametrized with a broken power-law [26, 29], with a break at energies of the order of tens to hundreds GeV, a slope below the break and above the break , which is compatible with multiwavelenght observations of PWNe, but with large uncertainties on the parameters [52]. Here we adopt an effective approach using eq. 2.1, avoiding the increasing of the number of degrees of freedom. The possible effects of this assumption will be discussed in Section 4.3. The total energy emitted by the source only into is given by:
| (2.3) |
through which we obtain the value of , fixing =0.1 GeV [53, 54]. The parameter encodes the efficiency of conversion of the spin-down energy into (which is half of the efficiency of conversion into ). is the initial rotational energy of a pulsar with a moment of inertia (typically assumed to be g cm2, as obtained from canonical neutron star values) and rotational frequency :
| (2.4) |
The spin-down luminosity of a pulsar is the rate at which the rotational kinetic energy is dissipated:
| (2.5) |
Assuming a small deviation from the dipole nature of the magnetic field of the pulsar, the evolution of the star may be parameterized as [55]:
| (2.6) |
where the angle describes the inclination of the magnetic dipole with respect to the rotation axis, is a constant of unit sn-3 and takes the value of s G-2 for canonical characteristics of neutron stars. The spin-down luminosity evolves with time as in eq. 2.2:
| (2.7) |
From this equation, one can notice that the pulsar has roughly a constant energy output from its birth till , when the energy output starts to decrease as . Finally, the prediction on is derived to be:
| (2.8) |
In our benchmark model we will consider only sources with ages above 20 kyr, since accelerated to TeV energies in the termination shock are believed to be confined in the nebula or in the SNR until the merge of this system with the ISM, estimated to occur some kyr after the pulsar formation [56]. We thus leave out sources for which the pairs might be still confined in the parent remnant. However, this effective treatment does not account for possible spectral or time-dependent modifications of the released particles. To understand the consequences of this assumption on the interpretation of the AMS-02 flux, we also test the hypothesis that only the produced after the escaping of the pulsar from the SNR contribute to the flux at the Earth. Following [41], we define as the time at which the source leaves the parent SNR due to its proper motion and eventually forms a bow-shock nebula. The escape time of the pulsar from the remnant is described by:
| (2.9) |
where is the ISM density taken to be 3 or 1 cm-3, = erg is the energy emitted by the SN explosion and is the birth velocity of the pulsar. The formalism is reported in [57], to which we refer for further details.
2.2 Propagation of to the Earth
Once charged particles are injected in the Galaxy, they can propagate and eventually reach the Earth. We remind here very briefly the way we treat Galactic propagation of , and address the reader to [58, 59] for further details. The number density per unit time, volume of at an observed energy , a position in the Galaxy, and time , which is the solution to the propagation equation considering only diffusion and energy losses, is given by [29]:
| (2.10) |
where the integration over accounts for the PWN releasing continuously in time. The energy is the initial energy of that cool down to in a loss time :
| (2.11) |
The term is the energy loss rate, indicates the source position, and is the typical propagation length defined as:
| (2.12) |
where is the diffusion coefficient taken as a power-law in energy. The energy losses include ICS off the ISRF and the synchrotron emission on the Galactic magnetic field. The flux of at the Earth for a source of age and distance is given by:
| (2.13) |
In our analysis we will consider as benchmark case the propagation parameters as derived in [60] from a fit to the latest AMS-02 data for the B/C, antiproton and proton data. We will label this model as Benchmark-prop, where kpc2/Myr and . The value of is fixed to kpc, which is compatible with the recent results of [61]. Energy losses are computed on the interstellar photon populations at different wavelengths following [62], by taking into account the Klein-Nishina formula for ICS, and on the Galactic magnetic field with intensity G. As a comparison, we will also implement the SLIM-MED model derived in [63], with the ISRFs taken from [58] and G. This model assumes kpc2/Myr, and kpc. However, the parameter is not relevant in this study since we implement solutions without boundaries both in the radial and the vertical directions. The infinite halo approximation has been widely used to compute the flux from single sources located in the Galactic plane in [39, 64, 42].
3 Simulations of Galactic pulsar populations
| Pulsar | Simulated | Benchmark | Variations |
|---|---|---|---|
| property | quantity | ||
| Age | Uniform [0, ] | - | |
| CB20[44] | FK06[65] | ||
| Gaussian [0.3s; 0.15s] | - | ||
| Spin-down | Gaussian [12.85G; 0.55G] | Gaussian [12.65G; 0.55G] | |
| Uniform [2.5-3] | Constant [3] | ||
| cos | Uniform [0-1] | Constant [0] | |
| injection | Uniform [1.4-2.2] | - | |
| Uniform [0.01-0.1] | - | ||
| Radial | [43] | [65] | |
| distribution | |||
| Kick velocity | - | FK06VB [65] |
We simulate Galactic pulsars following the injection and propagation model described in Section 2. For each realization we compute the flux from every PWN. In what follows, we describe the strategy adopted to produce the mock catalogs and the five simulation setups considered (ModA-B-C-D-E) here. In each simulation, the total number of sources is fixed at , where is the maximum simulated age and is the pulsar birth rate. Different estimates for the Galactic range from one to four per century [66, 67, 65]. We here assume the maximum age of the sources to be = yr, and = 0.01 yr-1. However, we have checked that = yr does not change the conclusions of this paper.
In order to compute the flux at the Earth for each mock source, we need to specify its position in the Galaxy, its age and the source term (see eq. 2.1). Specifically, the fundamental parameters of each simulation are: , , , , , , and the position in Galactocentric coordinates. For a specific set of simulations, we also simulate the birth-kick velocity . A summary of the simulated quantities is illustrated in Table 1 and outlined in what follows.
First of all, the simulation assigns to each mock pulsar an age extracted uniformly between and . Then, by extending the functions implemented in the Python module gammapy.astro.population [68, 69], we sample the values of and from the distributions provided in [44] (CB20), which will be our benchmark model. Specifically, is simulated according to a Gaussian distribution with = 0.3 s and = 0.15 s. We also impose a lower bound on = 0.83 ms, as physically motivated in [70]. The magnetic field is simulated following a Gaussian distribution for , with = 12.85 G and = 0.55 G. The values of and are taken from uniform distributions, respectively in the range [2.5-3] and [0-1] according to [44]. We note that from the simulated values of we derive for each pulsar and through eqs. 2.4 and 2.8. Since the spectral index of accelerated particles is uncertain, and may vary significantly for each PWN [71, 6], it is sampled from uniform distributions within [1.4-2.2]. Finally, the value of for each source is sampled from a uniform distribution in the range [0.01-0.1].
In order to assess the effect of different distributions for and , we consider the model in [65] (FK06 hereafter). While follows the same distribution of CB20, is taken from a Gaussian distribution with = 12.65 G and = 0.55 G, while =3 and =1 for each source. We note that both CB20 and FK06 models have been calibrated to reproduce the characteristics of the sources detected in the ATNF catalog [72], like the , , , flux densities at 1.4 GHz, Galactic longitudes and Galactic latitudes distributions. CB20 is the most updated model and considers the variation of more parameters with respect to FK06.
To test the scenario described by eq. 2.9, we additionally simulate for each source its birth-kick velocity, adopting its distribution as reported in [65] (FK06VB) and implemented in gammapy.astro.population [68, 69], which is the sum of two Gaussians (see their eq. 7) for each of the 3 velocity components.
3.1 Spatial distribution of pulsars in the Galaxy
To complete the construction of the mock catalogs of Galactic sources the position of each pulsar has to be determined. Using gammapy.astro.population [68, 69] we adopt the radial surface density of pulsars proposed by [43]:
| (3.1) |
As a comparison, we also consider the radial surface density in [65]:
| (3.2) |
See [43, 65] for the values of the parameters. We sample the position of each source combining the radial surface density with the spiral arm structure of the Milky Way of [65] (see their Table 2 for the spiral arm parameters), as implemented in gammapy.astro.population [68, 69]. We test only one spiral arm structure, since the most important aspect in the computation of the flux is the source density in the arms nearby the Sun, instead of the position of the arms themselves. The distance of each source is =, with .
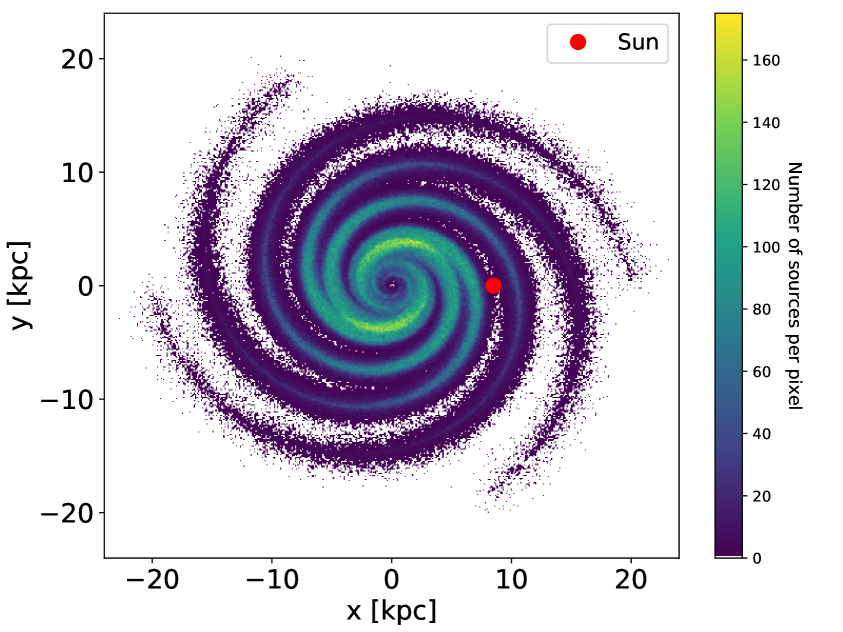
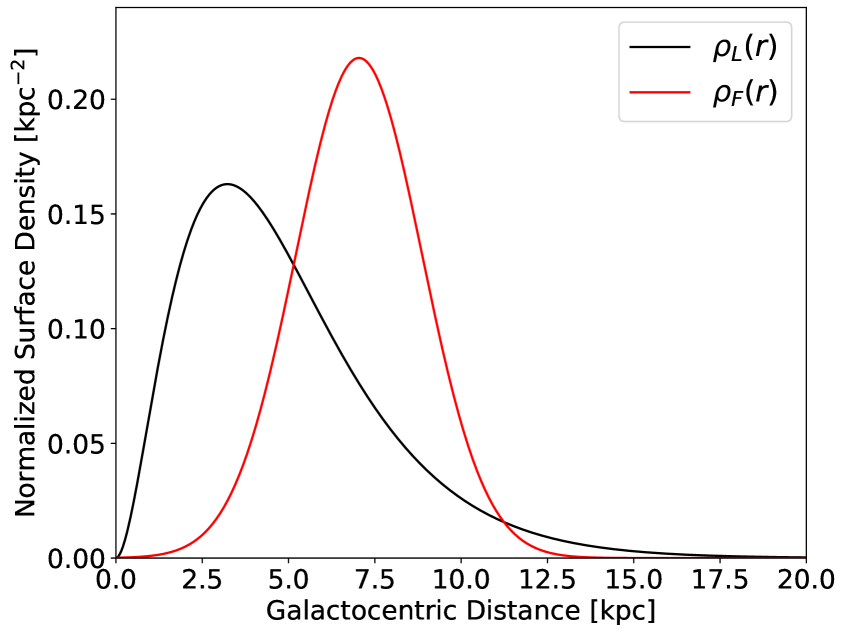
In Figure 1(a) we report the positions in the Galactic plane of the mock sources, for one configuration of our Galaxy, adopting the radial surface density. Due to the fast energy-losses that affects , the most relevant contribution to the flux will come from the two spiral arms that surround the Earth and that are named Sagittarius and Orion. In Figure 1(b) we also display the and profiles reported in eq. 3.1 and 3.2 (normalized in order to have with ). We note that is similar to other radial distributions used in literature [73, 74], and we consider it as a good benchmark. The profile effectively maximizes the effects of different radial profiles on the , by setting higher pulsar densities in the two spiral arms surrounding the Earth.
3.2 Summary of simulation setups
We recap and label here the combinations of the different simulation setups described above and listed in Table 1.
ModA (benchmark).
ModB (radial distribution effect).
ModC (spin-down properties effect).
Same as ModA, but spin-down properties are taken from FK06 [65].
ModD (propagation effect).
Same as ModA apart for propagation in the Galaxy, modelled as in [63] (their model SLIM-MED).
ModE (kick velocity effect).
Same as ModA, but considering only the emitted after the escaping of pulsars from the SNR. The birth kick velocities are sampled adopting the distribution FK06VB reported in [65].
4 Results
The aim of this paper is to study the characteristics of the Galactic pulsar population that may contribute to the flux measured by the AMS-02 experiment [3] by using simulations. We describe here how we performed the fit to the data, and which are the physics results of our minimization analysis. For each simulation setup described in Section 3.2, we build and test 1000 simulations. All the results reported in this Section refer to our benchmark ModA, if not differently stated. We compute the flux at the Earth as the sum of the primary component due to PWNe emission (see Section 2 and Section 3), and a secondary component due to the fragmentation of CRs on the nuclei of the ISM, taken from [60] or [63] consistently with the propagation model employed. The secondary component enters in our fits with a free normalization factor , which we generously let to vary between 0.01 and 3. We also let the total flux generated by the sum of all PWNe to be shifted by an overall normalization factor . The values of and are obtained for each simulation with the fit procedure.
We fit AMS-02 data [3] above 10 GeV, in order to avoid strong influence from solar modulation and other possible low energy effects [75]. Nevertheless, we correct our predictions for solar modulation effects following the force field approximation and leaving the Fisk potential free to vary between 0.4 and 1.2 GV. The comparison of our predictions with the AMS-02 data is performed by a standard minimization procedure. We neglect the presence of correlations in the systematic errors of AMS-02 data points since the Collaboration has not provided them [3]. Moreover, we do not think the smoothness of the AMS-02 data, that is the main characteristic of the observed flux that will guide our results, would be modified significantly by such correlations.
4.1 Comparison to the AMS-02 data
The fit of the predictions for the total flux to the AMS-02 data is performed for all the 1000 simulations built for each scenario A-B-C-D-E. In Table 2 we report the number of simulations, out of 1000, that produce different values of the reduced chi squared for each simulation setup.
| ModA | 15 | 8 | 4 |
|---|---|---|---|
| ModB | 30 | 19 | 6 |
| ModC | 15 | 10 | 3 |
| ModD | 42 | 25 | 10 |
| ModE | 4 | 2 | 2 |
The difference between ModA and ModD is relative only to the propagation and the energy losses models. With ModD we obtain a higher number of simulations compatible with the data: the SLIM-MED model produces indeed fluxes from single sources which are smoother with respect to Benchmark-prop, and a little bit higher at lower energies. They better accommodate the AMS-02 spectrum. In all the tested setups, the number of mock galaxies with a (2) does not exceed 1% (4%).
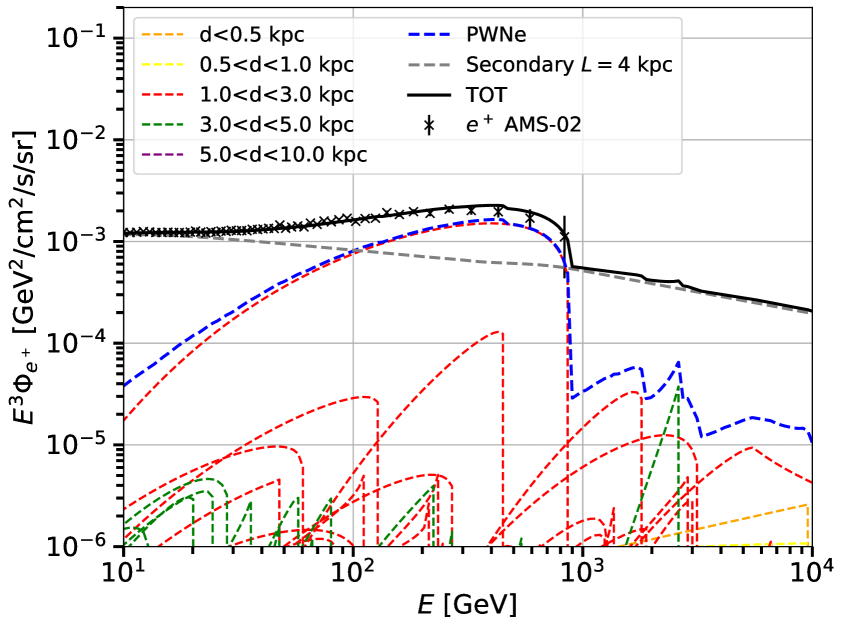
In Figure 2 we plot the flux obtained for two illustrative simulated galaxies with , within ModA. The contributions from each PWN, from the secondary emission and their sum are shown along with the AMS-02 data. The contribution from PWNe is significant for energies above 10-20 GeV and dominant over 100 GeV and may have different features, in particular at unconstrained energies above 1 TeV, depending on the specific simulation. As we will discuss later, the number of sources that contribute to the observed spectrum is limited, from a few to O(10). We notice that the secondary flux, while decreasing with energy, practically forbids the realization of sharp cut-offs in the spectrum above TeV energies. The different features of the flux from single PWNe are due to the peculiar combination of the input parameters. In particular, the peaked shape is typically associated to small and values.
All the good fits to the data provide a value for between 2 and 2.5, which might be at least partially ascribable to an underestimation of spallation cross sections [4]. As for the allowed overall normalization of the PWN primary flux, we find on average values slightly smaller than one.
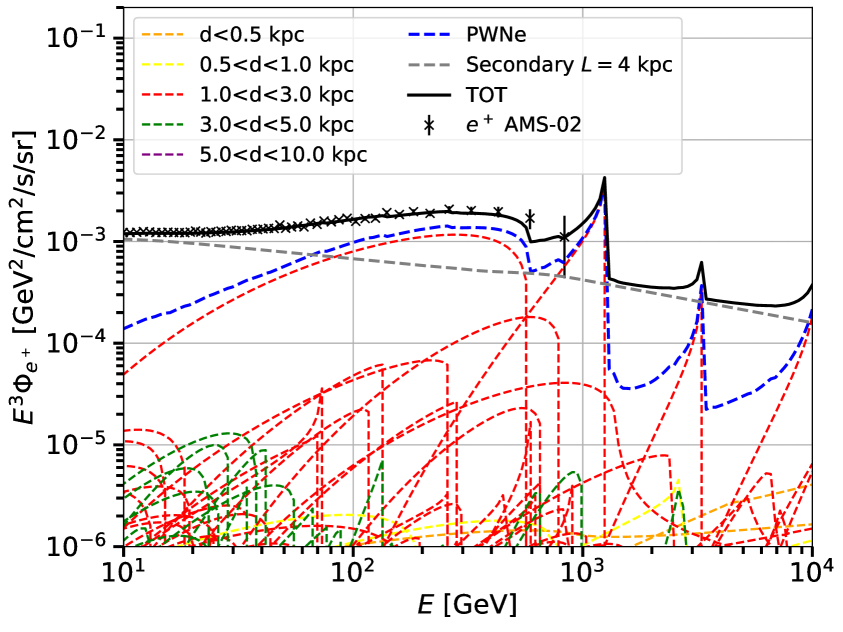
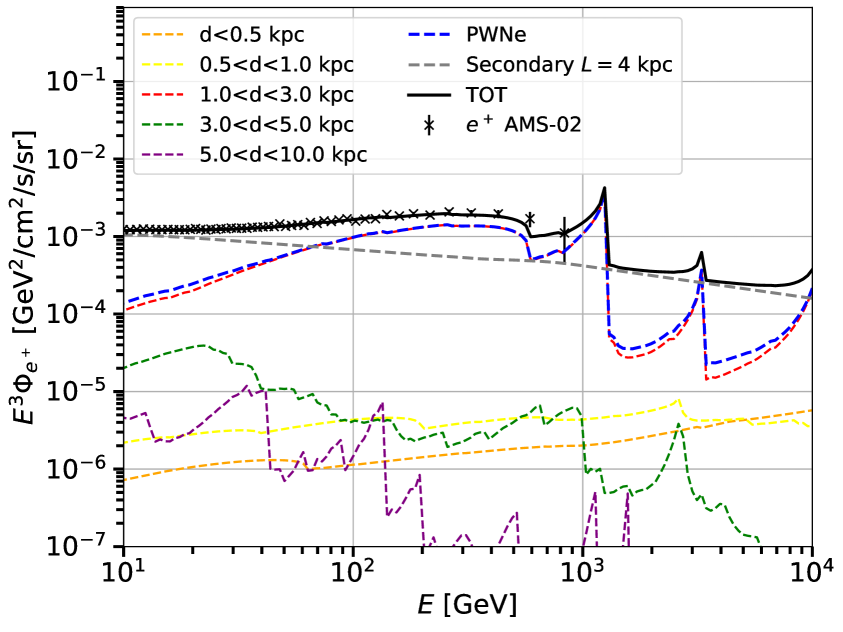
In order to understand the properties of the pulsar populations which fit the observations, we report in Figure 3 the contribution to the flux coming from pulsars grouped in different subsets of distance from the Earth (left) and age (right). In this realization, the dominant contribution comes from the ring between 1 and 3 kpc. This result is the interplay between the presence of a spiral arm (see Figure 1), which enhances the number of sources, and the typical propagation length of high-energetic , affected by severe energy losses. Despite the smaller effect from radiative cooling, the flux from sources within 1 kpc is lower due to the paucity of sources.
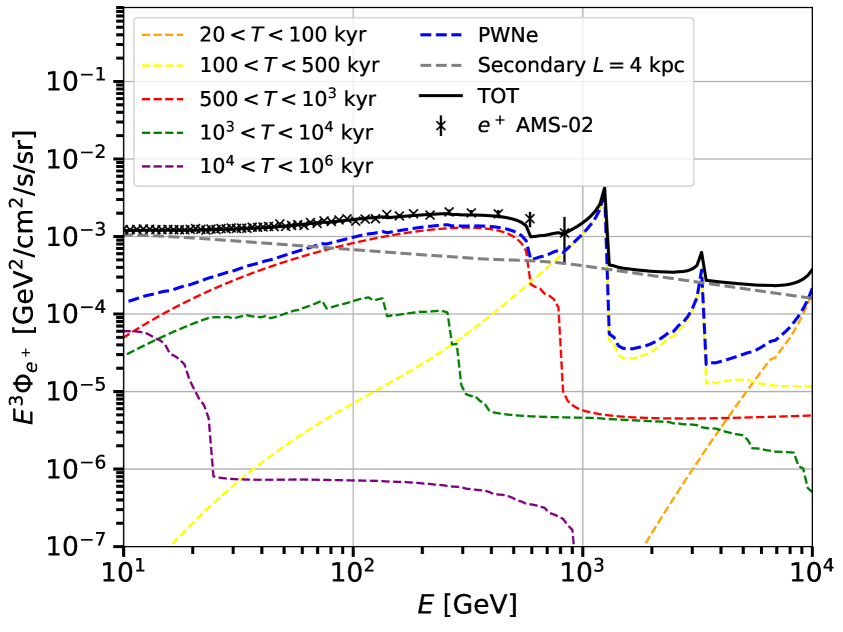
The division in age rings shows the scaling of the maximum energy with the age of sources. In the Thomson approximation energy losses would provide , inferred from . However, in the Klein-Nishina regime we observe a more complex behaviour. Pulsars older than kyr do not contribute significantly to the flux above 10 GeV, while the highest contribution around TeV energies come from sources younger than 500 kyr. We have checked that sources younger than 20 kyr do not produce sizeable effects on our analysis, and the energy range in which they would produce a relevant flux is well above AMS-02 data.
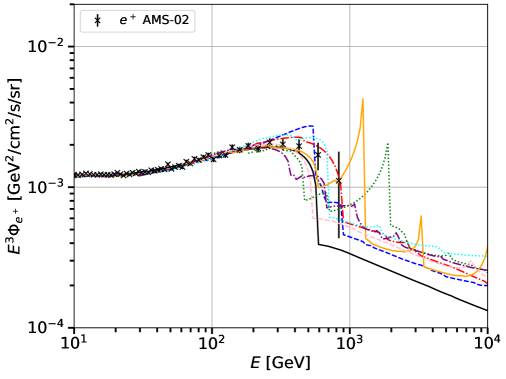
In order to inspect the effects of different simulated Galactic populations, we plot in Figure 4 the total flux for all the pulsar realizations within ModA, and having <1.5 on AMS-02 data. For energies lower than 200 GeV, differences among the realizations are indistinguishable. The data in this energy range are very constraining. Instead, above around 300 GeV the peculiarities of each galaxy show up, thanks to the larger relative errors in the data. Above 1 TeV the predictions are unconstrained by data. Nevertheless, all the simulations predict globally decreasing fluxes, as expected by energy losses and continuous injection. However, at these energies the total flux gets dominated by the secondary component.
Concerning the other simulation setups, we do not find significant differences between ModA and ModC, namely between CB20 and FK06 pulsar evolution models. For both cases on average the dominant contribution from PWNe comes from the 1-3 kpc distance ring. On the other hand, ModB gives a higher number of simulations that are compatible with the data. As shown in Figure 1(b), the radial distribution predicts a higher number of sources with respect to in the spiral arms close to the Earth. Therefore, within ModB there is a higher probability to simulate sources close to the Earth with characteristics compatible with the AMS-02 data. However, the number of simulations with is <2% for both ModA and ModB.
ModE differs from all the other cases due to the different computation of the fraction of produced by sources that actually contribute to the data (see Section 2.1). We consider the ISM density = 3 cm-3 in the computation of , see eq. 2.9. We find that, by fixing the maximum PWN efficiency of conversion of in to , only 4 simulations fit the data with and all of them are dominated by a single powerful source, with 5, at the edge of the prior. We note that the renormalization factor is related to , so that the actual efficiency of the single source is . Since this setup considers only the emitted after the escape of the pulsar from the SNR, the fit to the data selects the galaxies with sources that still have a great rotational energy that can be converted into at the exit time. Instead, if we do not put any upper limit for the parameter , i.e. to the efficiency, the number of simulations with increases to about one hundred. These unphysical values for the PWN efficiency could be partially reduced by increasing the pulsar birth rate and so the number of pulsars in the simulations, or considering a different distribution of pulsar properties at birth which systematically predicts more energetic sources.
4.2 Mean number of PWNe dominating the flux
We inspect in this Section the average number of sources which contribute the most to the and thus can shape the AMS-02 flux. We adopt two complementary criteria to estimate the number of sources that are responsible for the most significant contribution of the PWNe emission:
-
1.
AMS-02 errors: we count all the sources that produce a flux higher than the experimental flux error in at least one energy bin above 10 GeV.
-
2.
Total flux 1%: we count the sources that produce the integral of between 10 and 1000 GeV higher than 1% of the total integrated flux measured by AMS-02.
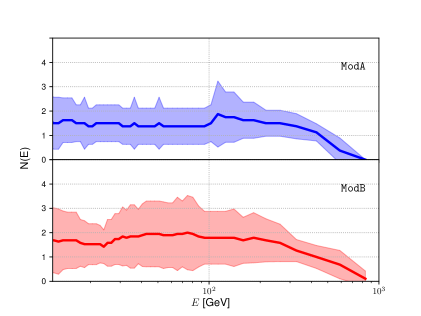
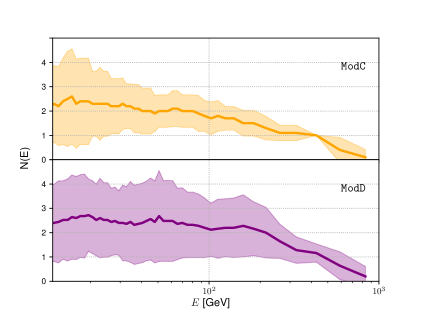
In Figure 5 we report the average number of PWNe with the standard deviation (68% containment band) that contribute in the different energy bins of AMS-02, for configurations with , adopting the AMS-02 errors criterion. On average, 2-3 sources shine with a flux at least at the level of AMS-02 data errors. We also find a decreasing number of dominant sources with increasing energy for all the setup reported. This result is partially induced by the larger experimental errors at high energy, which raise the threshold for the minimum flux that a PWN has to produce in order to satisfy the AMS-02 errors criterion. Moreover, being the age simulated in a uniform interval, the number of young sources responsible for the highest energy fluxes is smaller than for old pulsars, whose have suffered greater radiative cooling. Overall, it indicates that only a few sources with a large flux are required in order to produce a good fit to the data.
| AMS-02 errors | Total flux 1% | |
|---|---|---|
| ModA | 1.3/2.9/3.3 | 1.0/1.8/2.2 |
| ModB | 3.5 | 1.9 |
| ModC | 3.9 | 3.0 |
| ModD | 5.4 | 3.5 |
| ModE | 1.0 | 1.0 |
In Table 3 we report the average number of sources that satisfy the criteria listed above, for all the simulated galaxies which provide a good fit to AMS-02 data (). We obtain small numbers of sources responsible for most of the measured , typically around 3, irrespective of the simulation scheme. Scenarios with a large number of sources explaining the CR data are disfavored. This result is due to the fact that AMS-02 measures a smooth flux, therefore several PWNe contributing at different energies would create wiggles in the total flux which are not detected. Instead, a few sources generating a flux that covers a wide range of energies produce a smooth contribution compatible with the data.
The values found around for the parameter can be justified by the preference of the data to have a high contribution of the featureless flux of secondary. The change of propagation setup from ModA to ModD, produces an higher number of simulations that are compatible with the data, given the flux smoothing due to the alternative propagation setup. A slightly greater number of sources with respect to ModA satisfies the criteria for ModD. Dissecting results within ModA, we find that the mean number of sources decreases with decreasing , consistently with the requirement of a smooth trend of flux. In all the other simulation setups, except for ModE, we confirm the same trend. The ModE results have already been discussed in Section 4.1. Summarizing, the two selection criteria AMS-02 errors and Total flux 1%, whereas based on different quantitative assumptions, provide in practice very similar results. This result is complementary also to earlier analysis [9] adopting a different strategy and working on PAMELA, FERMI-LAT and ATIC/PPB-BETS [76, 77] data. There, a single or a few energetic pulsars are required to explain the measurements, and scenarios composed by multiple pulsars are found to be disfavored based on age and distance criteria, and by the data themselves.
4.3 Characteristics of PWNe dominating the flux
In this section we scrutinize the physical properties of the simulated sources selected by the fit to be compatible with the AMS-02 data. For each Galactic realization of ModA with , we report in Figure 6a the distance, age and maximum of the PWNe satisfying the AMS-02 errors criterion. The data require 1 or 2 sources with high maximum , with ages between 400 kyr and 2000 kyr and distances to the Earth less than 3 kpc. These sources produce fluxes peaked between 100 GeV and 500 GeV, allowing good explanation to the data. Fluxes from farther PWNe contribute less to the data. Sources with small maximum and with ages between 2000 kyr and kyr also satisfy the criterion, with flux peaks below 100 GeV where the secondaries are still the dominant component. We do not find any particular difference between all the simulation setups, except for ModD and ModE. As already noticed, since the SLIM-MED propagation implemented in ModD produces smoother fluxes, we find also some realizations with few more sources contributing with a bright flux to the data.
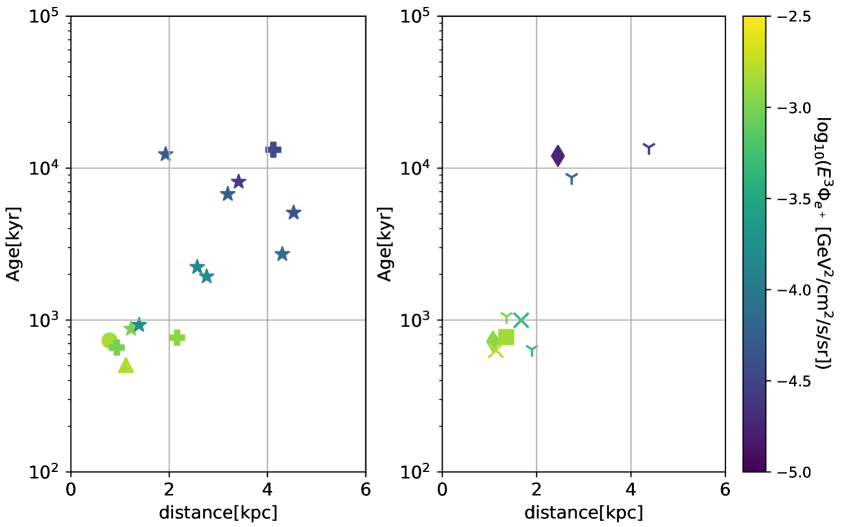
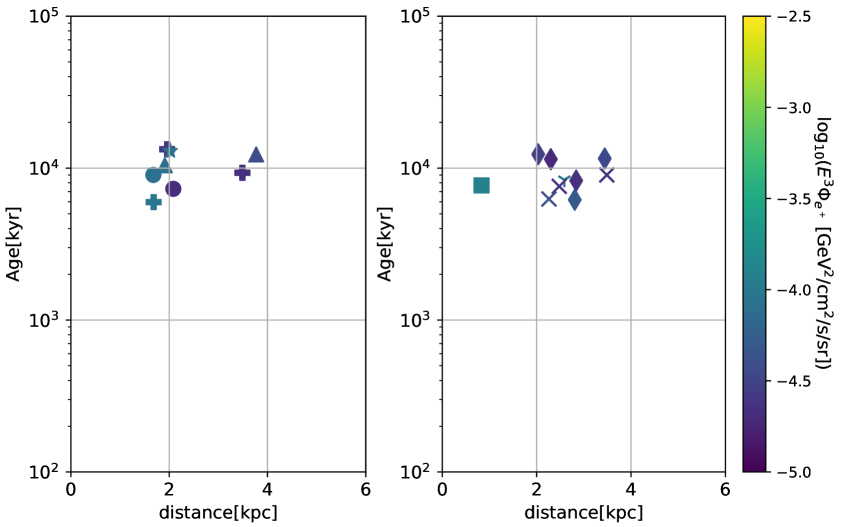
In Figure 6b we report the distances, age and maximum values of the dominant PWNe for the mock galaxies with the worst . These cases give best-fit to the data with the maximum values allowed by the priors for and the lowest values of . Moreover, there are not sources which satisfy the AMS-02 errors criterion with an age between 400 kyr and 2000 kyr. In these galaxies, the trend of at high energies remains constant or decreases, and does not contribute sufficiently to the data above 50 GeV. To compensate this effect, the fit procedure demands the highest value of .
In Figure 7 we report the distribution of best-fit efficiencies vs initial spin-down energy of each PWN that satisfies the AMS-02 errors criterion, for each simulation with . The reported efficiencies are obtained multiplying the simulated values associated to a single source with the obtained from the best fit of the corresponding galaxy. From Figure 7 it is evident that the efficiencies have a scattered distribution, and in most cases they have a value between 0.01 and 0.1, confirming the goodness of the interval initially chosen. Data hint at a slight anti-correlation between and . In order to check that the characteristics of these pulsars are consistent with observations, we compute from (see Section 2.1), finding values quite common in nature. The ATNF catalog [72] lists about 60 sources with values higher than the maximum values obtained from sources reported in Figure 7, namely erg s-1. We do not directly compare the values, since for the sources of the ATNF catalog to compute we need to assume arbitrarily the value of and . Instead, in our simulations we sample and we compute from the simulated parameters like , that is also strictly connected to . For example, the cyan circle source of Figure 7 has erg s-1 and kyr. Viceversa, considering the J0002+6216 ATNF pulsar, with erg s-1 and kyr, we obtain erg for kyr and , that changes to erg for kyr and , and to erg adopting , spanning therefore different orders of magnitude. We built our simulations starting from and distributions calibrated on observations. In the end, we obtain results which are consistent with these measurements.
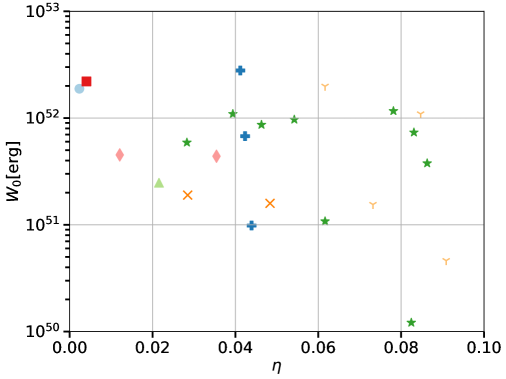
We also outline that all the sources that satisfy the AMS-02 errors criterion have values of >1.7, for all the simulation setups. Lower values of can produce peaked features incompatible with the smoothness of the AMS-02 data. The adoption of a broken power-law injection spectrum (see Section 2.1) would probably limit the presence of peaked features at high energy, thanks to the soft spectral index above the break energy. We expect to find a slightly higher number of simulations compatible with the data, together with a slightly higher number of sources satisfying the AMS-02 errors criterion, producing negligible changes of our results.
5 Conclusions
Despite the spatial and energetic distribution of pulsars and the details of the production, acceleration and release from these sources are not yet fully understood. The high-precision AMS-02 data are here used to constrain the main properties of the Galactic pulsar population and of the PWN acceleration needed to explain the observed CR flux. To this aim, we simulate a large number of Galactic pulsar populations, calibrated on ATNF catalog observations. Our simulations are conducted under different hypothesis about the pulsar spin-down and evolution properties, their radial distribution, and changing the propagation models for propagation in the Galaxy, following the most recent self-consistent modelings available in the literature. For each mock galaxy, we compute the flux at the Earth as the sum of the primary component due to PWNe emission, and a secondary component due to the fragmentation of CRs on the nuclei of the ISM. The result is fitted to AMS-02 data.
Independently of the simulation scenario, we find that the vast majority of the galaxies realizations produce several wiggles in the total contribution and therefore they do not fit well the data. In all the tested setups, the number of mock galaxies with a (2) does not exceed 1% (4%). The different features of the flux from single PWNs are due to the peculiar combination of the input parameters. We notice that the secondary flux, while decreasing with energy, practically forbids the realization of sharp cut-offs in the spectrum above TeV energies. The galaxy realizations that fit properly the AMS-02 data have between 2-3 sources that produce a yield at the level of the data errors. Moreover, these pulsars provide a smooth spectrum that cover a wide energy range. We find that the dominant contribution comes from sources located between 1 and 3 kpc from the Earth. Despite the smaller effect from radiative cooling, the flux from sources within 1 kpc is lower due to the paucity of sources set along the spiral arms of the Galaxy. Sources dominating the observed spectrum have ages between 400 kyr and 2000 kyr and distances to the Earth less than 3 kpc. These sources produce fluxes peaked between 100 GeV and 300 GeV, where AMS–02 data are the most constraining. Finally, we do not find any particular distribution for the pulsar efficiencies. In most cases they have a value between 0.01 and 0.1 consistently with what found in our previous papers [78, 29].
In [18], fluxes are computed from simulations of different combinations of pulsar spin-down properties, injection spectrum and propagation schemes. They consider sources younger than 10 Myr, relying on observations of pulsars with ages of order years. They constrain the space of pulsar and propagation models using the fraction and data. Our simulations, while being more numerous, rely on distribution of parameters simulated according to complete pulsar population models. Our focus is on the characteristics of the pulsar population whose realization fits AMS-02 data. [18] finds average values of in the range around 0.1-10%, in agreement with our results for ModA-B-C-D.
Authors of [41] adopt the bow-shock scenario explained in Section 2.1 and tested in our ModE, and analyze only a single pulsar population model. They build mock galaxies sampling the value for each source from a gaussian distribution with = 0.10 s and = 0.05 s obtained in [79], a work based on young and energetic sources, producing on average pulsars more powerful with respect to our mock catalogs. They also adopt a higher pulsar birth rate (3/century) and they fix = 12.65 . Also, a different diffusion setup is considered, which implies a higher propagation scale length . [41] finds that the number of contributing sources to the flux is much larger( at 1 TeV) than in this work and in previous works [39, 42, 64] at all energies, due to the adopted diffusion model. We add that this result is probably also induced by the bow shock scenario and the spin down model adopted. With respect to their work we focus more on the characteristics that a pulsar realization has in order to fit the data. They find = 8.5%, that rises to 42% for = 0.30 s and = 0.15 s, which is compatible with our ModE. However, more specific comparisons are difficult to perform, given the very different simulation setup between [41] and this analysis.
With this paper we have shown the power of the AMS-02 CR data in constraining properties of PWNe supposed to be sources of , in a measure to explain the flux data. Also for leptons, besides nuclei, an era has started for charged CRs to teach about the Galaxy, in addition to the invaluable electromagnetic signals.
Acknowledgments
We thank S. Recchia, M. Winkler and Y. Genolini for reading the manuscript and providing insightful comments. SM thanks Y. Genolini and P. Mertsch for inspiring discussion. MDM research is supported by Fellini - Fellowship for Innovation at INFN, funded by the European Union’s Horizon 2020 research programme under the Marie Skłodowska-Curie Cofund Action, grant agreement no. 754496. The work of FD and LO is supported by the Departments of Excellence grant awarded by the Italian Ministry of Education, University and Research (Miur), the Research grant The Dark Universe: A Synergic Multimessenger Approach, No. 2017X7X85K funded by the Miur and by the Research grant TAsP (Theoretical Astroparticle Physics) funded by Istituto Nazionale di Fisica Nucleare.
References
- [1] PAMELA collaboration, Cosmic-Ray Positron Energy Spectrum Measured by PAMELA, Phys. Rev. Lett. 111 (2013) 081102 [1308.0133].
- [2] M. Ackermann, M. Ajello, A. Allafort, W.B. Atwood, L. Baldini, G. Barbiellini et al., Measurement of separate cosmic-ray electron and positron spectra with the fermi large area telescope, Physical Review Letters 108 (2012) .
- [3] AMS Collaboration collaboration, Towards understanding the origin of cosmic-ray positrons, Phys. Rev. Lett. 122 (2019) 041102.
- [4] T. Delahaye, F. Donato, N. Fornengo, J. Lavalle, R. Lineros, P. Salati et al., Galactic secondary positron flux at the Earth, Astron. Astrophys. 501 (2009) 821 [0809.5268].
- [5] R. Diesing and D. Caprioli, Nonsecondary origin of cosmic ray positrons, Phys. Rev. D 101 (2020) 103030 [2001.02240].
- [6] D. Malyshev, I. Cholis and J. Gelfand, Pulsars versus Dark Matter Interpretation of ATIC/PAMELA, Phys. Rev. D80 (2009) 063005 [0903.1310].
- [7] D. Grasso, S. Profumo, A. Strong, L. Baldini, R. Bellazzini, E. Bloom et al., On possible interpretations of the high energy electron–positron spectrum measured by the fermi large area telescope, Astroparticle Physics 32 (2009) 140–151.
- [8] D. Hooper, P. Blasi and P.D. Serpico, Pulsars as the sources of high energy cosmic ray positrons, Journal of Cosmology and Astroparticle Physics 2009 (2009) 025–025.
- [9] N. Kawanaka, K. Ioka and M.M. Nojiri, Is cosmic ray electron excess from pulsars spiky or smooth?: Continuous and multiple electron/positron injections, The Astrophysical Journal 710 (2010) 958–963.
- [10] K. Kashiyama, K. Ioka and N. Kawanaka, White dwarf pulsars as possible cosmic ray electron-positron factories, Physical Review D 83 (2011) .
- [11] S. Kisaka and N. Kawanaka, Tev cosmic-ray electrons from millisecond pulsars, Monthly Notices of the Royal Astronomical Society 421 (2012) 3543–3549.
- [12] D. Gaggero, L. Maccione, D. Grasso, G. Di Bernardo and C. Evoli, PAMELA and AMS-02 and spectra are reproduced by three-dimensional cosmic-ray modeling, Phys. Rev. D89 (2014) 083007 [1311.5575].
- [13] I. Cholis and D. Hooper, Dark matter and pulsar origins of the rising cosmic ray positron fraction in light of new data from the ams, Physical Review D 88 (2013) .
- [14] M. Di Mauro, F. Donato, N. Fornengo, R. Lineros and A. Vittino, Interpretation of AMS-02 electrons and positrons data, JCAP 4 (2014) 6 [1402.0321].
- [15] M. Boudaud et al., A new look at the cosmic ray positron fraction, Astron. Astrophys. 575 (2015) A67 [1410.3799].
- [16] N. Tomassetti and F. Donato, The Connection Between the Positron Fraction Anomaly and the Spectral Features in Galactic Cosmic-Ray Hadrons, Astrophys. J. 803 (2015) L15 [1502.06150].
- [17] P. Lipari, Spectral shapes of the fluxes of electrons and positrons and the average residence time of cosmic rays in the Galaxy, Phys. Rev. D99 (2019) 043005 [1810.03195].
- [18] I. Cholis, T. Karwal and M. Kamionkowski, Studying the milky way pulsar population with cosmic-ray leptons, Physical Review D 98 (2018) .
- [19] M. Di Mauro, F. Donato, N. Fornengo and A. Vittino, Dark matter vs. astrophysics in the interpretation of AMS-02 electron and positron data, JCAP 5 (2016) 031 [1507.07001].
- [20] P. Mertsch, A. Vittino and S. Sarkar, Explaining cosmic ray antimatter with secondaries from old supernova remnants, 2012.12853.
- [21] A.M. Bykov, E. Amato, A.E. Petrov, A.M. Krassilchtchikov and K.P. Levenfish, Pulsar wind nebulae with bow shocks: non-thermal radiation and cosmic ray leptons, Space Sci. Rev. 207 (2017) 235 [1705.00950].
- [22] E. Amato, The theory of Pulsar Wind Nebulae: recent progress, PoS HEPROVII (2020) 033 [2001.04442].
- [23] B.M. Gaensler, N.S. Schulz, V.M. Kaspi, M.J. Pivovaroff and W.E. Becker, XMM-NewtonObservations of PSR b1823-13: An asymmetric synchrotron nebula around a vela-like pulsar, The Astrophysical Journal 588 (2003) 441.
- [24] P. Slane, Pulsar Wind Nebulae, Handbook of Supernovae, ISBN 978-3-319-21845-8. Springer International Publishing AG, 2017, p. 2159, 1703.09311.
- [25] A.A. Abdo, B.T. Allen, T. Aune et al., Milagro Observations of Multi-TeV Emission from Galactic Sources in the Fermi Bright Source List, ApJL 700 (2009) L127 [0904.1018].
- [26] HAWC collaboration, Extended gamma-ray sources around pulsars constrain the origin of the positron flux at Earth, Science 358 (2017) 911 [1711.06223].
- [27] HAWC collaboration, Multiple Galactic Sources with Emission Above 56 TeV Detected by HAWC, Phys. Rev. Lett. 124 (2020) 021102 [1909.08609].
- [28] LHAASO collaboration, Extended Very-High-Energy Gamma-Ray Emission Surrounding PSR J0622+3749 Observed by LHAASO-KM2A, Phys. Rev. Lett. 126 (2021) 241103 [2106.09396].
- [29] M. Di Mauro, S. Manconi and F. Donato, Detection of a -ray halo around Geminga with the Fermi -LAT data and implications for the positron flux, Phys. Rev. D 100 (2019) 123015 [1903.05647].
- [30] T. Linden, K. Auchettl, J. Bramante, I. Cholis, K. Fang, D. Hooper et al., Using HAWC to discover invisible pulsars, Phys. Rev. D96 (2017) 103016 [1703.09704].
- [31] M. Di Mauro, S. Manconi and F. Donato, Evidences of low-diffusion bubbles around Galactic pulsars, Phys. Rev. D 101 (2020) 103035 [1908.03216].
- [32] M. Di Mauro, S. Manconi, M. Negro and F. Donato, Investigating -ray halos around three HAWC bright sources in Fermi-LAT data, 2012.05932.
- [33] C. Evoli, T. Linden and G. Morlino, Self-generated cosmic-ray confinement in TeV halos: Implications for TeV -ray emission and the positron excess, Phys. Rev. D98 (2018) 063017 [1807.09263].
- [34] R. López-Coto and G. Giacinti, Constraining the properties of the magnetic turbulence in the Geminga region using HAWC -ray data, Mon. Not. Roy. Astron. Soc. 479 (2018) 4526 [1712.04373].
- [35] R.-Y. Liu, H. Yan and H. Zhang, Understanding the Multiwavelength Observation of Geminga’s Tev Halo: The Role of Anisotropic Diffusion of Particles, Phys. Rev. Lett. 123 (2019) 221103 [1904.11536].
- [36] K. Fang, X.-J. Bi and P.-F. Yin, Possible origin of the slow-diffusion region around Geminga, Mon. Not. Roy. Astron. Soc. 488 (2019) 4074 [1903.06421].
- [37] S. Recchia, M. Di Mauro, F.A. Aharonian, F. Donato, S. Gabici and S. Manconi, Does the Geminga -ray halo imply slow diffusion around pulsars?, 2106.02275.
- [38] S. Manconi, M. Di Mauro and F. Donato, Dipole anisotropy in cosmic electrons and positrons: inspection on local sources, JCAP 01 (2017) 006 [1611.06237].
- [39] O. Fornieri, D. Gaggero and D. Grasso, Features in cosmic-ray lepton data unveil the properties of nearby cosmic accelerators, Journal of Cosmology and Astroparticle Physics 2020 (2020) 009.
- [40] M. Di Mauro, F. Donato and S. Manconi, On the interpretation of the latest AMS-02 cosmic ray electron spectrum, 2010.13825.
- [41] C. Evoli, E. Amato, P. Blasi and R. Aloisio, Galactic factories of cosmic-ray electrons and positrons, Physical Review D 103 (2021) .
- [42] S. Manconi, M. Di Mauro and F. Donato, Contribution of pulsars to cosmic-ray positrons in light of recent observation of inverse-Compton halos, Phys. Rev. D 102 (2020) 023015 [2001.09985].
- [43] D.R. Lorimer, A.J. Faulkner, A.G. Lyne, R.N. Manchester, M. Kramer, M.A. McLaughlin et al., The parkes multibeam pulsar survey - vi. discovery and timing of 142 pulsars and a galactic population analysis, Monthly Notices of the Royal Astronomical Society 372 (2006) 777–800.
- [44] A. Chakraborty and M. Bagchi, Understanding the Galactic population of normal pulsars: A leap forward, 2012.13243.
- [45] S. Manconi, M.D. Mauro and F. Donato, Multi-messenger constraints to the local emission of cosmic-ray electrons, Journal of Cosmology and Astroparticle Physics 2019 (2019) 024–024.
- [46] Fermi-LAT collaboration, Cosmic-ray electron-positron spectrum from 7 GeV to 2 TeV with the Fermi Large Area Telescope, Phys. Rev. D 95 (2017) 082007 [1704.07195].
- [47] AMS collaboration, Towards understanding the origin of cosmic-ray electrons, Phys. Rev. Lett. 122 (2019) 101101.
- [48] DAMPE collaboration, Direct detection of a break in the teraelectronvolt cosmic-ray spectrum of electrons and positrons, Nature 552 (2017) 63–66.
- [49] CALET collaboration, Extended measurement of the cosmic-ray electron and positron spectrum from 11 gev to 4.8 tev with the calorimetric electron telescope on the international space station, Phys. Rev. Lett. 120 (2018) 261102.
- [50] A.U. Abeysekara et al., The 2HWC HAWC Observatory Gamma Ray Catalog, Astrophys. J. 843 (2017) 40 [1702.02992].
- [51] H. Yuksel, M.D. Kistler and T. Stanev, TeV Gamma Rays from Geminga and the Origin of the GeV Positron Excess, Phys. Rev. Lett. 103 (2009) 051101 [0810.2784].
- [52] D.F. Torres, A. Cillis, J. Martín and E. de Oña Wilhelmi, Time-dependent modeling of TeV-detected, young pulsar wind nebulae, JHEAp 1-2 (2014) 31 [1402.5485].
- [53] I. Sushch and B. Hnatyk, Modelling of the radio emission from the Vela supernova remnant, Astron. Astrophys. 561 (2014) A139 [1312.0777].
- [54] I. Buesching, O.C. de Jager, M.S. Potgieter and C. Venter, A Cosmic Ray Positron Anisotropy due to Two Middle-Aged, Nearby Pulsars?, Astrophys. J. 678 (2008) L39 [0804.0220].
- [55] J.P. Ridley and D.R. Lorimer, Isolated pulsar spin evolution on the diagram, Monthly Notices of the Royal Astronomical Society 404 (2010) 1081–1088.
- [56] P. Blasi and E. Amato, Positrons from pulsar winds, Astrophysics and Space Science Proceedings 21 (2011) 624 [1007.4745].
- [57] E. van der Swaluw, A. Achterberg, Y.A. Gallant, T.P. Downes and R. Keppens, Interaction of high-velocity pulsars with supernova remnant shells, A&A 397 (2003) 913–920.
- [58] T. Delahaye, J. Lavalle, R. Lineros, F. Donato and N. Fornengo, Galactic electrons and positrons at the Earth: new estimate of the primary and secondary fluxes, A&A 524 (2010) A51 [1002.1910].
- [59] S. Manconi, M. Di Mauro and F. Donato, Multi-messenger constraints to the local emission of cosmic-ray electrons, JCAP 04 (2019) 024 [1803.01009].
- [60] M.D. Mauro and M.W. Winkler, Multimessenger constraints on the dark matter interpretation of the fermi-lat galactic center excess, 2101.11027.
- [61] N. Weinrich, M. Boudaud, L. Derome, Y. Genolini, J. Lavalle, D. Maurin et al., Galactic halo size in the light of recent AMS-02 data, Astron. Astrophys. 639 (2020) A74 [2004.00441].
- [62] S. Vernetto and P. Lipari, Absorption of very high energy gamma rays in the Milky Way, Phys. Rev. D94 (2016) 063009 [1608.01587].
- [63] Y. Génolini, M. Boudaud, M. Cirelli, L. Derome, J. Lavalle, D. Maurin et al., New minimal, median, and maximal propagation models for dark matter searches with galactic cosmic rays, 2103.04108.
- [64] S. Recchia, S. Gabici, F. Aharonian and J. Vink, Local fading accelerator and the origin of tev cosmic ray electrons, Physical Review D 99 (2019) .
- [65] C.-A. Faucher-Giguere and V.M. Kaspi, Birth and Evolution of Isolated Radio Pulsars, ApJ 643 (2006) 332 [astro-ph/0512585].
- [66] D.R. Lorimer, The Galactic Population and Birth Rate of Radio Pulsars, astro-ph/0308501.
- [67] E.F. Keane and M. Kramer, On the birthrates of Galactic neutron stars, Mon. Not. Roy. Astron. Soc. 391 (2008) 2009 [0810.1512].
- [68] C. Nigro, C. Deil, R. Zanin, T. Hassan, J. King, J.E. Ruiz et al., Towards open and reproducible multi-instrument analysis in gamma-ray astronomy, Astronomy and Astrophysics 625 (2019) A10.
- [69] CTA Consortium collaboration, Gammapy - A prototype for the CTA science tools, PoS ICRC2017 (2018) 766 [1709.01751].
- [70] J. Lattimer and M. Prakash, Neutron star observations: Prognosis for equation of state constraints, Physics Reports 442 (2007) 109–165.
- [71] B.M. Gaensler and P.O. Slane, The evolution and structure of pulsar wind nebulae, Ann. Rev. Astron. Astrophys. 44 (2006) 17 [astro-ph/0601081].
- [72] R.N. Manchester, G.B. Hobbs, A. Teoh and M. Hobbs, The Australia Telescope National Facility Pulsar Catalogue, AJ 129 (2005) 1993 [astro-ph/0412641].
- [73] G.L. Case and D. Bhattacharya, A new sigma-d relation and its application to the galactic supernova remnant distribution, The Astrophysical Journal 504 (1998) 761–772.
- [74] I. Yusifov and I. Küçük, Revisiting the radial distribution of pulsars in the galaxy, A&A 422 (2004) 545–553.
- [75] M. Boudaud, E.F. Bueno, S. Caroff, Y. Genolini, V. Poulin, V. Poireau et al., The pinching method for Galactic cosmic ray positrons: implications in the light of precision measurements, Astron. Astrophys. 605 (2017) A17 [1612.03924].
- [76] J. Chang et al., An excess of cosmic ray electrons at energies of 300–800 gev, Nature 456 (2008) 362.
- [77] S. Torii et al., High-energy electron observations by ppb-bets flight in antarctica, 2008.
- [78] M. Di Mauro, F. Donato, N. Fornengo et al., Interpretation of AMS-02 electrons and positrons data, JCAP 1404 (2014) 006 [1402.0321].
- [79] K.P. Watters and R.W. Romani, The galactic population -ray pulsars, The Astrophysical Journal 727 (2011) 123.