Department of Child and Adolescent Psychiatry,
Ludwig-Maximilians-Universität, Munich, Germany
Combining 3D Image and Tabular Data via the Dynamic Affine Feature Map Transform††thanks: S. Pölsterl and T.N. Wolf – These authors contributed equally to this work.
Abstract
Prior work on diagnosing Alzheimer’s disease from magnetic resonance images of the brain established that convolutional neural networks (CNNs) can leverage the high-dimensional image information for classifying patients. However, little research focused on how these models can utilize the usually low-dimensional tabular information, such as patient demographics or laboratory measurements. We introduce the Dynamic Affine Feature Map Transform (DAFT), a general-purpose module for CNNs that dynamically rescales and shifts the feature maps of a convolutional layer, conditional on a patient’s tabular clinical information. We show that DAFT is highly effective in combining 3D image and tabular information for diagnosis and time-to-dementia prediction, where it outperforms competing CNNs with a mean balanced accuracy of 0.622 and mean c-index of 0.748, respectively. Our extensive ablation study provides valuable insights into the architectural properties of DAFT. Our implementation is available at https://github.com/ai-med/DAFT.
1 Introduction
In recent years, deep convolutional neural networks (CNNs) have become the standard for classification of Alzheimer’s disease (AD) from magnetic resonance images (MRI) of the brain (see e.g. [4, 29] for an overview). CNNs excel at extracting high-level information about the neuroanatomy from MRI. However, brain MRI only offers a partial view on the underlying changes causing cognitive decline. Therefore, clinicians and researchers often rely on tabular data such as patient demographics, family history, or laboratory measurements from cerebrospinal fluid for diagnosis. In contrast to image information, tabular data is typically low-dimensional and individual variables capture rich clinical knowledge.
Due to image and tabular data being complementary to each other, it is desirable to amalgamate both sources of information in a single neural network such that one source of information can inform the other. The effective integration is challenging, because the dimensionality mismatch between image and tabular data necessitates an architecture where the capacity required to summarize the image is several orders of magnitude higher than the one required to summarize the tabular data. This imbalance in turn implicitly encourages the network to focus on image-related parameters during training, which ultimately can result in a model that is only marginally better than a CNN using the image data alone [24]. Most existing deep learning approaches integrate image and tabular data naïvely by concatenating the latent image representation with the tabular data in the final layers of the network [6, 10, 18, 21, 23, 26]. In such networks, the image and tabular parts have only minimal interaction and are limited in the way one part can inform the other. To enable the network to truly view image information in the context of the tabular information, and vice versa, it is necessary to increase the network’s capacity and interweave both sources of information.
We propose to increase a CNN’s capacity to fuse information from a patient’s 3D brain MRI and tabular data via the Dynamic Affine Feature Map Transform (DAFT). DAFT is a generic module that can be integrated into any CNN architecture that establishes a two-way exchange of information between high-level concepts learned from the 3D image and the tabular biomarkers. DAFT uses an auxiliary neural network to dynamically incite or repress each feature map of a convolutional layer conditional on both image and tabular information. In our experiments on AD diagnosis and time-to-dementia prediction, we show that DAFT leads to superior predictive performance than using image or tabular data alone, and that it outperforms previous approaches that combine image and tabular data in a single neural network by a large margin.
2 Related Work
A naïve approach to combine image and tabular data is to first train a CNN on the image data, and use its prediction (or latent representation) together with tabular data in a second, usually linear, model. This way, the authors of [19] combined regions of interest extracted from brain MRI with routine clinical markers to predict progression to AD. Since image descriptors are learned independently of the clinical markers, descriptors can capture redundant information, such as a patient’s age, instead of complementing it. This is alleviated when using a single network that concatenates the clinical information with the latent image representation prior to the last fully connected (FC) layer, which has been done in [10] with histopathology images, genomic data, and demographics for survival prediction, and in [18, 26] with hippocampus shape and clinical markers for time-to-dementia prediction. The disadvantage of this approach is that tabular data only contributes to the final prediction linearly. If concatenation is followed by a multilayer perceptron (MLP), rather than a single FC layer, non-linear relationships between image and tabular data can be captured. This was applied by the authors of [23] to learn from digital pathology images and genomic data, and of [6, 21] to learn from brain MRI and clinical markers for AD diagnosis. Closely related to the above, the authors of [5, 20, 27] use an MLP on the tabular data before concatenation, and on the combined representation after concatenation. However, both approaches are restricted to interactions between the global image descriptor and tabular data and do not support fine-grained interactions.
In contrast, Duanmu et al. [3] fused information in a multiplicative manner for predicting response to chemotherapy. They use an auxiliary network that takes the tabular data and outputs a scalar weight for each feature map of every other convolutional layer of their CNN. Thus, a patient’s tabular data can amplify or repress the contribution of image-derived latent representations at multiple levels. The downside of their approach is that the number of weights in the auxiliary network scales quadratically with the depth of the CNN, which quickly becomes impracticable. The Feature-wise Linear Modulation (FiLM) layer, used in visual question-answering, is the most similar to our approach [25]. FiLM has an auxiliary network that takes the text of the question and outputs an affine transformation to scale and shift each feature map of a convolutional layer. In the medical domain, the only approach based on FiLM is for image segmentation to account for lesion size or cardiac cycle phase [14]. In contrast to the above, we focus on disease prediction and utilize tabular information that is complementary to the image information, rather than describing image contents or semantics. Moreover, our proposed DAFT scales and shifts feature maps of a convolutional layer conditional on both image and tabular data.
3 Methods
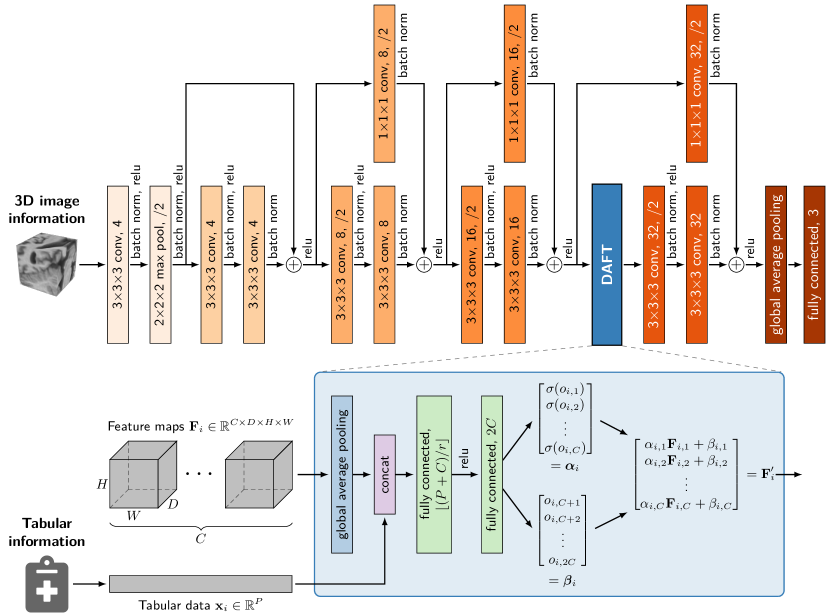
We are seeking a CNN that utilizes high-dimensional 3D image information and seamlessly accounts for complementary low-dimensional tabular information in its predictions. We use a ResNet [11] architecture and achieve tight integration of both sources of information by dynamically scaling and shifting the feature maps of a 3D convolutional layer, conditional on a patient’s image and clinical tabular information. Since tabular information often comprises demographics and summary measures that describe the patient’s state as a whole, we require a level exchange of information between tabular and image data. Therefore, we propose to affinely transform the output of a convolutional layer in the last residual block, which is able to describe the image in terms of high-level concepts rather than primitive concepts, such as edges. Fig. 1 summarizes our network.
For the -th instance in the dataset, we let denote the tabular clinical information, and denote the -th output (feature map) of a convolutional layer based on the -th volumetric image (). We propose to incite or repress high-level concepts learned from the image, conditional on the image and tabular data. To this end, we learn the Dynamic Affine Feature Map Transform (DAFT), with scale and offset :
| (1) |
where , are arbitrary functions that map the image and tabular data to a scalar. We model , by a single auxiliary neural network that outputs one , pair, which we refer to as DAFT (see Fig. 1). DAFT first creates a bottleneck by global average pooling of the image feature map, concatenating the tabular data, and squeezing the combined vector by a factor via an FC layer. Next, both vectors are concatenated and fed to an MLP that outputs vectors and ; following [13], all FC layers do not have bias terms. Note that we only apply an activation function to the scale , but not the offset – we explore linear, sigmoid, and tanh activations in our experiments. The proposed DAFT is computationally efficient, because it does not depend on the number of instances in the dataset, nor the spatial resolution of the feature maps. DAFT can dynamically produce a scale factor and offset conditional on a patient’s specific image and tabular information due to parameter sharing. Finally, note that our principal idea of DAFT is not restricted to the CNN in Fig. 1, but can be integrated in any type of CNN.
4 Experiments
| Task | Subjects | Age | Male | Diagnosis |
|---|---|---|---|---|
| Diagnosis | 1341 | 51.8% | Dementia (19.6%), MCI (40.1%), CN (40.3%) | |
| Progression | 755 | 60.4% | Progressor (37.4%), median follow-up time 2.01 years |
We evaluate DAFT on two tasks using T1 brain MRI from the Alzheimer’s Disease Neuroimaging Initiative [15]: (i) diagnosing patients as cognitively normal (CN), mild cognitive impaired (MCI), or demented, and (ii) predicting the time of dementia onset for MCI patients. We formulate the diagnosis task as a classification problem, and the time-to-dementia task as a survival analysis problem, i.e., dementia onset has only been observed for a subset of patients, whereas the remaining patients remained stable during the observation period (right censored time of onset). Table 1 summarizes the datasets.
4.1 Data Processing
We first segment scans with FreeSurfer [8] and extract a region of interest of size around the left hippocampus, as it is known to be strongly affected by AD [9]. Next, we normalize images following the minimal pre-processing pipeline in [29]. Tabular data comprises 9 variables: age, gender, education, ApoE4, cerebrospinal fluid biomarkers A, P-tau181 and T-tau, and two summary measures derived from 18F-fluorodeoxyglucose and florbetapir PET scans. To account for missing values, we adopt an approach similar to [17] by appending binary variables indicating missingness for all features, except age, gender, and education which are always present. This allows the network to use incomplete data and learn from missingness patterns. In total, tabular data comprises features. To avoid data leakage due to confounding effects of age and sex [29], data is split into 5 non-overlapping folds using only baseline visits such that diagnosis, age and sex are balanced across folds [12]. We use one fold as test set and combine the remaining folds such that 80% of it comprise the training set and 20% the validation set. For the diagnosis task, we extend the training set, but not validation or test, by including each patient’s longitudinal data ( visits per patient). For the time-to-dementia task, we only include patients with MCI at baseline and exclude patients with bi-directional change in diagnosis such that all patients remain MCI or progress to dementia.
4.2 Evaluation Scheme
We consider two unimodal baselines: (i) a ResNet [11] that only uses the image information based on the architecture in Fig. 1, but without DAFT, and (ii) a linear model using only the tabular information.111We explored gradient boosted models too, but did not observe any advantage. Moreover, we fit a separate linear model where the latent image representation from the aforementioned ResNet is combined with the tabular data (Linear model /w ResNet features). The linear model is a logistic regression model for diagnosis, and Cox’s model for time-to-dementia prediction [2]. As baselines, we evaluate three concatenation-based networks with the same ResNet backbone as in Fig. 1. In Concat-1FC, the tabular data is concatenated with the latent image feature vector and fed directly to the final classification layer. Thus, it models tabular data linearly – identical to the linear model baseline – but additionally learns an image descriptor, as in [10, 18, 26]. In Concat-2FC, the concatenated vector is fed to an FC bottleneck layer prior to the classification layer, similar to [6, 21]. Inspired by [27], 1FC-Concat-1FC feeds the tabular information to an FC bottleneck layer before concatenating it with the latent image representation, as in Concat-1FC. In addition, we evaluate the network introduced by Duanmu et al. [3], and the FiLM layer [25], originally proposed for visual question answering, in place of DAFT. Our implementation of the DAFT and competing methods is available at https://github.com/ai-med/DAFT.
| Balanced Accuracy | Concordance Index | ||||||
| I | T | Validation | Testing | Validation | Testing | ||
| Linear Model | ✗ | L | 0.571 0.024 | 0.552 0.020 | 0.726 0.040 | 0.719 0.077 | |
| ResNet | ✓ | – | 0.568 0.015 | 0.504 0.016 | 0.669 0.032 | 0.599 0.054 | |
|
Linear Model
/w ResNet Features |
✓ | L | 0.585 0.050 | 0.559 0.053 | 0.743 0.026 | 0.693 0.044 | |
| Concat-1FC | ✓ | L | 0.630 0.043 | 0.587 0.045 | 0.755 0.025 | 0.729 0.086 | |
| Concat-2FC | ✓ | NL | 0.633 0.036 | 0.576 0.036 | 0.769 0.026 | 0.725 0.039 | |
| 1FC-Concat-1FC | ✓ | NL | 0.632 0.020 | 0.591 0.024 | 0.759 0.035 | 0.723 0.056 | |
| Duanmu et al. [3] | ✓ | NL | 0.634 0.015 | 0.578 0.019 | 0.733 0.031 | 0.706 0.086 | |
| FiLM [25] | ✓ | NL | 0.652 0.033 | 0.601 0.036 | 0.750 0.025 | 0.712 0.060 | |
| DAFT | ✓ | NL | 0.642 0.012 | 0.622 0.044 | 0.753 0.024 | 0.748 0.045 | |
| ResNet | Concat-1FC | Concat-2FC | 1FC-Concat-1FC | Duanmu et al. [3] | FiLM [25] | DAFT |
| 8.9 s | 8.9 s | 8.9 s | 8.9 s | 9.0 s | 8.7 s | 9.0 s |
The networks Concat-2FC, 1FC-Concat-1FC, FiLM and DAFT, contain a bottleneck layer, which we set to 4 dimensions, which is roughly one fourth of the number of tabular features. For FiLM and DAFT, we use the identity function in the auxiliary network for the scale . In the diagnosis task, we minimize the cross-entropy loss. For progression analysis, we account for right censored progression times by minimizing the negative partial log likelihood of Cox’s model [7]. We use the AdamW optimizer for both tasks [22]. We train for 30 and 80 epochs in the diagnosis and progression task respectively, and shrink the initial learning rate by 10 when 60% has been completed and by 20 when 90% has been completed. For each network, we optimize learning rate and weight decay on the validation set using grid search with a total of configurations. 222learning rate , weight decay We report the performance on the test set with respect to the best performing model on the validation set. For diagnosis, we use the balanced accuracy (bACC; [1]) to account for class imbalance, and for time-to-dementia analysis, we use an inverse probability of censoring weighted estimator of the concordance index (c-index; [28]), which is identical to the area under the receiver operating characteristics curve if the outcome is binary and no censoring is present.
5 Results
5.0.1 Predictive Performance.
Table 2 summarizes the predictive performance of all models. For both tasks, we observe that the linear model using only the tabular data outperforms the ResNet using only the image data. This is expected as tabular data comprises amyloid-specific measures derived from cerebrospinal fluid and PET imaging that are known to become abnormal before changes in MRI are visible [16]. Moreover, when learning image descriptors independently of the tabular clinical data and combining both subsequently, the predictive performance does not increase significantly (third row). This suggests that the learned image descriptor is not complementing the clinical information. In the diagnosis task, all Concat networks were successful in extracting complementary image information, leading to an increase in the average bACC by at least 0.024. In the time-to-dementia task, the improvement in c-index is at most 0.01 over the linear model, and when accounting for the variance, the improvement must be considered insignificant. The network by Duanmu et al. [3] generally performs worse than the Concat networks and is outperformed by the linear model on the time-to-dementia task too (0.013 higher mean c-index). The FiLM-based network has a marginal lead over all Concat networks on the diagnosis task (0.011 higher mean bACC), but falls behind on the time-to-dementia task (0.013 lower mean c-index). These results clearly demonstrate that Concat approaches cannot achieve the level of integration to fully utilize the complementary nature of image and tabular information, and that integrating tabular data with both low and high-level descriptors of the image, as done by Duanmu et al. [3], can severely deteriorate performance. Our proposed DAFT network is the only approach that excels at integrating image and tabular data for both tasks by outperforming competing methods by a large margin (0.021 higher bACC, 0.019 higher c-index). Finally, table 3 summarizes the training times of networks, which shows that the runtime increase due to DAFT is negligible.
5.0.2 Ablation Study.
To better understand under which settings DAFT can best integrate tabular data, we perform an ablation study with respect to (i) its location within the last ResBlock, (ii) the activation function for the scale , and (iii) whether one of scale and offset is sufficient. Following [25], we turn the parameters of batch normalization layers that immediately precede the DAFT off. From Table 4, we observe that DAFT is relatively robust to the choice of location. Importantly, DAFT outperforms all Concat networks on the diagnosis task, irrespective of its location. For the progression task, only the location before the first ReLU leads to a performance loss. Regarding the type of transformation, the results for diagnosing show that scaling is more essential than shifting, but removing any of them comes with a decisive performance drop of at least 0.013 bACC. For progression analysis, the DAFT’s capacity seems to be sufficient if one of them is present. Finally, leaving the scale parameter unconstrained, as in the proposed configuration, is clearly beneficial for diagnosis, but for progression analysis constraining the scale leads to an increase in mean c-index. Only two configurations of DAFT are outperformed by Concat baselines, which highlights its robustness. Moreover, the optimal configuration differs between tasks, hence, further gains are possible when optimizing these choices for a given task.
Impact of .
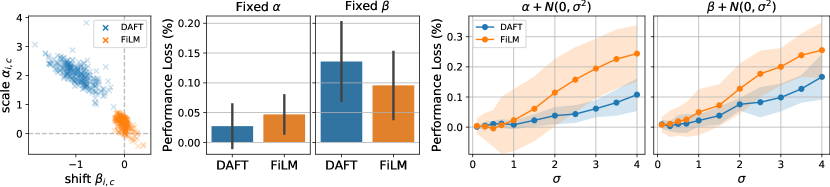
To compare the impact of and , we run test time ablations on the fully trained models from the diagnosis task by modifying or during inference. Fig. 2 (left) shows that the range of and is higher for DAFT than for FiLM, which uses and values close to zero. DAFT expresses a more dynamic behavior than FiLM, which could explain its performance gain. Next, we remove the conditioning information from either or by replacing it with its mean across the training set (Fig. 2, center). The larger difference when removing conditioning from suggests that DAFT is more effective in integrating tabular information to shift feature maps, whereas FiLM is overall less effective and depends on scaling and shifting. This is also supported by our third test time ablation, where we add Gaussian noise to or (Fig. 2, right). For DAFT, the performance loss is larger when distorting , whereas it is equal for FiLM. In addition, DAFT seems in general more robust to inaccurate or than FiLM.
| Configuration | Balanced Accuracy | Concordance Index |
|---|---|---|
| Before Last ResBlock | 0.598 0.038 | 0.749 0.052 |
| Before Identity-Conv | 0.616 0.018 | 0.745 0.036 |
| Before 1st ReLU | 0.622 0.024 | 0.713 0.085 |
| Before 2nd Conv | 0.612 0.034 | 0.759 0.052 |
| 0.581 0.053 | 0.743 0.015 | |
| 0.609 0.024 | 0.746 0.057 | |
| 0.600 0.025 | 0.756 0.064 | |
| 0.600 0.025 | 0.770 0.047 | |
| Proposed | 0.622 0.044 | 0.748 0.045 |
6 Conclusion
Brain MRI can only capture a facet of the underlying dementia-causing changes and other sources of information such as patient demographics, laboratory measurements, and genetics are required to see the MRI in the right context. Previous methods often focus on extracting image information via deep neural networks, but naïvely account for other sources in the form of tabular data via concatenation, which results in minimal exchange of information between image- and tabular-related parts of the network. We proposed the Dynamic Affine Feature Map Transform (DAFT) to incite or repress high-level concepts learned from a 3D image, conditional on both image and tabular information. Our experiments on Alzheimer’s disease diagnosis and time-to-dementia prediction showed that DAFT outperforms previous deep learning approaches that combine image and tabular data. Overall, our results support the case that DAFT is a versatile approach to integrating image and tabular data that is likely applicable to many medical data analysis tasks outside of dementia too.
Acknowledgements.
This research was supported by the Bavarian State Ministry of Science and the Arts and coordinated by the Bavarian Research Institute for Digital Transformation, and the Federal Ministry of Education and Research in the call for Computational Life Sciences (DeepMentia, 031L0200A).
References
- [1] Brodersen, K.H., Ong, C.S., Stephan, K.E., Buhmann, J.M.: The Balanced Accuracy and Its Posterior Distribution. In: 20th International Conference on Pattern Recognition. pp. 3121–3124 (2010)
- [2] Cox, D.R.: Regression models and life tables (with discussion). Journal of the Royal Statistical Society. Series B (Statistical Methodology) 34, 187–220 (1972)
- [3] Duanmu, H., Huang, P.B., Brahmavar, S., Lin, S., et al.: Prediction of Pathological Complete Response to Neoadjuvant Chemotherapy in Breast Cancer Using Deep Learning with Integrative Imaging, Molecular and Demographic Data. In: MICCAI. pp. 242–252 (2020)
- [4] Ebrahimighahnavieh, M.A., Luo, S., Chiong, R.: Deep learning to detect Alzheimer’s disease from neuroimaging: A systematic literature review. Computer Methods and Programs in Biomedicine 187, 105242 (2020)
- [5] El-Sappagh, S., Abuhmed, T., Islam, S.M.R., Kwak, K.S.: Multimodal multitask deep learning model for Alzheimer’s disease progression detection based on time series data. Neurocomputing 412, 197–215 (2020)
- [6] Esmaeilzadeh, S., Belivanis, D.I., Pohl, K.M., Adeli, E.: End-To-End Alzheimer’s Disease Diagnosis and Biomarker Identification. In: Machine Learning in Medical Imaging. pp. 337–345 (2018)
- [7] Faraggi, D., Simon, R.: A neural network model for survival data. Statistics in Medicine 14(1), 73–82 (1995)
- [8] Fischl, B.: FreeSurfer. NeuroImage 62(2), 774–781 (2012)
- [9] Frisoni, G.B., Ganzola, R., Canu, E., Rub, U., Pizzini, F.B., et al.: Mapping local hippocampal changes in Alzheimer’s disease and normal ageing with MRI at 3 Tesla. Brain 131(12), 3266–3276 (2008)
- [10] Hao, J., Kosaraju, S.C., Tsaku, N.Z., Song, D.H., Kang, M.: PAGE-Net: Interpretable and Integrative Deep Learning for Survival Analysis Using Histopathological Images and Genomic Data. In: Biocomputing 2020. pp. 355–366 (2019)
- [11] He, K., Zhang, X., Ren, S., Sun, J.: Deep Residual Learning for Image Recognition. In: CVPR. pp. 770–778 (2016)
- [12] Ho, D.E., Imai, K., King, G., Stuart, E.A.: Matching as Nonparametric Preprocessing for Reducing Model Dependence in Parametric Causal Inference. Political Analysis 15(3), 199–236 (2007)
- [13] Hu, J., Shen, L., Albanie, S., Sun, G., Wu, E.: Squeeze-and-Excitation Networks. IEEE Transactions on Pattern Analysis and Machine Intelligence 42(8), 2011–2023 (2020)
- [14] Jacenków, G., O’Neil, A.Q., Mohr, B., Tsaftaris, S.A.: INSIDE: Steering Spatial Attention with Non-imaging Information in CNNs. In: MICCAI. pp. 385–395 (2020)
- [15] Jack, C.R., Bernstein, M.A., Fox, N.C., Thompson, P., Alexander, G., Harvey, D., Borowski, B., Britson, P.J., et al.: The Alzheimer’s disease neuroimaging initiative (ADNI): MRI methods. Journal of Magnetic Resonance Imaging 27(4), 685–691 (2008)
- [16] Jack, C.R., Knopman, D.S., Jagust, W.J., Petersen, R.C., Weiner, M.W., et al.: Tracking pathophysiological processes in Alzheimer’s disease: an updated hypothetical model of dynamic biomarkers. The Lancet Neurology 12(2), 207–216 (2013)
- [17] Jarrett, D., Yoon, J., van der Schaar, M.: Dynamic Prediction in Clinical Survival Analysis Using Temporal Convolutional Networks. IEEE Journal of Biomedical and Health Informatics 24(2), 424–436 (2020)
- [18] Kopper, P., Pölsterl, S., Wachinger, C., Bischl, B., Bender, A., Rügamer, D.: Semi-structured deep piecewise exponential models. In: Proceedings of AAAI Spring Symposium on Survival Prediction - Algorithms, Challenges, and Applications 2021. vol. 146, pp. 40–53 (2021)
- [19] Li, H., Habes, M., Wolk, D.A., Fan, Y.: A deep learning model for early prediction of Alzheimer’s disease dementia based on hippocampal magnetic resonance imaging data. Alzheimer’s & Dementia 15(8), 1059–1070 (2019)
- [20] Li, S., Shi, H., Sui, D., Hao, A., Qin, H.: A Novel Pathological Images and Genomic Data Fusion Framework for Breast Cancer Survival Prediction. In: International Conference of the IEEE Engineering in Medicine & Biology Society (EMBC). pp. 1384–1387 (2020)
- [21] Liu, M., Zhang, J., Adeli, E., Shen, D.: Joint Classification and Regression via Deep Multi-Task Multi-Channel Learning for Alzheimer’s Disease Diagnosis. IEEE Transactions on Biomedical Engineering 66(5), 1195–1206 (2019)
- [22] Loshchilov, I., Hutter, F.: Decoupled Weight Decay Regularization. In: 7th International Conference on Learning Representations (2019)
- [23] Mobadersany, P., Yousefi, S., Amgad, M., Gutman, D.A., et al.: Predicting cancer outcomes from histology and genomics using convolutional networks. Proceedings of the National Academy of Sciences 115(13), E2970–E2979 (2018)
- [24] Pelka, O., Friedrich, C.M., Nensa, F., Mönninghoff, C., Bloch, L., et al.: Sociodemographic data and APOE-e4 augmentation for MRI-based detection of amnestic mild cognitive impairment using deep learning systems. PLOS ONE 15(9), e0236868 (2020)
- [25] Perez, E., Strub, F., de Vries, H., Dumoulin, V., Courville, A.: FiLM: Visual Reasoning with a General Conditioning Layer. In: AAAI. vol. 32 (2018)
- [26] Pölsterl, S., Sarasua, I., Gutiérrez-Becker, B., Wachinger, C.: A wide and deep neural network for survival analysis from anatomical shape and tabular clinical data. In: Machine Learning and Knowledge Discovery in Databases. pp. 453–464 (2020)
- [27] Spasov, S., Passamonti, L., Duggento, A., Liò, P., Toschi, N.: A parameter-efficient deep learning approach to predict conversion from mild cognitive impairment to Alzheimer’s disease. NeuroImage 189, 276–287 (2019)
- [28] Uno, H., Cai, T., Pencina, M.J., D’Agostino, R.B., Wei, L.J.: On the C-statistics for evaluating overall adequacy of risk prediction procedures with censored survival data. Statistics in Medicine 30(10), 1105–1117 (2011)
- [29] Wen, J., Thibeau-Sutre, E., Diaz-Melo, M., Samper-González, J., et al.: Convolutional neural networks for classification of Alzheimer’s disease: Overview and reproducible evaluation. Medical Image Analysis 63, 101694 (2020)