Detecting when pre-trained nnU-Net models fail silently for Covid-19 lung lesion segmentation††thanks: Supported by the Bundesministerium für Gesundheit (BMG) with grant [ZMVI1-2520DAT03A]. The final authenticated version of this manuscript will be published in Lecture Notes in Computer Science, Medical Image Computing and Computer Assisted Intervention - MICCAI 2021 (doi will follow).
Abstract
Automatic segmentation of lung lesions in computer tomography has the potential to ease the burden of clinicians during the Covid-19 pandemic. Yet predictive deep learning models are not trusted in the clinical routine due to failing silently in out-of-distribution (OOD) data. We propose a lightweight OOD detection method that exploits the Mahalanobis distance in the feature space. The proposed approach can be seamlessly integrated into state-of-the-art segmentation pipelines without requiring changes in model architecture or training procedure, and can therefore be used to assess the suitability of pre-trained models to new data. We validate our method with a patch-based nnU-Net architecture trained with a multi-institutional dataset and find that it effectively detects samples that the model segments incorrectly.
Keywords:
out-of-distribution detection uncertainty estimation distribution shift.1 Introduction
Automatic lung lesion segmentation in the clinical routine would significantly lessen the burden of radiologists, standardise quantification and staging of Covid-19 as well as open the way for a more effective utilisation of hospital resources. With this hope, several initiatives have gathered Computed Axial Tomography (CAT) scans and ground-truth annotations from expert thorax radiologists and released them to the public [6, 20, 23]. Experts have identified ground glass opacities (GGOs) and consolidations as characteristic of a pulmonary infection onset by the SARS-CoV-2 virus [24]. Deep learning models have shown good performance in segmenting these lesions. Particularly the fully-automatic nnU-Net framework [11] secured top spots (9 out of 10, including the first) in the leaderboard for the Covid-19 Lung CT Lesion Segmentation Challenge [7].
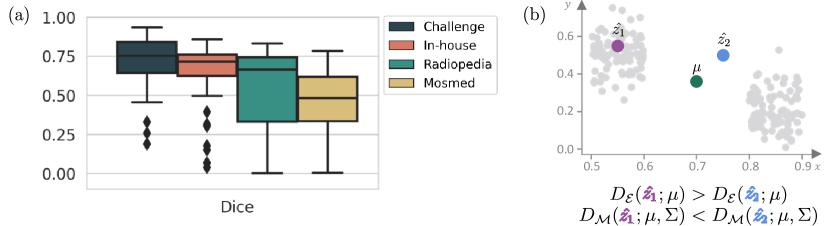
Such frameworks would ideally be utilised in the clinical practice. However, deep learning models are known to fail for data that considerably diverges from the training distribution. CAT scans are particularly prone to this domain shift problem [4]. The data showcased in the challenge is multi-centre and diverse in terms of patient group and acquisition protocol. A model trained with it would be presumed to produce good predictions for a wide spectrum of institutions. Yet when we evaluate a nnU-Net model on three other datasets, we notice a considerable drop in segmentation quality (see Fig. 1 (a)). Lung lesions do not manifest in large connected components (see Fig 4), so it is not trivial for a novice radiologist to identify an incorrect segmentation.
Clinicians can still leverage models trained with large amounts of heterogeneous data, but only alongside a process that identifies when the model is unsuitable for a new data sample. Widely-used segmentation frameworks are not designed with OOD detection in mind, and so a method is needed that reliably identifies OOD samples post-training while requiring minimal intervention.
Several strategies have shown good OOD detection performance in classification models. Hendrycks and Gimpel [8] propose using the maximum softmax output as an OOD detection baseline. Guo et al. [5] find that replacing the regular softmax function with a temperature-scaled variant produces truer estimates. This can be complemented by adding perturbations to the network inputs [19]. Other methods [10, 17] instead look at the KL divergence of softmaxed outputs from the uniform distribution. Some approaches use OOD data during training to explicitly train an outlier detector [1, 9, 17]. Bayesian-inspired techniques can also be used for outlier detection. Commonly-used are Monte Carlo Dropout [3] and Deep Ensembles [16]. These have shown promising results in the field of medical image segmentation [12, 13, 21]. Approaches that modify the architecture or training procedure have shown better performance in some cases, but their applicability to widely-used segmentation frameworks is limited [2, 15, 22].
We propose a method for OOD detection that is lightweight and seamlessly integrates into complex segmentation frameworks. Inspired by the work of Lee et al. [18], our approach estimates a multivariate Gaussian distribution from in-distribution (ID) training samples and utilises the Mahalanobis distance as a measure of uncertainty during inference. We compute the distance in a low-dimensional feature space, and down-sample it further to ensure a computationally inexpensive calculation. We validate our method on a patch-based 3D nnU-Net trained with multi-centre data from the Covid-19 Lung CT Lesion Segmentation Challenge. Our evaluation shows that the proposed method can effectively identify OOD samples for which the model produces faulty segmentations, and provides good model calibration estimates. Our contributions are:
-
•
The introduction of a lightweight, flexible method for OOD detection that can be integrated into any segmentation framework.
-
•
An extension of the nnU-Net framework to provide clinically-relevant uncertainty estimates.
2 Materials and Methods
We start by summarising the particularities of the nnU-Net framework in Sec. 2.1. In Sec. 2.2, we outline our proposed method for OOD detection, which follows a three-step process: (1) estimation of a Gaussian distribution from training features (2) extraction of uncertainty masks for test images and (3) calculation of subject-level uncertainty scores.
2.1 Patch-based nnU-Net
The nnU-Net framework is a standardised baseline for medical image segmentation [11]. Without deviating from traditional U-Net architectures [26], it has won several grand challenges by automatically customising the architecture and training configuration to the data at hand [7]. The framework also performs pre- and post-processing steps, such as adapting voxel spacing and contrast normalisation, during both training and inference. In this work we utilise the patch-based full-resolution variant, which is recommended for most applications [11], but our method can be integrated into any other architecture. For the patch-based architecture, training images are first divided into overlapping patches with a sliding window approach, resulting in patches . Predictions for each patch are multiplied by a filtering operation that weights centre-voxels more heavily, and then aggregated into an output mask with the dimensions of the original image.
2.2 Estimation of a subject-level uncertainty score
We are interested in capturing epistemic uncertainty, which arises from a lack of knowledge about the data-generating process. Quantifying it for image regions instead of region boundaries is challenging, particularly for OOD data [14]. One computationally inexpensive way to assess epistemic uncertainty is to calculate the distance between training and testing activations in a low-dimensional feature space. As a model is unlikely to produce reasonable outputs for features far from any seen during training, this is a reliable signal for bad model performance [18]. Model activations have covariance and the activations of typical input images do not necessarily resemble the mean [27], so the euclidean distance is not appropriate to identify unusual activation patterns; a problem that exacerbates in high-dimensional spaces. The Mahalanobis distance rescales samples into a space without covariance, supplying a more effective way to identify typical patterns in deep model features. Fig. 1 (b) illustrates a situation where the euclidean distance assumes that is closer to the training distribution than , when is highly unusual and is a probable sample.
In the following we describe the steps we perform to extract a subject-level uncertainty value. Note that only one forward pass is necessary for each image, keeping the computational overhead to a minimum.
2.2.1 Estimation of the training distribution:
We start by estimating a multivariate Gaussian over model features. For all training inputs , features are extracted from the encoder of the pre-trained model. For modern segmentation networks, the dimensionality of the extracted features is too large to calculate the covariance in an acceptable time frame. We thus project the latent space into a lower subspace by average pooling. Finally, we flatten this subspace and estimate the empirical mean and covariance .
| (1) |
2.2.2 Extraction of uncertainty masks:
During inference, we estimate an uncertainty mask for a subject following the process outlined in Fig. 2. For each patch , features are extracted and projected into . Next, the Mahalanobis distance (Eq. 2) to the Gaussian distribution estimated in the previous step is calculated.
| (2) |
Each distance is a point estimate for the corresponding model input. These are aggregated in a similar fashion to how network outputs are combined to form a prediction mask. Following the example of the patch-based nnU-Net, a zero-filled tensor is initialised with the dimensionality of the original image. After assessing the distance for a patch, the value is replicated to the specified patch size and a filtering operation is applied to weight centre voxels more heavily. Finally, patch-level uncertainties are aggregated to an image-level mask.

2.2.3 Subject-level uncertainty:
The process described above produces an uncertainty mask with the dimensionality of the CAT scan. In order to effectively identify highly uncertain samples, we aggregate these into a subject-level uncertainty by averaging over all voxels. We then normalise uncertainties between the minimum and doubled maximum values represented in an ID validation set – which we assume to be available during training – to ensure .
3 Experimental Setup
We work with a total of four datasets for segmentation of Covid-19-related findings. The Challenge dataset [6] contains chest CAT scans for patients with a confirmed SARS-CoV-2 infection from an array of institutions. The data is heterogeneous in terms of age, gender and disease severity. We use the 199 cases made available under the Covid Segmentation Grand Challenge, which we randomly divide into 160 cases to train the model, 4 validation and 35 test cases.
We evaluate our method with two publicly available datasets and an in-house one. The public datasets encompass cases for patients with and without confirmed infections. Mosmed [23] contains fifty cases and the Radiopedia dataset [20], a further twenty. Finally, we utilise an in-house dataset consisting of fifty patients who were tested positive for SARS-CoV-2 with an RT PCR test. All fifty scans were reviewed for diagnostic image quality. The annotations for the in-house data were performed slice-by-slice by two independent readers trained in the delineation of GGOs and pulmonary consolidations. Central vascular structures and central bronchial structures were excluded from all segmentations. All delineations were reviewed by an expert radiologist reader. For the public datasets, the segmentation process is outlined in the corresponding publications.
With the Challenge data, we train a patch-based nnU-Net [11] on a Tesla T4 GPU. Our configuration has a patch size of , and adjacent patches overlap by half that size. To reduce the dimensionality of the feature space, we apply average pooling with a kernel size of and stride until the dimensionality falls below elements. With the Scikit Learn library (version 0.24) [25], calculating requires 85 seconds for samples. Our code is available under github.com/MECLabTUDA/Lifelong-nnUNet (branch ood_detection).
We compare our approach to state-of-the-art techniques to assess uncertainty information by performing inference on a trained model. Max. Softmax consists of taking the maximum softmax output [8]. Temp. Scaling performs temperature scaling on the outputs before applying the softmax operation [5], for which we test three different temperatures . KL from Uniform computes the KL divergence from an uniform distribution [10]. Note that all three methods output a confidence score (higher is more certain), which we invert to obtain an uncertainty estimate (lower is more certain). Finally, MC Dropout consists of doing several forward passes whilst activating the Dropout layers that would usually be dormant during inference. We perform forward passes and report the standard deviation between outputs as an uncertainty score. For all methods, we calculate a subject-level metric by averaging uncertainty masks, and normalise the uncertainty range between the minimum and doubled maximum uncertainty represented in ID validation data.
4 Results
We start this section by analysing the performance of the proposed method in detecting samples that vary significantly from the training distribution. We then examine how well the model estimates segmentation performance. Lastly, we qualitatively evaluate our method for ID and OOD examples.
4.0.1 OOD detection:
We first assess how effective our method is at identifying samples that are not ID (Challenge data). Due to the heterogeneity of the Challenge dataset, in practice data from an array of institutions would be considered ID. However, for our evaluation datasets there is a drop in performance which should manifest in higher uncertainty estimates. As is common practice in OOD detection [19], we find the uncertainty boundary that achieves a true positive rate (TPR) on the ID validation set, where a true positive is a sample correctly identified as ID. We report for the ID test data and all OOD data the false positive rate (FPR) and Detection Error at TPR. Tab. 1 summarizes our findings. All methods that utilise the network outputs after one forward pass have a high detection error and FPR, while the MC Dropout approach manages to identify more OOD samples. Our proposed method displays the lowest FPR and detection error.
| Method | Det. Error | FPR | ESCE | Dice |
|---|---|---|---|---|
| Max. Softmax [8] | 0.334 | 0.583 | 0.319 | 0.582 ±0.223 |
| Temp. Scaling [5] | 0.508 | 0.758 | 0.407 | 0.601 ±0.233 |
| Temp. Scaling [5] | 0.361 | 0.550 | 0.408 | 0.589 ±0.233 |
| Temp. Scaling [5] | 0.500 | 1.000 | 0.408 | 0.592 ±0.233 |
| KL from Uniform [10] | 0.415 | 0.717 | 0.288 | 0.600 ±0.215 |
| MC Dropout [3] | 0.177 | 0.183 | 0.215 | 0.614 ±0.234 |
| Ours | 0.082 | 0.050 | 0.125 | 0.744 ±0.143 |
Segmentation performance: While the detection of OOD samples is a first step in assessing the suitability of a model, an ideal uncertainty metric would inversely correlate with model performance, informing the user of the likely quality of a prediction without requiring manual annotations. For this we calculate the Expected Segmentation Calibration Error (ESCE). Inspired by Guo et al. [5], we divide the test scans into interval bins according to their normalised uncertainty. Over all bins, the absolute difference is added between average Dice and inverse average uncertainty for samples in the bin, weighted by the number of samples.
| (3) |
The results are reported in Tab. 1 (forth column). Our proposed approach shows the lowest at 0.125. The average Dice of admitted samples (fifth column) lies at 0.744, which is consistent with the ID expected performance of the model (see Fig. 1 (a)).
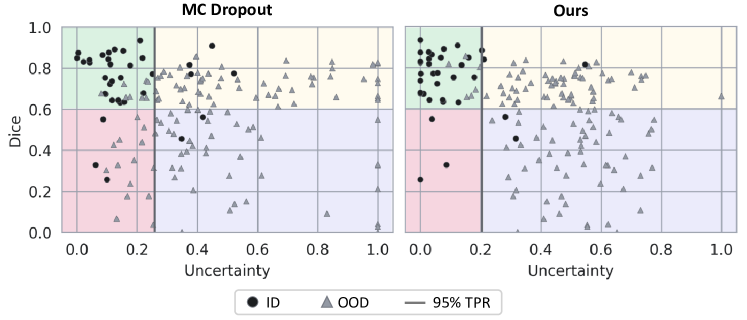
Fig. 3 depicts the Dice coefficient plotted against the uncertainty for our proposed approach and MC Dropout, which has the second lowest calibration error. Relevant for a safe use of the model in clinical practice is the lower left (red) quadrant, where silent failures are located. Whereas MC Dropout fails to identify OOD samples with faulty predicted segmentations, our proposed method assigns these cases high uncertainty estimates. The only OOD samples that fall below the 95% TPR uncertainty boundary for our method have Dice scores over 0.6 (upper left quadrant with green background). However, our method shows room for improvement in the upper right (yellow) quadrant. Here, OOD samples for which the model produces good predictions are estimated to have a high uncertainty. An ideal calibration would place all samples in the upper left (green) and lower right (blue) quadrants.
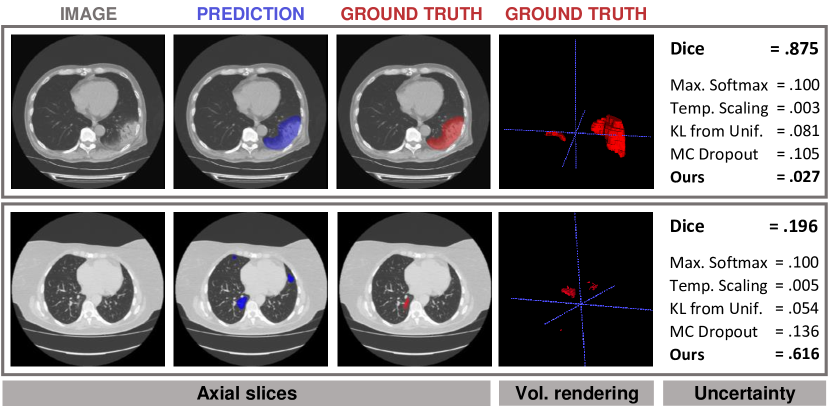
Qualitative evaluation: Fig. 4 depicts two example images alongside corresponding ground truths and predictions. The top row shows a example from the Challenge dataset for which the model produces an adequate segmentation. The bottom contains a scan from the Mosmed dataset. The model oversegments the lesion at the middle left lobe and incorrectly marks two additional regions at the left and right superior lobes. Only our proposed method signals a possible error in the lower row with a high uncertainty, while producing a low uncertainty estimate for the upper row.
5 Conclusion
Increasingly, institutions are taking part in initiatives to gather large amounts of annotated, heterogeneous data and release it to the public. This could potentially alleviate the work burden of medical practitioners by allowing the training of robust segmentation models. Open-source end-to-end frameworks contribute to this process. But regardless of the variety of the training data, it is necessary to assess whether a model is well-suited to new samples. This is particularly true when it is not trivial to identify a faulty output, such as for the segmentation of SARS-CoV-2 lung lesions. There is currently a disconnect between methods for OOD detection, which often require special training or architectural considerations, and widely-used segmentation frameworks. We find that calculating the Mahalanobis distance to features in a low-dimensional subspace is a lightweight and flexible way to signal when a model prediction should not be trusted. Future work should explore how to better identify high-quality predictions. For now, our work increases clinicians’ trust while translating trained neural networks from challenge participation to real clinics.
References
- [1] Bevandić, P., Krešo, I., Oršić, M., Šegvić, S.: Simultaneous semantic segmentation and outlier detection in presence of domain shift. In: German Conference on Pattern Recognition. pp. 33–47. Springer (2019)
- [2] Blundell, C., Cornebise, J., Kavukcuoglu, K., Wierstra, D.: Weight uncertainty in neural network. In: International Conference on Machine Learning. pp. 1613–1622. PMLR (2015)
- [3] Gal, Y., Ghahramani, Z.: Dropout as a bayesian approximation: Representing model uncertainty in deep learning. In: International Conference on Machine Learning. pp. 1050–1059. PMLR (2016)
- [4] Glocker, B., Robinson, R., Castro, D.C., Dou, Q., Konukoglu, E.: Machine learning with multi-site imaging data: An empirical study on the impact of scanner effects. arXiv preprint arXiv:1910.04597 (2019)
- [5] Guo, C., Pleiss, G., Sun, Y., Weinberger, K.Q.: On calibration of modern neural networks. In: International Conference on Machine Learning. pp. 1321–1330. PMLR (2017)
- [6] Harmon, S.A., Sanford, T.H., Xu, S., Turkbey, E.B., Roth, H., Xu, Z., Yang, D., Myronenko, A., Anderson, V., Amalou, A., et al.: Artificial intelligence for the detection of covid-19 pneumonia on chest ct using multinational datasets. Nature communications 11(1), 1–7 (2020). https://doi.org/https://doi.org/10.1038/s41467-020-17971-2
- [7] Henderson, E.: Leading pediatric hospital reveals top ai models in covid-19 grand challenge. https://www.news-medical.net/news/20210112/Leading-pediatric-hospital-reveals-top-AI-models-in-COVID-19-Grand-Challenge.aspx, accessed: 2021-02-28
- [8] Hendrycks, D., Gimpel, K.: A baseline for detecting misclassified and out-of-distribution examples in neural networks. In: International Conference on Learning Representations (2017)
- [9] Hendrycks, D., Mazeika, M., Dietterich, T.: Deep anomaly detection with outlier exposure. In: International Conference on Learning Representations (2018)
- [10] Hendrycks, D., Mazeika, M., Kadavath, S., Song, D.: Using self-supervised learning can improve model robustness and uncertainty. Advances in Neural Information Processing Systems 32, 15663–15674 (2019)
- [11] Isensee, F., Jaeger, P.F., Kohl, S.A., Petersen, J., Maier-Hein, K.H.: nnu-net: a self-configuring method for deep learning-based biomedical image segmentation. Nature Methods 18(2), 203–211 (2021)
- [12] Jungo, A., Balsiger, F., Reyes, M.: Analyzing the quality and challenges of uncertainty estimations for brain tumor segmentation. Frontiers in Neuroscience 14, 282 (2020)
- [13] Jungo, A., Reyes, M.: Assessing reliability and challenges of uncertainty estimations for medical image segmentation. In: International Conference on Medical Image Computing and Computer-Assisted Intervention. pp. 48–56. Springer (2019)
- [14] Kendall, A., Gal, Y.: What uncertainties do we need in bayesian deep learning for computer vision? Advances in Neural Information Processing Systems 30, 5574–5584 (2017)
- [15] Kohl, S.A., Romera-Paredes, B., Meyer, C., Fauw, J.D., Ledsam, J.R., Maier-Hein, K.H., Eslami, S.A., Rezende, D.J., Ronneberger, O.: A probabilistic u-net for segmentation of ambiguous images. In: Proceedings of the 32nd International Conference on Neural Information Processing Systems. pp. 6965–6975 (2018)
- [16] Lakshminarayanan, B., Pritzel, A., Blundell, C.: Simple and scalable predictive uncertainty estimation using deep ensembles. Advances in Neural Information Processing Systems 30, 6402–6413 (2017)
- [17] Lee, K., Lee, H., Lee, K., Shin, J.: Training confidence-calibrated classifiers for detecting out-of-distribution samples. In: International Conference on Learning Representations (2018)
- [18] Lee, K., Lee, K., Lee, H., Shin, J.: A simple unified framework for detecting out-of-distribution samples and adversarial attacks. In: Advances in Neural Information Processing Systems. pp. 7167–7177 (2018)
- [19] Liang, S., Li, Y., Srikant, R.: Enhancing the reliability of out-of-distribution image detection in neural networks. In: International Conference on Learning Representations (2018)
- [20] Ma, J., Ge, C., Wang, Y., An, X., Gao, J., Yu, Z., Zhang, M., Liu, X., Deng, X., Cao, S., Wei, H., Mei, S., Yang, X., Nie, Z., Li, C., Tian, L., Zhu, Y., Zhu, Q., Dong, G., He, J.: Covid-19 ct lung and infection segmentation dataset (2020). https://doi.org/10.5281/zenodo.3757476, https://doi.org/10.5281/zenodo.3757476
- [21] Mehrtash, A., Wells, W.M., Tempany, C.M., Abolmaesumi, P., Kapur, T.: Confidence calibration and predictive uncertainty estimation for deep medical image segmentation. IEEE transactions on medical imaging 39(12), 3868–3878 (2020)
- [22] Monteiro, M., Le Folgoc, L., Coelho de Castro, D., Pawlowski, N., Marques, B., Kamnitsas, K., van der Wilk, M., Glocker, B.: Stochastic segmentation networks: Modelling spatially correlated aleatoric uncertainty. In: Larochelle, H., Ranzato, M., Hadsell, R., Balcan, M.F., Lin, H. (eds.) Advances in Neural Information Processing Systems. vol. 33, pp. 12756–12767. Curran Associates, Inc. (2020)
- [23] Morozov, S., Andreychenko, A., Pavlov, N., Vladzymyrskyy, A., Ledikhova, N., Gombolevskiy, V., Blokhin, I.A., Gelezhe, P., Gonchar, A., Chernina, V.Y.: Mosmeddata: Chest ct scans with covid-19 related findings dataset. arXiv preprint arXiv:2005.06465 (2020)
- [24] Parekh, M., Donuru, A., Balasubramanya, R., Kapur, S.: Review of the chest ct differential diagnosis of ground-glass opacities in the covid era. Radiology 297(3), E289–E302 (2020)
- [25] Pedregosa, F., Varoquaux, G., Gramfort, A., Michel, V., Thirion, B., Grisel, O., Blondel, M., Prettenhofer, P., Weiss, R., Dubourg, V., Vanderplas, J., Passos, A., Cournapeau, D., Brucher, M., Perrot, M., Duchesnay, E., Louppe, G.: Scikit-learn: Machine learning in python. Journal of Machine Learning Research 12 (01 2012)
- [26] Ronneberger, O., Fischer, P., Brox, T.: U-net: Convolutional networks for biomedical image segmentation. In: International Conference on Medical Image Computing and Computer-Assisted Intervention. pp. 234–241. Springer (2015)
- [27] Wei, D., Zhou, B., Torrabla, A., Freeman, W.: Understanding intra-class knowledge inside cnn. arXiv preprint arXiv:1507.02379 (2015)