Constraining Self-Interacting Dark Matter with Dwarf Spheroidal Galaxies and High-resolution Cosmological -body Simulations
Abstract
We study the density structures of dark matter subhalos for both cold dark matter and self-interacting dark matter models using high-resolution cosmological -body simulations. We quantify subhalo’s central density at 150 pc from the center of each subhalo at the classical dwarf spheroidal and ultrafaint dwarf scales found in Milky-Way sized halos. By comparing them with observations, we find that the self-interacting scattering cross-section of is favored. Due to the combination of hosts’ tide and self-interactions, the central density of subhalos with small pericenter shows a noticeable difference between the cold and the self-interacting models, indicating that Milky-Way satellites with small pericenter are ideal sites to further constrain the nature of dark matter by future large spectroscopic surveys.
I Introduction
The cold dark matter (CDM) model, which assumes collisionless dark matter particles, has successfully reproduced the structure of the Universe on large scales () [1, 2, 3, 4, 5, 6, 7]. However, on smaller scales, especially on dwarf galaxies, discrepancies exist between observations and CDM predictions, called the “small scale crisis”. For example, cosmological -body simulations based on the CDM predict cuspy density profiles of dark matter halos [8], whereas observations of dwarf galaxies suggest cored profiles [9, 10, 11, 12]. This discrepancy is known as the core-cusp problem and has recently been re-interpreted as the diversity problem [13]: circular velocity profiles of observed dwarf galaxies show a large diversity even with similar maximum circular velocity. Some dwarf galaxies have cuspy profiles, and others have cored profiles, whereas those simulated galaxies show little variation. Baryonic physics in galaxies can be a solution to this problem although their effects are still uncertain.
Self-interacting dark matter (SIDM) models [14] have been proposed to solve the small scale crisis (for a review, see [15]). The original SIDM assumes that the scattering cross-section of dark matter particles per unit mass, , is velocity-independent and isotropic. However, preferred cross-sections are different depending on scales: for dwarf galaxies [16, 17, 18] and for galaxy clusters [18, 19, 20, 21]. To overcome this hurdle, reincarnations of the original SIDM have been considered, such as velocity-dependent SIDM (e.g., [22, 23, 24, 25, 26]) and SIDM with anisotropic scattering from the approach of particle physics (e.g., [27, 28, 29]).
Dark matter self-interaction decreases the central density of halos before gravothermal core-collapse sets in [30, 31]. Baryonic physics in galaxies, such as supernova feedback and star formation burst, could also affect the central structures of halos. These two different mechanisms can coincide and interplay. To remove this degeneracy, it is ideal for studying dark matter dominated systems such as classical dwarf spheroidal (dSph) and ultrafaint dwarf (UFD) galaxies. Cosmological hydrodynamical simulations predict that central structures of those host halos are less affected by feedback processes [32, 33, 34], maybe because most of the stars in those system were born before the cosmic reionization.
Only recently, the density structures of UFDs have been estimated, and the SIDM cross-section is constrained by them [35]. However, a phenomenological semi-analytic SIDM halo model is used in that study because there is a significant lack of high-resolution simulations for UFD scale subhalos. Semi-analytic models have been used to predict density structures of isolated halos using various SIDM models [36, 37, 38, 35, 39], and have the advantage of including baryonic potential and being less computational cost than cosmological simulations. However, in semi-analytic models, it is challenging to model the dynamical evolution of subhalos within a host halo, such as tidal interactions with host halos and other subhalos, and evolution of host halos. Cosmological simulations have the advantage that all these dynamical effects are naturally included.
This paper will revisit the SIDM cross-section using high-resolution cosmological -body simulations based on both CDM and SIDM, and observations of the classical dSphs and the UFDs. Unlike previous studies that focused on the diversity of circular velocity profiles (e.g., [40]), we focus on density structures of the classical dSph and the UFD scales subhalos. We quantify the central density at 150 pc, , from the center of each subhalo and compare them with observations. Read et al. [41] argued that is a good tracer of the central density of dwarf galaxies because it is insensitive to the prior choice of the inner slope of the density profile and shows enough difference to distinguish whether the density profile is cusp or cored. Uncertainty in is not prohibitively large, and 1 uncertainty is typically less than 50% for the classical dSphs [41]. The major source of uncertainty is poor observed sample size, thus, future spectroscopic surveys can improve the uncertainty. We also study the dependence of central density on the pericenter distance; It has been pointed out that the dSph’s central density anti-correlates with the pericenter radii [42, 43].
II Simulations
We performed three high-resolution cosmological -body simulations: CDM (without self-interaction), (), and (). All of the simulations consist of dark matter particles with a particle mass of in a comoving cubic box with a side length of 8. We constructed an initial condition using 2LPTic code [44], and the adopted cosmological parameters are , , , , , and , which match with observational results by the Planck [45]. We used the same initial condition and numerical parameters for three simulations, in which only the strength of self-interactions is different.
To follow the gravitational evolution of dark matter particles, we used a massively parallel TreePM code, GreeM 111https://hpc.imit.chiba-u.jp/~ishiymtm/greem/ [46, 47], on the Aterui-II supercomputer at the Center for Computational Astrophysics, National Astronomical Observatory of Japan. The gravitational softening length is 100. We accelerated the tree force calculation by the Phantom-grape222https://bitbucket.org/kohji/phantom-grape/src software [48, 49, 50, 51]. We performed all simulations from redshift to 0 and stored snapshots covering to 0 with a logarithmic interval , resulting in a total of 112 snapshots. We adopted the same algorithm used in Vogelsberger et al. [23] for the implementation of dark matter self-interaction, in which isotropic, velocity independent, and elastic scattering are considered. We do not consider velocity-dependent SIDM models because we focus on scales smaller than galaxies. In Appendix, we compare the core size of the host halos with a previous study to show the validity of our SIDM implementation.
We identified gravitationally bound dark matter halos and subhalos using rockstar halo/subhalo finder [52] and constructed merger trees using consistent trees merger tree code [53]. We unbiasedly picked out nine Milky Way-sized host halos (H0-H8) covering the virial mass range of to . The virial mass and radius of each halo are summarized in Table 1. We analyzed their subhalos more massive than , which consists of more than 2,400 particles and corresponds to the massive UFD scale.
| CDM | ||||||
|---|---|---|---|---|---|---|
| Name | ||||||
| [] | [] | [] | [] | [] | [] | |
| H0 | 25.76 | 278.6 | 25.65 | 278.2 | 24.94 | 275.6 |
| H1 | 11.08 | 210.3 | 11.04 | 210.0 | 10.97 | 209.6 |
| H2 | 10.56 | 206.9 | 10.51 | 206.6 | 10.37 | 205.7 |
| H3 | 8.105 | 189.4 | 7.920 | 188.0 | 7.687 | 186.2 |
| H4 | 7.141 | 181.7 | 7.097 | 181.2 | 7.033 | 180.7 |
| H5 | 6.902 | 179.6 | 6.861 | 179.3 | 6.795 | 178.7 |
| H6 | 6.800 | 178.7 | 6.873 | 179.4 | 6.732 | 178.1 |
| H7 | 4.581 | 156.7 | 4.520 | 156.0 | 4.435 | 155.0 |
| H8 | 3.755 | 146.6 | 3.556 | 144.0 | 3.463 | 142.7 |
III Results
III.1 Central density of subhalos
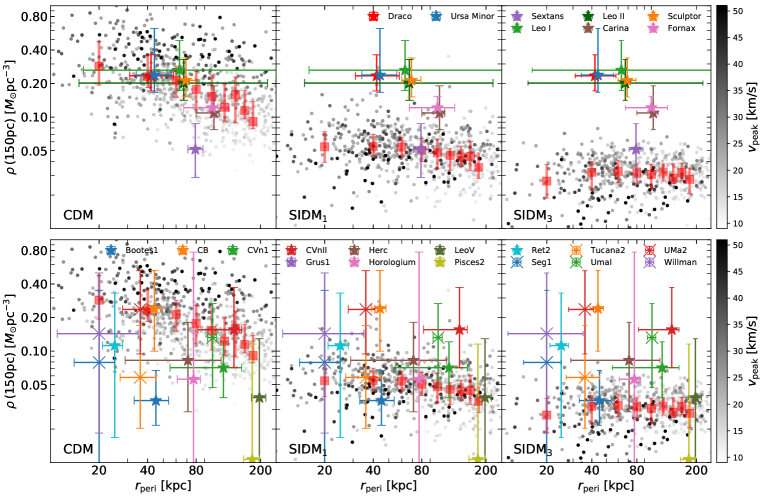
Fig. 1 shows the relation between the subhalos’ density at 150 pc, , and their pericenter radii . We can not directly measure from our simulations because the softening length adopted is 100 ( pc). Therefore, we estimate by fitting the density profiles of the subhalos with the NFW profile [8] expressed by
| (1) |
and with the Burkert profile [9] expressed by
| (2) |
We use the NFW profile for the CDM simulation and the Burkert profile for the and simulations. The fittings were performed using up to 20 bins covering , and only bins with were used. We also calculated the pericenter of each subhalo as the minimum distance from its host over the subhalo’s history. The nine pericenter bins cover at equally spaced intervals.
We compare simulated with the observation. We use of observed classical dSphs and UFDs that were estimated by [43] and Hayashi et. al. (in prep.), respectively. To compute , they determined a dark matter density profile by non-spherical dynamical models based on axisymmetric Jeans equations. They applied these models to the line-of-sight velocity data for the dSphs and UFDs and obtained the posterior distribution functions for the dark matter halo parameters (see [43] in details). Thus, the estimated were marginalized by all these parameters.
Fig. 1 (top row) shows that the central density of subhalos in the CDM simulation is in good agreement with those of the classical dSphs and anti-correlates with the pericenter , consistent with observational results [42, 43]. On the other hand, the density of subhalos in the SIDM simulations is systematically lower than CDM counterparts and the classical dSphs. The central density does not depend strongly on the pericenter and is lower in the than in the . The difference with the classical dSphs is also larger in the . These results indicate that the SIDM scattering cross section of is favored.
The bottom row of Fig. 1 shows the comparison with the UFDs. Unlike the classical dSphs, the central density estimated in the observed UFDs does not clearly depend on the pericenter, although observational uncertainty is large. Within the first and third quartiles, none of the three simulations is in good agreement with the observations. In terms of the overall distribution, shows the best match with the observations. The CDM simulation has difficulty reproducing Boötes 1, although it shows consistency with the others. For a few UFDs, the in is too low compared to the UFDs. These results indicate that the SIDM scattering cross-section of is favored, which is consistent with the indication from the comparison with the classical dSphs.
Fig. 1 also shows that the density of subhalos in simulations depend on their , which is the maximum circular velocity over the subhalo’s history. Denser subhalos tend to have lower in the and simulations, whereas denser subhalos tend to have higher in the CDM simulation. We further investigate these results in the next section.
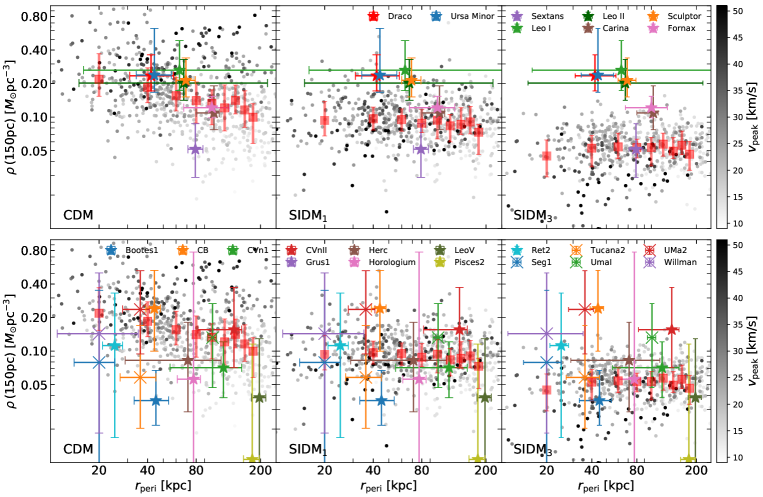
Our results presented above can be affected by the adopted fitting procedure. To confirm the robustness of the results, we try to fit the subhalo’s density profile with the cuspy profile expressed by
| (3) |
This cuspy profile is the same as the NFW when . The central slope is a fitting parameter (with the range of ), and thus, this profile can be applied for both cuspy and cored profiles. Figure 2 shows the results using the cuspy profile for all three simulations. The fitting procedure has little impact on the density in the CDM case. On the other hand, the density in the SIDM simulations is systematically higher in the cuspy profile than in the Burkert profile because subhalos can have cores or very shallow cusps (shallower than ). However, the overall trend between and in each simulation is the same as Fig. 1 and 2.
III.2 Density profile of subhalos
As discussed in the previous section, the central density of subhalos with small pericenter shows a stark difference between the CDM and SIDM simulations. To understand the origin of the difference, we separate subhalos according to the pericenter and compare the density profile of each simulation.
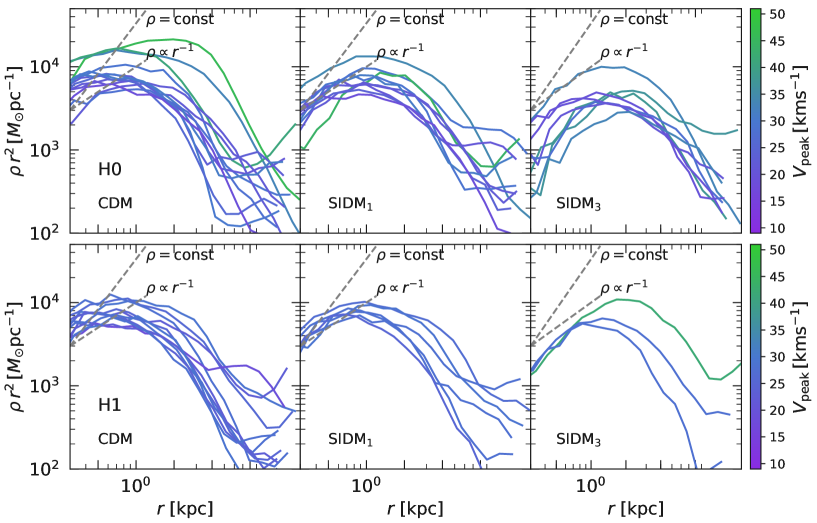
Fig. 3 and 4 show density profiles of subhalos with the pericenter and , respectively, in which the color of each curve is proportional to its . We plot only subhalos with masses between and . The top and bottom panels show the results of subhalos hosted by H0 and H1, respectively. From left to right, the results for the CDM, , and simulations are shown. For subhalos with small pericenter (), the density slopes of the very inner regions are steepest in the CDM than in the SIDM simulations. The logarithmic slope is typically for the CDM, between and for the , and (constant density) for the , highlighting the effect of self-interactions. On the other hand, for subhalos far from the centers of host halos (), the difference between the CDM and SIDM simulations is much smaller than for the inner regions. Furthermore, we also confirm these trends in other host halos (H2-8), supporting that those are not results of halo-to-halo variations.
Cosmological CDM simulations suggest that subhalos with small are subjected to stronger tidal forces from their hosts than those with large , and thus, less dense subhalos (and also lower ) with small could be destroyed [42, 43]. Therefore, there are fewer subhalos with both small and low in the CDM simulation, which is clearly seen in Fig. 1 and 2, and by comparing Fig. 3 and 4. On the other hand, dark matter self-interactions between subhalo’s particles work effectively in the dense central region of subhalos with higher for the SIDM cases, and hence, the central densities of such subhalos tend to be lower, and their core tends to be larger. Dark matter self-interactions between subhalo’s and host halo’s particles could further enhance tidal disruption of subhalos on radial orbits [26]. As a result, since the SIDM subhalos even with higher could be destroyed by tidal effect, the dependence of on the pericenter disappears in the SIDM simulations (see Fig. 3 and 4), and the difference between the CDM and SIDM is prominent in subhalos with small pericenter. These results highlight that the Milky-Way satellites with small pericenter are ideal sites to further constrain the nature of dark matter by future large spectroscopic surveys such as PFS [54] and Euclid [55].

IV Discussion
We discuss two caveats associated with our main results: gravothermal core-collapse and galactic disk. Gravothermal core-collapse can increase the central density of subhalos although we do not observe the sign in our simulations. The Galactic disk potential, which is not included in our simulations, could alter the evolution of subhalos with small pericenter.
IV.1 Gravothermal core-collapse
Dark matter self-interaction leads to an outer heat transfer, thereby inducing gravothermal core-collapse such that the central density increases with time [30, 31, 56]. The core-collapse time scales of halos depend largely on self-interaction cross-section and dynamical evolution of halos. Provided that a halo is isolated and the SIDM cross-section is smaller than , the core-collapse cannot occur within the age of Universe. However, subhalos we consider in this work have experienced tidal stripping from the gravitational potential of a host halo. This tidal effect induces the core-collapse in the central region of subhalos, and the time scale of the core-collapse can be shorter than the age of the Universe, even though the cross-section is smaller than [57, 31, 58, 59, 60]. Nevertheless, there are no such dense subhalos even in the simulation (Fig. 1 and 2), suggesting that is insufficient to induce core-collapse. In the case of , this process can potentially mitigate the discrepancy between SIDM models and the observed dSphs in – plane [61, 57, 59]. It, however, is to be noted that it is unclear whether the core-collapse induced by tidal stripping occurs generally. This is because such core-collapse mechanism depends on halo concentration and orbital properties (e.g., eccentricity, pericenter radius, infall time, and so on). Self-interaction between host halo and subhalo particles can alter the abundance and dynamics of subhalos [26]. Although its effect depends on SIDM models and even how self-interaction is implemented in simulations, it could also shorten the timescale of core-collapse. Therefore, we need further studies to assess the impact of core-collapse.
IV.2 Galactic disk
The Galactic disk potential, which is not included in our simulations, could make the inner dark matter potential wall much deeper. Thus, adding a stellar disk preferentially reduces the subhalo densities and the subhalo abundance with smaller pericenter distances (e.g., [62, 63]), depending on the subhalo concentrations and orbital inclinations [57]. In particular, subhalos with pericenter less than 2030 kpc is affected, therefore, the overall trend between and in each of our simulations should not be altered.
V Conclusions
We conducted high-resolution cosmological -body simulations based on both CDM and SIDM that resolve density structures of the classical dSph and massive UFD scale subhalos. We have quantified the subhalos’ central density at 150 pc from the center of each subhalo. Comparing them with observational data, we have found that the SIDM scattering cross-section of is favored. Subhalos with higher tend to have lower in the and simulations, whereas CDM counterparts tend to have higher . This feature is prominent in subhalos with small pericenter due to the combination of hosts’ tide and self-interactions. Therefore, the Milky-Way satellites with small pericenter are ideal sites to further constrain the nature of dark matter by future large spectroscopic surveys.
acknowledgments
We thank Ethan O. Nadler for his helpful discussions. Numerical computations were carried out on Aterui-II supercomputer at the Center for Computational Astrophysics, National Astronomical Observatory of Japan. This work has been supported by MEXT as “Program for Promoting Researches on the Supercomputer Fugaku” (JPMXP1020200109), and JICFuS. We thank the support of MEXT/JSPS KAKENHI Grant Number JP18H04337, JP20H05245 (for TI), 20H01895, and 21K13909 (for KH).
References
- Bahcall et al. [1999] N. A. Bahcall, J. P. Ostriker, S. Perlmutter, and P. J. Steinhardt, Science 284, 1481 (1999), eprint astro-ph/9906463.
- Tegmark et al. [2004] M. Tegmark, M. A. Strauss, M. R. Blanton, K. Abazajian, S. Dodelson, H. Sandvik, X. Wang, D. H. Weinberg, I. Zehavi, N. A. Bahcall, et al., Phys. Rev. D 69, 103501 (2004), eprint astro-ph/0310723.
- Springel et al. [2006] V. Springel, C. S. Frenk, and S. D. M. White, Nature (London) 440, 1137 (2006), eprint astro-ph/0604561.
- Mandelbaum et al. [2018] R. Mandelbaum, H. Miyatake, T. Hamana, M. Oguri, M. Simet, R. Armstrong, J. Bosch, R. Murata, F. Lanusse, A. Leauthaud, et al., Publ. of the Astron. Society of Japan 70, S25 (2018), eprint 1705.06745.
- Heymans et al. [2021] C. Heymans, T. Tröster, M. Asgari, C. Blake, H. Hildebrandt, B. Joachimi, K. Kuijken, C.-A. Lin, A. G. Sánchez, J. L. van den Busch, et al., Astron. Astrophys. 646, A140 (2021), eprint 2007.15632.
- Ishiyama et al. [2021] T. Ishiyama, F. Prada, A. A. Klypin, M. Sinha, R. B. Metcalf, E. Jullo, B. Altieri, S. A. Cora, D. Croton, S. de la Torre, et al., Mon. Not. R. Astron. Soc. 506, 4210 (2021), eprint 2007.14720.
- DES Collaboration et al. [2021] DES Collaboration, T. M. C. Abbott, M. Aguena, A. Alarcon, S. Allam, O. Alves, A. Amon, F. Andrade-Oliveira, J. Annis, S. Avila, et al., arXiv e-prints arXiv:2105.13549 (2021), eprint 2105.13549.
- Navarro et al. [1997] J. F. Navarro, C. S. Frenk, and S. D. M. White, Astrophys. J. 490, 493 (1997), eprint arXiv:astro-ph/9611107.
- Burkert [1995] A. Burkert, The Astrophysical Journal Letters 447, L25 (1995).
- De Blok et al. [2003] W. De Blok, A. Bosma, and S. McGaugh, Monthly Notices of the Royal Astronomical Society 340, 657 (2003).
- Oh et al. [2011a] S.-H. Oh, W. De Blok, E. Brinks, F. Walter, and R. C. Kennicutt Jr, The Astronomical Journal 141, 193 (2011a).
- Oh et al. [2011b] S.-H. Oh, C. Brook, F. Governato, E. Brinks, L. Mayer, W. De Blok, A. Brooks, and F. Walter, The Astronomical Journal 142, 24 (2011b).
- Oman et al. [2015] K. A. Oman, J. F. Navarro, A. Fattahi, C. S. Frenk, T. Sawala, S. D. M. White, R. Bower, R. A. Crain, M. Furlong, M. Schaller, et al., Mon. Not. R. Astron. Soc. 452, 3650 (2015), eprint 1504.01437.
- Spergel and Steinhardt [2000] D. N. Spergel and P. J. Steinhardt, Physical Review Letters 84, 3760 (2000).
- Tulin and Yu [2018] S. Tulin and H.-B. Yu, Physics Reports 730, 1 (2018).
- Zavala et al. [2013] J. Zavala, M. Vogelsberger, and M. G. Walker, Mon. Not. R. Astron. Soc. 431, L20 (2013), eprint 1211.6426.
- Elbert et al. [2015] O. D. Elbert, J. S. Bullock, S. Garrison-Kimmel, M. Rocha, J. Oñorbe, and A. H. G. Peter, Mon. Not. R. Astron. Soc. 453, 29 (2015), eprint 1412.1477.
- Kaplinghat et al. [2016] M. Kaplinghat, S. Tulin, and H.-B. Yu, Physical Review Letters 116, 041302 (2016).
- Kim et al. [2017] S. Y. Kim, A. H. Peter, and D. Wittman, Monthly Notices of the Royal Astronomical Society 469, 1414 (2017).
- Robertson et al. [2017] A. Robertson, R. Massey, and V. Eke, Monthly Notices of the Royal Astronomical Society 465, 569 (2017).
- Sagunski et al. [2021] L. Sagunski, S. Gad-Nasr, B. Colquhoun, A. Robertson, and S. Tulin, Journal of Cosmology and Astroparticle Physics 2021, 024 (2021).
- Loeb and Weiner [2011] A. Loeb and N. Weiner, Physical Review Letters 106, 171302 (2011).
- Vogelsberger et al. [2012] M. Vogelsberger, J. Zavala, and A. Loeb, Mon. Not. R. Astron. Soc. 423, 3740 (2012), eprint 1201.5892.
- Chu et al. [2019] X. Chu, C. Garcia-Cely, and H. Murayama, Phys. Rev. Lett. 122, 071103 (2019), eprint 1810.04709.
- Banerjee et al. [2020] A. Banerjee, S. Adhikari, N. Dalal, S. More, and A. Kravtsov, J. Cosmology Astropart. Phys 2020, 024 (2020), eprint 1906.12026.
- Nadler et al. [2020] E. O. Nadler, A. Banerjee, S. Adhikari, Y.-Y. Mao, and R. H. Wechsler, Astrophys. J. 896, 112 (2020), eprint 2001.08754.
- Ackerman et al. [2009] L. Ackerman, M. R. Buckley, S. M. Carroll, and M. Kamionkowski, Physical Review D 79, 023519 (2009).
- Petraki and Volkas [2013] K. Petraki and R. R. Volkas, International Journal of Modern Physics A 28, 1330028 (2013), eprint 1305.4939.
- Kahlhoefer et al. [2014] F. Kahlhoefer, K. Schmidt-Hoberg, M. T. Frandsen, and S. Sarkar, Monthly Notices of the Royal Astronomical Society 437, 2865 (2014).
- Balberg et al. [2002] S. Balberg, S. L. Shapiro, and S. Inagaki, Astrophys. J. 568, 475 (2002), eprint astro-ph/0110561.
- Nishikawa et al. [2020] H. Nishikawa, K. K. Boddy, and M. Kaplinghat, Phys. Rev. D 101, 063009 (2020), eprint 1901.00499.
- Tollet et al. [2016] E. Tollet, A. V. Macciò, A. A. Dutton, G. S. Stinson, L. Wang, C. Penzo, T. A. Gu tcke, T. Buck, X. Kang, C. Brook, et al., Mon. Not. R. Astron. Soc. 456, 3542 (2016), eprint 1507.03590.
- Fitts et al. [2017] A. Fitts, M. Boylan-Kolchin, O. D. Elbert, J. S. Bullock, P. F. Hopkins, J. e. Oñorbe, A. Wetzel, C. Wheeler, C.-A. Faucher-Giguère, D. Kereš, et al., Mon. Not. R. Astron. Soc. 471, 3547 (2017), eprint 1611.02281.
- Lazar et al. [2020] A. Lazar, J. S. Bullock, M. Boylan-Kolchin, T. K. Chan, P. F. Hopkins, A. S. . Graus, A. Wetzel, K. El-Badry, C. Wheeler, M. C. Straight, et al., Mon. Not. R. Astron. Soc. 497, 2393 (2020), eprint 2004.10817.
- Hayashi et al. [2021] K. Hayashi, M. Ibe, S. Kobayashi, Y. Nakayama, and S. Shirai, Phys. Rev. D 103, 023017 (2021), eprint 2008.02529.
- Kaplinghat et al. [2016] M. Kaplinghat, S. Tulin, and H.-B. Yu, Phys. Rev. Lett. 116, 041302 (2016), eprint 1508.03339.
- Kamada et al. [2017] A. Kamada, M. Kaplinghat, A. B. Pace, and H.-B. Yu, Phys. Rev. Lett. 119, 111102 (2017), eprint 1611.02716.
- Valli and Yu [2018] M. Valli and H.-B. Yu, Nature Astronomy 2, 907 (2018), eprint 1711.03502.
- Robertson et al. [2021] A. Robertson, R. Massey, V. Eke, J. Schaye, and T. Theuns, Mon. Not. R. Astron. Soc. 501, 4610 (2021), eprint 2009.07844.
- Zavala et al. [2019] J. Zavala, M. R. Lovell, M. Vogelsberger, and J. D. Burger, Phys. Rev. D 100, 063007 (2019), eprint 1904.09998.
- Read et al. [2019] J. I. Read, M. Walker, and P. Steger, Monthly Notices of the Royal Astronomical Society 484, 1401 (2019).
- Kaplinghat et al. [2019] M. Kaplinghat, M. Valli, and H.-B. Yu, Mon. Not. R. Astron. Soc. 490, 231 (2019), eprint 1904.04939.
- Hayashi et al. [2020] K. Hayashi, M. Chiba, and T. Ishiyama, Astrophys. J. 904, 45 (2020), eprint 2007.13780.
- Crocce et al. [2006] M. Crocce, S. Pueblas, and R. Scoccimarro, Mon. Not. R. Astron. Soc. 373, 369 (2006), eprint astro-ph/0606505.
- Planck Collaboration et al. [2020] Planck Collaboration, N. Aghanim, Y. Akrami, M. Ashdown, J. Aumont, C. Baccigalupi, M. Ballardini, A. J. Banday, R. B. Barreiro, N. Bartolo, et al., Astron. Astrophys. 641, A6 (2020), eprint 1807.06209.
- Ishiyama et al. [2009] T. Ishiyama, T. Fukushige, and J. Makino, Publ. of the Astron. Society of Japan 61, 1319 (2009).
- Ishiyama et al. [2012] T. Ishiyama, K. Nitadori, and J. Makino, in Proc. Int. Conf. High Performance Computing, Networking, Storage and Analysis, SC’12 (Los Alamitos, CA: IEEE Computer Society Press), 5:, (arXiv:1211.4406) (2012), ISBN 978-1-4673-0804-5, URL http://dl.acm.org/citation.cfm?id=2388996.2389003.
- Nitadori et al. [2006] K. Nitadori, J. Makino, and P. Hut, New Astronomy 12, 169 (2006), eprint arXiv:astro-ph/0511062.
- Tanikawa et al. [2012] A. Tanikawa, K. Yoshikawa, T. Okamoto, and K. Nitadori, New Astronomy 17, 82 (2012), eprint 1104.2700.
- Tanikawa et al. [2013] A. Tanikawa, K. Yoshikawa, K. Nitadori, and T. Okamoto, New Astronomy 19, 74 (2013), eprint 1203.4037.
- Yoshikawa and Tanikawa [2018] K. Yoshikawa and A. Tanikawa, Research Notes of the American Astronomical Society 2, 231 (2018).
- Behroozi et al. [2013a] P. S. Behroozi, R. H. Wechsler, and H.-Y. Wu, Astrophys. J. 762, 109 (2013a), eprint 1110.4372.
- Behroozi et al. [2013b] P. S. Behroozi, R. H. Wechsler, H.-Y. Wu, M. T. Busha, A. A. Klypin, and J. R. Primack, Astrophys. J. 763, 18 (2013b), eprint 1110.4370.
- Takada et al. [2014] M. Takada et al., Publ. of the Astron. Society of Japan 66, R1 (2014), eprint 1206.0737.
- Laureijs et al. [2011] R. Laureijs et al., arXiv e-prints arXiv:1110.3193 (2011), eprint 1110.3193.
- Feng et al. [2021] W.-X. Feng, H.-B. Yu, and Y.-M. Zhong, Astrophys. J. Lett. 914, L26 (2021), eprint 2010.15132.
- Kahlhoefer et al. [2019] F. Kahlhoefer, M. Kaplinghat, T. R. Slatyer, and C.-L. Wu, J. Cosmology Astropart. Phys 2019, 010 (2019), eprint 1904.10539.
- Sameie et al. [2020] O. Sameie, H.-B. Yu, L. V. Sales, M. Vogelsberger, and J. Zavala, Phys. Rev. Lett. 124, 141102 (2020), eprint 1904.07872.
- Correa [2020] C. A. Correa (2020), eprint 2007.02958.
- Kamada et al. [2020] A. Kamada, H. J. Kim, and T. Kuwahara, JHEP 12, 202 (2020), eprint 2007.15522.
- Kaplinghat et al. [2019] M. Kaplinghat, M. Valli, and H.-B. Yu, Mon. Not. Roy. Astron. Soc. 490, 231 (2019), eprint 1904.04939.
- Kelley et al. [2019] T. Kelley, J. S. Bullock, S. Garrison-Kimmel, M. Boylan-Kolchin, M. S. Pawlowski, and A. S. Graus, Mon. Not. R. Astron. Soc. 487, 4409 (2019), eprint 1811.12413.
- Robles et al. [2019] V. H. Robles, T. Kelley, J. S. Bullock, and M. Kaplinghat, Mon. Not. R. Astron. Soc. 490, 2117 (2019), eprint 1903.01469.
- Rocha et al. [2013] M. Rocha, A. H. G. Peter, J. S. Bullock, M. Kaplinghat, S. Garrison-Kimmel, J. Oñorbe, and L. A. Moustakas, Mon. Not. R. Astron. Soc. 430, 81 (2013), eprint 1208.3025.
*
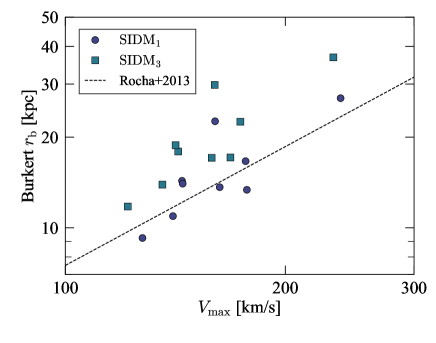
Appendix A Validation of the SIDM implementation
In this section, we validate our SIDM implementation by comparing the size of the SIDM core with a previous study. We fitted the Burkert profile to density profiles of the nine Milky Way-sized host halos from the and simulations, and obtained scale radius . Fig. 5 shows versus host halos’ circular velocity peak . Our halos are in good agreement with a previous simulation study [64], and the core size is systematically larger in halos than in halos, reinforcing the validity of our SIDM implementation.