Massive Protocluster of a Periodic Maser Source G188.950.89
Abstract
We report the results of ongoing monitoring of the 6.7 GHz CH3OH masers associated with G188.950.89. In these observations five features are periodically varying and at least two exhibit evidence of velocity drifts. It is not clear the cause of these velocity drifts. The spectra have varied significantly since detection in 1991. The 11.45 km s-1 feature has decreased exponentially from 2003. Complementary ALMA 1.3 mm continuum and line observational results are also presented. Eight continuum cores (MM1 – MM8) were detected in G188.950.89. We derived the masses of the detected cores. G188.950.89 MM2 was resolved into 2 continuum cores (separated by 0.1 ″) in ALMA band 7 observations. Also CH3OH (4(2,2)-3 thermal emission associated with MM2 is double peaked. We propose the presence of multiple (at least binary) young stellar objects in MM2. SiO emission exhibit a bow-shock morphology in MM2 while strong emission of 12CO at the east and west of MM2 suggest the presence of an east-west bipolar outflow.
keywords:
ISM: individual objects (G188.95+0.89) – radio lines:stars – ISM:molecules – masers – stars:formation – techniques:interferometric1 Introduction
High mass star-forming regions (HMSFRs) is an ongoing topic of open debate as it relates to mass growth (Motte et al., 2018). The timescales of phases associated with this process they state are of the order of 104–105 years. Observation of such phases is very difficult. A unique property to HMSFRs is the presence of class II methanol (CH3OH) masers in their early formative phases (Caswell et al., 1995a; Breen et al., 2013). These class II CH3OH masers have proven to be a reliable signpost of the very early stages of high-mass star formation (Menten, 1991; Caswell, 1996). Recent results of monitoring related infra-red sources and class II methanol (CH3OH) masers towards HMSFRs have identified significant accretion events. At present only four accretion events have been detected, they are: S255IR-NIRS3 (Fujisawa et al., 2015; Caratti o Garatti et al., 2017; Szymczak et al., 2018b), NGC6334I (Hunter et al., 2017, 2018; MacLeod et al., 2018), G323.46-0.08 (Proven-Adzri et al., 2019; MacLeod et al., 2021b), and G358.93-0.03 (Sugiyama et al., 2019; MacLeod et al., 2019; Breen et al., 2019; MacLeod et al., 2019; Burns et al., 2020).
Another important phenomena associated with HMSFRs are periodic methanol masers discovered by Goedhart et al. (2003). Periodic masers are rare, there are only twenty-five known so far (Goedhart et al., 2003, 2004, 2009, 2014; Araya et al., 2010; Szymczak et al., 2011; Fujisawa et al., 2014; Maswanganye et al., 2015; Szymczak et al., 2015; Sugiyama et al., 2015; Maswanganye et al., 2016; Szymczak et al., 2016; Sugiyama et al., 2017; Szymczak et al., 2018a; Proven-Adzri et al., 2019; Olech et al., 2020). Only the HMSFR source G323.46-0.08 is periodic and has experienced an accretion event (Proven-Adzri et al., 2019; MacLeod et al., 2021b).
The HMSFR G188.95+0.89 (also known as S 252 or AFGL 5180) is well studied at multiple wavelengths. Oh et al. (2010) reported the parallax distance as 1.76 0.11 kpc, Perseus spiral arm (Reid et al., 2009). The 6.7 GHz CH3OH masers of this source were discovered by Menten (1991) and reported periodic, 3958 d, by Goedhart et al. (2004, 2014). Kurtz et al. (2000) report an associated unresolved UCH11 region. Minier et al. (2005) did not detect the continuum radio source, but reported that the masers are projected on a bright mm source with an estimated mass in MM1 of 50. They also detected the presence of CH3CN and C18O towards the G188.95+0.89 methanol maser site indicating that they are within hot molecular cores (HMCs) with a gas density 105 cm-3.
In this paper, we present the results of ongoing 6.7 GHz CH3OH maser monitoring for G188.95+0.89. Significant variations of maser features are analysed. Also high-resolution mm-wavelength dust continuum and molecular line emission observations are presented.
2 Observations and Data Reduction
2.1 Single-dish Observations
The radio observations were made using the 26-m telescope of the Hartebeesthoek Radio Astronomy Observatory (HartRAO111See http://www.hartrao.ac.za/spectra/ for further information.). The 4.5 cm receiver is comprised of dual, cryogenically cooled, RCP and LCP feeds. Each polarisation was calibrated independently relative to Hydra A and 3C123, assuming the flux scale of Ott et al. (1994).
All observations employed frequency-switching (FS) and within 2 hr of zenith. Observations completed with a 1 MHz bandwidth and recorded with a 1024-channel per polarisation spectrometer (in FS 512 channels are saved). The velocity resolution achieved is 0.044 km s-1 and the typical 3 root-mean-square (rms) noise per observation was 1 Jy. This sensitivity is improved when across several channels, e.g. integration over ten channels improves the sensitivity to 0.3 Jy km s-1. For all the epochs, half-power beam-width pointing correction observations were carried out. The rest frequency was corrected for the Local Standard of Rest (LSR) velocity +10.0 km s-1. Listed in Table 1 are the parameters of the telescope, receiver, and observation set-up for each epoch.
Observations were made between 2003 June 30 to 2021 January 18 with a cadence of between 10 to 20 d; the cadence varied during several flares. No spectroscopic observations were taken between between 2008 September and 2010 December when the 26 m antenna underwent repairs (Gaylard, 2010). The position employed at HartRAO is R.A. = 06h 08m 533 and Dec. = 38 30 (J2000).
| Parameter | Quantity |
|---|---|
| Receiver | 4.5 cm |
| Maser Transition | J = 51 - 60 A + |
| Rest frequency | 6.668518 GHz |
| System temperature | 57 K |
| Beam width | 7′ |
| Correlator bandwidth | 1.0 MHz |
| Observing mode | Frequency-switching |
| Number of spectral channels | 512 |
| Velocity range | 22.5 km s-1 |
| Correlator resolution | 0.044 km s-1 |
| Central velocity | +10.0 km s-1 |
| Sensitivity 3 rms | 1.0 Jy |
| Monitoring period | 2003 Jun 30 - 2021 Jan 18 |
| Down time for repairs | 2008 Sept - 2010 Dec |
2.2 ALMA Observations
We obtained ALMA band 6 archival data on G188.95+0.89 (Project ID:2015.1.01454.S) taken on 2016 April 23 (42 antennas of the 12-m main array), 2016 September 17 (38 antennas of the 12-m main array). Observations of G188.95+0.89 (phase tracking center at R.A.(J2000) = 06h 08m 533 and Dec.(J2000) = 38 30″) were carried out at 1.3 mm (230 GHz) with ALMA band 6 in 2015 using two different configurations. The total time on-source was 19 and 30 minutes respectively, and the projected baselines ranged from 15 - 2600 m. The ALMA correlator was configured to cover nine spectral windows (spws). The raw visibility data were calibrated using the Common Astronomy Software Applications (CASA 5.4) standard calibration and imaging tasks. Bandpass and flux calibration were conducted using the sources J05101800 and J07501231, respectively. J060321591 was used as the gain calibrator. The calibrated visibility data from the two observation blocks were combined using CASA task , and was used to produce the images of the continuum (rms of 2.2 mJy beam-1). Also images of molecular line emission (typical rms of 2.2 mJy beam-1) with spectral resolution of 1 km s-1 are produced. In this paper, we will focus on the 12CO (2-1), CH3OH (4(2,2)-3, SiO (5-4) and C18O (2-1). For continuum subtraction, only line-free parts of the spectra were used. We used CASA to do all the calibration and imaging of the data cubes as well as self calibration to remove residual phase and flux calibration errors. The line data were then imaged with a robust weighting of 0.5.
3 Results
3.1 6.7 GHz CH3OH Masers Variability
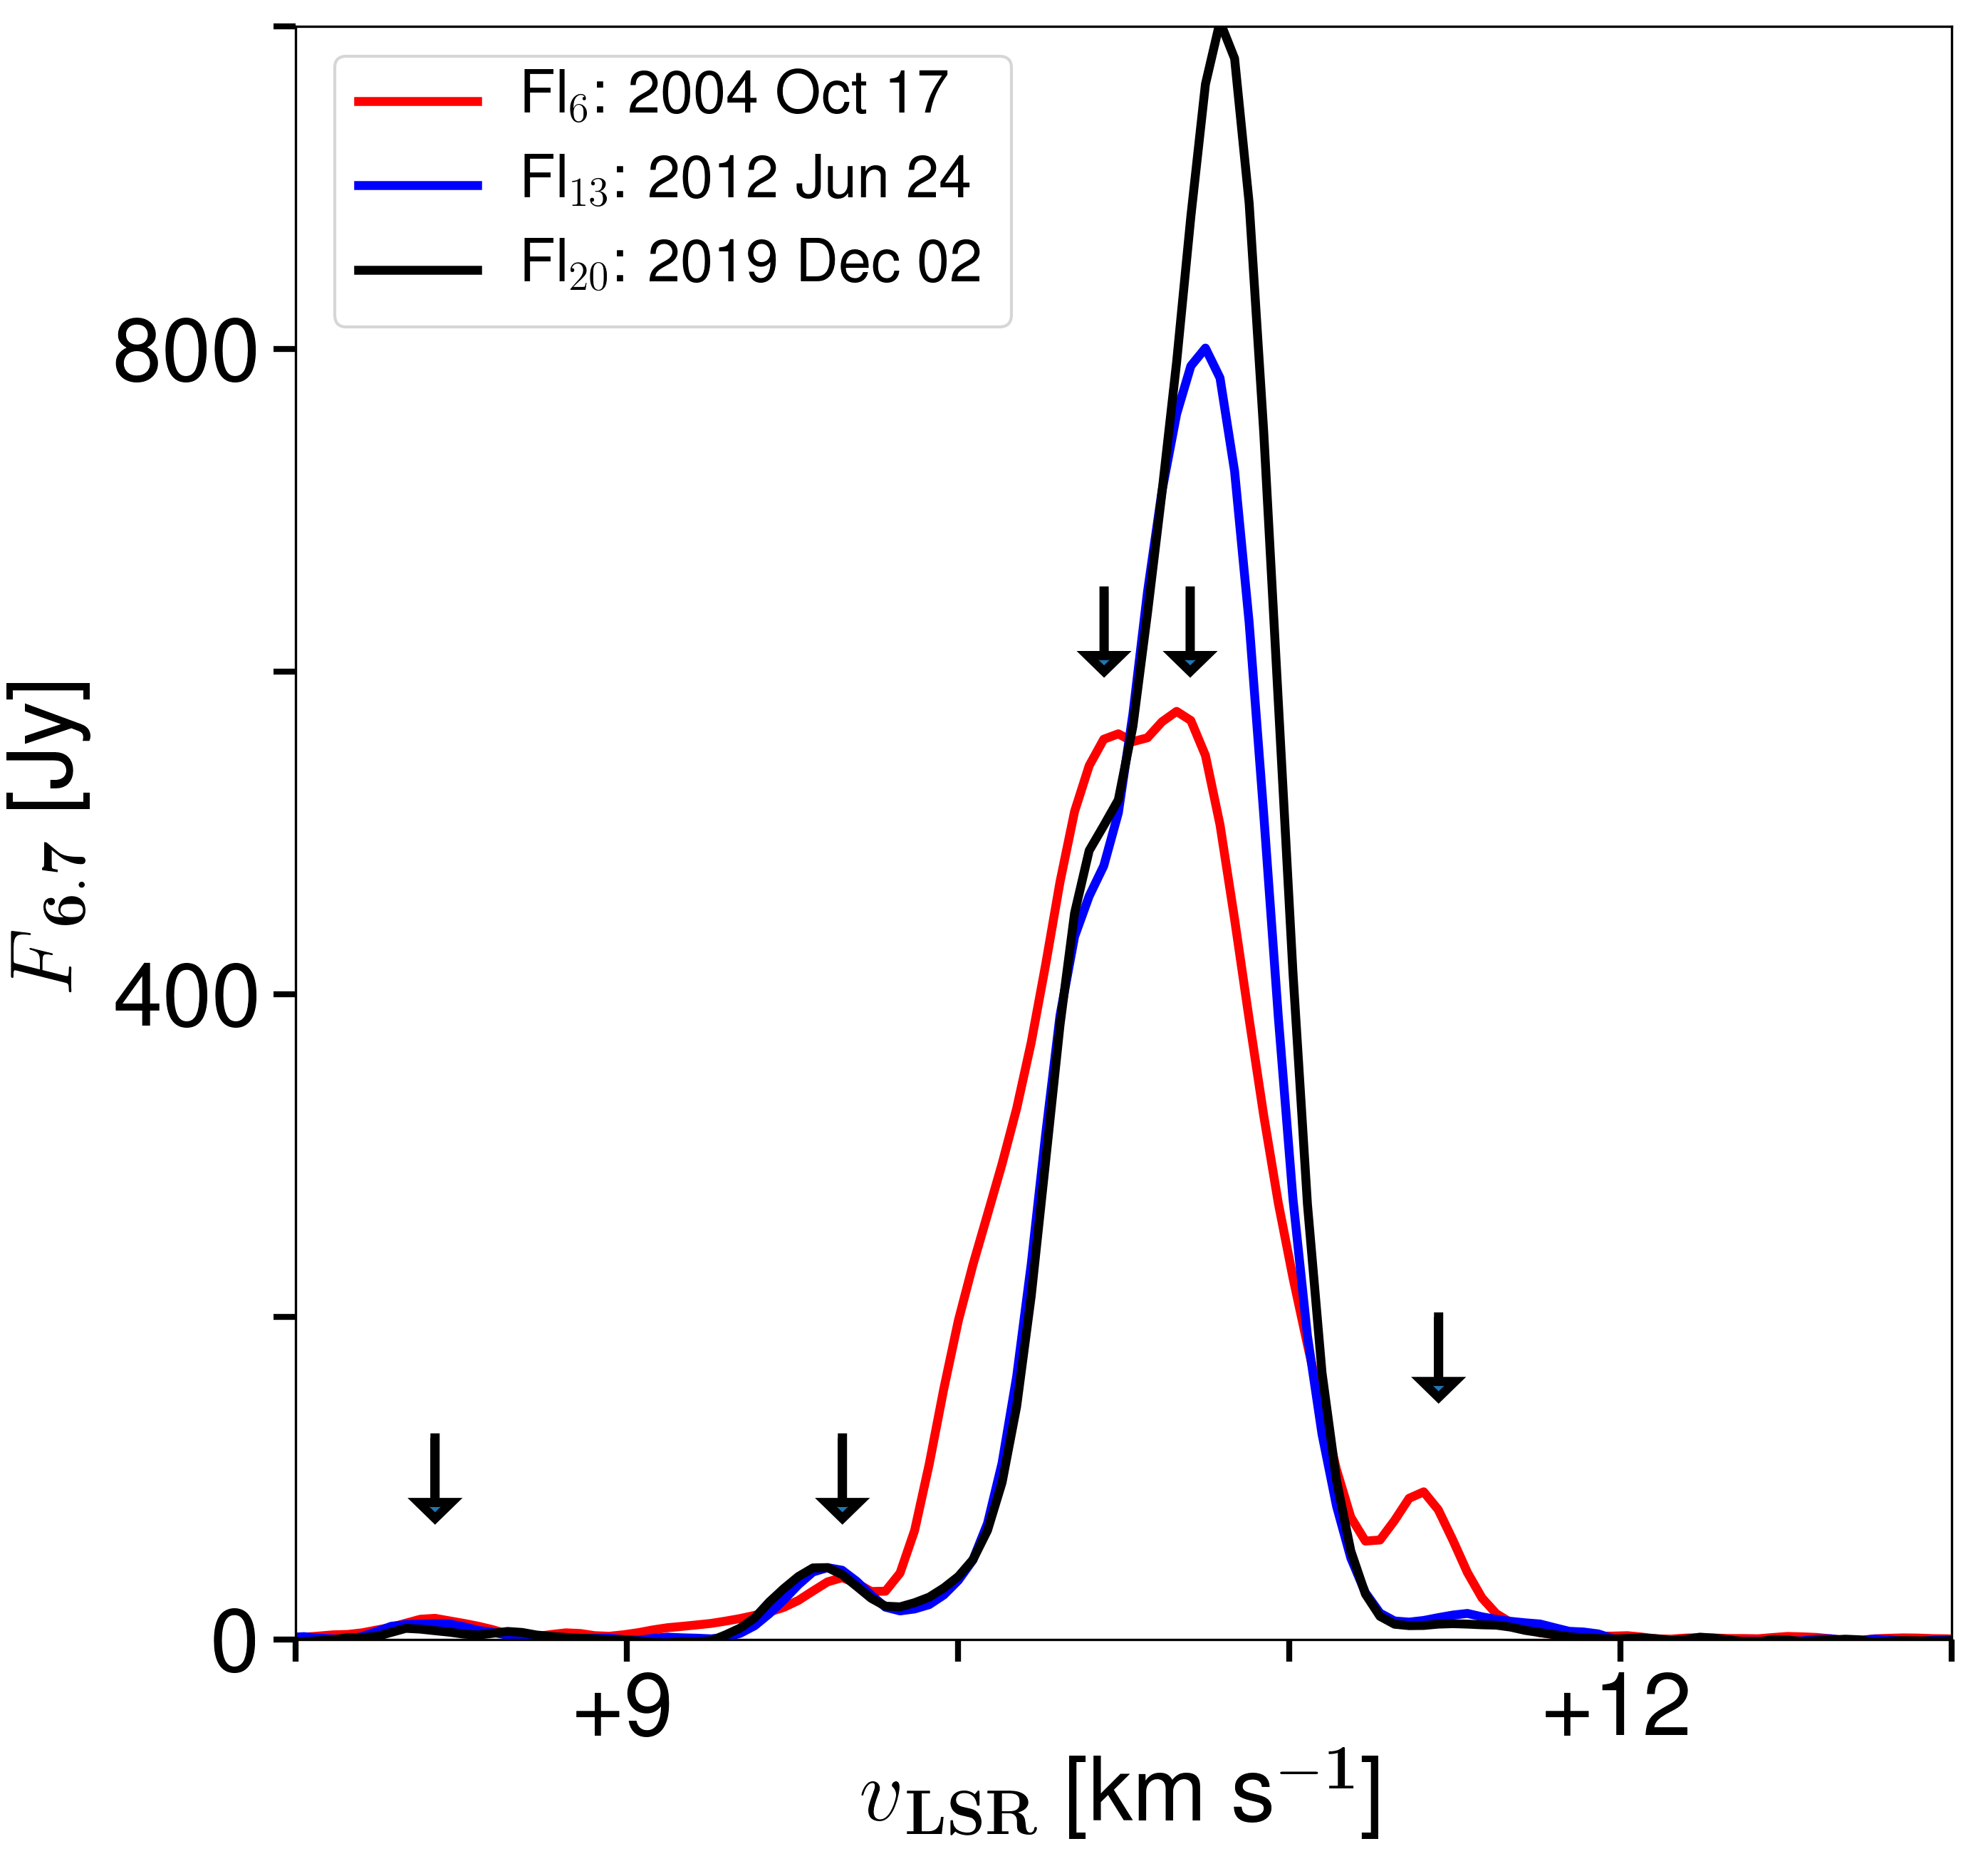
In Fig. 1 we present selected spectra from the seventeen flare cycles (Fln for n5 to 21) in the 6.7 GHz methanol maser observations associated with G188.950.89 studied here (the original four are published in Goedhart et al. (2004)). The spectra presented are the maxima of three of these flare cycles (flare number Fln for n6, 13, and 20). In this image it can be seen the evolution of the spectral profile over the 18 years of observations presented. This profile is certainly comprised of many line blended masers, in particular for +10 +11.3 km s-1.
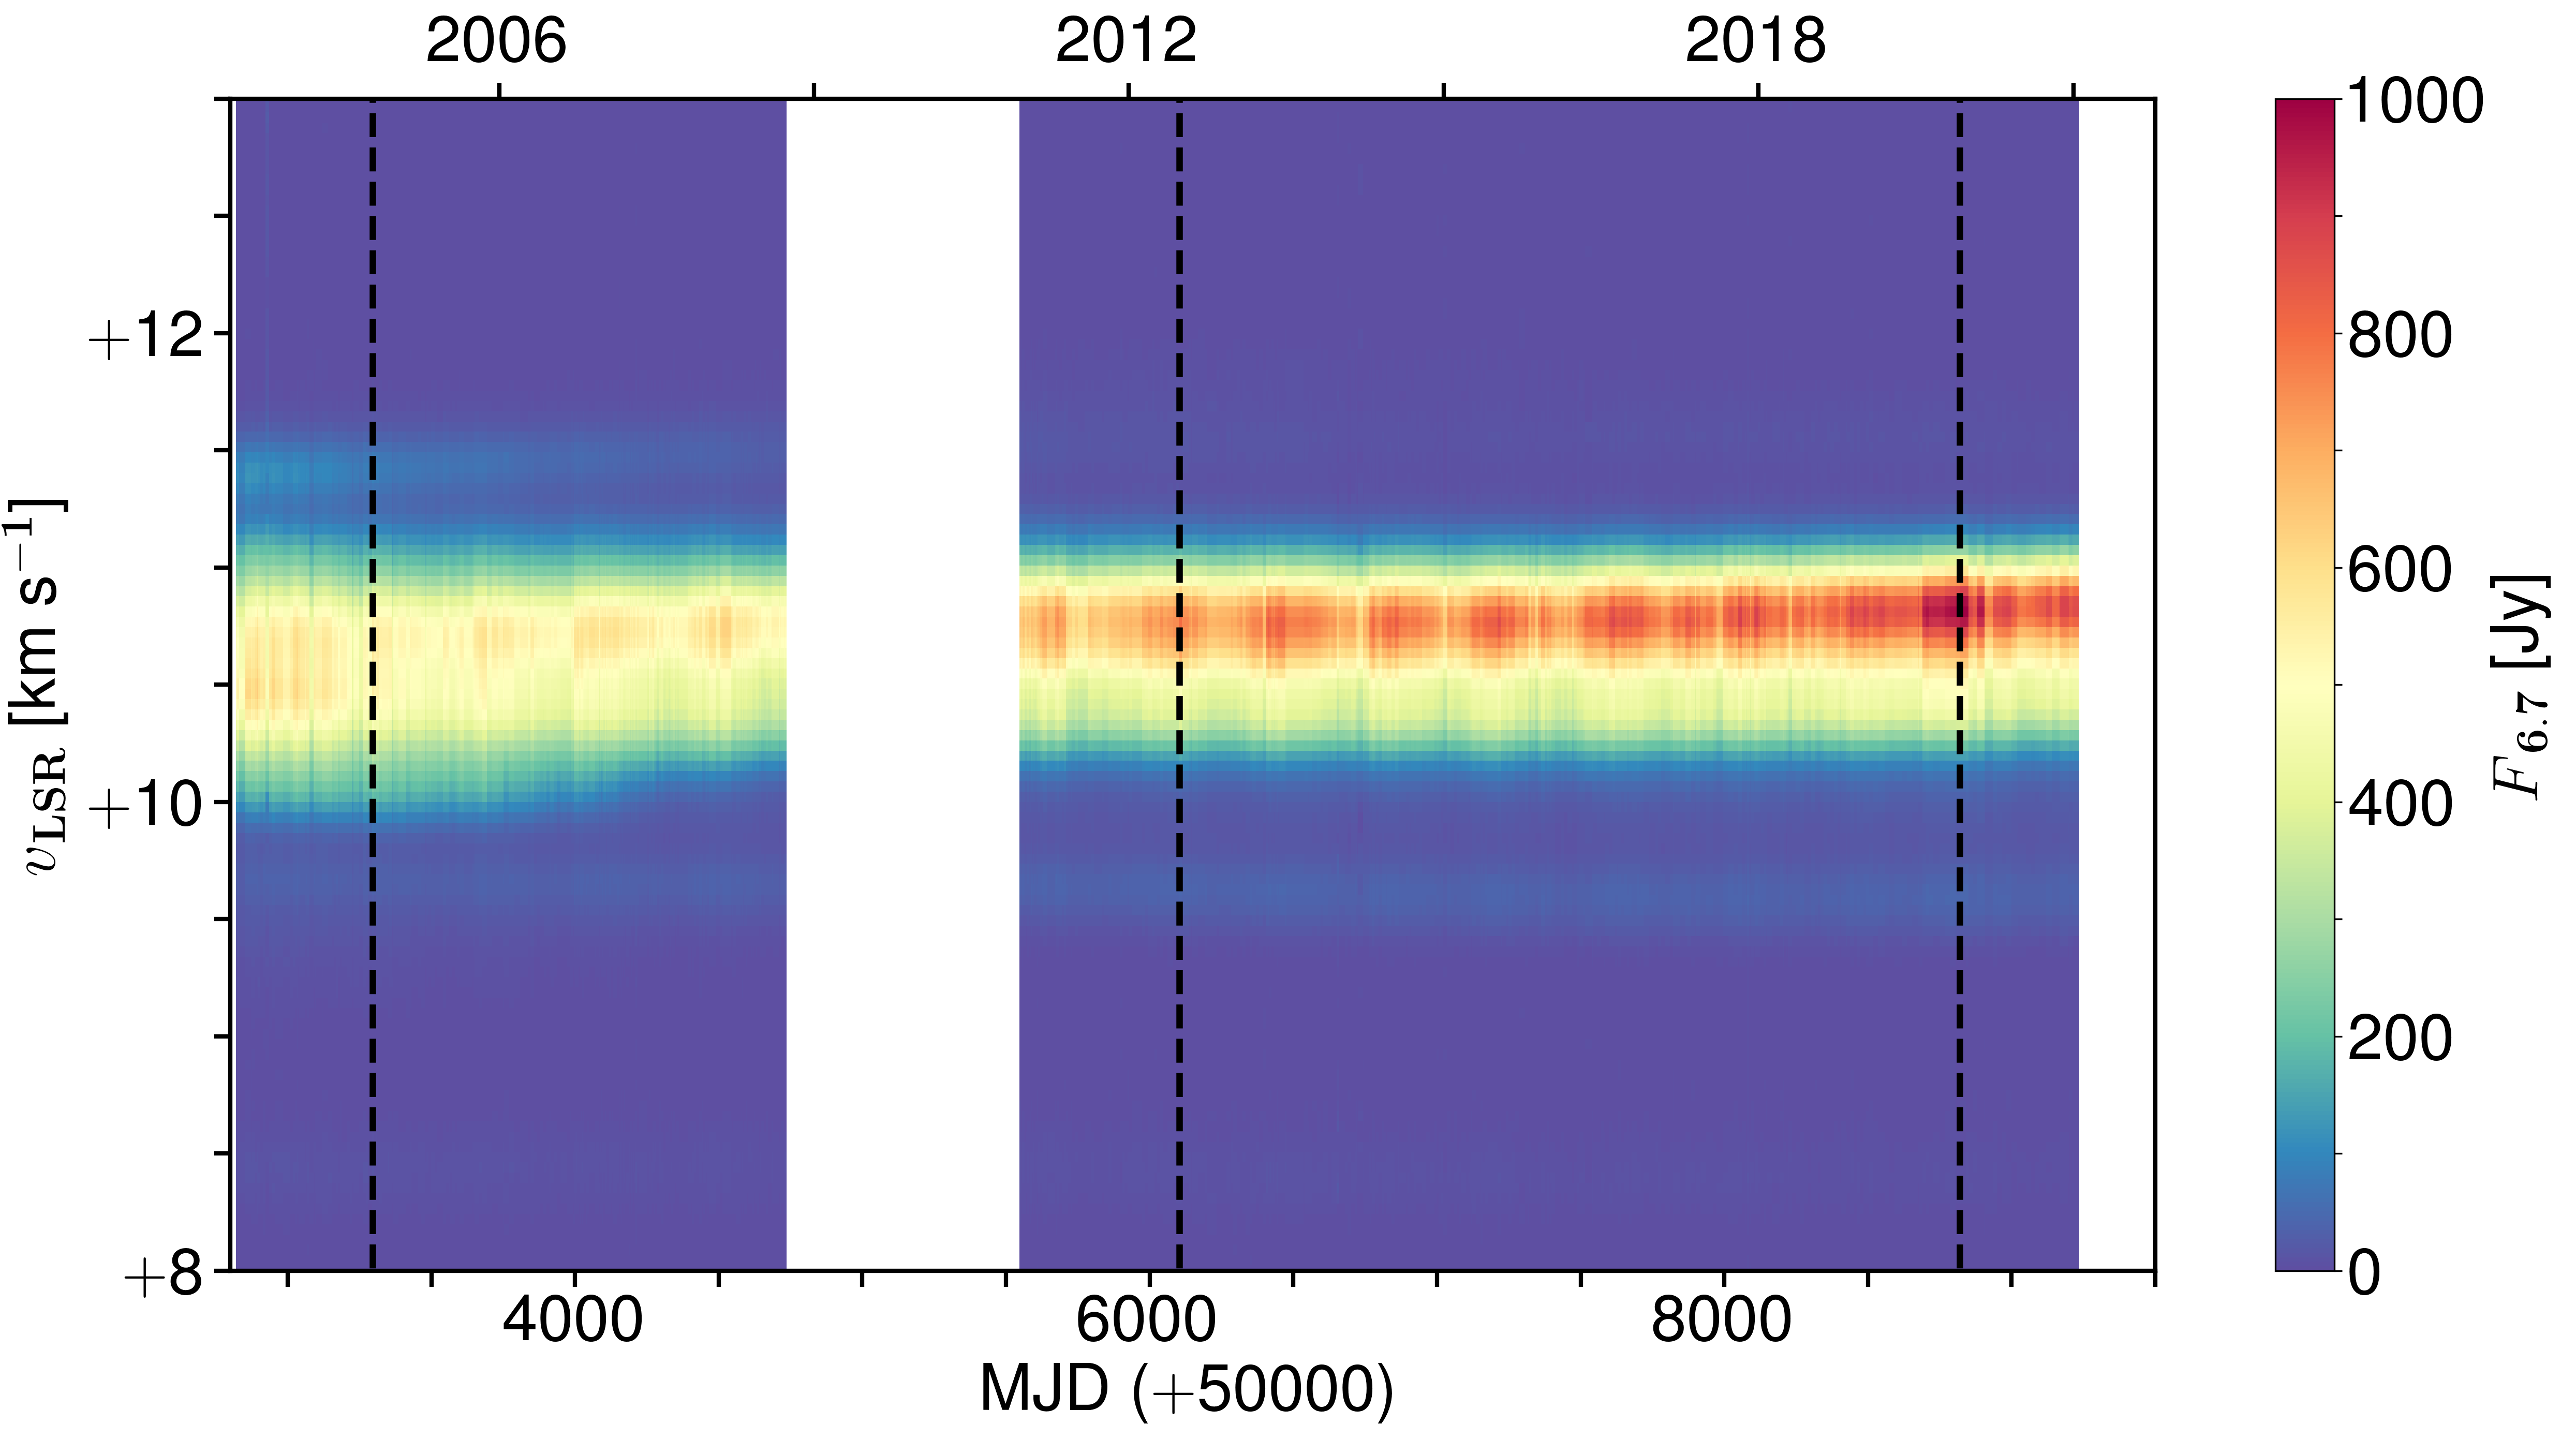
A dynamic spectra is the best way to visualise variability of these 6.7 GHz methanol masers associated with G188.950.89, see Fig. 2. Features have weakened others strengthened, most appear periodic and variations in velocity, velocity drifts, are apparent. For the purpose of analysis of these observations five features, two at +10.44 and +10.70 km s-1 in the heavily line merged velocity regime, and others at +8.42, +9.65, and +11.45 km s-1 are selected. Note, the former two features are likely comprised of multiple masers; the others less likely.
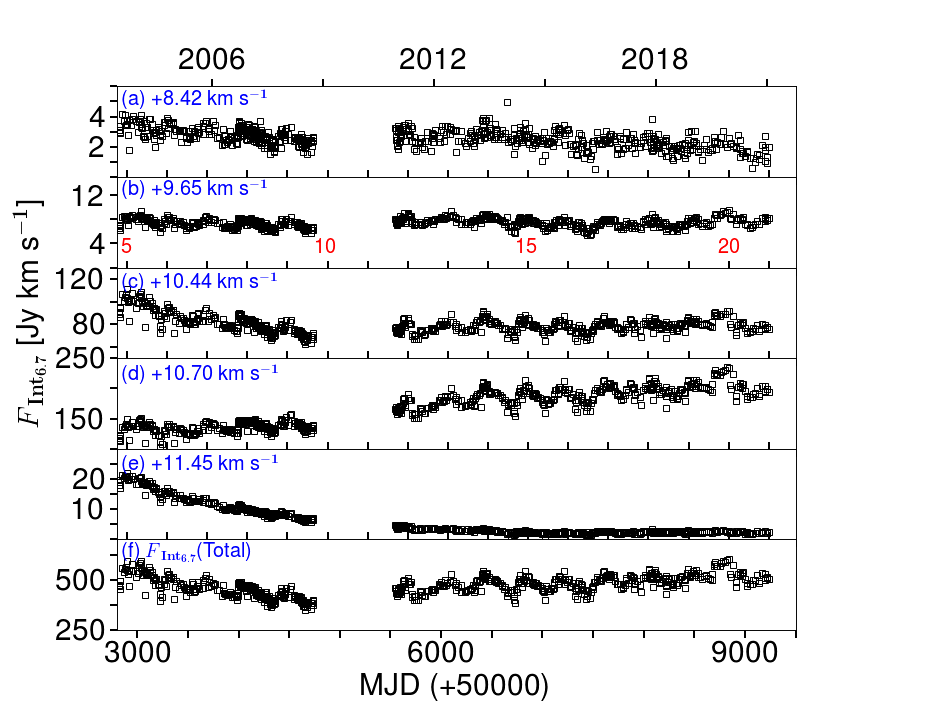
Time series plots of the integrated flux density, , for each selected feature are shown in Fig. 3. A time series plot of the total integrated flux density, (Total), is also shown. For each feature, in each epoch of observation, the velocity associated with the maximum flux density in the stated velocity extent is determined. Linear regression analysis is applied to each velocity time series to determine the velocity drift, and the results are included in this table. Two of the features have measurable velocity drifts, with "goodness of fit" values R 50. The apparent drift seen in the +10.70 km s-1 feature (see Fig. 1) may be the result of variations of heavily line merged masers contributing to the feature. The features at +9.65 and +11.45 km s-1 are best fit by a single Gaussian profile each; both possibly devoid of line merged features.
All five features are periodic though it is not obvious for the feature +11.45 km s-1 in Fig. 3. The period of each is determined using, firstly the programme Period04 developed by Lenz & Breger (2004) and secondly the Lomb-Scargle (LS) periodigram (Scargle, 1982). The results are listed in Table 2. The average period for each method is included and are within 3 standard deviation of each other, 3951 d against 397.60.7 d.
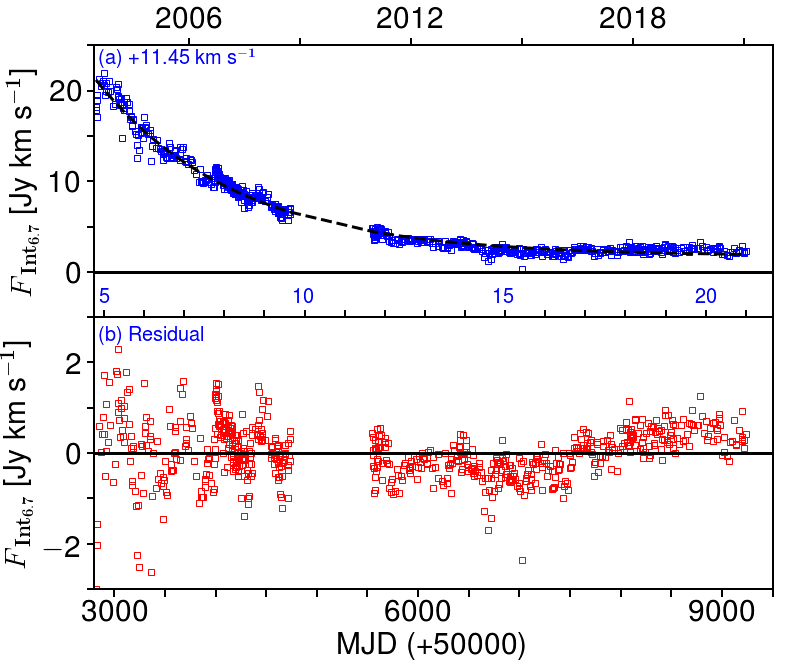
The +8.42 km s-1feature is decaying between 2003 and 2021 while the feature +10.70 km s-1 is increasing in this period. The +9.65 km s-1 feature appears flat in Fig. 3, however its associated flux density of the central velocity channel in the velocity range (not plotted) is rising. When first detected in 1991 (Menten, 1991) the +10.44 km s-1 feature was the brightest feature, here it is second strongest and is decaying until MJD 5000, thereafter it is flat or slightly increasing. The increase is possibly caused by contributions from the +10.70 km s-1 feature. Finally, for +11.45 km s-1, it is possible to fit an exponentially decaying function to the flux density time series, see Fig. 4. The fitted function is:
| (1) |
where 1504 Jy km s-1, 138020, and 1.740.05 Jy km s-1. Goedhart et al. (2004) reported this feature reached a maximum on 2001 November 12 (MJD 2225), 45 Jy km s-1. From Eqn. 1, on MJD 2225, it is estimated 30 Jy km s-1. The projected value is significantly lower than the actual value; they are outside estimated errors. The difference in velocity resolution, here it is 0.044 km s-1while in Goedhart et al. (2004) it is 0.056 km s-1, may account for this difference. Line-merged features may also be a factor. Some other features varied linearly and did not require de-trending for analysis. The complex varying feature +10.70 km s-1 will be analysed more elsewhere.
After Eqn. 1 is subtracted from the original time series the remaining residual, also plotted in Fig. 4, reveals its possible periodic nature. Note the slight increase after MJD 7500; possibly resulting from variations in the +10.70 km s-1 feature. The total integrated flux density plotted in Fig. 3 is seen first falling prior to MJD 5000 then rising suggesting the features decaying dominate prior to MJD 5000 thereafter brightening of the +10.70 km s-1 feature dominates.
The relative amplitude variation of each flare can be determined using Ramp:
| (2) |
where and are the minimum and maximum flux densities for each flare cycle and each feature. The results of Ramp for each velocity feature are included in Table 2. This value ranges from 0.1 to 2.8 for the five features. Note that R1 for the +11.45 km s-1 feature; the amplitude is deceasing approximately proportionately during the decay. No phase lags between maser features were found. This may infer that the periodic features are located such that when the cause of variations occur, it affects each nearly simultaneously. There may be lags shorter than our cadence that we cannot measure nor speculate about.
| Velocity | Period | Relative | Comments | |||||
|---|---|---|---|---|---|---|---|---|
| Feature | Extent | Drift | R2 | Amplitude | Velocity | Flux density | ||
| ( km s-1) | ( km s-1) | ( 10-5 km s-1 d-1) | () | (d) | (d) | |||
| 8.42 | 0.48 | 1.18(7) | 22.9 | 394.4 | 397.0 | 2.8 | uncertain | slowly decreasing |
| 9.65 | 0.26 | 2.38(3) | 81.6 | 395.8 | 396.7 | 0.6 | blue-shifting | slowly increasing |
| 10.44 | 0.18 | +0.42(4) | 30.4 | 393.5 | 398.3 | 0.1 | uncertain | complex |
| 10.70 | 0.31 | 0.39(5) | 5.7 | 396.3 | 398.2 | 1.0 | uncertain | increasing |
| 11.45 | 0.31 | 1.88(4) | 66.0 | 397.8 | 1 | red-shifting | exponential decay | |
| Average | 395(1) | 397.6(7) | ||||||
3.2 G188.950.89 Continuum Emission
| Object-name | R.A. | Dec. | Peak flux | Integrated flux | Vsys | Core mass |
|---|---|---|---|---|---|---|
| (h m s) | (∘ ) | (mJy beam-1) | (mJy) | (km s-1) | (M⊙) | |
| MM1 | 06 08 53.33 | 21 38 28.9 | 71.7 | 71.1 | 5.0 | 8.2 |
| MM2 | 06 08 53.49 | 21 38 30.5 | 22.5 | 41.3 | 2.0 | 4.8 |
| MM3 | 06 08 54.13 | 21 38 34.4 | 5.6 | 9.4 | 3.0 | 1.1 |
| MM4 | 06 08 52.86 | 21 38 29.5 | 3.2 | 3.8 | 4.5 | 0.5 |
| MM5∗ | 06 08 53.35 | 21 38 11.6 | 8.3 | 14.2 | 2.0 | 1.4 |
| MM6∗ | 06 08 53.42 | 21 38 13.7 | 1.9 | 3.6 | 4.0 | 0.4 |
| MM7∗ | 06 08 53.23 | 21 38 09.7 | 9.8 | 16.7 | - | 1.6 |
| MM8∗ | 06 08 52.97 | 21 38 11.1 | 5.8 | 6.0 | 4.0 | 0.6 |
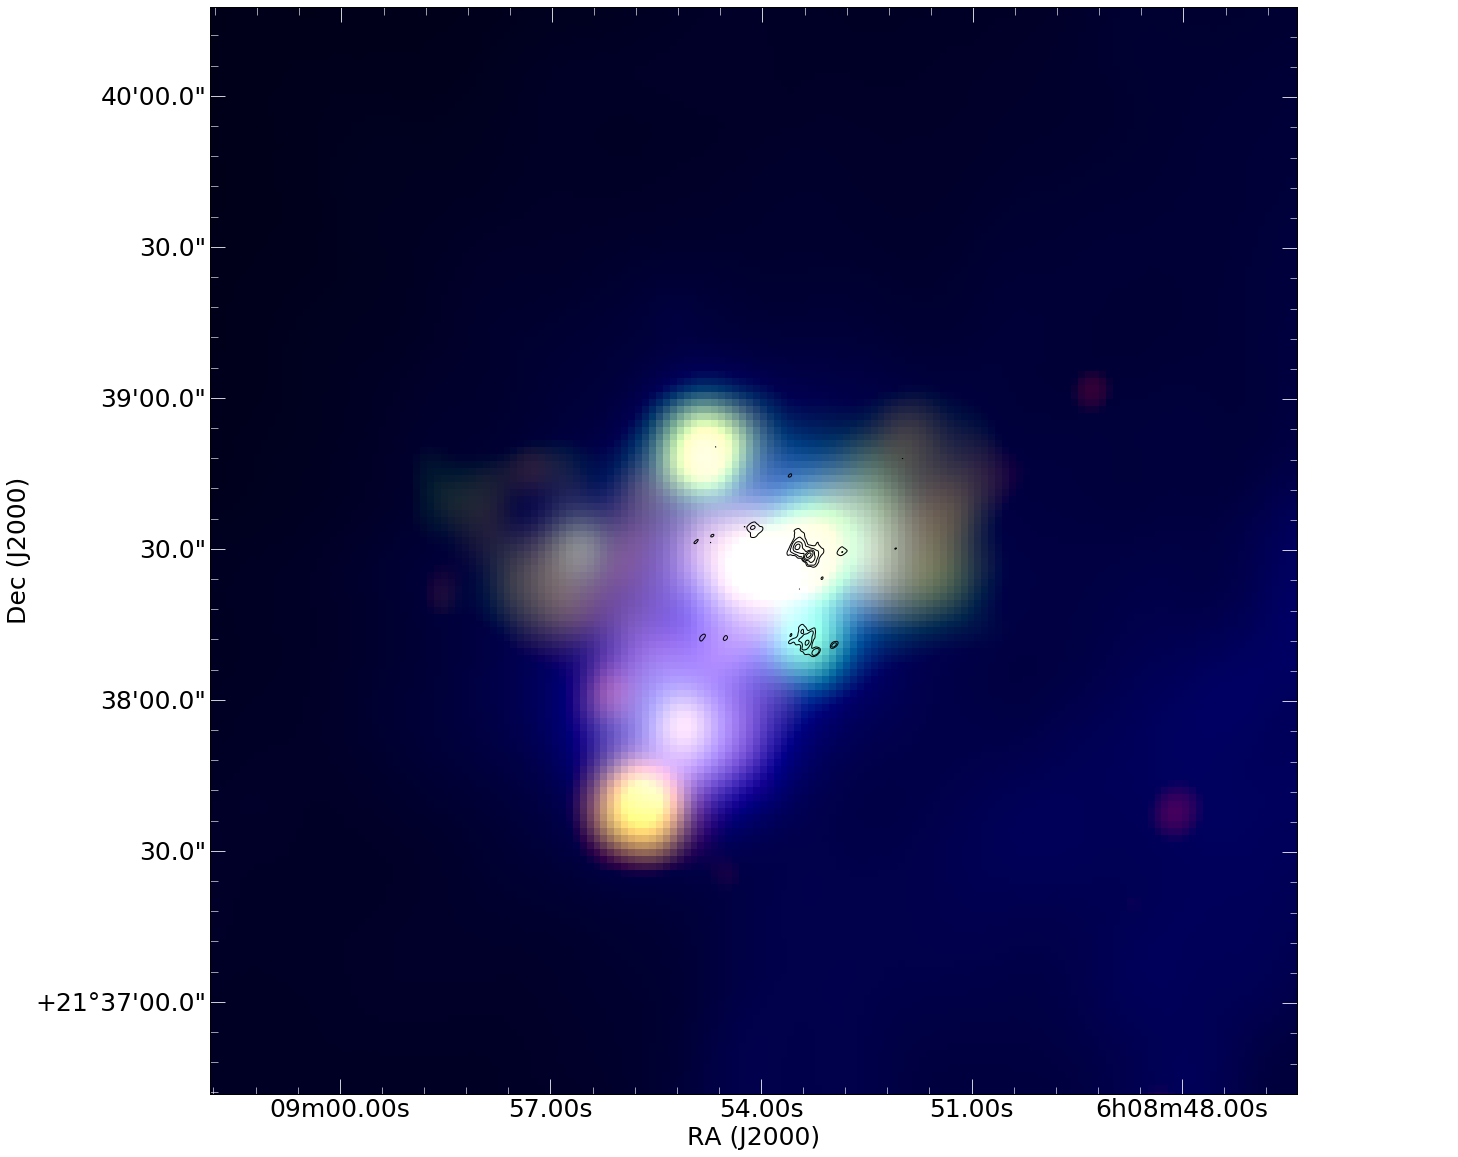
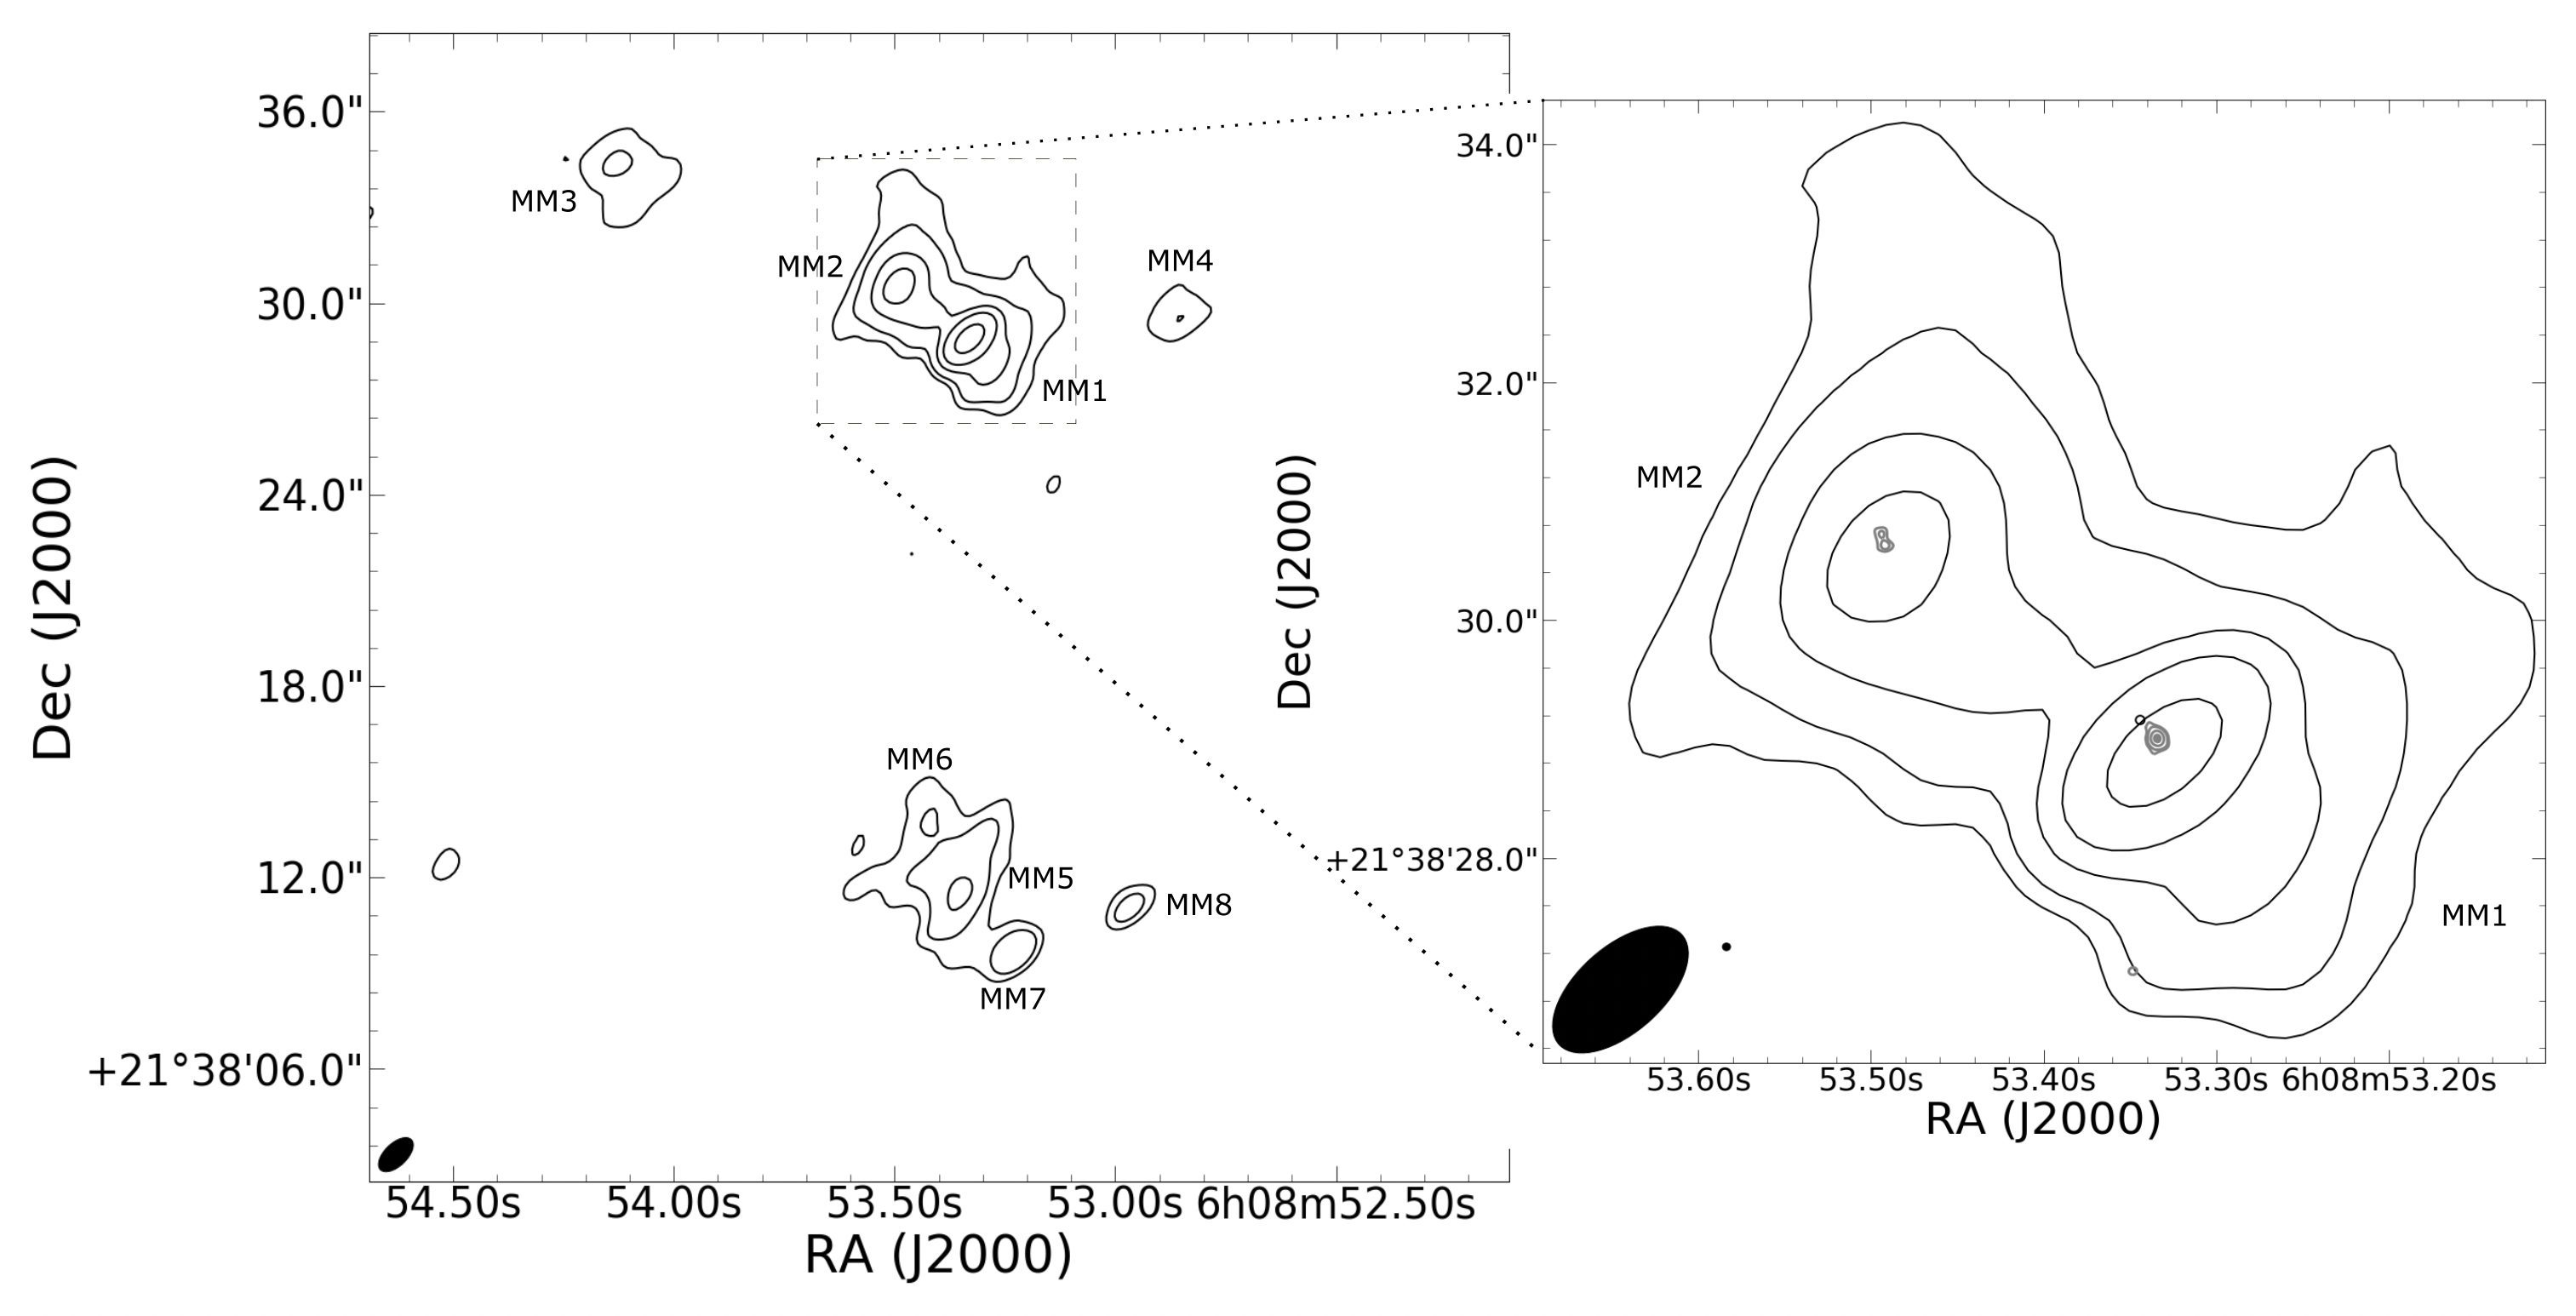
In Fig. 5 (top panel), we show the composite image of G188.950.89 in WISE bands 1 (3.4m: red), 2 (4.6 m: green) and 3 (12 m: blue) and ALMA 1.3 mm dust continuum emission. The WISE image show a central infrared source (bright in all 3 bands) corresponding to the 850 m SCUBA MM1 object, and a green (4.6 m) dominant object south of the central object corresponding to the 850 m SCUBA MM2 object (Minier et al., 2005). G188.950.89 is resolved into eight 1.3 mm objects (MM1–MM8) with ALMA. MM1–MM4 and MM5–MM8 objects (Fig. 5, bottom panel) are associated with 850 m SCUBA MM1 and MM2 objects of Minier et al. (2005), respectively.
ALMA 1.3 mm MM1 and MM2 are central objects (Fig. 5 bottom zoom-in) and MM1 (the brightest dust continuum object) is associated with the periodic 6.7 GHz CH3OH maser source. Interestingly, a recent ALMA band 7 observations resolved the continuum core in MM1 into a single object but resolved MM2 into 2 continuum cores (gray contours of Fig. 5 bottom zoom-in). Details of the detected continuum sources and their masses are presented in Table 3.
The dust mass in Table 3, can be estimated by assuming optically thin dust emission using Hildebrand (1983):
| (3) |
The dust continuum flux density is given in Table 3 at frequency, with the distance to the source which is 1.76 kpc and the dust opacity per unit mass, 0.33 cm2 g-1 for 230 GHz (Weingartner & Draine, 2001). is the Planck function at dust temperature, . The temperature used in the dust mass estimations were obtained from Minier et al. (2005), for cores MM1 to MM4 a temperature of 42 K is used and for cores MM5 to MM8, 50 K is used. To obtain the mass of the cores a a gas-to-dust mass ratio 100 was used and the results are given in Table 3
The integrated flux densities for MM5 to MM8, that were also used in the core mass estimates, are not primary beam corrected since MM5–MM8 are located close to the edge of the primary beam and will not be discussed in detail due to limited sensitivity.
| Observed molecular species | ||||
|---|---|---|---|---|
| Molecule | Transition | Rest frequency | EL | EU |
| (GHz) | (K) | (K) | ||
| SiO | 2-1 | 217.10498000 | 20.84 | 31.26 |
| C18O | 2-1 | 219.56035410 | 5.27 | 15.81 |
| CH3OH | 4(2,2)-3(1,2) | 218.44006300 | 34.50 | 45.46 |
| 12CO | 2-1 | 230.53800000 | 5.53 | 16.60 |
3.3 G188.950.89 Millimeter Line Emission
A number of thermal molecular lines were detected towards the 8 millimeter continuum objects, however, in this paper we will focus only the CH3OH (43(1,2)), SiO (), 12CO () and C18O ().
CH3OH 4(2,2)-3(1,2)
Emission from the CH3OH (43(1,2)) line was detected towards all 8 cores, see Fig. 6. The emission is strongest towards the southern MM5–MM8 and weakest towards MM4. The nature of the emission towards MM5–MM8 is contaminated by the effect of the decreased sensitivity towards the edge of the primary beam. Beyond detection or non-detection of an emission, no further discussions will be made for these objects.
One interesting feature of the CH3OH (4(2,2)-3 emission towards MM2 is the presence of a double peak in the emission at the systemic velocity of MM2. There is CH3OH (43(1,2)) emission associated with MM1. Minier
et al. (2005) indicated the temperature of the dust of the clump hosting the 1.3 mm ALMA MM1–MM4 sources to be 150 K.
SiO ()
Emission of SiO () is known to trace shocks especially in star-forming regions. The dominant SiO emission is observed in the north-west region of MM2, see Fig. 7. The emission has a bow-shock morphology in the channel corresponding to the systemic velocity of MM2. There are SiO emission (in some cases, very faint emission) associated with each of MM3 to MM8, however, no SiO emission is detected towards the MM1 object.
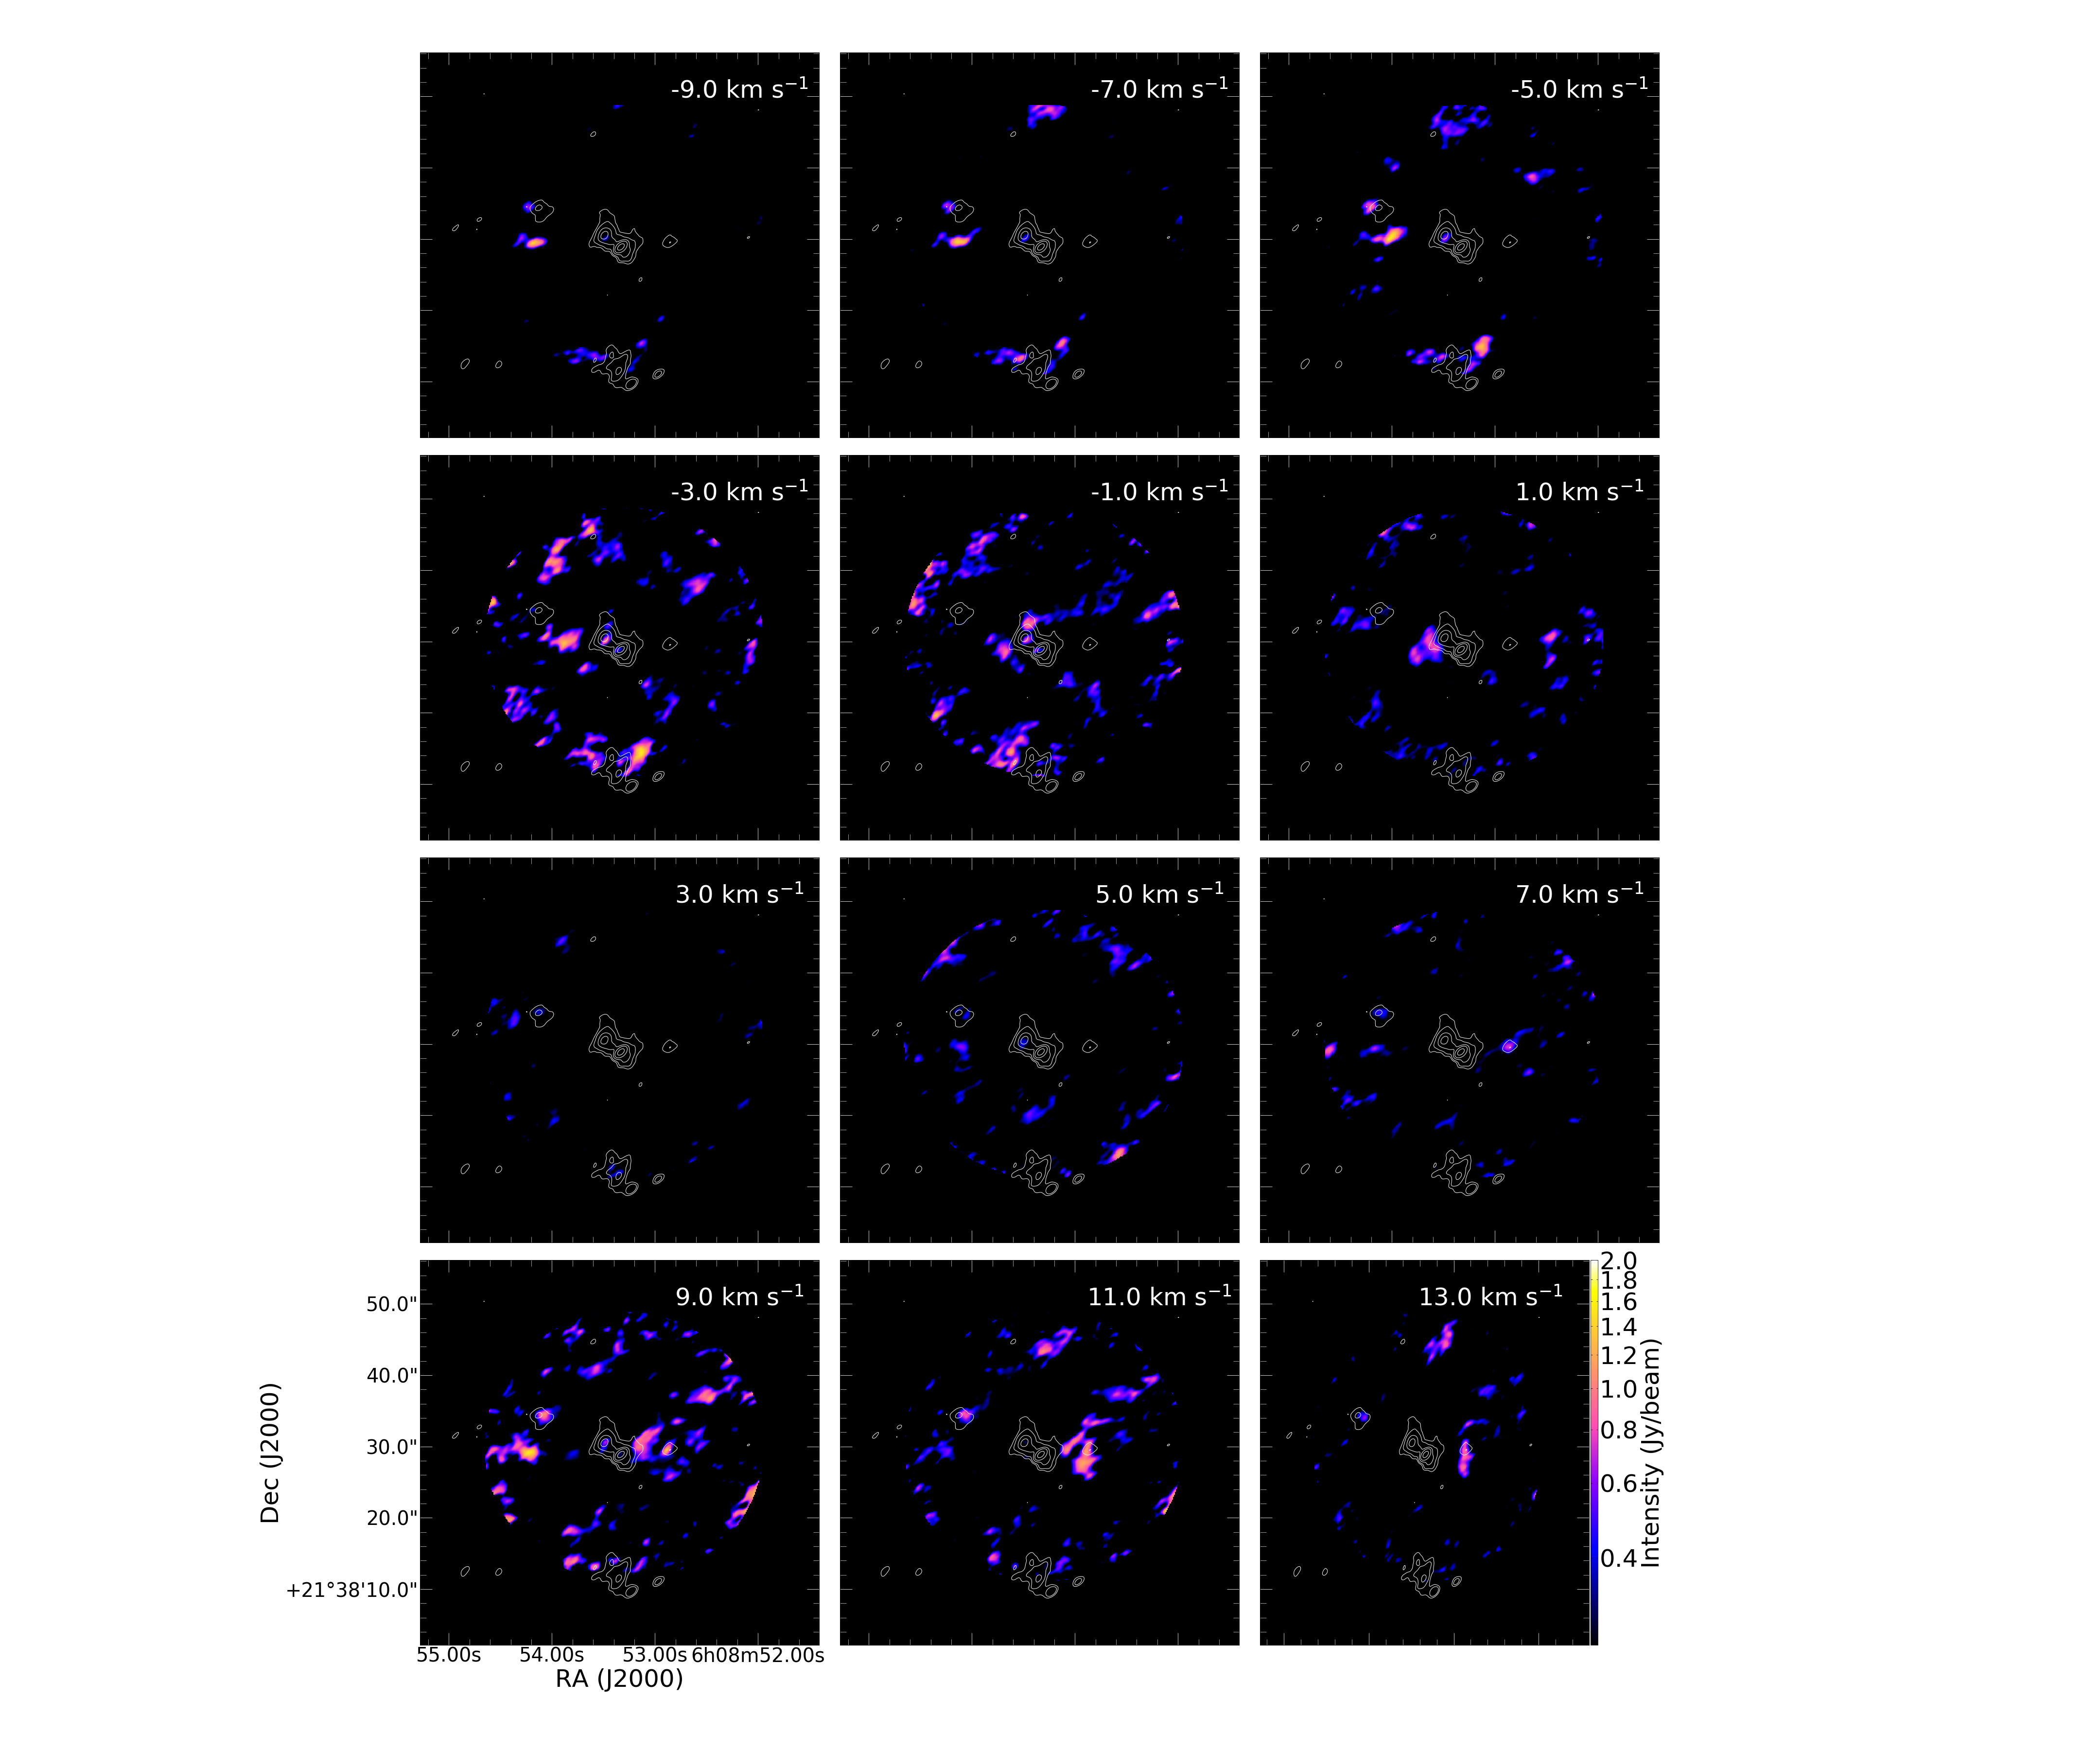
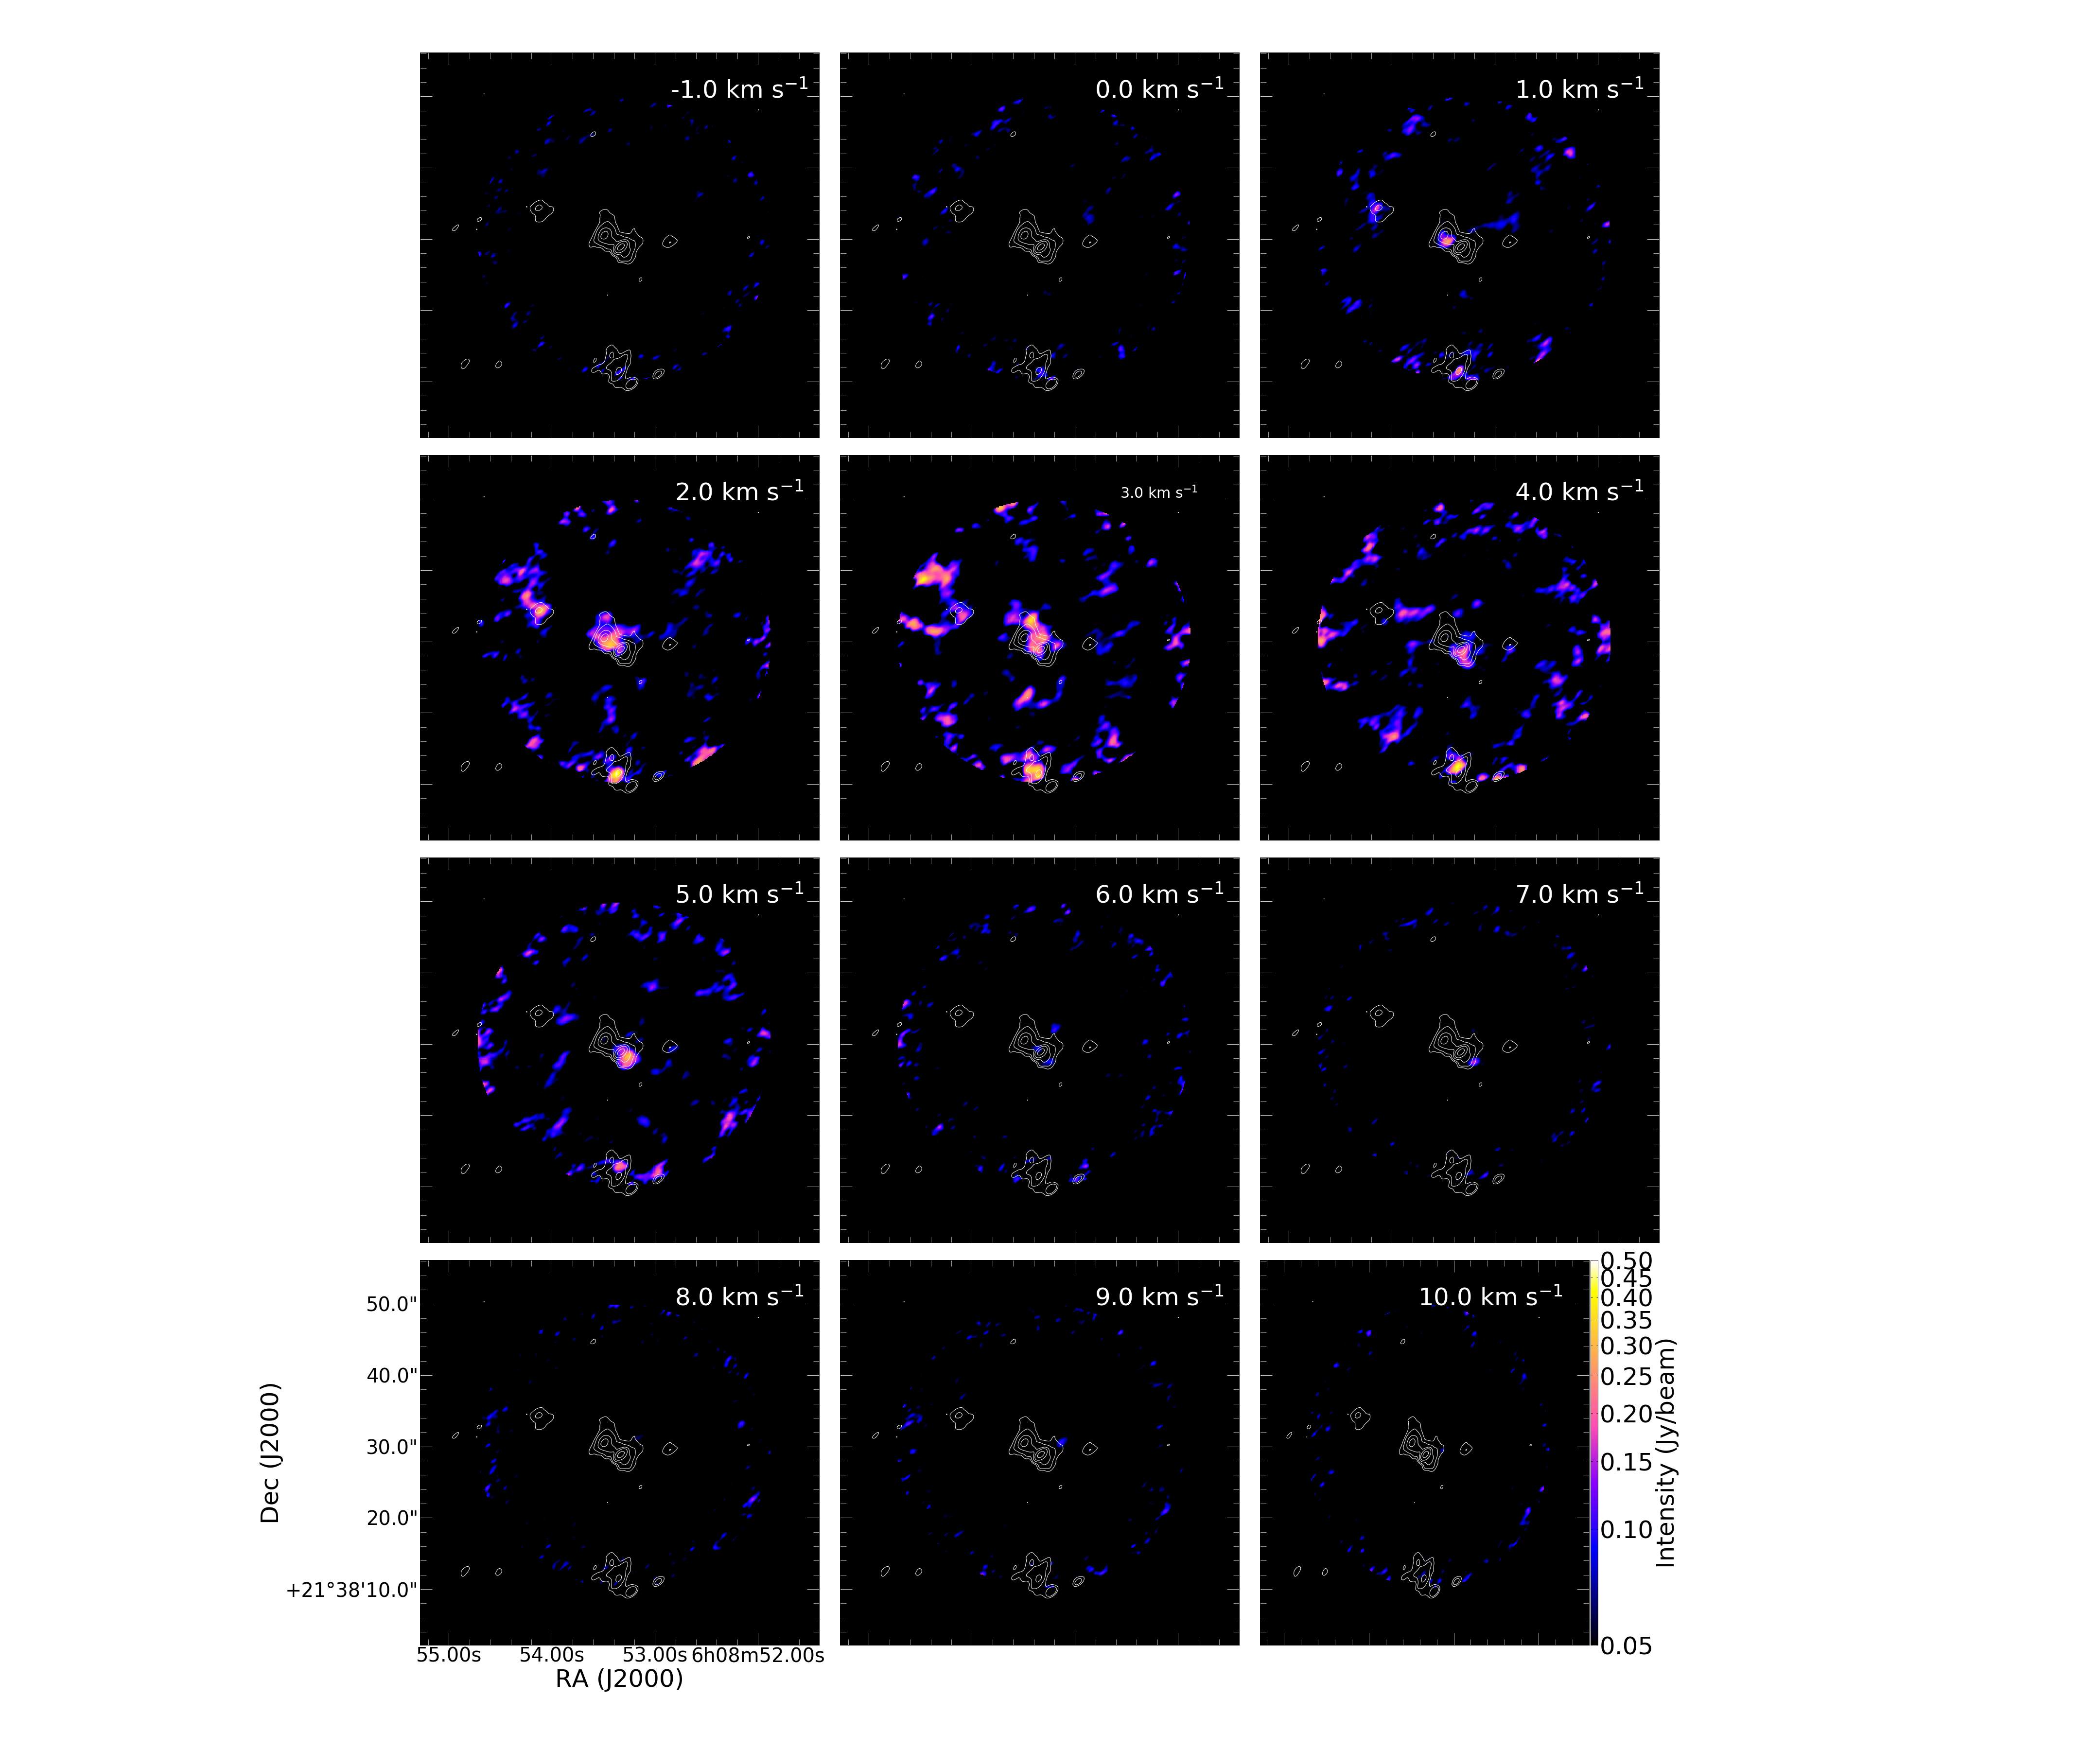
12CO ()
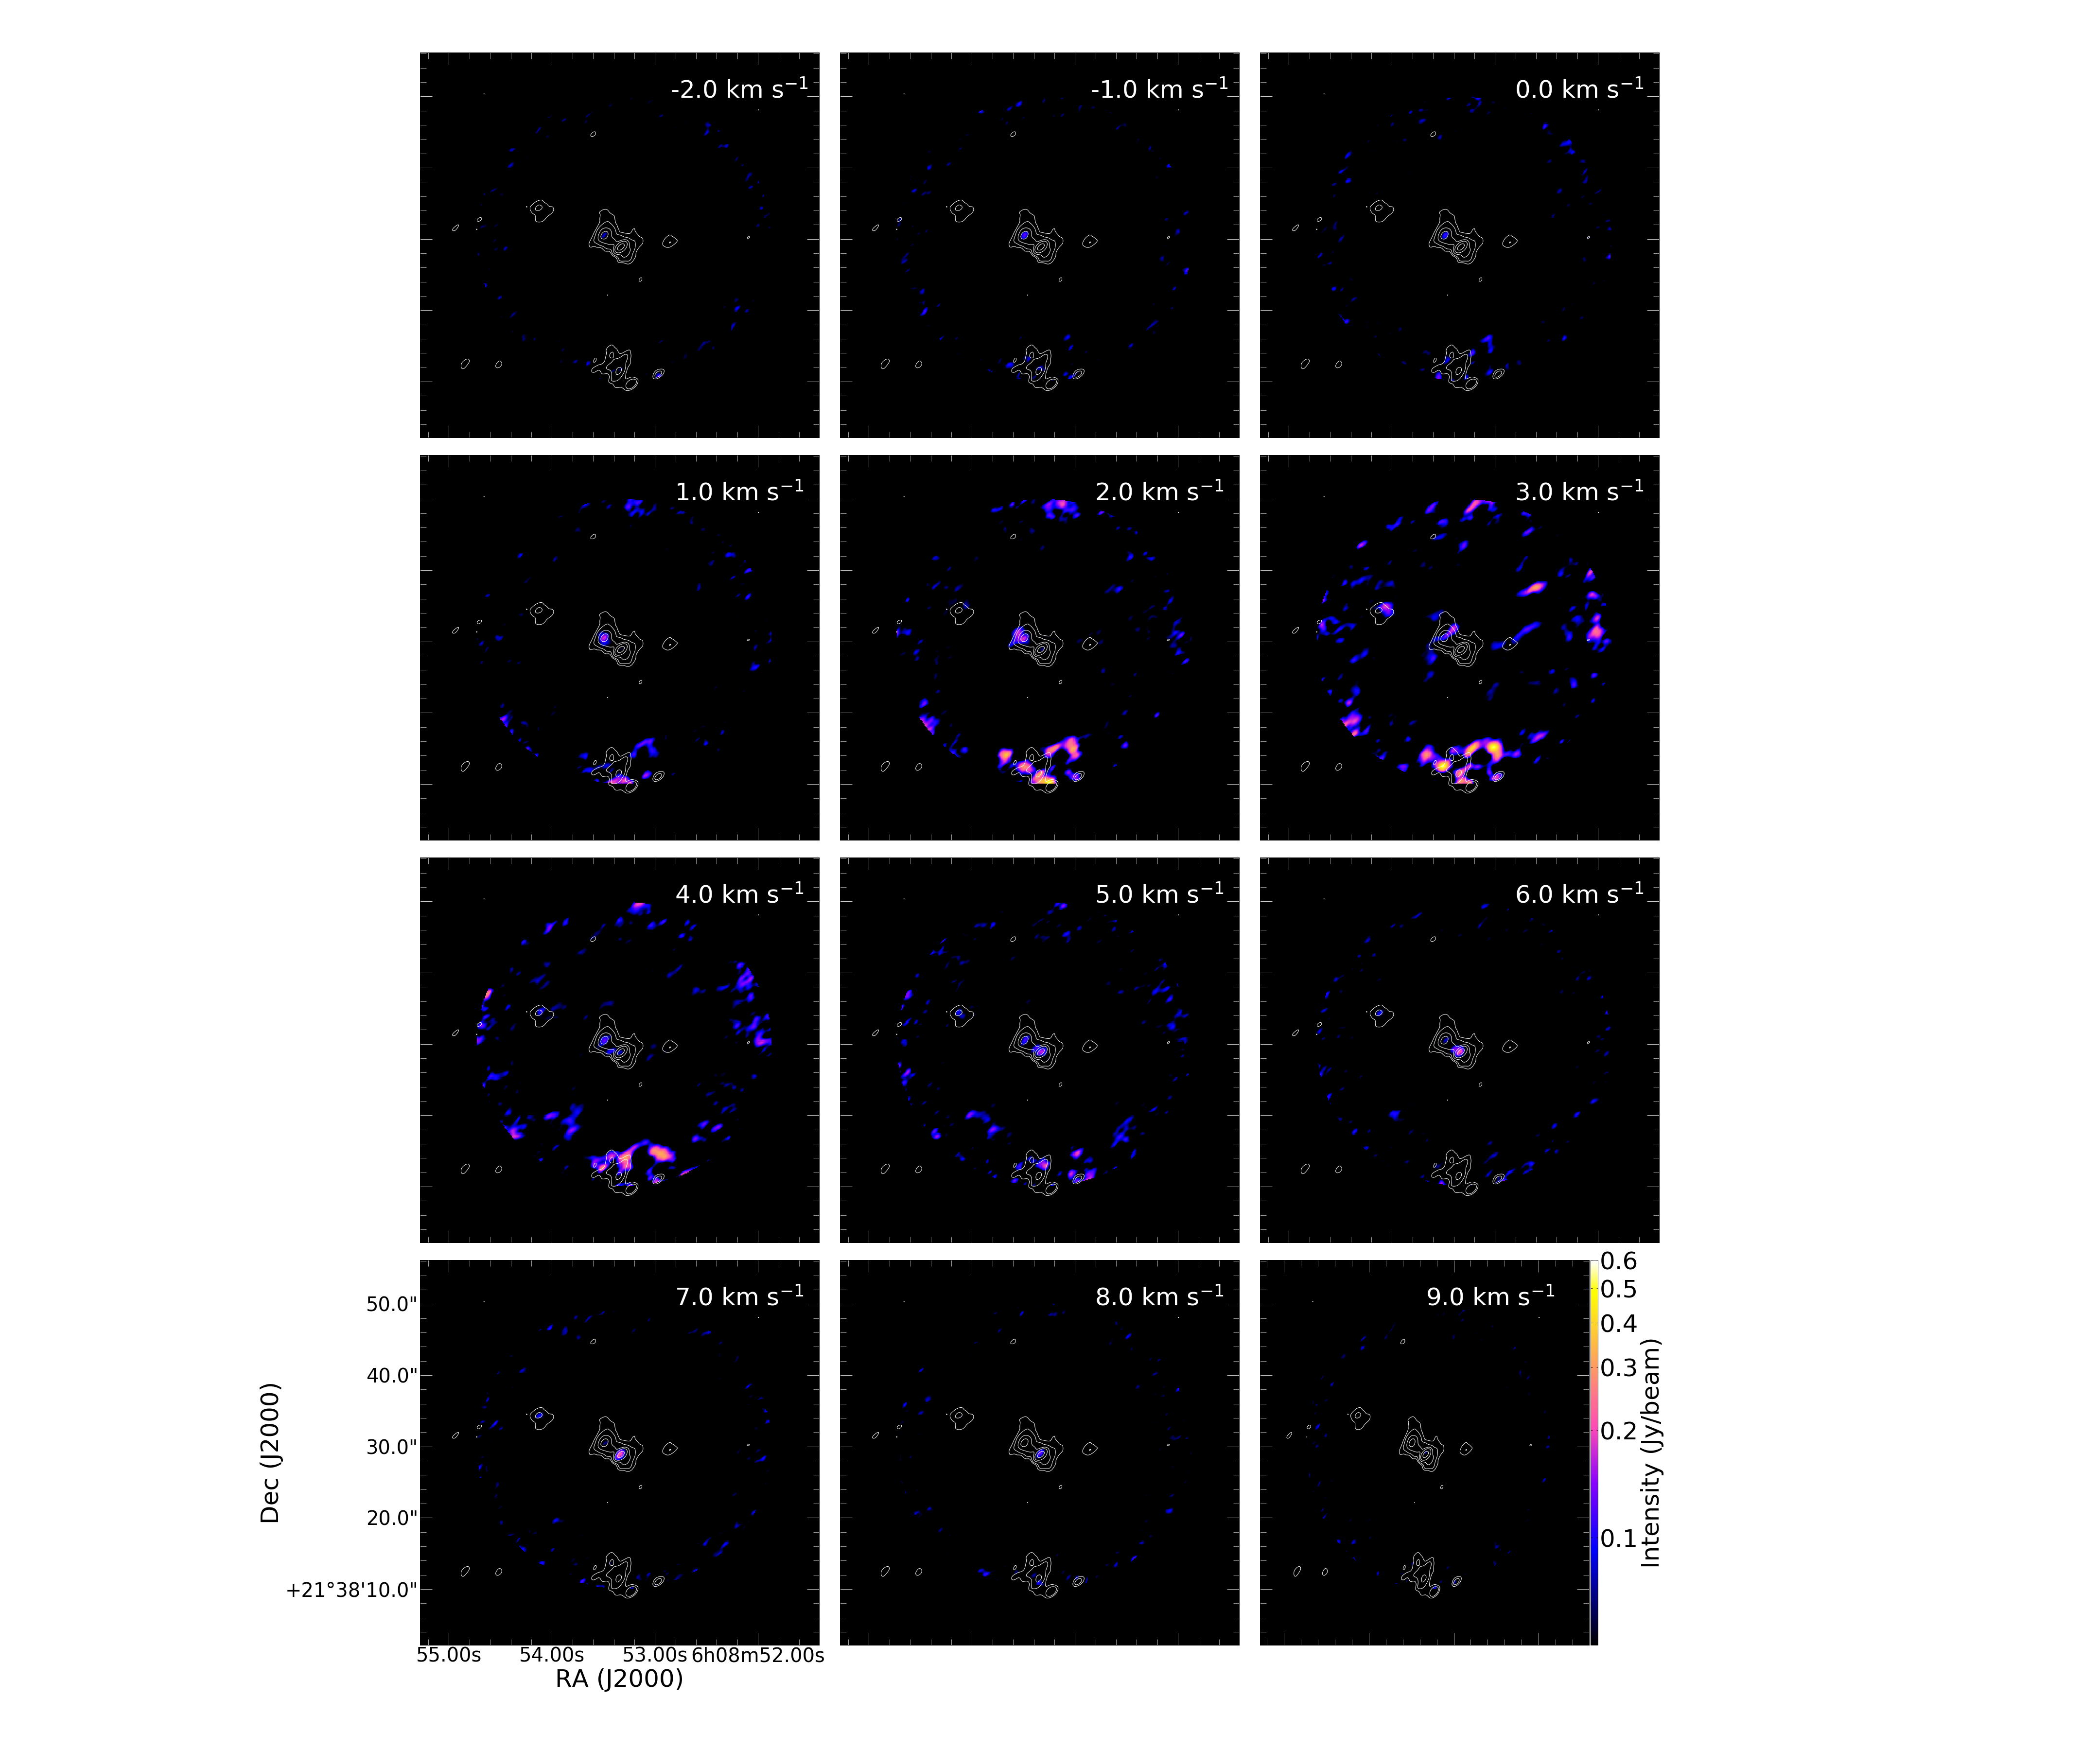
The 12CO () emission in G188.950.89 is complicated owing to the effect of the strongly self-absorbed features seen in the line emission. The other plausible reason for the observed complex distribution is that all the millimeter objects may be driving outflows. If the strong emission east of MM2 observed in the 3 km s-1 channel and the emission west of MM2 in the 9 km s-1 channel are both associated with MM2, then they may demarcate an east-west bipolar outflow in MM2, see Fig. 8. There is also some emission north of MM2 and could signify a second outflow emanating from the object; suggestive of multiple YSOs in MM2. The other mm objects are all associated with 12CO () emission.
C18O ()
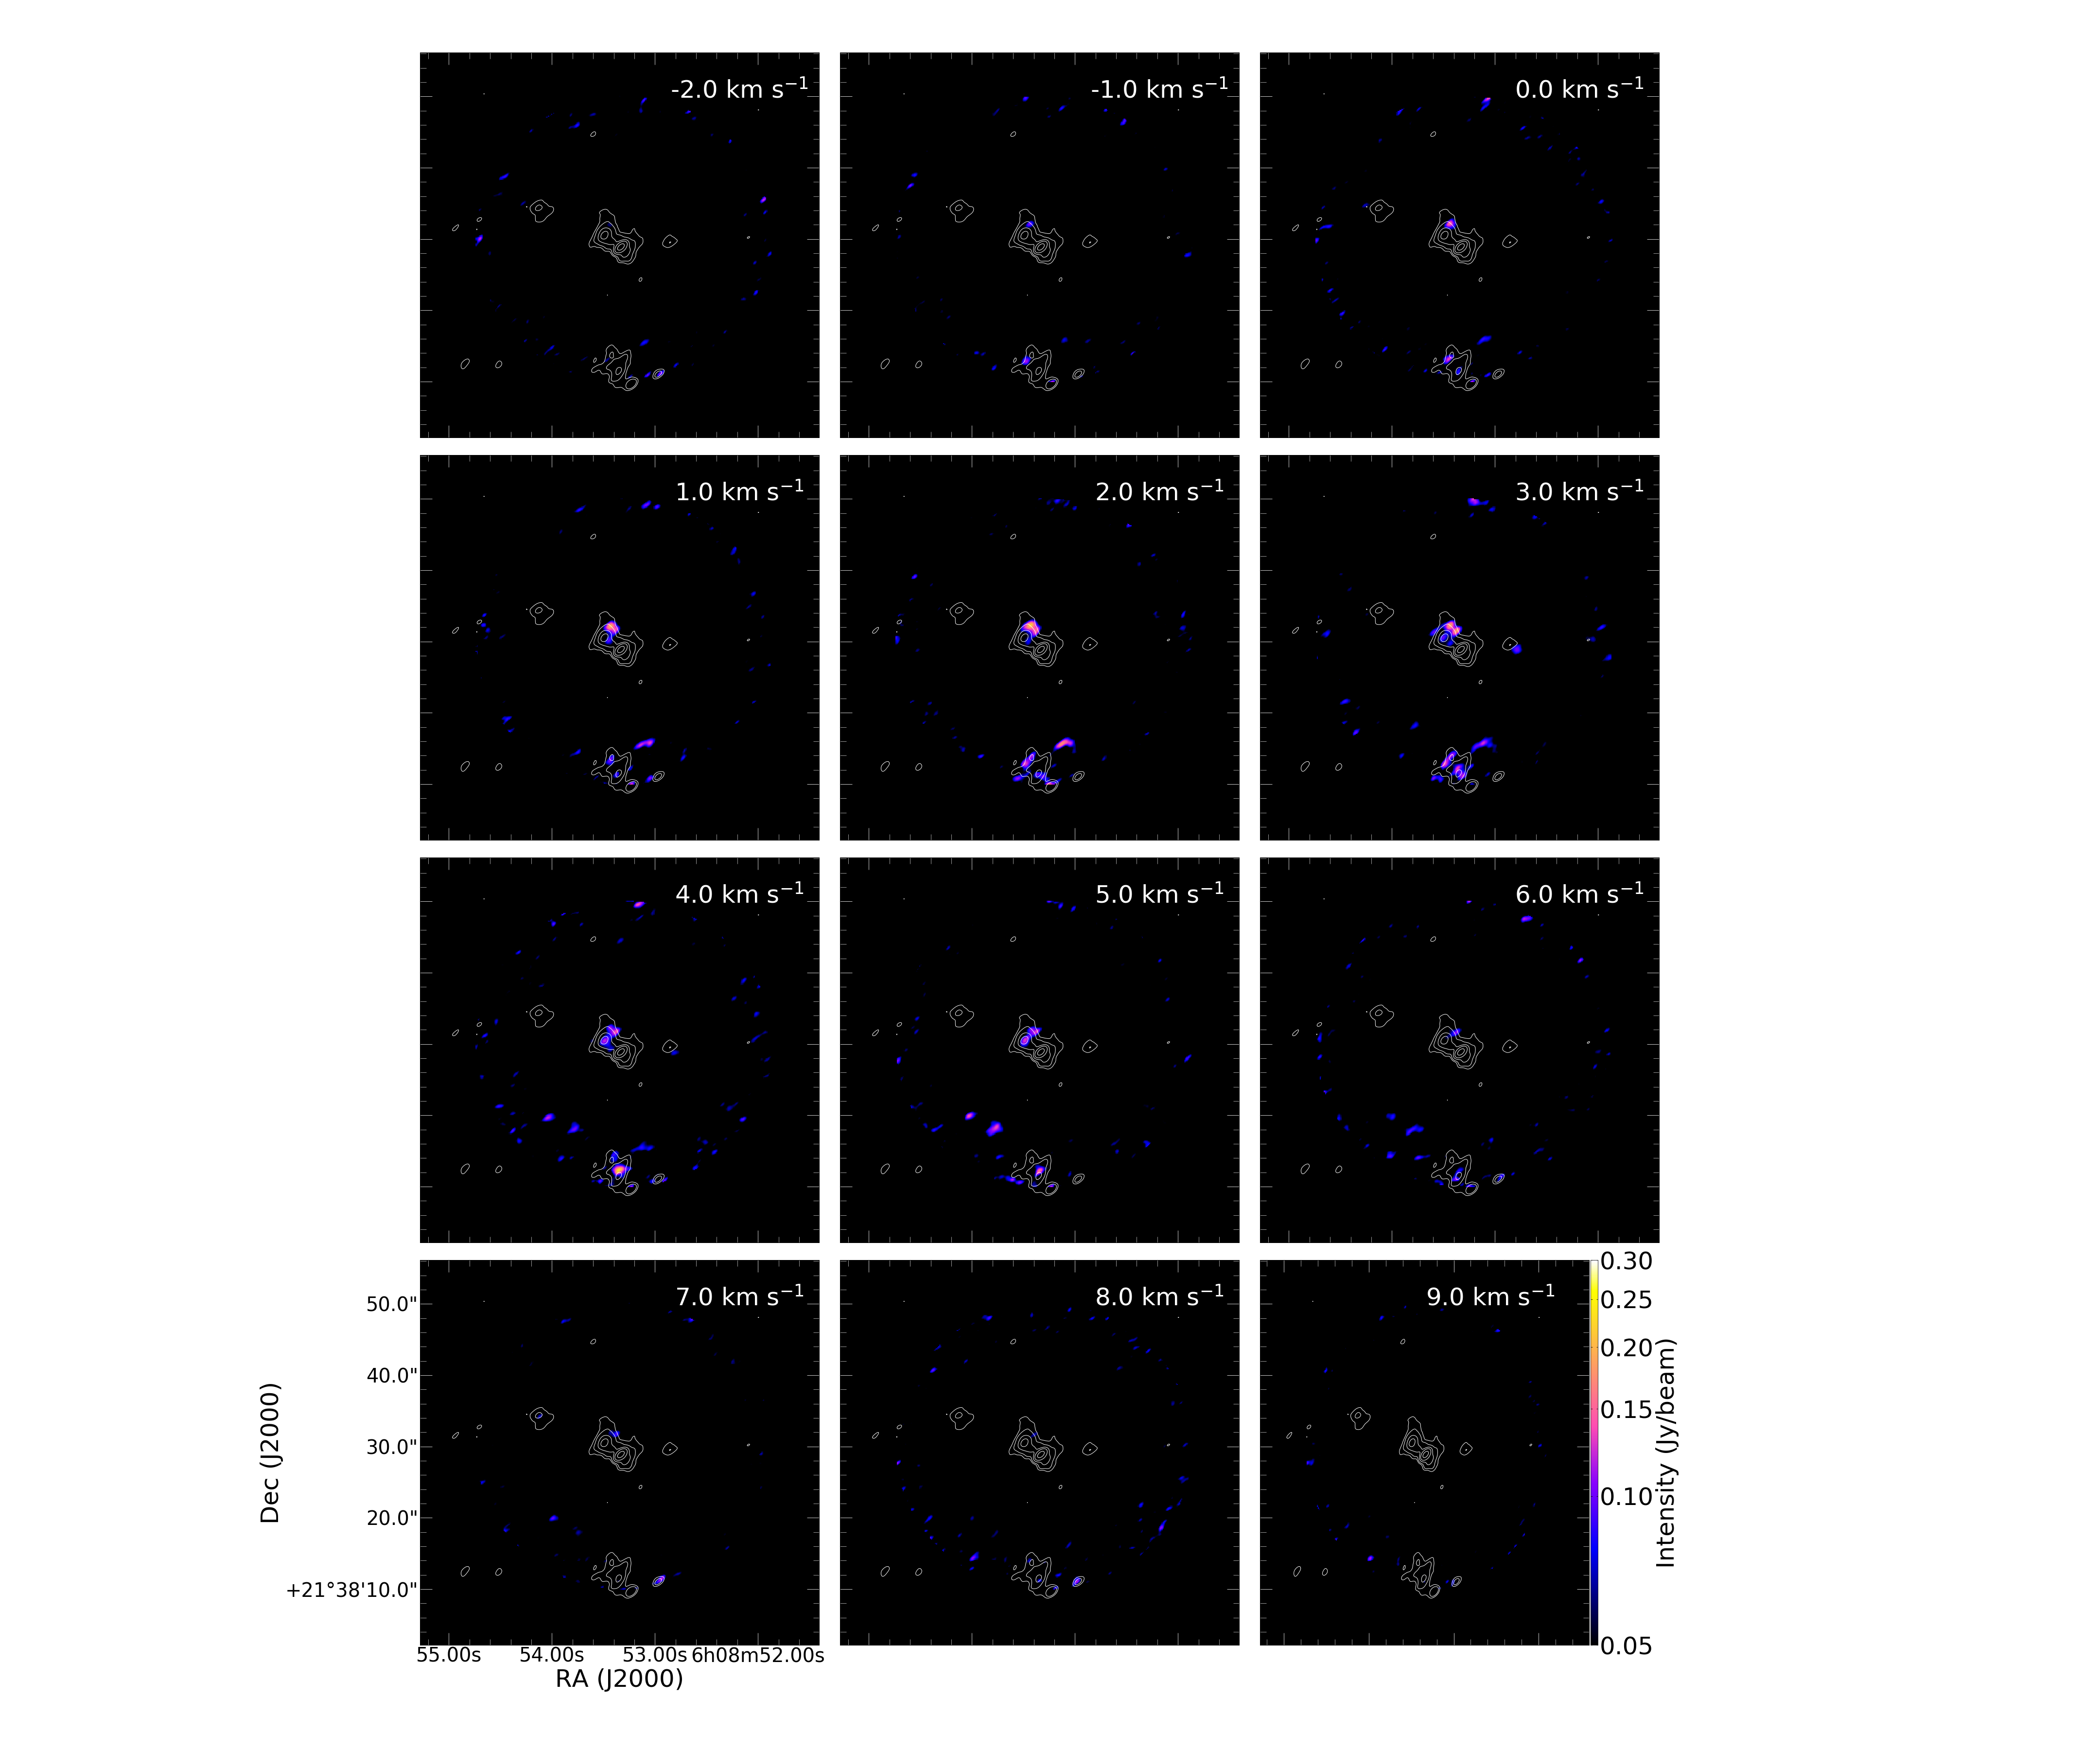
We detected high density tracer, C18O (), towards all MM1–MM8, see Fig. 9. MM1 and MM2 are the dominant sources of the C18O () emission. Interestingly, the brightest C18O () channel (3 km s-1 channel) show a distribution of the C18O () emission to lie in the interface between MM1 and MM2 cores. The possible implication of this to the observed variability in the 6.7 GHz CH3OH masers will be discussed in Section 4.1
4 Discussion
4.1 Implications of the variability in the 6.7 GHz CH3OH Masers
Originally, Goedhart et al. (2004) reported the period of G188.89+0.89 was 416 d; this was revised in Goedhart et al. (2014) to 395 d. Here, using the longer time series and from two separate methods, the shorter period is confirmed ( d and d). Durjasz et al. (2021) also confirm, though observing fewer flare cycles, the shorter period, d.
Class II methanol masers are only found associated with high mass star-forming regions (Minier et al., 2003). Such regions experience accretion events (identified by flaring masers) such as those reported in S255IR-NIRS3 (Fujisawa et al., 2015; Szymczak et al., 2018b), NGC6334I (MacLeod et al., 2018), G323.46-0.08 (Proven-Adzri et al., 2019; MacLeod et al., 2021b), and G358.93-0.03 (Sugiyama et al., 2019; MacLeod et al., 2019). However, three of the features in Table 2 are decaying, in particular the +11.45 km s-1decays exponentially (Fig. 4). Interesting, historical observations suggest the originally detected peak flux density feature, +10.5 km s-1, has varied markedly since detection, less than 500 Jy before 1993 (Menten, 1991; Caswell et al., 1995b), greater than 600 Jy before 2009 (Goedhart et al., 2004; Green et al., 2012) to 500 Jy on average here. Note at present the peak flux density is found at +10.70 km s-1 and not +10.44 km s-1. Caswell et al. (1995b) reported that the feature +11.2 km s-1 decreased slightly from 1991 (250 Menten (1991)) to 1993 (230 Jy). In 1999 August it was only 100 Jy (Szymczak et al., 2000) while reaching a maximum, 160 Jy, in 2001 November (Goedhart et al., 2004); thereafter the exponential decay is reported here. Above Eqn. 1 cannot describe these variations, nor does it fit the maximum reported in Goedhart et al. (2004). It appears a weak flaring event, increasing by a factor of 2.6 in flux density, occurred between 1999 August and 2001 November in the periodic feature at +11.45 km s-1. This decaying periodic feature resembles that shown for decaying periodic maser features in G323.460.08 (MacLeod et al., 2021b). Further analysis of historical data, and data other transitions (.e.g. 12.2 GHz CH3OH and/or 22.2 GHz H2O), are required to confirm.
Spot maps of the 6.7 GHz methanol masers are shown in Minier et al. (2000); Hu et al. (2016); all features reside in a 180180 au box assuming a distance of 1.76 kpc (Oh et al., 2010) about the bright reference feature (+10.33 km s-1). The weakening features reside within 50 au radius of the reference feature, +8.42 km s-1 slightly north while +11.45 km s-1 is slightly south of the reference maser. The strengthening feature (+10.70 km s-1) is found 90 au to the South-East from the reference maser. The non-varying feature, +9.65 km s-1, is further South-East (140 au). Minier et al. (2000) suggest that the masers surrounding the reference maser could be part of an outflow from the disk.
It is not clear whether velocity drifts, including those seen here, are caused by variability of spectrally blended masers (Szymczak et al., 2014) or by motion of the gas (Goddi et al., 2011). The accretion disks surrounding massive star-forming regions may experience infalling gas. Szymczak et al. (2014) report a velocity drifting feature in Cepheus A; they suggest it may be an artifact of variable line-merged features or the result of masers located in regions of infalling gas. MacLeod et al. (2021a) propose the inner radius of the accretion disk surrounding the protostar of G9.62+0.20E is infalling resulting in systematic velocity drifts of its associated methanol masers. However, they also state it may be caused by masers in a precessing disk. Above in Table 2 it can be seen two features experience measurable velocity drift. The blue-shifted feature, +9.65 km s-1 is blue-shifting ( km s-1 d-1) while the other, +11.45 km s-1, is red-shifting ( km s-1 d-1). The drifts are of the order of those seen in G9.62+0.20E (MacLeod et al., 2021a), ranging from 6 to 3 km s-1 d-1. However, an insufficient number of features with measurable velocity drift are found thus rendering any comparison to G9.62+0.20E indeterminate. These two features are found well-separated in the spot maps shown in both Minier et al. (2000); Hu et al. (2016), by 200 au. Perhaps the central features are influenced by an outflow (Minier et al., 2000) and this motion may force the features at the edges to experience velocity drift. Even the now brightest feature, at +10.70 km s-1, is blue-shifting though this may be due only to variations of heavily line-merged features. All of these periodic masers are associated with MM1. More observation and analysis is required to explain these variations.
4.2 Binary System in G188.950.89-MM2
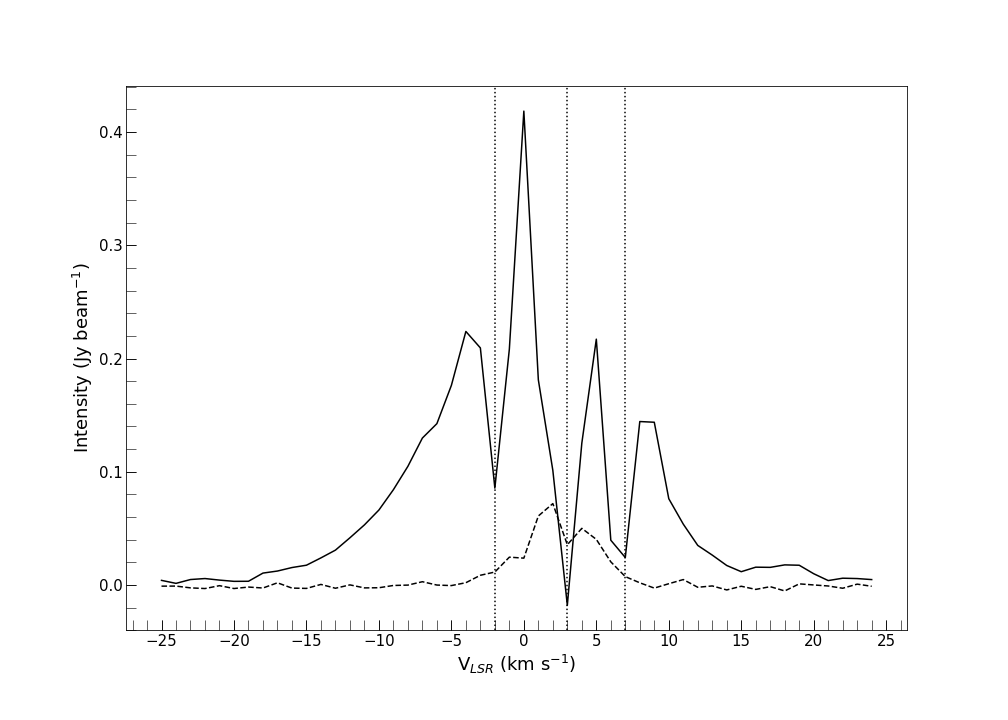
There are a number of indicators suggesting the existence of a binary system in MM2. First, the high-resolution ALMA band 7 dust continuum image resolves MM2 into 2 cores separated by 0.1. Second, the CH3OH (43(1,2)) emission is coincident with the systemic velocity and the spectral profile of emission towards MM2 has two pronounced features (see 3 km s-1 channel of Fig. 6). In Figure 10, the spectra of 12CO (solid lines) and CH3OH (43(1,2)) (dashed line) taken from MM2 using a 4 ellipse are presented. It is important to note the 12CO emission is optically thick. In the 12CO spectra (at least) self-absorption features are visible, implying the 12CO emission is absorbed by cold foreground material in the region. The three vertical dotted line in Figure 10 indicate the prominent absorption feature (middle line at 3 km s-1) and two absorption features (2 and 7 km s-1) one on each side of the prominent feature. We noted that missing flux issue can give rise to such spectral feature but in this case the observed absorption feature is real.. The most prominent absorption feature in the 12CO spectra corresponds in with the CH3OH (43(1,2)) absorption feature separating the 2 resolved cores in MM2. All these observed features suggest multiple (or at least binary) young stellar objects in MM2.
Our suggestion of the presence of at least a binary, or multiple, YSOs in MM2 is supported by the complexity of the orientation of the outflowing gas traced by 12CO, see Fig. 8. An east-west outflow feature with an axis through the peak position of MM2, as well as a north-west and south-east outflow also intersecting with MM2, can be observed. These support the suggestion at least a binary system is present in MM2. High-resolution continuum and line observations will be required test the multiplicity of YSOs in MM2.
5 Conclusion
We presented results of 1.5 decades of monitoring observations of 6.7 GHz CH3OH masers towards G188.950.89 and ALMA band 6 observational results and found the following;
-
1.
G188.950.89 protocluster is resolved into eight 1.3 mm objects (MM1-MM8). MM1 and MM2 are the central objects and MM1 (the brightest dust continuum object) is associated with the periodic 6.7 GHz CH3OH maser source.
-
2.
MM2 hosts more than one YSO, likely a binary system.
-
3.
Strong emission of 12CO at the east and west of MM2 point to the presence of an east-west bipolar outflow in MM2. Emissions north of MM2 also suggest a second outflow emanating from the object, which could signal multiplicity of YSOs in MM2.
-
4.
All five features are periodic, suggesting a common background source of seed photon. The light curve shape of the maser features are similar to those of Mira variable stars and could suggest pulsation of the protostar as the possible driver of the periodicity (Inayoshi et al., 2013).
-
5.
Two CH3OH maser features are reported with measurable velocity drift.
-
6.
Outflows are identified in 12CO (2-1) line emission. While no direct detection of accretion disks was possible with the current observations, the detected outflows suggest the presence of accretion disks in the source. Accretion disk may experience infalling gas and velocity drifts may be due to an artifact of variable line-merged features or by infalling gas.
Acknowledgements
MMM acknowledge the support of The Technical University of Kenya, NRF-South Africa, HartRAO-South Africa and the Newton Fund. This paper makes use of the following ALMA data: ADS/JAO.ALMA 2015.101454.S. ALMA is a partnership of ESO (representing its member states), NSF (USA) and NINS (Japan), together with NRC (Canada) , MOST and ASIAA (Taiwan), and KASI (Republic of Korea), in cooperation with the Republic of Chile. The Joint ALMA Observatory is operated by ESO, AUI/NRAO and NAOJ. This publication makes use of data products from the Wide-field Infrared Survey Explorer, which is a joint project of the University of California, Los Angeles, and the Jet Propulsion Laboratory/California Institute of Technology, funded by the National Aeronautics and Space Administration.
data availability
-
•
This paper makes use of the following ALMA data: ADS/JAO.ALMA 2015.101454.S. and can be accessed on the ALMA Science portal.
-
•
This publication makes use of data products HartRAO 26m maser monitoring project and will be made available on a reasonable request.
-
•
The WISE data used in this publication can be access on the IRSA public data archive.
References
- Araya et al. (2010) Araya E. D., Hofner P., Goss W. M., Kurtz S., Richards A. M. S., Linz H., Olmi L., Sewiło M., 2010, ApJ, 717, L133
- Breen et al. (2013) Breen S. L., Ellingsen S. P., Contreras Y., Green J. A., Caswell J. L., Stevens J. B., Dawson J. R., Voronkov M. A., 2013, MNRAS, 435, 524
- Breen et al. (2019) Breen S. L., Sobolev A. M., Kaczmarek J. F., Ellingsen S. P., McCarthy T. P., Voronkov M. A., 2019, ApJ, 876, L25
- Burns et al. (2020) Burns R. A., et al., 2020, Nature Astronomy, 4, 506
- Caratti o Garatti et al. (2017) Caratti o Garatti A., et al., 2017, Nature Physics, 13, 276
- Caswell (1996) Caswell J. L., 1996, MNRAS, 279, 79
- Caswell et al. (1995a) Caswell J. L., Vaile R. A., Ellingsen S. P., 1995a, Publ. Astron. Soc. Australia, 12, 37
- Caswell et al. (1995b) Caswell J. L., Vaile R. A., Ellingsen S. P., Whiteoak J. B., Norris R. P., 1995b, MNRAS, 272, 96
- Durjasz et al. (2021) Durjasz M., Szymczak M., Wolak P., Bartkiewicz A., 2021, A&A, 648, A118
- Fujisawa et al. (2014) Fujisawa K., et al., 2014, PASJ, 66, 78
- Fujisawa et al. (2015) Fujisawa K., Yonekura Y., Sugiyama K., Horiuchi H., Hayashi T., Hachisuka K., Matsumoto N., Niinuma K., 2015, The Astronomer’s Telegram, 8286, 1
- Gaylard (2010) Gaylard M. J., 2010, Monthly Notes of the Astronomical Society of South Africa, 69, 168
- Goddi et al. (2011) Goddi C., Moscadelli L., Sanna A., 2011, A&A, 535, L8
- Goedhart et al. (2003) Goedhart S., Gaylard M. J., van der Walt D. J., 2003, MNRAS, 339, L33
- Goedhart et al. (2004) Goedhart S., Gaylard M. J., van der Walt D. J., 2004, MNRAS, 355, 553
- Goedhart et al. (2009) Goedhart S., Langa M. C., Gaylard M. J., Van Der Walt D. J., 2009, MNRAS, 398, 995
- Goedhart et al. (2014) Goedhart S., Maswanganye J. P., Gaylard M. J., van der Walt D. J., 2014, MNRAS, 437, 1808
- Green et al. (2012) Green J. A., et al., 2012, MNRAS, 420, 3108
- Hildebrand (1983) Hildebrand R. H., 1983, Quarterly Journal of the royal astronomical Society, 24, 267
- Hu et al. (2016) Hu B., Menten K. M., Wu Y., Bartkiewicz A., Rygl K., Reid M. J., Urquhart J. S., Zheng X., 2016, ApJ, 833, 18
- Hunter et al. (2017) Hunter T. R., et al., 2017, ApJ, 837, L29
- Hunter et al. (2018) Hunter T. R., et al., 2018, in American Astronomical Society Meeting Abstracts# 231. pp 342–21
- Inayoshi et al. (2013) Inayoshi K., Sugiyama K., Hosokawa T., Motogi K., Tanaka K. E. I., 2013, The Astrophysical Journal, 769, L20
- Kurtz et al. (2000) Kurtz S., Cesaroni R., Churchwell E., Hofner P., Walmsley C. M., 2000, in Mannings V., Boss A. P., Russell S. S., eds, Protostars and Planets IV. pp 299–326
- Lenz & Breger (2004) Lenz P., Breger M., 2004, Proceedings of the International Astronomical Union, 2004, 786
- MacLeod et al. (2018) MacLeod G. C., et al., 2018, MNRAS, 478, 1077
- MacLeod et al. (2019) MacLeod G. C., et al., 2019, MNRAS, 489, 3981
- MacLeod et al. (2021a) MacLeod G. C., Chibueze J. O., Sanna A., Paulsen J. D., Houde M., van den Heever S. P., Goedhart S., 2021a, MNRAS, 500, 3425
- MacLeod et al. (2021b) MacLeod G. C., Smits D. P., Green J. A., van den Heever S. P., 2021b, MNRAS, 502, 5658
- Maswanganye et al. (2015) Maswanganye J. P., Gaylard M. J., Goedhart S., Walt D. J. v. d., Booth R. S., 2015, MNRAS, 446, 2730
- Maswanganye et al. (2016) Maswanganye J. P., van der Walt D. J., Goedhart S., Gaylard M. J., 2016, MNRAS, 456, 4335
- Menten (1991) Menten K. M., 1991, ApJ, 380, L75
- Minier et al. (2000) Minier V., Booth R. S., Conway J. E., 2000, A&A, 362, 1093
- Minier et al. (2003) Minier V., Ellingsen S. P., Norris R. P., Booth R. S., 2003, A&A, 403, 1095
- Minier et al. (2005) Minier V., Burton M. G., Hill T., Pestalozzi M. R., Purcell C. R., Garay G., Walsh A. J., Longmore S., 2005, A&A, 429, 945
- Motte et al. (2018) Motte F., Bontemps S., Louvet F., 2018, ARA&A, 56, 41
- Oh et al. (2010) Oh C. S., Kobayashi H., Honma M., Hirota T., Sato K., Ueno Y., 2010, PASJ, 62, 101
- Olech et al. (2020) Olech M., Szymczak M., Wolak P., Gérard E., Bartkiewicz A., 2020, A&A, 634, A41
- Ott et al. (1994) Ott M., Witzel A., Quirrenbach A., Krichbaum T. P., Standke K. J., Schalinski C. J., Hummel C. A., 1994, A&A, 284, 331
- Proven-Adzri et al. (2019) Proven-Adzri E., MacLeod G. C., Heever S. P. v. d., Hoare M. G., Kuditcher A., Goedhart S., 2019, MNRAS, 487, 2407
- Reid et al. (2009) Reid M. J., Menten K. M., Brunthaler A., Zheng X. W., Moscadelli L., Xu Y., 2009, ApJ, 693, 397
- Scargle (1982) Scargle J. D., 1982, ApJ, 263, 835
- Sugiyama et al. (2015) Sugiyama K., et al., 2015, Publication of Korean Astronomical Society, 30, 129
- Sugiyama et al. (2017) Sugiyama K., et al., 2017, PASJ, 69, 59
- Sugiyama et al. (2019) Sugiyama K., Saito Y., Yonekura Y., Momose M., 2019, The Astronomer’s Telegram, 12446, 1
- Szymczak et al. (2000) Szymczak M., Hrynek G., Kus A. J., 2000, A&AS, 143, 269
- Szymczak et al. (2011) Szymczak M., Wolak P., Bartkiewicz A., van Langevelde H. J., 2011, A&A, 531, L3
- Szymczak et al. (2014) Szymczak M., Wolak P., Bartkiewicz A., 2014, MNRAS, 439, 407
- Szymczak et al. (2015) Szymczak M., Wolak P., Bartkiewicz A., 2015, MNRAS, 448, 2284
- Szymczak et al. (2016) Szymczak M., Olech M., Wolak P., Bartkiewicz A., Gawroński M., 2016, MNRAS, 459, L56
- Szymczak et al. (2018a) Szymczak M., Olech M., Sarniak R., Wolak P., Bartkiewicz A., 2018a, MNRAS, 474, 219
- Szymczak et al. (2018b) Szymczak M., Olech M., Wolak P., Gérard E., Bartkiewicz A., 2018b, A&A, 617, A80
- Weingartner & Draine (2001) Weingartner J. C., Draine B., 2001, The Astrophysical Journal, 548, 296