Modeling mechanochemical pattern formation in elastic sheets of biological matter
Abstract
Inspired by active shape morphing in developing tissues and biomaterials, we investigate two generic mechanochemical models where the deformations of a thin elastic sheet are driven by, and in turn affect, the concentration gradients of a chemical signal. We develop numerical methods to study the coupled elastic deformations and chemical concentration kinetics, and illustrate with computations the formation of different patterns depending on shell thickness, strength of mechanochemical coupling and diffusivity. In the first model, the sheet curvature governs the production of a contractility inhibitor and depending on the threshold in the coupling, qualitatively different patterns occur. The second model is based on the stress–dependent activity of myosin motors, and demonstrates how the concentration distribution patterns of molecular motors are affected by the long-range deformations generated by them. Since the propagation of mechanical deformations is typically faster than chemical kinetics (of molecular motors or signaling agents that affect motors), we describe in detail and implement a numerical method based on separation of timescales to effectively simulate such systems. We show that mechanochemical coupling leads to long-range propagation of patterns in disparate systems through elastic instabilities even without the diffusive or advective transport of the chemicals.
I Introduction
Biological systems are inherently mechanochemical from the molecular to the tissue scale. Morphogenetic processes during embryo development involve coordinated cell and tissue shape changes driven by mechanical forces actively generated in the cell’s cytoskeleton lecuit_07 . These are in turn patterned by spatial gradients in concentration of molecules including myosin molecular motors goldstein_10 . The chemical signals, such as molecular motors (or signaling factors upstream of motors that influence their contractile activity), are in principle also affected by mechanical forces labousse , resulting in mechanochemical pattern formation during tissue development howard_11 .
Myosins constitute a superfamily of molecular motors that undergo cyclic enzymatic reactions via ATP hydrolysis and generate sliding motion of actin filaments in the cell cytoskeleton howard . They thus transduce chemical free energy into active mechanical forces, and form the fundamental force generation machinery of animal cells that is responsible for a variety of cell functions ranging from muscle contraction, cell motility and cell division gardel_15 to coordinated cell and tissue shape changes during morphogenesis lecuit2011force . Myosin, like many other molecules involved in cellular force generation and transmission, is “mechanosensitive” in that its favored conformations can be modified by the exertion of mechanical force greenberg_16 . Single molecule experiments have shown that the actin-myosin bond has catch bond behavior, that is the attachment time of the bound myosin increases on application of forces Guo2006 . A response of biomolecules to mechanical forces can change the generation and transmission of forces by the cells. This can lead to mechanochemical feedback loops that play a key role in many cellular, including morphogenetic, processes Hannezo2019 . The integration of such molecular signaling and subcellular processes with larger scale cell and tissue mechanics therefore remains an ongoing area of research in mechanobiology Jansen2015 . Given the number and complexity of mechanosensitive biochemical signaling pathways and their inter–dependent nature, theoretical models built on general principles that predict pattern formation based on simple couplings of chemical kinetics with continuum mechanics are desirable and can open the path to future experimental tests dasbiswas_16 ; Recho2019 .
Inspired by the shape changes of epithelial tissue sheets gilmour_17 as well as of sheets of reconstituted cytoskeletal gel ideses_18 by spatial gradients of myosin-generated contractile forces, we consider the coupling of elastic deformations and chemical gradients in slender bodies. Thin elastic plates and shells constitute a fundamental class of soft matter that exhibit sensitive response to stimuli changes because of the geometric nonlinearity of their mechanical properties Holmes2019 . The resultant shapes of such material systems in response to a chemical signal zakharov2017textures or internal active forces (such as those generated by myosin molecular motors senoussi_19 ) constitute a framework of ideas useful and important to material science and bioengineering.
In the following, we describe a numerical procedure that captures shape changes coupled with chemical kinetics and illustrate the efficacy of the procedure by calculating the evolution of patterns in shape and chemical concentration in two distinct systems: one motivated by the coupling of morphogen gradients to tissue curvature hobmayer2000wnt ; brinkmann2018post , and the other based on the mechanical force-dependent binding of myosin motors to actin fibers Guo2006 . Our numerical procedure enables calculation of large elastic deformations in conjunction with chemical concentration evolution. The latter typically entails the solution of chemical rate kinetics in the form of differential equations on a curved surface. Our method can also describe separate time scales in the elastic relaxation and chemical kinetics. We illustrate this numerical scheme by applying it two different biologically relevant models.
II Models
We aim to describe the active deformations of elastic thin sheets that constitute a commonly studied class of active and living matter. Examples range from freely suspended epithelial cell monolayers Harris2012 to reconstituted actomyosin gels ideses_18 . A model sheet is generically considered to be a continuum elastic medium with isotropic mechanical properties throughout its thickness, which is assumed to be much smaller compared to the system size in the other two dimensions. This assumption allows us to neglect any dependence of the energy on strains transverse to the sheet. The problem can then be reduced to two dimensions by representing the sheet as a 2D surface embedded in the 3D space. The elastic free energy of a deformed shell is given by contributions from the stretching energy that is proportional to the shell thickness, , and arises due to in-plane extension and compression in the shell, and the bending energy contribution , which accounts for curvature and scales as landau_lifshitz_elasticity . Specifically, the elastic energy of a deformed elastic shell is given by
| (1) |
where are the two-dimensional Lamé coefficients related to the two-dimensional Young’s modulus (or stretch modulus), , and the Poisson’s ratio, . These 2D elastic modulii depend on the material properties of the shell, specifically its stiffness or Young’s modulus, , as well as its thickness, through , while the bending rigidity is given by landau_lifshitz_elasticity . In Eq. 1, the Einstein summation convention for repeated indices gives the trace of the strain tensor. The in-plane strain arises from the stretching of the middle (neutral) surface, whereas is the bending strain arising from out-of-plane deflections from the stress-free configuration. We will assume the planar configuration to be stress-free so that bending energy vanishes when .
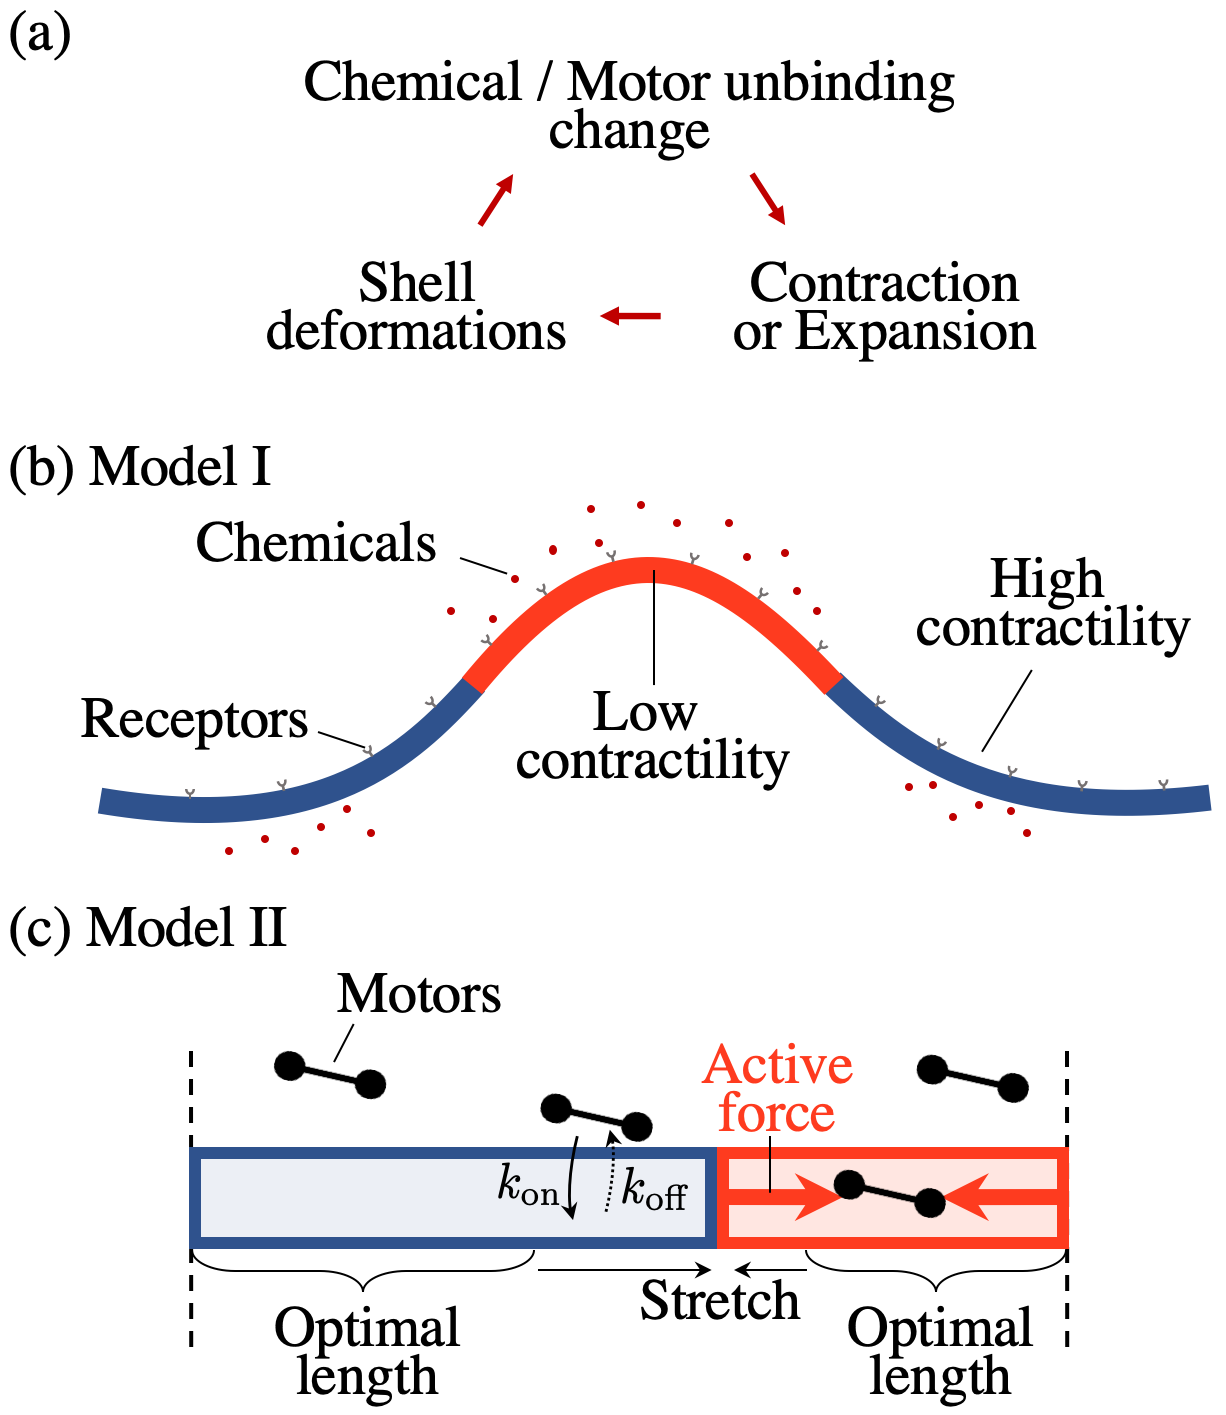
Since thickness is small compared to the shell size in the model shells we consider, a comparison of the stretching and bending rigidities shows that in general a compressed conformation is less favorable than a bent one, except in regions with very high localized curvature. Deformations in thin sheets and particularly buckling occur due to compressive stresses that can be generated by different sources Li2012 . In this study, we consider two biologically motivated models with inhomogeneous in-plane stresses of different sign. In the first model (Model I), stress arises due to a chemical signal that induces a local expansion of the sheet according to its concentration. In the second model (Model II), stress is generated by molecular motors and leads to a local contraction. Additionally, we assume plausible mechanochemical feedback (Fig.1a) in either case, that leads to propagating pattern dynamics that ultimately reach stationary shapes at mechanical equilibrium and chemical steady state. We also assume that over the short timescales of interest, the mechanical response of the sheet to induced stresses is elastic and ignore the viscous remodeling of the tissue or gel Matoz-Fernandez2020 .
The variation of Eq. 1 results in the Föppl-von Kármán equations which lack analytic solutions except in some one-dimensional cases and require scaling arguments or numerics to make progress Cerda2003 . The elastic energy landscape of Eq. 1 can be complex because of the many possible deformation modes and finding the mechanical equilibrium state corresponding to a prescribed pattern of in-plane stresses can therefore be computationally challenging. Thus, a suitable method that can handle such under–determined systems is necessary.
II.1 Expansion and Curvature feedback model
Motivated by tissue patterning via spatial gradients of morphogens, diffusible biomolecules that induce gene expression during morphogenesis wolpert_69 , we consider the interplay of a diffusing chemical signal with mechanical deformations okuda2018combining ; mercker2013mechanochemical ; mietke2019self ; yoshida2010self ; zakharov2020mechanochemical ; li2021chemically . In analogy with but to distinguish from morphogens that trigger slow genetic changes, we term these chemical signals “mechanogens” since they are expected to cause faster mechanical changes by affecting motor activity or cytoskeletal remodeling dasbiswas_16 ; dasbiswas_18 ; zakharov2020mechanochemical . In this model, the in-plane stretching stress arises due to chemical-induced local contractility change in the shell (Fig.1b), leading to spatial variations in contractions and expansions. As a consequence, there are domains with optimal surface area different from the undeformed reference state that cause in-plane incompatibility. We assume the contractility strength is non-linearly dependent on the concentration of a chemical signal, . Inspired by morphogen gradients that trigger concentration-dependent sharp transitions in cell state wolpert_69 , the coupling is written as a sigmoid function,
| (2) |
where and define the maximal and minimal values of contractility strength, respectively, defines the slope and width of the transitional zone, and is the concentration threshold at which . Thus, at small the contractility strength has the higher value of , whereas it decreases with increasing and saturates to corresponding to a local expansion of the shell.
To close the mechanochemical feedback loop, we assume that the production of chemicals is coupled to the local curvature of the shell whereas degradation is linear in the local concentration . Other types of feedback from the mechanical stresses and shell shape are possible, but we focus on a specific model as proof-of-concept that such a feedback can lead to pattern formation. In order to drive pattern formation via this expansion-curvature feedback and to avoid oscillations, we assume specifically that the production of signals occurs only for positive, i.e., upward curvature of the shell and not for negative (downward) curvature. A biologically plausible mechanism for this choice is illustrated in Fig. 1b. This is based on the apicobasal polarity of epithelial cells which distinguishes the upper and lower surfaces of cells harris2005positioning . These can be chemically distinct with specific receptors localized either to the apical or basal surface. Motivated by recent experiments shyer2015bending , we also assume stretch-activated release of chemical signals which may happen through various biophysical mechanisms, for example, by opening gaps between cells in an epithelium thereby increasing the interstitial flow Helm15779 . Now if chemical receptors are located on the apical surface only (a manifestation of apicobasal polarity), only the chemicals released by positive curvature are effective in producing tissue shape change. The chemicals are also allowed to diffuse in the surrounding media to spread out the signal. For simplicity, we assume diffusion in a thin fluid film along the upper surface of the shell. Thus, chemical signal dynamics is given by
| (3) |
where is the diffusion coefficient, is the mean curvature with the Heaviside function , when the curvature radius is oriented upward () and when downward (); is a characteristic curvature that defines the chemical production saturation level , and is the degradation rate. The maximum local steady state concentration is then given by .
In general, the degradation rate can also depend on curvature or stress and provide additional independent mechanochemical feedback loops. However, in this study we focus on a minimal positive feedback that leads to pattern formation via long-range deformations.
II.2 Contraction-Tensional feedback model
The actin cytoskeleton is an intensively studied system for its role in driving cell mechanical processes including cell shape change during morphogenesis, as well as its active and adaptive material properties Banerjee2020 . The active contractile forces generated by myosin motors facilitate the organization of actin filaments as well as the spatial self-organization of myosin itself dasbiswas_bershadsky_18 , potentially through mechanosensitive feedback loops. In vitro experiments with purified actin gels embedded with myosin motors Burla2019 are therefore an important system complementary to live tissue. They show a variety of collective phenomena such as active fluids, locally stressed gels, globally contracted gels and coarsening of myosins into clusters Alvarado2017 . The large-scale deformations of gel sheets due to inhomogeneous distribution of motors and the feedback of the stresses on motor distribution, is less studied in comparison, and forms the basis of our second model.
Inspired by recent experiments on the buckling of thin sheets of actin gels ideses_18 , we consider a continuum elastic sheet with contractile stress generated by myosin molecular motors (Fig.1c). The magnitude of force is assumed to be proportional to the local concentration of bound motors, and the active stress is assumed to be isotropic, meaning that contraction takes place equally in all spatial directions. Such contractions can arise microscopically from the active sliding of filaments by motors as well as by compression-induced poroelastic outflows of water leading to gel shrinkage Burla2019 . At the macroscopic level, we are only concerned with the net contraction. Thus, at non-zero motor concentration, the sheet will tend to decrease its reference length to a new optimal length, which leads to a local balance of active and elastic stresses. The latter arise as a response to compression of the elastic sheet and favors recovery of the reference state. If the motor concentration is inhomogeneous and the sheet is constrained, geometrical incompatibility occurs and the actual length will deviate from the optimal length.
On the other hand, the dynamics of molecular motors is determined by their attachment and detachment to the elastic actin gel. The lifetime of myosin motor catch bonds depends sensitively on mechanical stress and is characterized by a decreased detachment rate in the presence of tension from an external force marshall2003direct ; Guo2006 . Then macroscopic stretching of local regions of the sheet, which we define as deviation from the local optimal length resulting from a balance of the active force and the elastic restoring force force from the surrounding material, will lead to an increase in the local concentration of bound motors. Assuming motor redistribution in the solvent by diffusion or advection to be negligible, we can describe the motor dynamics in terms of just the fraction of locally available motors that are bound: . The dynamics of the fraction of bound motors is then given by the constant binding rate and the stress dependent detachment rate as
| (4) |
where depends non-linearly on the isotropic part of the stress, . Here, is the mean detachment rate in absence of forces, and is the detachment rate parameter (an inverse stress that depends on molecular details of the catch bond) used to scale the stress in accordance with Bell’s relation for force-dependent adhesion kinetics bell_78 . Since catch bonds are strengthened under tensionmarshall2003direct , we assume that only stretching, corresponding to positive stress , and not compression, affects the unbinding rate. For simplicity, we focus on the isotropic part of the stress and ignore the possible dependence of motor kinetics on shear stress. The total concentration of available motors in solution is assumed to be uniform, so that only the fraction of bound motors changes in time due to binding and unbinding. The model can be easily extended to include the diffusion of free motors in solution, but here we ignore such slow transport and focus instead on the feedback between the unbinding kinetics and the mechanical stress. In the absence of external forces at steady state, the bound motor fraction saturates to . The contribution of bending stress to the change of detachment rate is assumed to be small.
III Numerical approaches and methods
Even though analytic scaling laws are useful to predict buckling phenomena in plates and identify regions where wrinkling occurs, for example using the Föppl–von Kármán model, many problems that involve large deformations and nonlinear regimes are intractable for analytical treatment and require numerical simulations. Among numerical approaches, the finite difference scheme is the most straightforward method which allows to rewrite the governing equations as a set of algebraic equations that can be solved using, for example, the Newton methods. However, this approach is cumbersome for discretizing arbitrary shapes and is convenient only for relatively simple shapes. For numerical simulations of the generic problem, the most frequently used scheme is the finite element method. It discretizes the equations by dividing the geometry into finite number of elements, for example a triangular tessellation, where each element is used to compute the local solution. A system with variational principle such as Eq. 1 can then be solved by finding the minimum of the functional, i.e. when the total variation is zero.
In this study, we use spatially unstructured finite-element discretizations to simulate the out-of-equilibrium dynamics of a deforming sheet. To obtain numerical solutions for Eqs.(1)–(4), we consider a 2D irregular triangular mesh that is allowed to stretch and bend. The total discrete elastic energy is constituted following the continuum limit Eq. 1 and written as . Deformations of the mesh are associated with changes of the node positions, such that reference maps to a new position . Then the length of the bond between two neighbouring nodes and , which in the reference optimal state is , takes a new value, . Since the simulated sheet has local non-uniformity in contractility/expansion, the active deformations are modeled by changing the reference length to a new optimal length , where is the expansion or contraction factor that depends on the local chemical concentration or the bound motor fraction. Thus, the actual and reference node positions together with , define the local strains as the relative deviation in length . This leads to a discretization of the stretching energy,
| (5) |
The local energy density at a node can be found as a sum over connected bonds . Since the triangular mesh adds stiffness to the model restraining shear, we neglect the area elasticity. This type of discretization corresponds to an unspecified choice of the relative values of the two 2D Lamé coefficients in the corresponding continuum medium, however, it adequately captures the interplay between the bending and stretching constituents in the resulting pattern.
The optimal lengths in the Model I are associated with nonuniform in-plane contractility , which is prescribed by Eq. (2). We assume an inverse proportionality between contractility and the shortened length, and define this by , where is the reference length at the contractility . The concentration, , that determines the optimal length for the edge, , is calculated as the average over values at nodes and , which gives the local contractility strength at this link.
In the Model II for contractile sheets, the optimal lengths of links connecting nodes are computed as , where is the reference length in the undeformed state, is the contractility parameter, and is the fraction of bound motors. Since contraction is isotropic, the motor fraction is stored at nodes and it defines the optimal lengths of all bonds that meet at this node. Then is an average over two nodes sharing the same bond. The macroscopic stretching (the isotropic part of the stress in Eq.4) around a node in the linear elastic regime is calculated as the positive part of the deviation of actual triangle area from the optimal area, , averaged over adjacent triangles.
Since the elastic sheet is thin and allowed to bend, the mesh might have large deviations from the initial planar configuration and, as a consequence, can develop curvature. The bending energy of a triangulated surface is written in a discrete form that is convenient for numeric simulations as
| (6) |
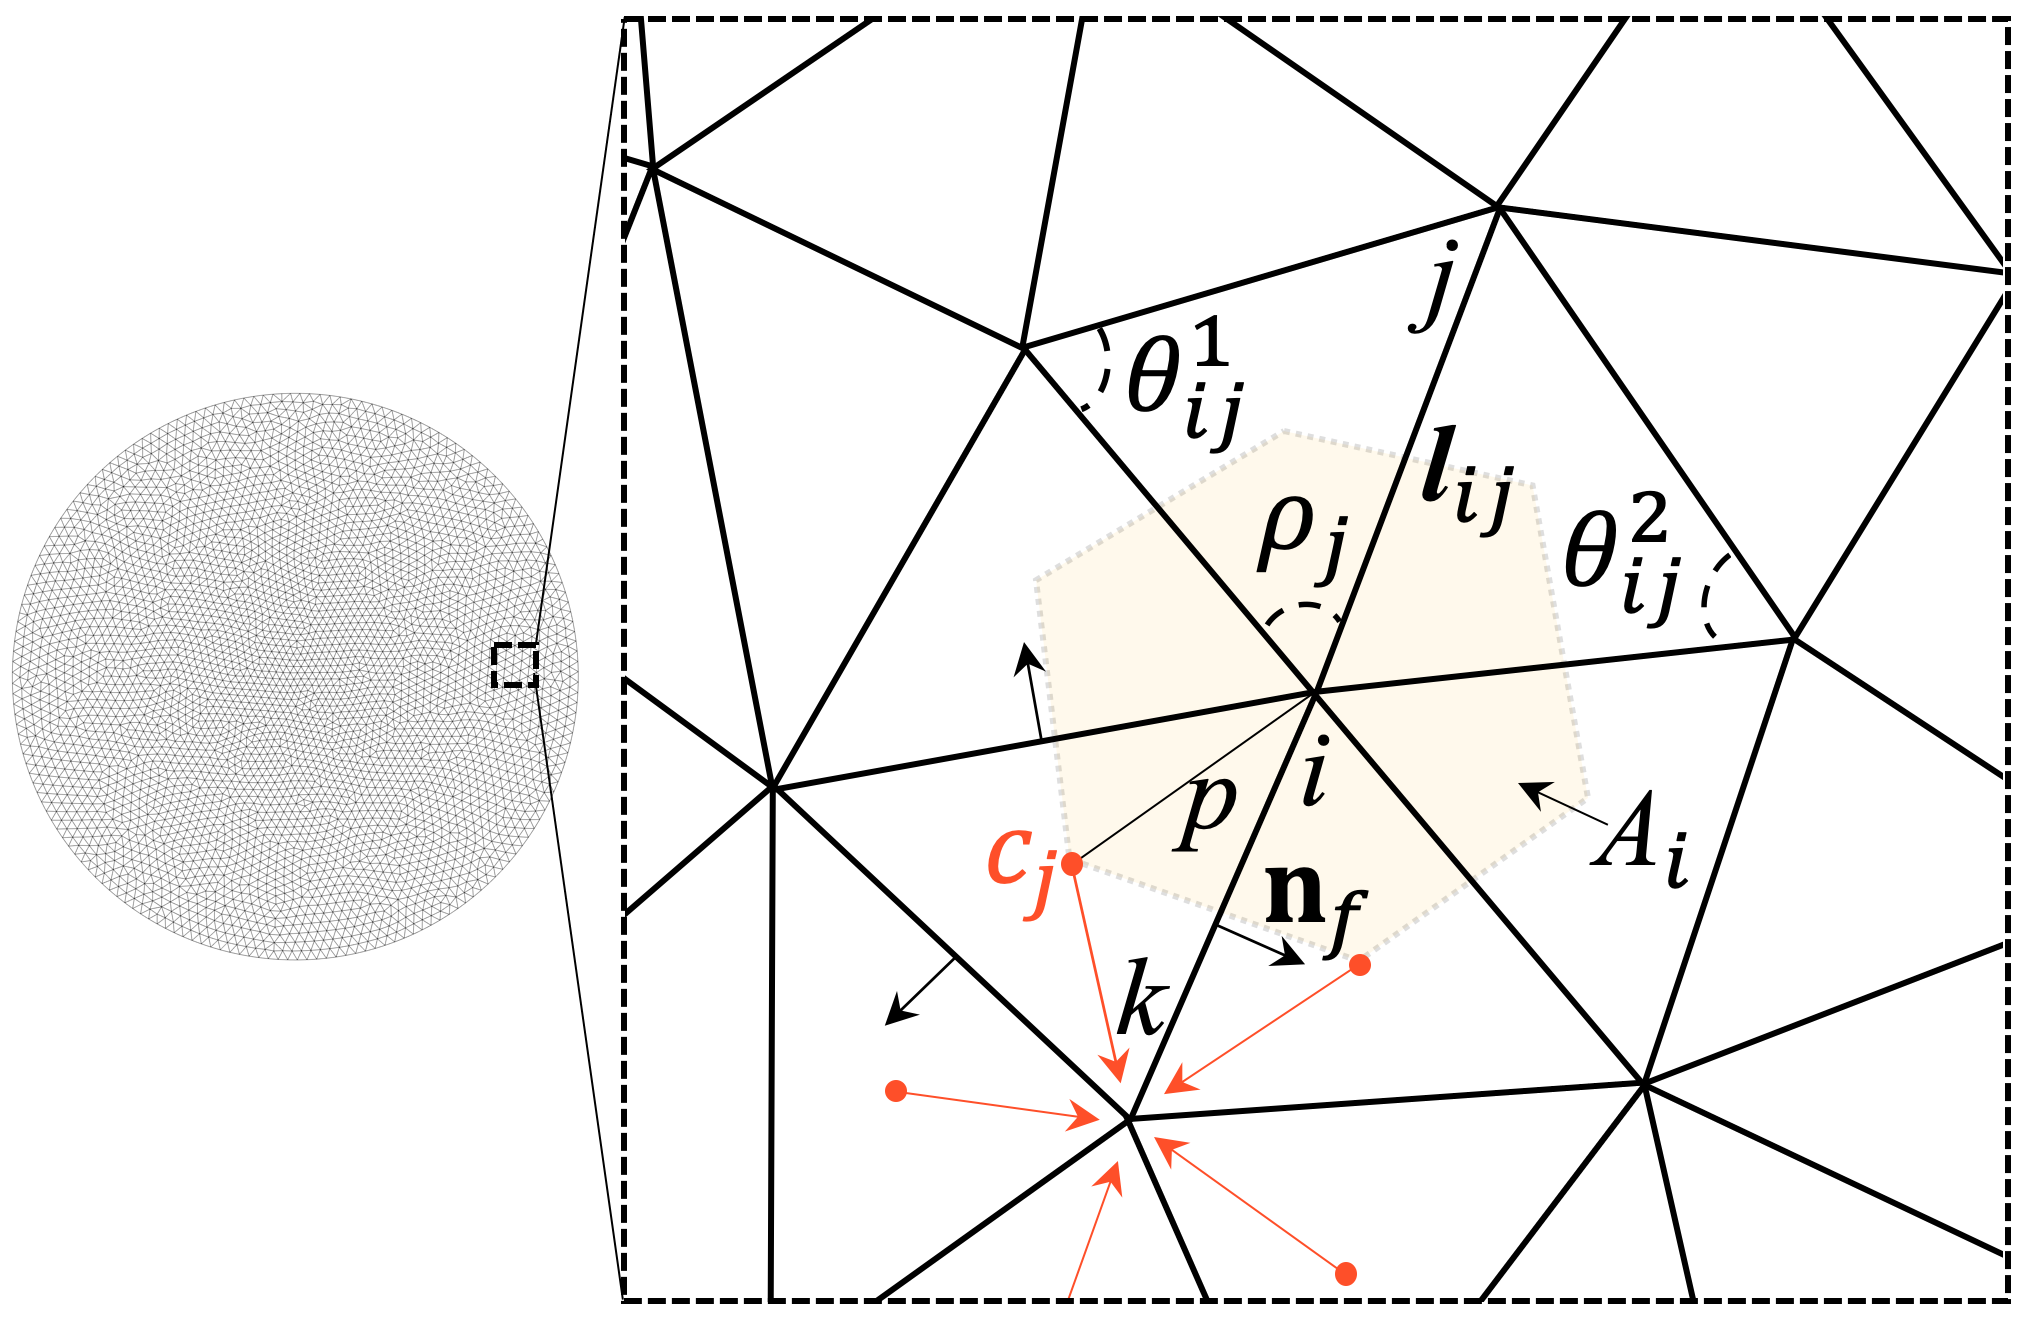
The general approach to compute discretized bending energy in terms of the angles between normals of adjacent triangles gompper1996random is not precise for irregular meshes constituted of triangles with different area and side lengths. We use discretizations for the mean and Gaussian curvatures proposed in meyer2003discrete , which is a good approximation for the analytical solution bian2020bending . On a triangular mesh (Fig.2), the local Gaussian curvature is , which is expressed through the angles between two adjacent bonds . The mean curvature is given by and defined over the adjacent edges, where are the two angles opposite to the edge in the two triangles sharing the edge .
The mid-surface of the sheet is triangulated on an irregular mesh consisting of 20 000 nodes satisfying the Delaunay condition using the freely available mesh generator Distmesh persson2004simple . The mesh evolves to minimize the elastic energy (5,6) arising in response to the changes in concentration profile. The forces due to stretching and bending acting on each node drive the overdamped dynamics , where the friction coefficient is associated with energy dissipation in the course of elastic deformations and arises due to viscous dissipation by the surrounding fluid. We compute the energy gradients by performing a series of small virtual displacements along each conjugate dimension in both positive and negative directions in order to obtain a centered finite-difference approximation. Alternatively, an analytical expression for the energy gradients based on metric changes can be used li2021chemically . Then a simultaneous update of all node positions is performed according to the calculated forces. Since the energy gradients by virtual displacement are independent and calculated in respect to the actual shape, we perform the computations in parallel and significantly speed up the most time-consuming procedure in the simulations. We apply multithreaded looping over the nodes by using OpenMP multiprocessing programming openmp in order to parallelize the C code and execute the program on a shared-memory cluster node or on a high-performance multicore personal computer.
We compute spatial derivatives in the diffusion equation (3) using numerical approximation based on the divergence theorem (Green-Gauss) ferziger2002computational gradient scheme. The concentration at the node of the mesh is calculated as an average over the concentration values at adjacent triangles which is weighted according to the distance between node and the center of the triangle (Fig.2). This requires concentration values at triangles that are governed by Eq. (3). To find the gradients at the center of a triangle, the Green-Gauss divergence theorem is used. The formally constructed vector field, , in terms of the scalar concentration field, , and an arbitrary constant vector, , yields . Then the integrals over the volume and surface enclosing the volume represented by a triangle shown in Fig.2 with unit thickness can be replaced by an approximation of the gradients at each triangle. This accounts for the fluxes through the faces of the triangle and is given by , where is the concentration at the center of each edge of the triangle deka2018new . This is an average over node values at the ends of the edge (nodes and ) whereas is the normal to the face at each edge. Summation is assumed over the three faces of the triangular volume element. This approximation allows the calculation of components of the concentration gradient at each triangle. The same method is applied to calculate the second derivatives required for the Laplacian in Eq.3. At the disk boundary, we impose no-flux conditions.
The chemical reaction (Eq. 3) and motor binding kinetics (Eq. 4) are usually slower than propagation of elastic stresses. Stress relaxation via buckling and wrinkling is assumed to be a fast process in the models we consider. Physically speaking, chemical or motor fraction rearrangements evolve on longer time scales, whereas fast modes of mechanical conformations follow them quasi–statically. For an epithelial monolayer, we estimate a characteristic timescale of –s for relaxation of elastic deformation energy Harris2012 ; zakharov2020mechanochemical , while morphogen degradation occurs over tens of minutes to hours kicheva_12 ; egan2017robust . A similar comparison of timescales can be made for the cell cytoskeleton or actin–myosin gels in vitro that are simulated in Model II. The elastic stress propagation is very fast and predicted to occur over seconds yuval2013 , whereas the turnover time required for myosin motor complexes to exchange between the actin cytoskeleton and the solution has been measured to be tens of seconds (see Ref. salbreaux2012 and references therein). Such a separation of timescales allows a simulation of the dynamics by implementing an iterative procedure: starting with the reference equilibrium configuration, a small perturbation in chemical concentration or motor fraction is imposed causing a local contractility change that defines new optimal lengths, and because the mechanical response is fast, we perform minimization of the elastic energy Eqs. (5,6) by probing the energy landscape to calculate the actual three-dimensional shape at this particular time step. Once the system is in mechanical equilibrium, a small time step using an explicit Euler forward scheme butcher2008numerical is performed in the dynamic equations (3) and (4) leading to a new concentration field and stress distribution. The iterative process continues till the change in concentration and motor fraction profiles, which are coupled with reshaping, becomes small enough reaching a steady state. Simulations show that the dynamics slows down and the pattern ultimately becomes stationary on a domain of finite size.
In this study, we focus on situations where the mechanical deformations are significantly faster than the chemical rearrangements. This captures the short time elastic deformations of tissue and gels. This modeling approach may also be extended to capture the reverse scenario. If the mechanical relaxation is slow, for example due to friction, and the chemical kinetics is fast, the timescale will be determined by deformations whereas chemical rearrangements will be quasi–static. Such situations may arise when there are viscoelastic effects from material remodeling Matoz-Fernandez2020 or poroelastic effects from fluid flows through pores in the material moeendarbary_13 ; ideses_18 , which introduce additional timescales for deformations. These are determined by the time required for the cytoskeleton or tissue to remodel or for the solvent to flow through the material. In general, both mechanical and chemical processes can occur over comparable timescales. In this case, chemical and mechanical updates have to be performed simultaneously with a proper choice of the friction coefficient at each time step. The resulting patterns, particularly their propagation in time, can then be different from the results presented below.
| Parameter | Description |
|---|---|
| Young’s modulus | |
| Poisson ratio | |
| Maximal contractility | |
| Minimal contractility | |
| Width of transitional zone between domains with and | |
| Characteristic curvature at which the chemical production saturates | |
| Production rate | |
| Degradation rate | |
| Friction coefficient |
IV Results
In this section, we present our simulation results for case studies obtained using the numerical approaches described in the previous section. In simulations for Model I, we use the set of parameters listed in Table 1. Other model parameters are varied and are specified in the figure captions. We show dynamics with separation of timescales for both models. For Model I, we explore the parameter space to demonstrate qualitatively different emergent patterns and robustness of the algorithm. For simplicity, we consider a planar elastic sheet of circular geometry of radius and thickness in the initial undeformed state. To avoid boundary effects, we assume that the boundary is constrained against out-of-plane displacements but is allowed to move freely in-plane.
IV.1 Expansion and Curvature feedback model
In the initial state, the chemical concentration is assumed to be zero and the system is in mechanical equilibrium. A small local perturbation in chemical concentration at the center brings the system out of equilibrium, thus causing a localized decrease in contractility in an inner spot-like domain according to Eq. 2. The difference in contractility generates in-plane incompatibility between the inner domain, which has larger optimal area and tends to expand, and the outer domain that remains at the reference surface area. If the shell thickness is small, it tends to reduce the compressive stress in the inner domain by developing out-of-plane deformations, i.e. it undergoes buckling. On the other hand, buckling and wrinkling are associated with developing higher curvature that, due to the assumed mechanochemical feedback, in turn leads to an increased production of chemical at these places. The chemical signal is also allowed to diffuse (Eq. 3) along the surface, but we find that this is not crucial for pattern formation.
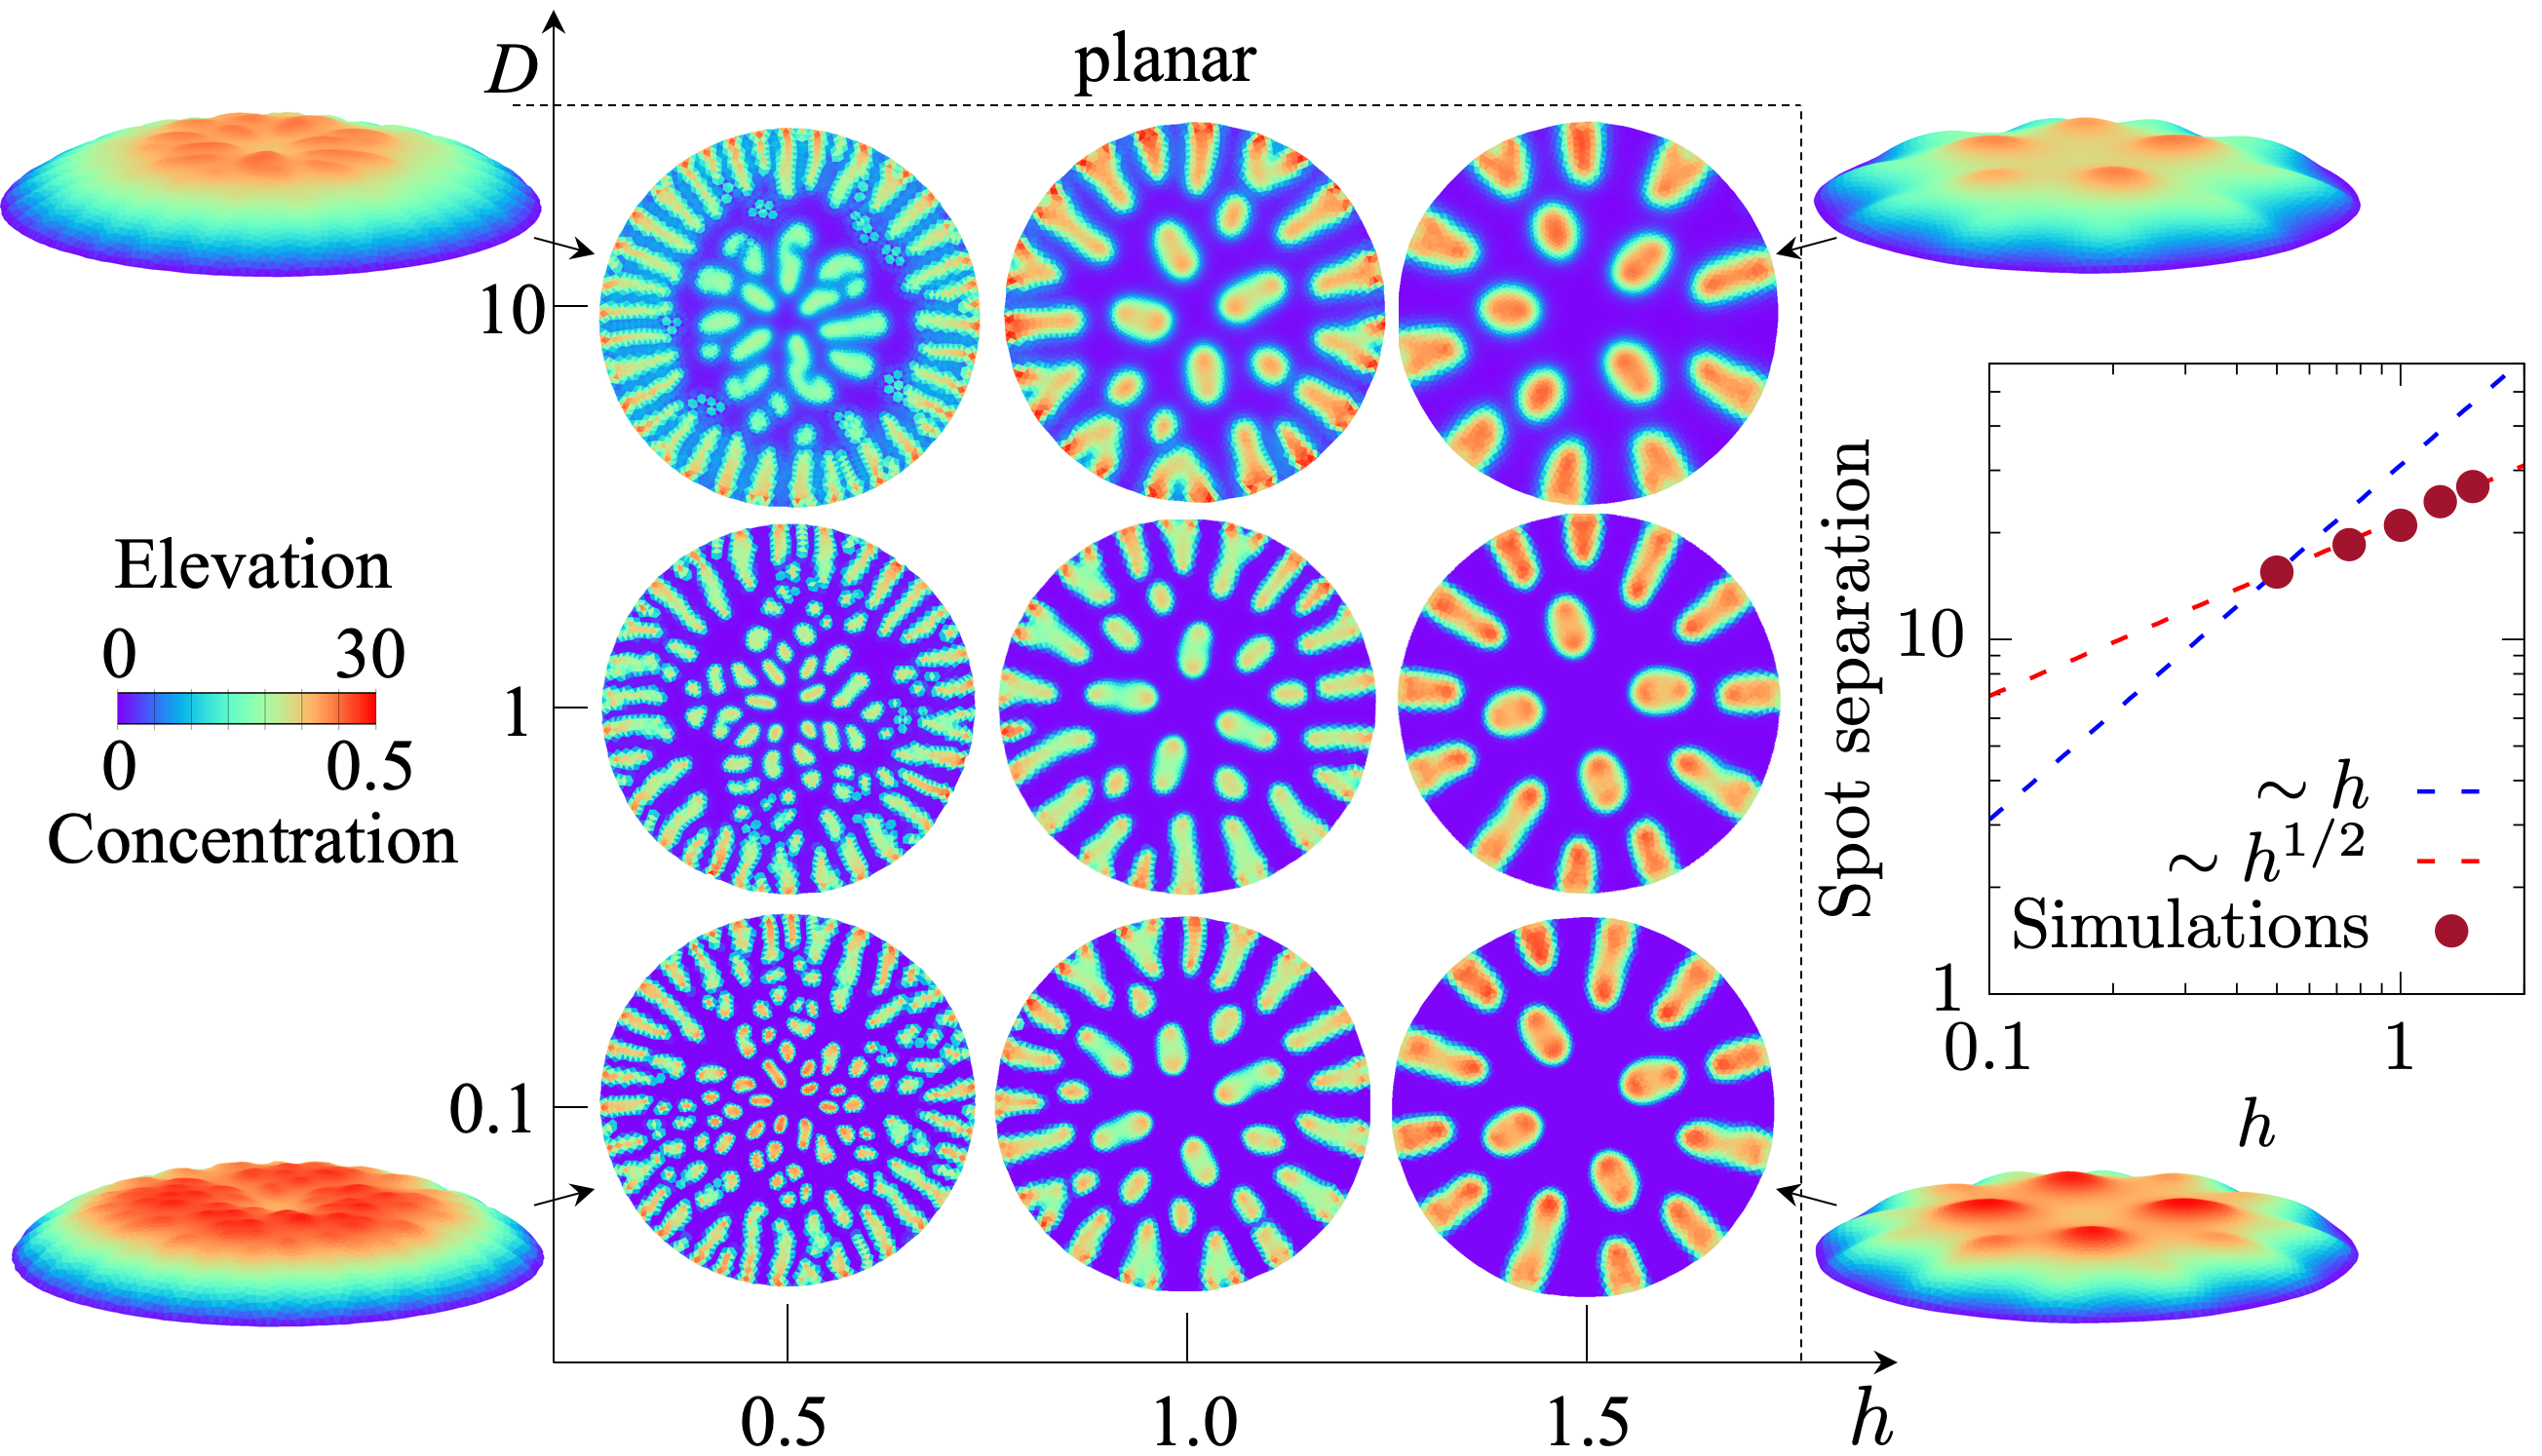
We perform simulations with varying shell thickness and diffusivity to explore the emergent propagating patterns. Steady states at different parameters are shown in Fig.3, where top views correspond to chemical concentration profiles and the oblique views for vertical deflections from the initial planar shape. As expected from the model assumptions, regions that bulge out are associated with higher chemical concentration. At large thickness , and high diffusion , not shown in the figure, the initial perturbation does not cause the pattern to propagate. At large thickness, it is energetically costly to develop large curvature, and thus, the shell remains planar with in-plane stress localized at the original site of perturbation. Very high diffusion leads to a fast decrease of concentration at the initial perturbation site and as a result, the in-plane stress is small and not enough to develop a buckling instability. At small , the shell develops a spotted pattern of separate small bulges of large curvature with no apparent order. The spots become larger and increase their separation with increasing thickness, eventually developing only a few equally separated spots (). The spots of high concentration become larger with diffusion and increased thickness. Since the disk boundary is not restricted from displacing in-plane, expansion in the radial direction is not constrained. whereas azimuthal expansion leads to the formation of wrinkles that extend normal to the boundary.
For the results shown in Fig.3, the pattern does not change qualitatively with varying thickness and diffusion. However, we find that a different scenario occurs when the concentration threshold for the relaxation of contractility, in Eq. 2, is higher. Figure 4 depicts the time evolution of chemical concentration at zero diffusion but different values of and thickness, . In Fig. 4a, a thin shell at develops a spotted pattern that propagates towards the boundary and eventually reaches a steady state. The initial spot increases its width and splits into multiple spots at early times (). At the same time, the radial compression of the outer region generated by the expansion of the initial central spot causes the formation of a secondary ring with higher curvature (seen in darker blue around the central spot). The resulting higher concentration leads to more deformations which causes the ring to break into a series of spots along it due to the expansion in azimuthal direction when concentration is high enough (). The process continues with formation of another ring of spots till it reaches the boundary that is not allowed to displace vertically.
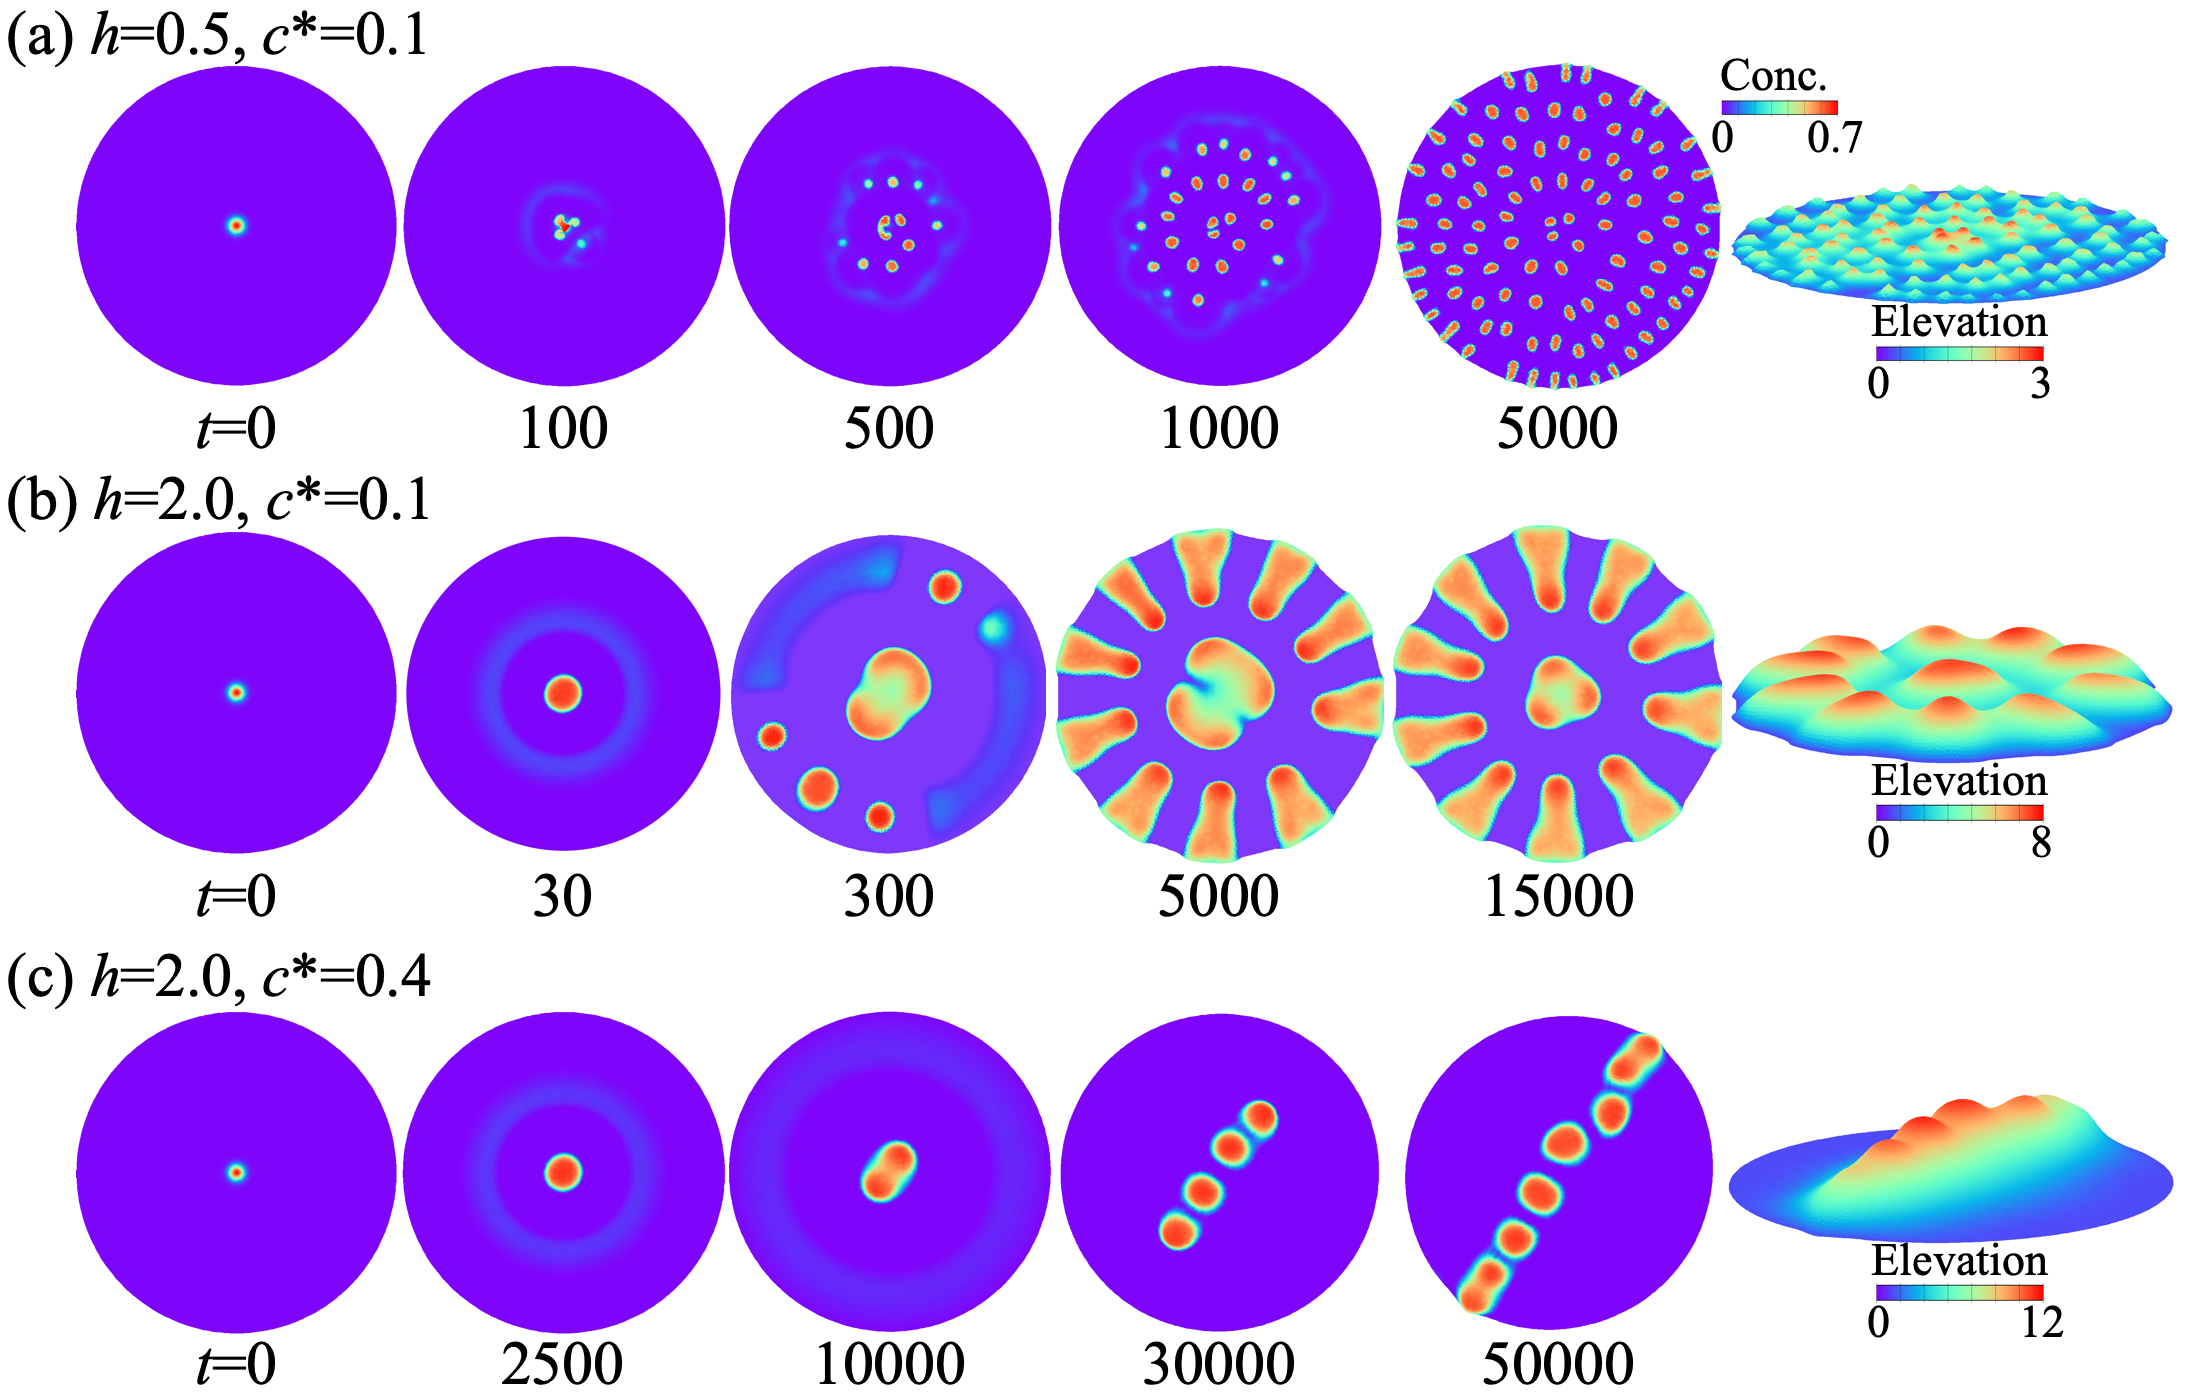
Increasing shell thickness leads to a larger characteristic deformation length and, as a result, the spots are separated by larger distance (Fig.4b). The domain accommodates only a few spots along both radial and circumferential directions () that eventually merge () forming large bulges.
Figure 4c shows the dynamics at and increased thickness, which is aimed to demonstrate a qualitatively different pattern. The initial () dynamics is similar to that of the lower case. The initial perturbation grows in size and the secondary ring of higher concentration forms around it. However, the steady state concentration at the ring, which depends on the curvature of the ring according to Eq. 3, is now lower than . This means no chemical-induced expansion occurs at the ring and it does not split into spots. The initial spot increases in size with time and eventually splits into two separate spots (). The division repeats for the newly formed spots () and the process terminates once the line of spots approaches the boundary (). The actual three-dimensional conformation with a ridge-like pattern is depicted in the rightmost panel in Fig.4c.
The division of the initial spot and its propagation are associated with wrinkling instabilities that arise when the spot grows in size. The mechanical incompatibility due to the difference in contractility between the outer and inner domains defined by the chemical concentration leads to buckling to a spherical bulge at small stress, and to wrinkling in the circumferential direction at larger compressive load ortiz1994morphology ; holmes2008crumpled . The lowest mode with two wrinkles appears first and causes the initial bulge to split into two separate bulges located at the peaks of wrinkles. Then the process repeats for the newly appeared bulges and thus the pattern propagates along a constant direction creating a ridge-like shape. The direction is set by orientation of wrinkles formed at the first splitting, which is selected spontaneously.
Our numerical observations of separating bulges can be rationalized using the general theory for wrinkling of compressed thin sheets Cerda2003 ; paulsen2016curvature which predicts how the wrinkling wavelength depends on model parameters. Wrinkles occur within the expanding inner domains with high chemical concentration in order to accommodate the excess length along the azimuthal direction. The inner expanding domain in the context of our patterns shown in Fig. 4 could be a bulge or the secondary ring, both of which exhibit elastic instabilities and break up. Since the chemical-activated inner domain expands, it is under biaxial compression from the surrounding outer domain which pushes back on it. To build a tractable scaling argument, let us consider a simplified geometry where the wrinkles in the inner domain extend along the direction perpendicular to the interface (aligned along the direction) with an outer relaxed domain. For a wrinkle pattern with wavelength, , and amplitude of out–of-plane deflection, , the curvature goes as . The in-plane strain along the direction created in the sheet as a result of the out-of-plane deflection goes as landau_lifshitz_elasticity . Here, is a characteristic size of the wrinkle perpendicular to the direction of wrinkling, i.e. along the direction. To find the minimal energy configuration, we compare the bending energy (per unit area), , with the in-plane stretching energy (per unit area), . This latter depends on the stress along the direction, which in turn is caused by the chemical-induced expansion strain: . The stress in the direction is assumed to be relaxed by wrinkling. The in-plane elastic energy is then, . By equating, , and eliminating , we obtain for the wavelength, .
This predicted scaling can be demonstrated in our numerical results by calculating the spot separation. An approximate expression for the separation of uniformly distributed spots is , where is the total sheet area in the deformed state, is the total number of spots, and is the total area, where contractility is lower than the initial contractility . For the spotted pattern at in Fig.4a, we estimate spot separation . Increased thickness at constant contractility change leads to increasing separation: at and at , which is consistent with the scaling prediction (the inset of Fig.3). The scaling of spot separation with thickness as well as with the expansion factor, , was verified in detail for this model on a spherical shell in Ref. zakharov2020mechanochemical .
In summary, our simulation results for different parameters indicate that the pattern propagates due to buckling instabilities that are coupled to chemical production and occur independently of diffusion, in contrast to the Turing patterns howard_11 that rely on interaction between several signalling species of different diffusivity.
IV.2 Contraction and Tensional feedback model
Here we explore the dynamics and pattern formation in a contractile sheet in the regime when feedback between the developed tension and motor unbinding rate is strong. The characteristic detachment rate is chosen to be much larger than the binding rate (, ) egan2017robust . Thus, without feedback, the bound motor fraction, , decreases fast, approaching a steady state value. Similar to experiments with contractile active gels ideses_18 , the effective contractility is assumed to be high, , providing significant deformations in the sheet even at large thickness.
We assume that in the reference undeformed state with zero bound motor concentration, the elastic sheet is planar with circular geometry. Then a small localized perturbation in motor concentration (prescribed by a Gaussian function) is introduced at the center of the sheet (Fig.5, ), thus keeping the system perfectly symmetric. The initial perturbation in can be caused by a local activation of motors by light or washing out a motor-inhibitor schuppler2016boundaries . Higher motor concentration is associated with larger contractility strength in this inner region, whereas the rest of the sheet remains at low motor fraction because the unbinding rate is large. Since the distribution of motors and actin filaments in the gel is assumed isotropic, the inner region of high contracts in both, radial and azimuthal directions. This, in turn, generates tension along the radial direction and circumferential compression in the outer region of low , as expected for a disk geometry, similar to the Lamé problem of an annulus that is under tension at the inner edge davidovitch2011prototypical . However, the outer region generates a restoring force to return to the reference shape, and thus the inner region of high is under stretch in both directions.
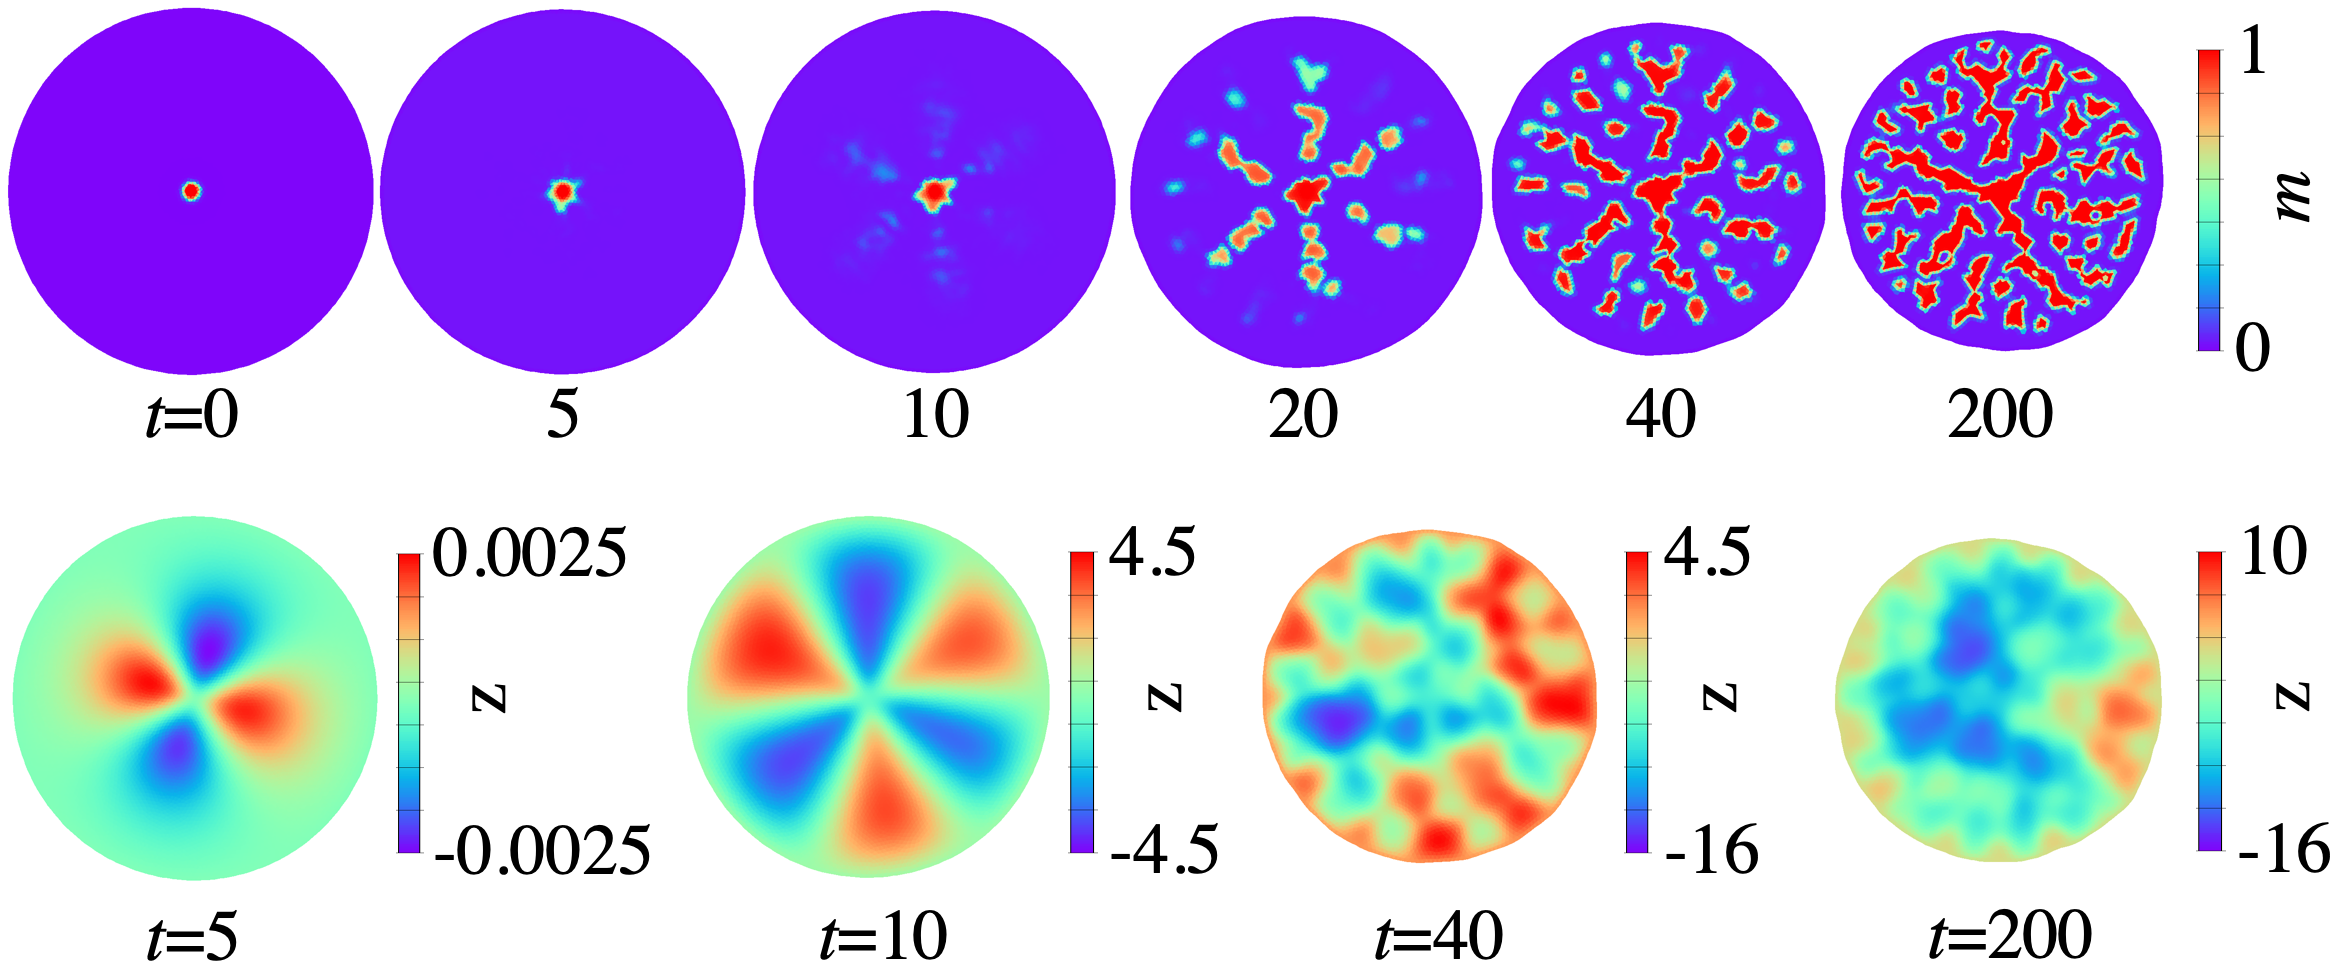
The macroscopic manifestation of the incompatibility between inner and outer regions is the deflection of the sheet from the planar shape (see Fig. 5 lower panel at ). The inner region remains planar, but the azimuthal compression of the outer region leads to buckling with wrinkles extending in the radial direction. The deflections along radial and circumferential directions allow a decrease in the stretching energy via bending. However, if the sheet is of finite thickness, stretching does not completely vanish in both regions, which leads to decreasing and increasing . The inner region, being stretched in both directions, remains at a high motor fraction, and additional domains of high appear in the outer region (see Fig. 5 upper panel, at ), where it is subject to tension. The stretched domains of increased are located at the peaks and valleys of wrinkles where there is no twist of the sheet about the radial direction if we consider a narrow segment of the disk along the radius. In this state, the disk shape is still symmetric, but due to the increased total area of spots with higher motor concentration, and the consequent larger tension, the number of wrinkles also increases. As the concentration along the wrinkles’ extrema rises, it generates compression between the wrinkles’ peaks and valleys. The spots of higher become irregular in shape because the wrinkles appearing around them propagate normally to the interface between regions of different concentration and distort their shape. Additionally, the concentration gradients are large at the interfaces due to stretching in the domains with higher as a result of the restoring force from the surroundings. On the other hand, the outer region is compressed in the direction along the interface and develops wrinkles, which reduce the stretching energy in some places and cause larger there. Thus, the system forms a binary pattern with separated spots of large in a background of small .
With time, the deformation pattern approaches the boundary () and additional spots of higher concentration appear in the regions between the wrinkles’ extrema (). Then the dynamics slows down and eventually, the entire sheet is deformed with multiple separate spots of high contractility (). In contrast to Model I with local expansion and buckling in the inner regions, here out-of-plane deformations occur in the outer regions with lower concentration. While chemical concentration accumulates at the peaks of the wrinkled regions in model I, here the motors bind to regions within the wrinkles which makes the pattern irregular in the final steady state.
We also considered different (non-axisymmetric) initial conditions, for example, a rectangular spot or a narrow stripe with larger motor fraction. These lead to a similar final steady state, but the intermediate shapes and patterns are different and strongly depend on the initial spot geometry schuppler2016boundaries . Initial geometries with corners cause larger deflections along the straight interfaces and stronger stretching near the corners because contraction is unbalanced at those places. As a result, the pattern starts to propagate from the corners of the initial spot. Activation of motors simultaneously in two separate small spots leads to larger stretching and wrinkling along the line connecting the spots, both in the region in between the spots and outside. We also performed simulations at various values of the feedback strength , (which is inverse of a characteristic stress), that determines the sensitivity of the unbinding rate to tension. At small values of , the tension in the outer region does not cause significant decrease of and the initial perturbation vanishes () or does not propagate (). Strong coupling at large reduces the with small spatial inhomegeneity and the sheet almost uniformly contracts till it reaches a steady state. The parameter must be lowered for a stronger contractility and increased for a weaker contraction to get propagating patterns.
V Conclusions
In this paper, we have examined spatiotemporal dynamics in two biologically inspired models with mechanochemical feedback. We also describe in detail a flexible numerical method used to reproduce the dynamics and which can be applied to many different types of systems simulating elastic plates and shells.
Using numerical simulations based on separation of time scales, we showed different regimes of active pattern formation and identified parameters governing the behavior. Although the two models involve distinct signalling and feedback mechanisms, they both exhibit long-range deformations in thin elastic sheets which lead to mechanochemical pattern formation.
In the expansion-curvature model, a sequence of buckling instabilities leads to regularly spaced lattice-like or scar like arrangements of spots reminiscent of patterns obtained from purely buckling paulose_13 or purely chemical instabilities lavrentovich_16 . We have recently reported similar patterns on spherical shells thereby demonstrating that these phenomena are potentially robust to changes in shell geometry zakharov2020mechanochemical . Further study is required for a better understanding of these patterns in the context of wrinkling theory. In the contraction–tensional model, we find an irregular pattern which is robust to the initial perturbation but sensitive to feedback strength. We leave the extension of the model to anisotropy in active stresses for future work.
This study is only a first step in exploring the nontrivial conformations occurring due to interaction between mechanical deformations and chemical signals. Our results provide an understanding of the emergent effects and promote avenues for future investigation in biological systems and bio-inspired materials. Using two disparate models, we demonstrate a robust phenomenon resulting from mechanochemical feedback: due to long-range elastic deformations, chemical patterns can occur and propagate even without diffusive or advective transport of chemicals.
Acknowledgments
This work was supported by funding from the National Science Foundation: NSF-CREST: Center for Cellular and Biomolecular Machines (CCBM) at the University of California, Merced: NSF-HRD-1547848. We gratefully acknowledge computing time on the Multi-Environment Computer for Exploration and Discovery (MERCED) cluster at UC Merced, which was funded by National Science Foundation Grant No. ACI-1429783.
References
- (1) T. Lecuit and P.-F. Lenne, “Cell surface mechanics and the control of cell shape, tissue patterns and morphogenesis,” Nature Reviews Molecular Cell Biology, vol. 8, pp. 633 EP –, Aug 2007.
- (2) J. M. Sawyer, J. R. Harrell, G. Shemer, J. Sullivan-Brown, M. Roh-Johnson, and B. Goldstein, “Apical constriction: A cell shape change that can drive morphogenesis,” Developmental Biology, vol. 341, no. 1, pp. 5 – 19, 2010.
- (3) M. Labouesse, ed., Forces and Tension in Development, vol. 95. Academic Press, 1st edition ed., 2011.
- (4) J. Howard, S. W. Grill, and J. S. Bois, “Turing’s next steps: the mechanochemical basis of morphogenesis,” Nature Reviews Molecular Cell Biology, vol. 12, no. 6, pp. 392–398, 2011.
- (5) J. Howard, Mechanics of Motor Proteins and the Cytoskeleton. Sinauer Associates, Sunderland, Mass., 2001.
- (6) M. Murrell, P. W. Oakes, M. Lenz, and M. L. Gardel, “Forcing cells into shape: the mechanics of actomyosin contractility,” Nature Reviews Molecular Cell Biology, vol. 16, pp. 486 EP –, Jul 2015.
- (7) T. Lecuit, P.-F. Lenne, and E. Munro, “Force generation, transmission, and integration during cell and tissue morphogenesis,” Annual review of cell and developmental biology, vol. 27, no. 1, pp. 157–184, 2011.
- (8) M. Greenberg, G. Arpağ, E. Tüzel, and E. Ostap, “A perspective on the role of myosins as mechanosensors,” Biophysical Journal, vol. 110, no. 12, pp. 2568 – 2576, 2016.
- (9) B. Guo and W. H. Guilford, “Mechanics of actomyosin bonds in different nucleotide states are tuned to muscle contraction,” Proceedings of the National Academy of Sciences, vol. 103, no. 26, pp. 9844–9849, 2006.
- (10) E. Hannezo and C.-P. Heisenberg, “Mechanochemical feedback loops in development and disease,” Cell, vol. 178, no. 1, pp. 12 – 25, 2019.
- (11) K. A. Jansen, D. M. Donato, H. E. Balcioglu, T. Schmidt, E. H. Danen, and G. H. Koenderink, “A guide to mechanobiology: Where biology and physics meet,” Biochimica et Biophysica Acta (BBA) - Molecular Cell Research, vol. 1853, no. 11, Part B, pp. 3043 – 3052, 2015. Mechanobiology.
- (12) K. Dasbiswas, E. Alster, and S. Safran, “Mechanobiological induction of long-range contractility by diffusing biomolecules and size scaling in cell assemblies,” Scientific reports, vol. 6, p. 27692, 2016.
- (13) P. Recho, A. Hallou, and E. Hannezo, “Theory of mechanochemical patterning in biphasic biological tissues,” Proceedings of the National Academy of Sciences, vol. 116, no. 12, pp. 5344–5349, 2019.
- (14) D. Gilmour, M. Rembold, and M. Leptin, “From morphogen to morphogenesis and back,” Nature, vol. 541, no. 7637, pp. 311–320, 2017.
- (15) Y. Ideses, V. Erukhimovitch, R. Brand, D. Jourdain, J. S. Hernandez, U. R. Gabinet, S. A. Safran, K. Kruse, and A. Bernheim-Groswasser, “Spontaneous buckling of contractile poroelastic actomyosin sheets,” Nature Communications, vol. 9, p. 2461, Jun 2018.
- (16) D. P. Holmes, “Elasticity and stability of shape-shifting structures,” Current opinion in colloid & interface science, vol. 40, pp. 118–137, 2019.
- (17) A. Zakharov and L. Pismen, “Textures and shapes in nematic elastomers under the action of dopant concentration gradients,” Soft Matter, vol. 13, no. 15, pp. 2886–2892, 2017.
- (18) A. Senoussi, S. Kashida, R. Voituriez, J.-C. Galas, A. Maitra, and A. Estevez-Torres, “Tunable corrugated patterns in an active nematic sheet,” vol. 116, no. 45, pp. 22464–22470, 2019.
- (19) B. Hobmayer, F. Rentzsch, K. Kuhn, C. M. Happel, C. C. von Laue, P. Snyder, U. Rothbächer, and T. W. Holstein, “Wnt signalling molecules act in axis formation in the diploblastic metazoan hydra,” Nature, vol. 407, no. 6801, pp. 186–189, 2000.
- (20) F. Brinkmann, M. Mercker, T. Richter, and A. Marciniak-Czochra, “Post-turing tissue pattern formation: Advent of mechanochemistry,” PLoS computational biology, vol. 14, no. 7, p. e1006259, 2018.
- (21) A. R. Harris, L. Peter, J. Bellis, B. Baum, A. J. Kabla, and G. T. Charras, “Characterizing the mechanics of cultured cell monolayers,” Proceedings of the National Academy of Sciences, vol. 109, no. 41, pp. 16449–16454, 2012.
- (22) L. D. Landau and E. M. Lifshits, Theory of Elasticity. Pergamon Press, New York, 1986.
- (23) B. Li, Y.-P. Cao, X.-Q. Feng, and H. Gao, “Mechanics of morphological instabilities and surface wrinkling in soft materials: a review,” Soft Matter, vol. 8, no. 21, pp. 5728–5745, 2012.
- (24) D. A. Matoz-Fernandez, F. A. Davidson, N. R. Stanley-Wall, and R. Sknepnek, “Wrinkle patterns in active viscoelastic thin sheets,” Phys. Rev. Research, vol. 2, p. 013165, Feb 2020.
- (25) E. Cerda and L. Mahadevan, “Geometry and physics of wrinkling,” Phys. Rev. Lett., vol. 90, p. 074302, Feb 2003.
- (26) L. Wolpert, “Positional information and the spatial pattern of cellular differentiation,” J. Theor. Biol., vol. 25, p. 1, 1969.
- (27) S. Okuda, T. Miura, Y. Inoue, T. Adachi, and M. Eiraku, “Combining turing and 3d vertex models reproduces autonomous multicellular morphogenesis with undulation, tubulation, and branching,” Scientific reports, vol. 8, no. 1, pp. 1–15, 2018.
- (28) M. Mercker, D. Hartmann, and A. Marciniak-Czochra, “A mechanochemical model for embryonic pattern formation: coupling tissue mechanics and morphogen expression,” PloS one, vol. 8, no. 12, p. e82617, 2013.
- (29) A. Mietke, F. Jülicher, and I. F. Sbalzarini, “Self-organized shape dynamics of active surfaces,” Proceedings of the National Academy of Sciences, vol. 116, no. 1, pp. 29–34, 2019.
- (30) R. Yoshida, “Self-oscillating gels driven by the belousov–zhabotinsky reaction as novel smart materials,” Advanced Materials, vol. 22, no. 31, pp. 3463–3483, 2010.
- (31) A. P. Zakharov and K. Dasbiswas, “Mechanochemical induction of wrinkling morphogenesis on elastic shells,” Soft Matter, vol. 17, pp. 4738 – 4750, 2021.
- (32) S. Li, D. A. Matoz-Fernandez, A. Aggarwal, and M. O. de la Cruz, “Chemically controlled pattern formation in self-oscillating elastic shells,” Proceedings of the National Academy of Sciences, vol. 118, no. 10, 2021.
- (33) K. Dasbiswas, E. Hannezo, and N. S. Gov, “Theory of epithelial cell shape transitions induced by mechanoactive chemical gradients,” Biophysical journal, vol. 114, no. 4, pp. 968–977, 2018.
- (34) T. J. Harris and M. Peifer, “The positioning and segregation of apical cues during epithelial polarity establishment in drosophila,” The Journal of cell biology, vol. 170, no. 5, pp. 813–823, 2005.
- (35) A. E. Shyer, T. R. Huycke, C. Lee, L. Mahadevan, and C. J. Tabin, “Bending gradients: how the intestinal stem cell gets its home,” Cell, vol. 161, no. 3, pp. 569–580, 2015.
- (36) C.-L. E. Helm, M. E. Fleury, A. H. Zisch, F. Boschetti, and M. A. Swartz, “Synergy between interstitial flow and vegf directs capillary morphogenesis in vitro through a gradient amplification mechanism,” Proceedings of the National Academy of Sciences, vol. 102, no. 44, pp. 15779–15784, 2005.
- (37) S. Banerjee, M. L. Gardel, and U. S. Schwarz, “The actin cytoskeleton as an active adaptive material,” Annual Review of Condensed Matter Physics, vol. 11, no. 1, pp. 421–439, 2020.
- (38) K. Dasbiswas, H. Shiqiong, F. Schnorrer, S. A. Safran, and A. D. Bershadsky, “Ordering of myosin ii filaments driven by mechanical forces: experiments and theory,” Philosophical Transactions of the Royal Society B: Biological Sciences, vol. 373, p. 20170114, May 2018.
- (39) F. Burla, Y. Mulla, B. E. Vos, A. Aufderhorst-Roberts, and G. H. Koenderink, “From mechanical resilience to active material properties in biopolymer networks,” Nature Reviews Physics, vol. 1, no. 4, pp. 249–263, 2019.
- (40) J. Alvarado, M. Sheinman, A. Sharma, F. C. MacKintosh, and G. H. Koenderink, “Force percolation of contractile active gels,” Soft Matter, vol. 13, pp. 5624–5644, 2017.
- (41) B. T. Marshall, M. Long, J. W. Piper, T. Yago, R. P. McEver, and C. Zhu, “Direct observation of catch bonds involving cell-adhesion molecules,” Nature, vol. 423, no. 6936, pp. 190–193, 2003.
- (42) G. Bell, “Models for the specific adhesion of cells to cells,” Science, vol. 200, no. 4342, pp. 618–627, 1978.
- (43) G. Gompper and D. Kroll, “Random surface discretizations and the renormalization of the bending rigidity,” Journal de Physique I, vol. 6, no. 10, pp. 1305–1320, 1996.
- (44) M. Meyer, M. Desbrun, P. Schröder, and A. H. Barr, “Discrete differential-geometry operators for triangulated 2-manifolds,” in Visualization and mathematics III, pp. 35–57, Springer, 2003.
- (45) X. Bian, S. Litvinov, and P. Koumoutsakos, “Bending models of lipid bilayer membranes: Spontaneous curvature and area-difference elasticity,” Computer Methods in Applied Mechanics and Engineering, vol. 359, p. 112758, 2020.
- (46) P.-O. Persson and G. Strang, “A simple mesh generator in matlab,” SIAM review, vol. 46, no. 2, pp. 329–345, 2004.
- (47) The OpenMP API specification for parallel programming http://www.openmp.org.
- (48) J. H. Ferziger, M. Perić, and R. L. Street, Computational methods for fluid dynamics, vol. 3. Springer, 2002.
- (49) M. Deka, S. Brahmachary, R. Thirumalaisamy, A. Dalal, and G. Natarajan, “A new green–gauss reconstruction on unstructured meshes. part i: Gradient reconstruction,” Journal of Computational Physics, vol. 422, p. 108325, 2020.
- (50) A. Kicheva, T. Bollenbach, O. Wartlick, F. Jülicher, and M. Gonzalez-Gaitan, “Investigating the principles of morphogen gradient formation: from tissues to cells,” Current Opinion in Genetics & Development, vol. 22, no. 6, pp. 527 – 532, 2012.
- (51) P. F. Egan, J. R. Moore, A. J. Ehrlicher, D. A. Weitz, C. Schunn, J. Cagan, and P. LeDuc, “Robust mechanobiological behavior emerges in heterogeneous myosin systems,” Proceedings of the National Academy of Sciences, vol. 114, no. 39, pp. E8147–E8154, 2017.
- (52) J. Yuval and S. A. Safran, “Dynamics of elastic interactions in soft and biological matter,” Phys. Rev. E, vol. 87, p. 042703, Apr 2013.
- (53) G. Salbreux, G. Charras, and E. Paluch, “Actin cortex mechanics and cellular morphogenesis,” Trends in Cell Biology, vol. 22, no. 10, pp. 536–545, 2012.
- (54) J. C. Butcher and N. Goodwin, Numerical methods for ordinary differential equations, vol. 2. Wiley Online Library, 2008.
- (55) E. Moeendarbary, L. Valon, M. Fritzsche, A. R. Harris, D. A. Moulding, A. J. Thrasher, E. Stride, L. Mahadevan, and G. T. Charras, “The cytoplasm of living cells behaves as a poroelastic material,” Nature Materials, vol. 12, p. 253, Jan 2013.
- (56) M. Ortiz and G. Gioia, “The morphology and folding patterns of buckling-driven thin-film blisters,” Journal of the Mechanics and Physics of Solids, vol. 42, no. 3, pp. 531–559, 1994.
- (57) D. P. Holmes, M. Ursiny, and A. J. Crosby, “Crumpled surface structures,” Soft Matter, vol. 4, no. 1, pp. 82–85, 2008.
- (58) J. D. Paulsen, E. Hohlfeld, H. King, J. Huang, Z. Qiu, T. P. Russell, N. Menon, D. Vella, and B. Davidovitch, “Curvature-induced stiffness and the spatial variation of wavelength in wrinkled sheets,” Proceedings of the National Academy of Sciences, vol. 113, no. 5, pp. 1144–1149, 2016.
- (59) M. Schuppler, F. C. Keber, M. Kröger, and A. R. Bausch, “Boundaries steer the contraction of active gels,” Nature communications, vol. 7, no. 1, pp. 1–10, 2016.
- (60) B. Davidovitch, R. D. Schroll, D. Vella, M. Adda-Bedia, and E. A. Cerda, “Prototypical model for tensional wrinkling in thin sheets,” Proceedings of the National Academy of Sciences, vol. 108, no. 45, pp. 18227–18232, 2011.
- (61) J. Paulose and D. R. Nelson, “Buckling pathways in spherical shells with soft spots,” Soft Matter, vol. 9, no. 34, pp. 8227–8245, 2013.
- (62) M. O. Lavrentovich, E. M. Horsley, A. Radja, A. M. Sweeney, and R. D. Kamien, “First-order patterning transitions on a sphere as a route to cell morphology,” Proceedings of the National Academy of Sciences, vol. 113, no. 19, pp. 5189–5194, 2016.