Stress Classification and Personalization: Getting the most out of the least
Abstract
Stress detection and monitoring is an active area of research with important implications for the personal, professional, and social health of an individual. Current approaches for affective state classification use traditional machine learning algorithms with features computed from multiple sensor modalities. These methods are data-intensive and rely on hand-crafted features which impede the practical applicability of these sensor systems in daily lives. To overcome these shortcomings, we propose a novel Convolutional Neural Network (CNN) based stress detection and classification framework without any feature computation using data from only one sensor modality. Our method is competitive and outperforms current state-of-the-art techniques and achieves a classification accuracy of and an score of . Through our leave-one-subject-out analysis, we also show the importance of personalizing stress models.
Index Terms:
effective states, stress detection, sensor system, wearablesI Introduction
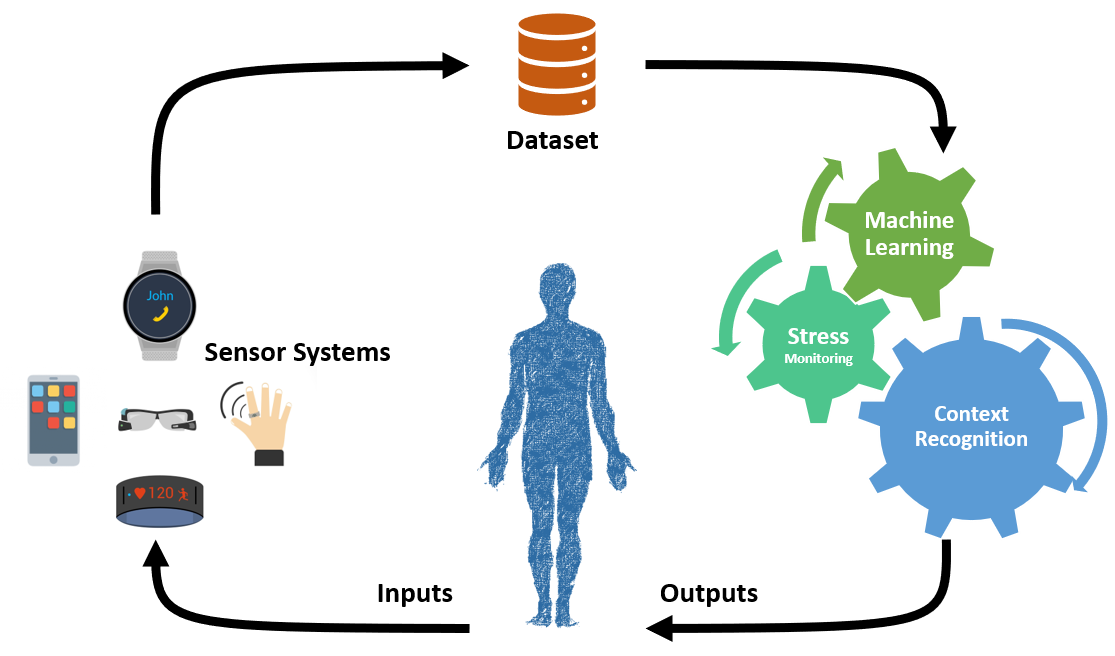
Stress describes bodily reactions to perceived physical or psychological threats [1] and is defined as the transition from a calm state to an excited state triggering a cascade of physiological response [2]. In the United States of America, around people suffer from headaches and insomnia for reasons related to stress, and there has been a steady increase in the number of people suffering from stress-related issues each year [3]. Furthermore, stress plays a critical role in many health problems, such as depression, anxiety, high blood pressure, heart attacks, and stroke [4]. Stress also influences a person’s decision-making capability, attention span, learning, and problem-solving capacity [5]. Stress detection and monitoring is an active research area with important implications for the personal, professional, and social health of an individual. Stress detection and monitoring can help prevent dangerous stress-related diseases. Towards this end, in this paper we propose, a novel Convolutional Neural Network (CNN) based framework for stress detection and classification, which uses raw Electrodermal Activity (EDA) sensor data without feature computation. Our approach is competitive with other state-of-the-art methods and does not suffers from many limitations inherent in earlier works. Figure 1 shows the general overview of a stress detection system used for real-time interventions to support the health of an individual. In this paper, we implement the stress classification pipeline, and in the future, we aim to use our classification model for strategic real-time interventions.
Usually, for stress detection and classification data from multiple sensor modalities such as heart rate variability (HRV), body acceleration (ACC), skin temperature, electrodermal activity (EDA), blood volume pulse (BVP), respiration rate, and electrocardiogram (ECG) are used to compute a large number of statistical and structural features to train machine learning algorithms. In [7], the authors computed features from sensor modalities to train a stress classification model with the best accuracy of . Using the same dataset, the authors in [4] used Deep Neural Networks (DNN) and statistical features to achieve an accuracy of . In [5] the authors used statistical features and representation learned by a deep learning model as features to train the stress classification model with accuracy up to with just EDA data. Motivated by the results from [7], the authors in [8] computed features in time, frequency, entropy, and wavelet domain from EDA data to train the XGBoost algorithm with the highest accuracy of . Feature selection was used to reduce the number of features to for the best possible classification accuracy. Furthermore, some works have also explored ways not to use electrodermal activity for stress classification since most commercial smartwatches and smart health devices don’t have sensors to measure galvanic skin response. In [9], authors used data from the built-in smartphone accelerometer sensor to identify activity that corresponds with stress levels and achieved an accuracy of . Also, in [10] data from a commercial smartwatch was used for binary stress classification with accuracy up to .
Using data from multiple sensors and computing a large number of features to train machine learning algorithms for stress classification has several disadvantages. Using numerous sensor modalities makes the system design complicated and expensive and hence unfit to be used in everyday lives. Also, sensors need power to operate, and more sensors draw more power, which is a big issue in battery-powered wearable systems. Computing features require domain knowledge, and extensive testing is needed to find the best set of features for optimal classification performance. Furthermore, computing a large number of complex features makes the classification algorithm less efficient in terms of run-time, energy, and memory. Besides, feature selection is needed to select the most meaningful features and adds an extra processing step to an already complex machine learning pipeline. Motivated by these drawbacks of multi-modal feature-based stress classification algorithms, in this paper, we propose a CNN-based stress detection and classification system which takes raw EDA sensor segments as inputs and learns and select the dominant features automatically during the training process. Our primary objective is to implement a stress detection and classification system using only the EDA data. The secondary goal was to explore the personalization of stress models. Perception and effects of stress are subjective in nature. The same external stimuli can have a varying degree of effect on different individuals in terms of stress and emotional arousal. Hence, we also investigate whether stress detection algorithms need personalization or not.
II Methodology
II-A Dataset
The Wearable Stress and Affect Detection (WESAD) dataset [7] is a publicly available dataset with ECG, EDA, BVP, respiration (RESP), skin temperature (TEMP), and motion (Acceleration) (ACC) sensor data obtained from the RespiBan (chest-worn) and Empatica E4 (wrist-worn) devices. The dataset was collected from subjects (3 female) in a laboratory setting, and each subject experienced three main affect conditions: baseline or normal (neutral reading), stress (exposed to Tier Social Stress Test (TSST)), and amusement (watching funny videos). In our analysis, we only use the EDA data from the Empatica E4 sampled at Hz. Approximately the length of the stressed condition was minutes, amusement minutes, and baseline situation was minutes.
II-B Segmentation and Normalization
For each subject, we have approximately minutes of EDA data. We segment the EDA data for the three affective states into seconds overlapping segments with overlap between consecutive segments. We settled on the window size of seconds because of available literature that has also used seconds window size for the WESAD dataset [4, 5, 6, 7]. Before segmentation, we normalize the data for each subject using the min-max normalization to spread the data in the range of . After segmentation, we obtain samples for the baseline class, samples for the stressed class, and samples for the amusement class. In our analysis, we have not used any method to deal with class imbalance and machine learning models are trained on the imbalance data for the worst case scenario.
II-C Convolutional Neural Network
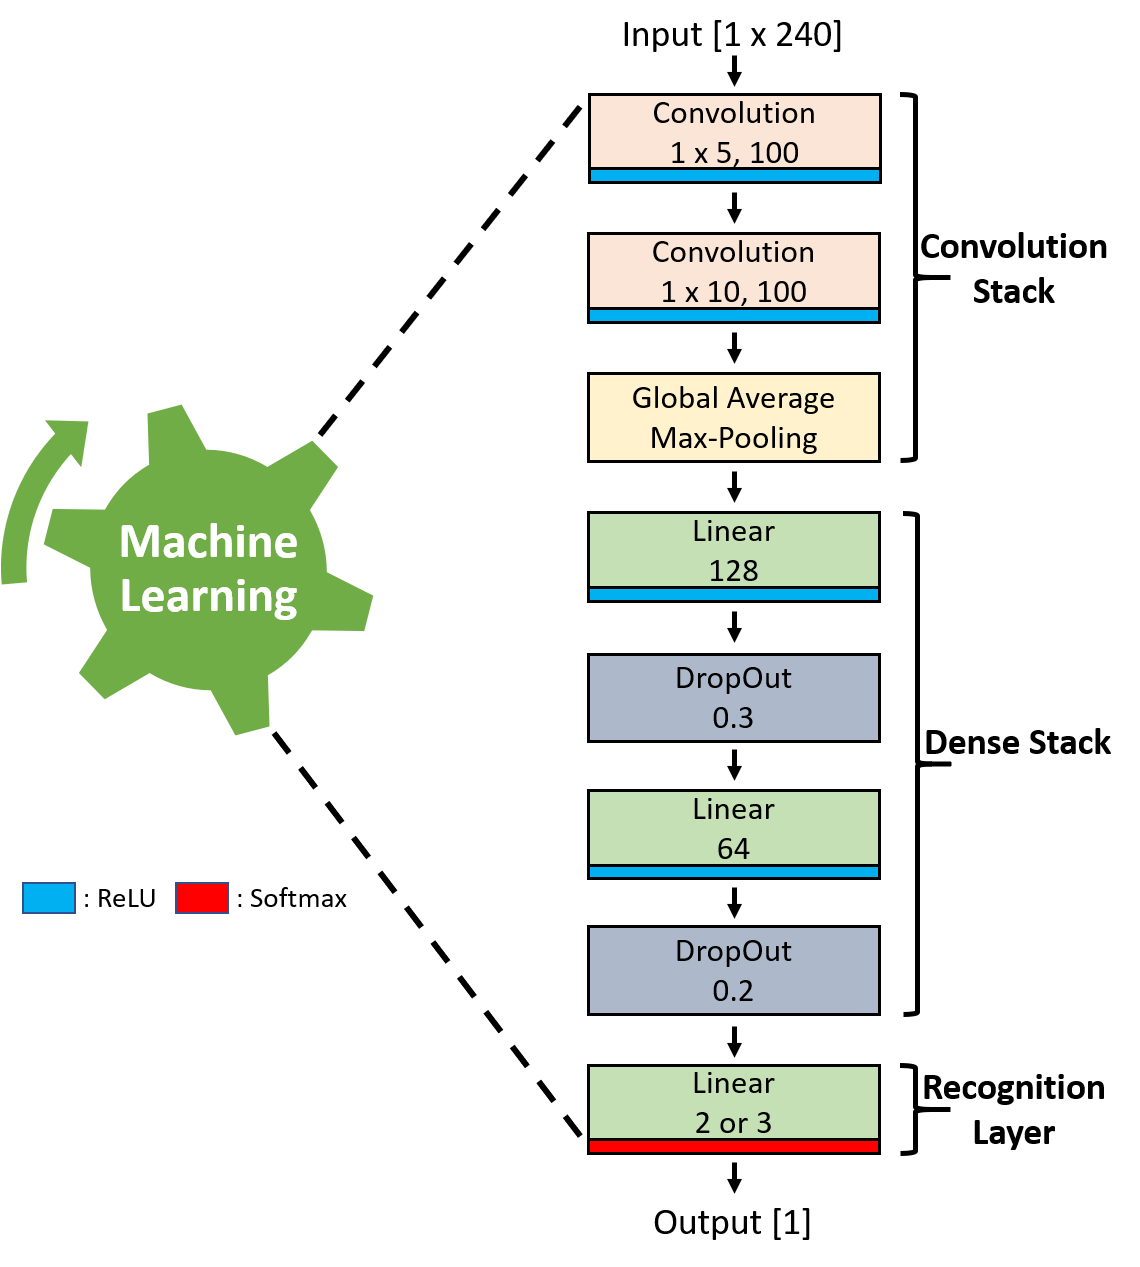
Data-driven learning algorithms learn associations between input and outputs directly from the sensor data without feature computation. These methods learn features and classifier simultaneously from the sensor data. A convolutional neural network (CNN) is a data-driven learning algorithm capable of learning local dependency and scale invariance in the input data without feature computation. In CNN, the convolution operation is used between the input and a weight matrix or filters to assemble complex features by successively learning smaller and simpler features. Consequently, CNN is suitable for our approach towards stress detection and classification, and hence we have used CNN as the learning algorithm in our work. We have used a ConvNet architecture composed of two convolutional layers with filters each and kernel size of and respectively. This is followed by a global max-pooling layer and two fully connected layers with and neurons. We also have drop-out layers after each fully connected layer with drop-out values and . The output layer has Softmax activation, and all other layers have ReLU [11] activation. Figure 2 shows the graphical representation of the proposed CNN used in this paper.
II-D Hyperparameters and Training
The hyperparameters in our framework were selected after extensive trial and error. The CNN models were trained for epochs with a batch size of and a fixed learning rate of . Out of samples in the dataset, or was included in the training set, and or belonged to the test set. For bi-affective state classification, data from the baseline (not-stress) and stressed classes were used to create the training and test sets. For tri-affective state classification data for all three classes: baseline, stressed, and amusement were used to create the training and test sets.
III Results and Observations
Due to the lack of space, we have omitted training curves of the CNN models and we want to confirm we observed no overfitting during training.
III-A Stress Classification
First, we present the results for the bi-affective state classification i.e., the binary case of stress Vs. not-stress classification. The trained CNN model achieved the best classification accuracy of on the training set and on the test set. Table I, shows the value of other performance metrics.
| Dataset | Accuracy | Precision | Recall | f1-Score |
|---|---|---|---|---|
| Training Set | ||||
| Testing Set |
In the second case, we consider the tri-affective state classification, a multi-class classification problem with classes: stress, not-stress, and amusement. Table II shows the values of performance metrics for this case. Note that the performance of the CNN model has decreased in the tri-affective case compared to the bi-affective case. We suspect this is because the model doesn’t have enough training samples to learn the distinction between the three classes.
| Dataset | Accuracy | Precision | Recall | f1-Score |
|---|---|---|---|---|
| Training Set | ||||
| Testing Set |
Furthermore, to account for the variance in performance, we conducted fold cross-validation for both cases of affective state classification. Table III shows the average classification accuracy and f1-score for bi-affective and tri-affective cases.
| Dataset | Accuracy | f1-Score | |
|---|---|---|---|
| Bi-affective | Training Set | ||
| Testing Set | |||
| Tri-affective | Training Set | ||
| Testing Set |
Finally, we present comparisons of our results with other state-of-the-art works on stress classification with the WESAD dataset in table IV. WESAD dataset has the following modalities ACC, EDA, TEMP, ECG, BVP, and RESP, and is represented by All in the table. All other compared approaches, details in 1, computes statistical or representational features from sensor data to train stress classification models. Our method, does not involves computation intensive feature computation and selection stages and uses the raw sensor data for training. Also, our approach is based on CNNs whereas compared methods are based on neural networks as well as statistical learning algorithms. We found our proposed approach to be competitive with state-of-the-art methods with the added advantage of being data-driven without needing any specialized domain knowledge for feature computation and selection.
III-B Personalization of Stress Models
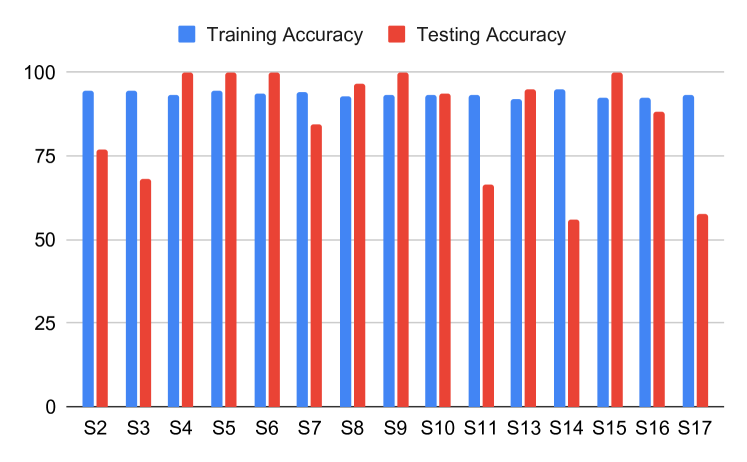
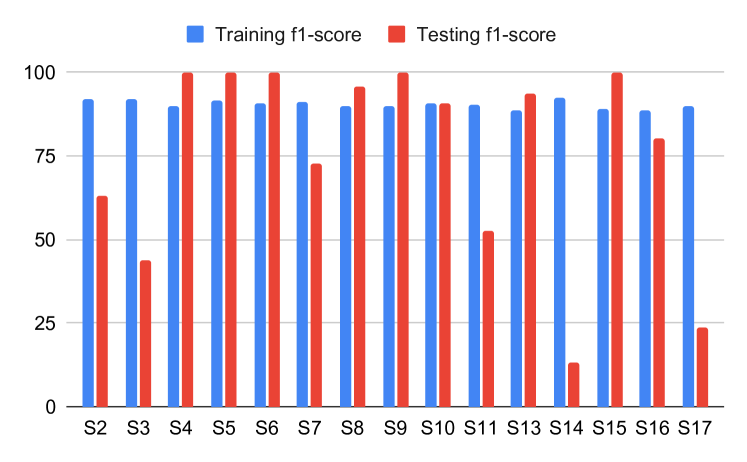
To investigate the subjective nature of stress and determine whether we need personalized models for stress detection and classification, we present the results of leave-one-subject-out (LOSO) analysis on the binary WESAD dataset. In LOSO analysis, data from one subject is removed from the training set and kept as the test set to evaluate the trained machine learning model. The WESAD dataset was collected from subjects and we present the results of LOSO analysis for each subjects. Figure 3 shows the classification accuracy and figure 4 shows the f1-score of the trained models on the test and training sets. The x-axis represents the subject whose data was not included in the training set and was used as the test set. Based on our results, we can confirm that stress is subjective, and the same external stimuli can have varying effects on different individuals. On the test data for left out subjects S2, S3, S7, S11, S14, and S17 the trained models performed poorly, but for subjects S4, S5, S6, S8, S9, S13 and S15 the trained model performed better compared to the training set. Furthermore, the performance of the model on the test data for left out subjects S10 and S16 was similar to that on the training set. The discrepancies in the results of LOSO analysis can be attributed to many different reasons such as physical characteristics, emotional endurance, stress management skills, personality traits, and noise in the sensor data. For example, subject was looking forward to stress conditions and was cheerful during data collection. Subject might have fallen asleep during the first meditation phase and subject had a stressful week, and the study was relaxing and not very stressful. Also, subject already had a stressful day before the study and felt cold in the study room. These observations suggest that to better account for the differences between individuals towards the perception of stressful events and to build a general model for stress classification personalization of stress models is needed.
The authors in [4] also used LOSO for cross-validation and were able to achieve a classification accuracy of and f1-score of with a neural network trained on features data computed from all sensor modalities. In [8] the authors, computed various features from EDA data, and were able to achieve an average f1-score of with the XGBoost algorithm. Our LOSO analysis is based on just EDA data without any feature computing, and on average, across subjects, our method has the classification accuracy of and f1-score of .
To personalize the stress models for left-out subjects whose test set performance was lower than the training set, we re-trained the machine learning models on the left-out subject data. Starting from sample from the test set, we successively increased the number of samples used for re-training the model until the performance of the model on the test set was greater or equal to that on the original training set. Table III-B shows the number of samples needed for each left-out subject and the final test set accuracy after re-training. The performance of the model on the test set increased significantly after re-training, suggesting we need personalized stress models for maximum performance.
| Subject | Original | |||
|---|---|---|---|---|
| Test Set | ||||
| Total Samples | Re-training | |||
| Final | Sample Size | |||
| Test Set | ||||
| Accuracy | ||||
| S2 | ||||
| S3 | ||||
| S7 | ||||
| S11 | ||||
| S14 | ||||
| S17 |
IV Conclusion
In this work, we proposed a novel CNN-based stress detection and classification framework that uses raw EDA sensor data without feature computation and selection for affective states (stressed vs. normal vs. amusement) classification. We used the EDA data because EDA is found to be the best indicator of stress. Our approach can be adapted to include other sensor modalities for possible performance improvement also extended to other datasets. We also showed the need for a personalized stress model with our leave one subject analysis. Our approach is competitive with other state-of-the-art methods and does not suffer from many disadvantages such as feature computation and selection, multi-modal input data, and complex system design.
References
- [1] Selye, Hans. The stress of life. 1956.
- [2] Kasl, Stanislav V. Stress and health. Annual review of public health 5.1 (1984): 319-341.
- [3] American Psychological Association. Stress in America: The state of our nation. Stress in AmericaTM Survey (2017).
- [4] Bobade, Pramod, and M. Vani. Stress Detection with Machine Learning and Deep Learning using Multimodal Physiological Data. 2020 Second International Conference on Inventive Research in Computing Applications (ICIRCA). IEEE, 2020.
- [5] Aqajari, Seyed Amir Hossein, et al. GSR Analysis for Stress: Development and Validation of an Open Source Tool for Noisy Naturalistic GSR Data. arXiv preprint arXiv:2005.01834 (2020).
- [6] Choi, Jongyoon, Beena Ahmed, and Ricardo Gutierrez-Osuna. Development and evaluation of an ambulatory stress monitor based on wearable sensors. IEEE transactions on information technology in biomedicine 16.2 (2011): 279-286.
- [7] Schmidt, Philip, et al. Introducing wesad, a multimodal dataset for wearable stress and affect detection. Proceedings of the 20th ACM International Conference on Multimodal Interaction. 2018.
- [8] Hsieh, Cheng-Ping, et al. Feature Selection Framework for XGBoost Based on Electrodermal Activity in Stress Detection. 2019 IEEE International Workshop on Signal Processing Systems (SiPS). IEEE, 2019.
- [9] Garcia-Ceja, Enrique, Venet Osmani, and Oscar Mayora. Automatic stress detection in working environments from smartphones’ accelerometer data: a first step. IEEE journal of biomedical and health informatics 20.4 (2015): 1053-1060.
- [10] Gjoreski, Martin, et al. Continuous stress detection using a wrist device: in laboratory and real life. proceedings of the 2016 ACM international joint conference on pervasive and ubiquitous computing: Adjunct. 2016.
- [11] Jarrett, Kevin, et al. What is the best multi-stage architecture for object recognition?. 2009 IEEE 12th international conference on computer vision. IEEE, 2009.