NICER, NuSTAR, and Swift follow-up observations of the -ray flaring blazar BL Lacertae in 2020 August–October
Abstract
During a period of strong -ray flaring activity from BL Lacertae, we organized Swift, Neutron star Interior Composition Explorer (NICER), and Nuclear Spectroscopic Telescope Array (NuSTAR) follow-up observations. The source has been monitored by Swift-XRT (X-ray Telescope) between 2020 August 11 and October 16, showing a variability amplitude of 65, with a flux varying between 1.010-11 and 65.310-11 erg cm-2 s-1. On 2020 October 6, Swift-XRT has observed the source during its historical maximum X-ray flux. A softer-when-brighter behaviour has been observed by XRT, suggesting an increasing importance of the synchrotron emission in the X-ray part of the spectrum covered by XRT during this bright state. Rapid variability in soft X-rays has been observed with both the Swift-XRT and NICER observations with a minimum variability time-scale of 60 and 240 s, and a doubling time-scale of 274 and 1008 s, respectively, suggesting very compact emitting regions (1.11014 and 4.01014 cm). At hard X-rays, a minimum variability time-scale of 5.5 ks has been observed by NuSTAR. We report the first simultaneous NICER and NuSTAR observations of BL Lacertae during 2020 October 11–12. The joint NICER and NuSTAR spectra are well fitted by a broken power law with a significant difference of the photon index below (2.10) and above (1.60) an energy break at 2.7 keV, indicating the presence of two different emission components (i.e. synchrotron and inverse Compton) in the broad band X-ray spectrum. Leaving the total hydrogen column density towards BL Lacertae free to vary, a value of N = (2.58 0.09) 1021 cm-2 has been estimated.
keywords:
radiation mechanisms: non-thermal; galaxies: active; galaxies: jets; X-rays: galaxies1 Introduction
The extragalactic -ray sky is dominated by blazars, a class of radio-loud active galactic nuclei (AGN) in which one of the two relativistic jets points in the direction of the Earth. The spectral energy distribution (SED) of blazars shows a non-thermal continuum from radio to -rays, characterized by two distinct components: one peaking in infrared-to-X-rays and associated with synchrotron emission by e±, and one peaking in the -ray energy range and associated, in leptonic models, with inverse Compton (IC) scattering between the e± and a soft photon field (which can be their own synchrotron radiation, or an external photon field such as the emission from the broad-line region, the torus, or the disc). A common feature of all blazars is to show strong flux and spectral variability at all wavelengths and on a variety of time-scales, from minutes to years (e.g., Wagner et al., 1995; Ulrich et al., 1997). The variability time-scale of the emission can give constraints on the size of the emitting region (e.g., Tavecchio et al., 1998, 2010).
Blazars are classified into BL Lac objects and flat-spectrum radio quasars (FSRQ) according to the presence or absence of broad emission lines (equivalent width EW 5 Å; e.g., Stickel et al., 1991) in their optical spectrum, respectively. A further classification is based on the synchrotron peak frequency: While FSRQ show generally a low peak frequency (in infrared), in BL Lac objects the peak frequency ranges from radio to X-rays and are further classified as low/intermediate/high-frequency-peaked BL Lacs (LBL, IBL, and HBL; with peak frequency lower than 1014 Hz, between 1014 and 1015 Hz, and above 1015 Hz, respectively; see e.g. Padovani et al., 1995)111A similar classification (low/intermediate/high-synchrotron-peaked blazar) has been introduced in Abdo et al. (2010) not distinguishing BL Lac and FSRQ and making an explicit reference to the synchrotron origin of the first bump of the SED.. Therefore, observations in the X-ray energy range can cover different parts of the SED depending on the type of objects: the peak of the synchrotron component in HBL, the valley between synchrotron and IC components in IBL, the rising part of the IC component in LBL and FSRQ.
BL Lacertae, a blazar at redshift = 0.069 (Miller & Hawley, 1997), has been historically defined as the prototype of the BL Lac objects. According to its synchrotron peak frequency, it has been classified as an LBL (Nilsson et al., 2018) or IBL (Ajello et al., 2020). Optical spectra of BL Lacertae have shown broad H and H lines (Vermeulen et al., 1995) that vary in flux (Capetti et al., 2010). The discovery of broad emission lines, although weak, in BL Lac seems to indicate that BL Lac itself can be more similar to FSRQ than to less luminous BL Lac objects. BL Lacertae has been studied intensively since its discovery in -rays by the Energetic Gamma Ray Experiment Telescope (EGRET) onboard the Compton Gamma Ray Observatory satellite (Catanese et al., 1997) and has been the target of several observational campaigns in the last two decades from radio to very high energies (e.g., Villata et al., 2002, 2009; Bach et al., 2006; Raiteri et al., 2010, 2013; Wierzcholska et al., 2015; Wehrle et al., 2016; Abeyesekara et al., 2018; Acciari et al., 2019, and the references therein).
After a strong -ray flaring activity detected by the Large Area Telescope (LAT) onboard the Fermi Gamma-Ray Space telescope (Ojha et al., 2020) and the MAGIC telescopes (Blanch, 2020) on 2020 August 19, BL Lacertae remains in a high activity in the following weeks and Swift observations performed on 2020 October 5 and 6 found the source at the historical maximum level in X-rays and in one of the brightest states observed in optical and ultraviolet (UV D’Ammando, 2020a, b). On 2020 October 6, the source reached the second highest daily averaged -ray flux observed from Fermi-LAT so far (Mereu, 2020). Following the historical maximum flux observed from optical to -rays, simultaneous NICER and NuSTAR follow-up observations have been requested. Preliminary results are presented in D’Ammando (2020c). Results about the multi-frequency campaign over the entire electromagnetic spectrum will be presented in a separate publication. In this paper, we focus on the Swift, Neutron star Interior Composition Explorer (NICER) and Nuclear Spectroscopic Telescope Array (NuSTAR) data of BL Lacertae collected during 2020 August–October. We present the observations and data reduction in Section 2. The results of analysis of the data collected by the three satellites separately and the joint fit of the NICER and NuSTAR X-ray data are shown in Sections 3 and 4, respectively. In Section 5, we discuss and summarize our results.
Unless stated otherwise, uncertainties correspond to 90 per cent confidence limits on one parameter of interest ( = 2.7). The photon indices are parameterized as with ( is the spectral index). Throughout this paper, we assume the following cosmology: , , and in a flat Universe (Ade et al., 2016). At the redshift of the source the luminosity distance DL is 307 Mpc.

2 Observations and data reduction
2.1 Swift observations
The Neil Gehrels Swift observatory satellite (Gehrels et al., 2004) carried out 33 observations of BL Lacertae between 2020 August 11 (MJD 59072) and October 16 (MJD 59138). The observations were performed with all three instruments onboard: the X-ray Telescope (XRT; Burrows et al., 2005, 0.2–10.0 keV), the Ultraviolet/Optical Telescope (UVOT; Roming et al., 2005, 170–600 nm), and the Burst Alert Telescope (BAT; Barthelmy et al., 2005, 15–150 keV).
XRT observations were performed in photon counting mode, except for the first observation performed on 2020 October 6 for which observations in windowed timing (WT) mode were carried out (for a description of XRT read-out modes, see Hill et al., 2004). The XRT spectra were generated with the Swift-XRT data product generator tool at the UK Swift Science Data Centre222http://www.swift.ac.uk/user_objects (for details, see Evans et al., 2009). Spectra having count rates higher than 0.5 counts s-1 may be affected by pile-up. To correct for this effect, the central region of the image has been excluded, and the source image has been extracted with an annular extraction region with an inner radius that depends on the level of pile-up (see e.g., Moretti et al., 2005).
The hard X-ray flux of this source is usually below the sensitivity of the BAT instrument for daily short exposures. Based on the Swift-BAT Hard X-ray Transient Monitor (Krimm et al., 2013)333https://swift.gsfc.nasa.gov/results/transients/weak/QSOB2200p420, considering daily light curves, only in three cases a detection with a significance 3 has been observed in the studied period, on 2020 August 28 (MJD 59089), September 1 (MJD 59093), and September 13 (MJD 59105), with a corresponding count rate of (3.97 1.11) 10-3, (4.54 1.27) 10-3, and (3.35 1.05) 10-3 counts cm-2 s-1, respectively. BL Lacertae is also included in the Swift-BAT 105-month hard X-ray catalogue (Oh et al., 2018), for observations carried out between 2004 December and 2013 August, with a photon index of = 1.76 .
During the Swift pointings, the UVOT instrument observed the sources in its optical (, , and ) and UV (, , and ) photometric bands (Poole et al., 2008; Breeveld et al., 2010). The UVOT data in all filters were analysed with the uvotimsum and uvotmaghist tasks and the 20201215 CALDB-UVOTA release. Source counts were extracted from a circular region of 5 arcsec radius centred on the source, while background counts were derived from a circular region with a 20 arcsec radius in a nearby source-free region. All UVOT exposures were checked for possible small-scale sensitivity problems, which occur when the source falls on small detector regions where the sensitivity is lower444https://swift.gsfc.nasa.gov/analysis/uvot_digest/sss_check.html.
2.2 NICER observations
The NICER (Gendreau et al., 2012) on the International Space Station observed BL Lacertae for a Discretionary Data Time (DDT) request (PI: D’Ammando; ObsIds: 3201820101 and 3201820102) between 2020 October 11 17:35:04 UTC and October 12 23:13:04 UTC (MJD 59133.73268519–59134.96740741) for an effective time of 14.7 ks. The NICER observations were reduced using NICERDAS v7a and the calibration files available in the CALDB release 20200727. Good time intervals (GTI) were generated using nimaketime to select events that occurred when the particle background was low (KP555KP is the space weather index Kennziffer Planetary (Bartels et al., 1939). KP is derived from a worldwide network of magnetometers: https://www.swpc.noaa.gov/products/planetary-k-index 5 and COR_SAX666The COR_SAX parameter estimates the magnetic cut-off rigidity. ), and avoiding times of high optical loading. Moreover, the NICER focal plane modules 34, 14, 43, and 54 show episodes of increased detector noise. Data from these detectors have been excluded from the final events file.
The background was estimated using the tool nibackgen3C50_v6 (Remillard et al., 2021)777https://heasarc.gsfc.nasa.gov/docs/nicer/tools/nicer_bkg_est_tools.html. Comparing the results to the background obtained using the tool nicer_bkg_estimator_v6 (Gendreau et al., in preparation), we did no find significant differences. The event file filtered using the GTI is loaded into XSELECT to extract the source spectrum and a 240 s light curve. The source spectrum is rebinned with a minimum of 20 counts per energy bin with grppha to allow for spectrum fitting.
2.3 NuSTAR observations
The NuSTAR (NuSTAR; Harrison et al., 2013) observed BL Lacertae for a DDT proposal (PI: D’Ammando; ObsId: 90601630002) between 2020 October 11 14:06:09 UTC and October 12 07:16:09 UTC (MJD 59133.58760417–59134.30288194) with its two coaligned X-ray telescopes with corresponding focal planes, focal plane module A (FPMA) and B (FPMB), for 30.7 and 30.4 ks, respectively. The level 1 data products were processed with the NuSTAR Data Analysis Software (nustardas) package (v1.9.2). Cleaned event files (level 2 data products) were produced and calibrated using standard filtering criteria with the nupipeline software module, and the OPTIMIZED parameter for the exclusion of the South Atlantic Anomaly (SAA) passages. We used the calibration files available in the NuSTAR CALDB version 20210202.
Spectra of the source were extracted for the whole observation from the cleaned event files using a circle of 30 pixel (70 arcsec) radius, while the background was extracted from a nearby circular region of 30 pixel radius on the same chip of the source. The choice of the extraction region size optimizes the signal-to-noise, but alternative choices do not affect the results. The ancillary response files were generated with the numkarf task, applying corrections for the point spread function losses, exposure maps, and vignetting. The spectra were rebinned with a minimum of 20 counts per energy bin to allow for spectrum fitting. The net count rate for the entire observation is 0.193 0.003 and 0.182 0.003 counts s-1 for FPMA and FPMB, respectively. The target is detected above the background in both the focal plan modules up to 75 keV.
The observation is also divided by orbits, identified by the satellite’s emergence from the SAA, as reported in the GTI file. The same procedure applied to the entire observation has been used for producing a spectrum for each satellite orbit.
3 Analysis results


3.1 Swift-XRT
The X-ray spectra collected by XRT in the 0.3–10 keV energy range are fitted by an absorbed power-law model using the photoelectric absorption model tbabs and set abundances according to Wilms et al. (2000) and vern cross-sections (Verner et al., 1996). The same abundances and cross-sections are also used for fitting the NICER and NuSTAR spectra later. The Galactic column density in the direction of the source has been initially fixed to = 2.701021 cm-2, in agreement with the value used in Madejski et al. (1999) and Weaver et al. (2020) (but see Section 5 for a discussion about the total hydrogen column density towards BL Lacertae). We used the spectral redistribution matrices in the Calibration data base maintained by HEASARC. The X-ray spectral analysis was performed using the XSPEC 12.9.1 software package (Arnaud et al., 1996). Data were grouped by single photons with grppha and the Cash statistics (Cash, 1979) is used. The results of the fits are reported in Table 3.
We plotted in Fig. 1 the X-ray flux (top panel) and photon index (bottom panel) estimated in the 0.3–10 keV energy range with XRT observations. The X-ray flux corrected for Galactic extinction varies between 1.0110-11 and 65.2810-11 erg cm-2 s-1, with a median value of 2.4210-11 erg cm-2 s-1. The corresponding variability amplitude, , calculated as the ratio of maximum to minimum flux, is 64.6. As a comparison, the estimated between 2012 October 27 and 2013 November 5, at the time of the 2012 December flare, was 6.7 (Wehrle et al., 2016). A similar variability amplitude ( 7) has been observed in X-rays considering the period 2008 August 4–2012 October 31 (Raiteri et al., 2013).
In addition, we estimated the fractional variability parameter, , for taking into account also the uncertainties on the flux. We followed the prescription given by Vaughan et al. (2003):
where denotes the average X-ray flux, denotes the standard deviation of the flux measurements and the mean squared error. The uncertainty of is estimated following Poutanen et al. (2008):
where is given by equation 11 in Vaughan et al. (2003):
We obtained = 0.44 0.02, confirming the very high variability of the source in X-rays during 2020 August–October and showing that such variability is not dominated by the uncertainties on the flux.
The photon index varies between 1.35 and 2.63, with a median value of = 1.95 0.12. A softer-when-brighter behaviour has been observed by XRT during 2020 August–October (see Fig. 2, left-hand panel). To statistically investigate whether X-ray data follow this trend, a correlation study between flux and photon index is performed, using the Spearman rank test. We obtain a Spearman rank order correlation coefficient rs = 0.71, indicating a strong correlation. For N = 33 observations, there is a 0.1 per cent probability that the null hypothesis is correct (p = 0.001), corresponding to a 99.9 per cent statistical significance.
The flux observed on 2020 October 6 is the historical maximum reached by the source in X-rays888See also https://www.swift.psu.edu/monitoring/source.php?source
=BLLacertae. As a comparison, the maximum 0.3–10 keV flux observed during the 2012 flaring activity was 8.0210-11 erg cm-2 s-1 (Wehrle et al., 2016). That value is not corrected for Galactic absorption, so for a direct comparison the peak flux observed on 2020 October 6 not corrected for Galactic absorption is (36.89 0.47) 10-11 erg cm-2 s-1, a factor of 4.5 higher than the 2012 peak flux.
Correcting for instrumental artefacts (i.e. hot pixels and bad columns on the CCD), pile-up, and after the background has been subtracted, we produced a light curve with time bins of 60 s for the XRT observation performed on October 6, i.e. at the peak of the activity (see Fig. 2, right-hand panel). A significant change of the count rate ( 3 )999The significance is calculated as CR/, where CR = count rate 1–count rate 2, and and are the corresponding uncertainties. has been observed in consecutive bins on a time-scale of 60 s. Following Saito et al. (2013), to calculate the minimum doubling/halving time-scale between two consecutive points we used = t ln2 / ln(CR(t2)/CR(t1)), where CR(t1) and CR(t2) are the count rate at time t1 and t2, respectively. We found = 274 s (256 s in the source rest frame)101010The corresponding exponential growth time-scale is /ln2 = 396 s.. This value should be considered an upper limit limited by the number of photons collected in light curves produced with shorter time bins. In case of the XRT light curve produced with time bins of 15 s (see Fig. 9), the minimum doubling/halving time is = 50 s (47 s in the source rest frame). However, episodes of change of the count rate between consecutive bins are detected only at a significance level of 2 3.
On 2020 October 6, using an absorbed power law with fixed to 2.701021 cm-2, we obtained a photon index of = 2.58 0.03 (/dof = 404.34/254), while leaving the free to vary a photon index of = 2.77 0.06 and = (3.8 0.4) 1021 cm-2 are obtained with a significant improvement of the fit (/dof = 264.46/253). Fixing the photon index to 2.58 and leaving the Galactic absorption free to vary, we obtained = (3.3 0.1) 1021 cm-2 with an intermediate quality of fit with respect to the previous two fits (/dof = 312.21/253).
We also summed the XRT observations carried out in two periods: (i) before the peak of the activity, i.e. 2020 September 6–25, for a total exposure of 6603 s; (ii) after the peak of the activity, i.e. 2020 October 11–16, for a total exposure of 8574 s. Fitting the spectra with an absorbed power law with fixed to 2.701021 cm-2, we obtained a photon index of = 2.08 0.06 (/dof = 101.40/90) and 1.71 0.07 (/dof = 73.32/72) for period (i) and (ii), respectively. Leaving the Galactic absorption value free to vary, we obtained = 1.94 0.10 and = (2.1 0.3) 1021 cm-2 (/dof = 94.63/89), and = 1.65 0.11 and = (2.4 0.5) 1021 cm-2 (/dof = 71.73/71) for period (i) and (ii), respectively. Fitting simultaneously the XRT spectra collected during the peak activity, periods (i) and (ii), fixing the photon index to 2.58, 2.08, and 1.71, respectively, and leaving the value free to vary, we obtained a value of (3.1 0.1) 1021 cm-2.
3.2 Swift-UVOT
Optical and UV observations obtained with the UVOT telescope simultaneously to XRT are useful to investigate variability properties, to build optical-to-X-ray SED at different epochs and to study the connection with the X-ray activity. The observed magnitudes of the source are reported in Table 4. Following Raiteri et al. (2013), we assumed a flux density of 2.89, 1.30, 0.36, 0.026, 0.020, and 0.017 mJy for the host galaxy in the , , , , , and bands. By considering the source extraction radius used, the host galaxy contribution contaminating the UVOT photometry is about 50 per cent of the total galaxy flux, and it is removed from the magnitude values for calculating the flux densities. UVOT flux densities are also corrected for dust extinction using the E(B–V) value of 0.291 from Schlafly & Finkbeiner (2011) and the extinction laws from Cardelli et al. (1989).
The variability amplitude estimated with the UVOT data is 3.32, 3.47, 3.60, 3.85, 4.39, 4.40 in the , , , , , bands, respectively, with an increasing variability going from the to the band. This behaviour has been already observed in this source (see e.g. Raiteri et al., 2010, 2013), confirming a dominant contribution of the beamed synchrotron emission from the jet with respect to the thermal emission from the accretion disc also in the UV band, differently from what is observed in some FSRQ (e.g., Raiteri et al., 2012; Orienti et al., 2020).
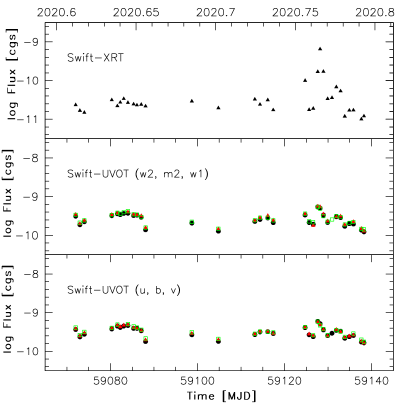
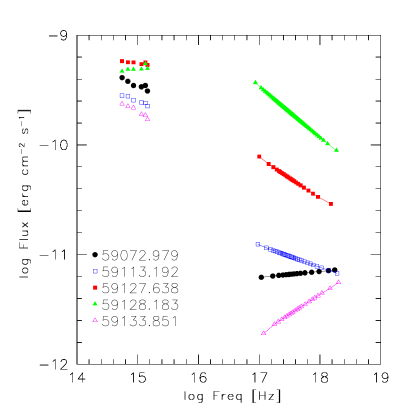
The unabsorbed flux densities corrected for the host galaxy contribution are plotted in Fig. 3 for a comparison with the unabsorbed X-ray fluxes observed during 2020 August–October. The source is less variable in optical and UV bands with respect to X-rays, showing a similar variability pattern in the three bands. It is interesting to notice that, although the flux density in optical and UV is high at the time of the peak of the X-ray activity (i.e., on August 6), the optical and UV activity peaked on August 5. This is in agreement with a significant shift of the synchrotron peak to higher frequencies, thus an increase of the contribution of the synchrotron component in the X-ray band passing from August 5 to 6, corresponding to a larger increase of the X-ray flux on August 6. Comparing the optical-to-X-ray SED of the source collected at different epochs (see Fig. 4), such a shift of the synchrotron peak is evident not only from August 5 to 6 but also between different activity states. With respect to the periods of relatively low activity, before (i.e. 2020 August 11; MJD 59072) and after (i.e. 2020 October 11; MJD 59133) the peak, at the time of the peak of the activity (i.e. 2020 October 5 and 6; MJD 59127 and MJD 59128) the optical–UV part of the SED is flatter, while the X-ray spectrum is softer ( 2).
3.3 NICER

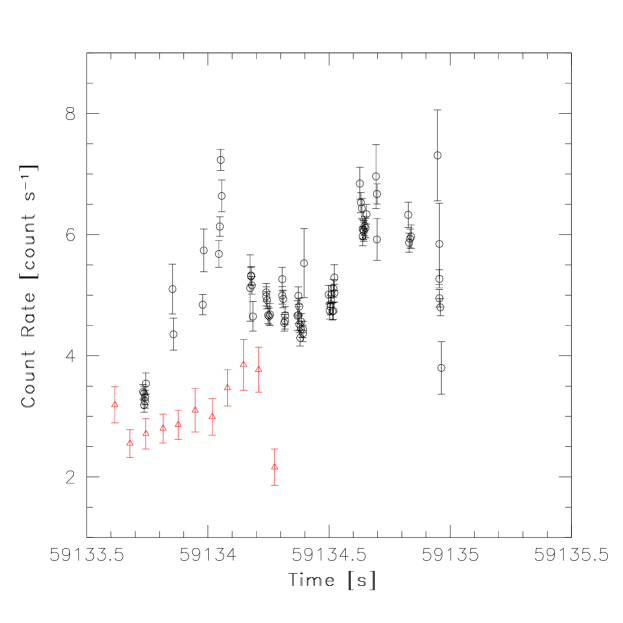
The source is detected above the background across the energy interval 0.4–5.0 keV, with an average count rate of 4.10 counts s-1. We produced a light curve using 240 s time bins (Fig. 5). The 0.4–5 keV light curve shows variability by factors of up to 2 across the observation, with the count rate varying between 3.15 and 7.30 counts s-1 and episodes of variability on time-scales of a few thousand seconds. In particular, there are three episodes of significant change of activity ( 3 ; see footnote 9) in consecutive bins of the light curve, with changes from 3.54 0.18 to 5.10 0.41 counts s-1 in 9120 s, from 6.13 0.16 to 7.23 0.17 counts s-1 in 240 s, and from 5.29 0.21 to 6.83 0.21 counts s-1 in 8840 s. It is particularly remarkable the increase of count rate observed in only 240 s considering that, differently from the other two cases, there are no observational gaps between the values estimated in consecutive bins. Assuming a redshift of = 0.069, the observed variability time-scale corresponds to 8531, 225, and 8269 s, respectively, in the source rest frame. The minimum doubling/halving time-scale for the NICER observations is = 1008 s (943 s in the source rest frame).

The NICER spectrum can be fitted in the 0.4–5.0 keV energy range with an absorbed power law with a photon index of = 2.06 0.01 and the Galactic absorption corresponding to a hydrogen column density fixed to = 2.701021 cm-2 (/dof = 527.11/457). A better fit can be obtained by using an absorbed log-parabola model with a slope = 2.10 0.02 and a negative curvature parameter of = 0.19 0.05, suggesting a concave X-ray spectrum (/dof = 490.80/456; see Fig. 6). Applying an F-test to compare the power-law and log-parabola models, we obtained a probability that the null hypothesis is true of 1.19-8. The corresponding flux (corrected for Galactic absorption) in the 0.3–10 keV/0.4–5.0 keV energy range is (1.62 0.01) 10-11 / (1.13 0.01) 10-11 erg cm-2 s-1. Compared to the XRT observations, the NICER observations have been carried out during an intermediate flux level (see Fig. 1, upper panel). Leaving the Galactic absorption value free to vary, in case of a log-parabola model, we found a slight improvement of the fit (/dof = 481.13/455) with larger uncertainties on the spectral parameters, = 2.32 0.12 and = 0.48 0.16, and = (3.1 0.3)1021 cm-2.
3.4 NuSTAR
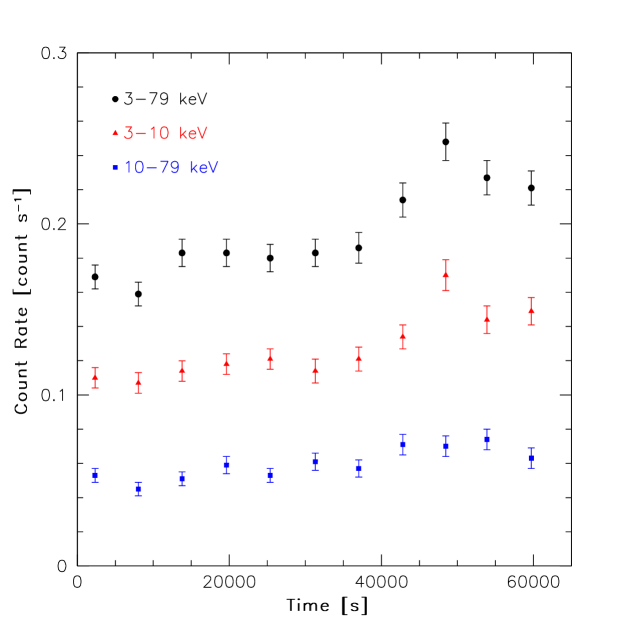
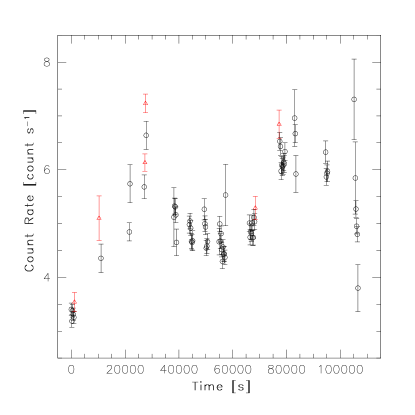
The NuSTAR observations extended over 11 satellite orbits. First, we investigated the behaviour orbit-by-orbit in the NuSTAR bandpass. A similar variability amplitude and behaviour have been observed by considering the count rate orbit-by-orbit in the 3.0–79, 3.0–10.0, and 10–79 keV energy range (see Fig. 10). For clarity, only the count rate from FPMA is shown. Data from FPMB showed a similar situation.
By fitting the spectra obtained for each orbit with a simple power law and fixed to 2.701021 cm-2, the photon index ranges between 1.44 and 1.63, with an average value of 1.54 and no significant variability observed within the uncertainties. The corresponding 3–79 keV fluxes range between 2.5510-11 and 3.8510-11 erg cm-2 s-1, with an average value of 3.0410-11 erg cm-2 s-1 and an increase up to 50 per cent of the flux over the observation (see Table 1 and Fig. 7, left-hand panel). A significant (3 ) change of flux has been observed between the last two orbits, in particular on a time-scale of 5844 s (5468 s in the source rest frame). The minimum doubling/halving time-scale considering the orbit-by orbit NuSTAR observations is = 17650 s (16510 s in the source rest frame).
Previous NuSTAR observations of the source have been carried out in 2012 and 2019. During 2012 December 11–12, the orbit-by-orbit photon index varied between 1.81 and 1.93 with an average value of 1.86, and flux changes of up to 30 per cent (Wehrle et al., 2016). The 3–7 keV flux varied between 1.1 and 1.310-11 erg cm-2 s-1. As a comparison, in our observation, the 3–7 keV flux varies between 3.6 and 5.510-12 erg cm-2 s-1, a factor of 2–3 lower than the 2012 fluxes. On the contrary, during 2019 September 14–19, the 3–79 flux of the source estimated orbit-by-orbit has been lower than that in 2020 with values between 0.86 and 1.9710-11 erg cm-2 s-1, and the photon index ranged between 1.56 and 2.15 with an average value of 1.87 (Weaver et al., 2020). Therefore, compared to previous NuSTAR observations, the 2020 observations showed an intermediate hard X-ray flux between 2019 and 2012 observations and a harder photon index with respect to both of them.
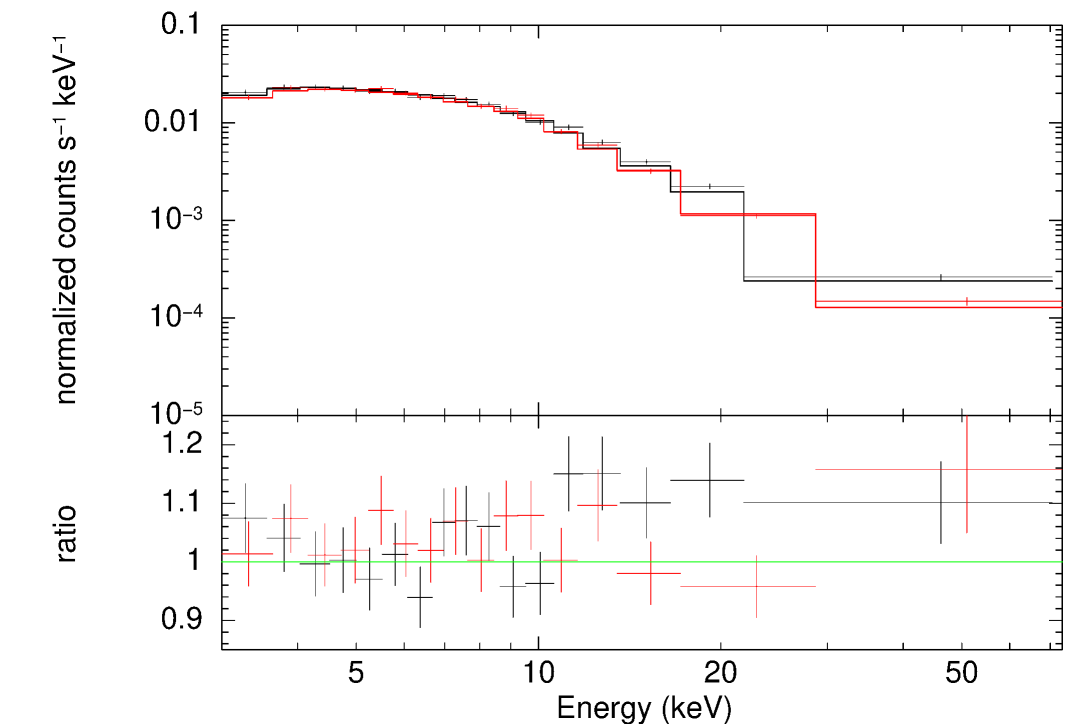
We fitted the overall NuSTAR spectrum by using a simple power law and a log-parabola model, assuming = 2.701021 cm-2. We also included a cross-normalization factor for FPMB with respect to FPMA that resulted in all cases 5 per cent, consistent with the expectations from calibration observations (Madsen et al., 2015). The simple power-law model gives acceptable results with a /dof of 452.85/458 and a photon index of = 1.59 0.03 (see Fig. 7, right-hand panel). The corresponding 3–79 keV flux is (2.97 )10-11 erg cm-2 s-1. A comparable quality of fit has been obtained by using a log-parabola model (/dof = 452.84/457) with a slope = 1.59 0.04 and a negligible curvature parameter of = 0.003 0.010. Fitting the spectrum with a broken power-law model does not improve the fit in this case either. No obvious spectral break is determined within the NuSTAR bandpass.
| Orbit | Net exposure time | Count rate | Photon index | Flux |
|---|---|---|---|---|
| (s) | (counts s-1) | () | (10-11 erg cm-2 s-1) | |
| 1 | 3196 | 0.169 0.007 | 1.44 0.14 | 3.19 0.30 |
| 2 | 3205 | 0.159 0.007 | 1.57 0.13 | 2.55 0.23 |
| 3 | 3168 | 0.183 0.008 | 1.57 0.13 | 2.71 0.25 |
| 4 | 3193 | 0.183 0.008 | 1.60 0.12 | 2.80 0.24 |
| 5 | 3151 | 0.180 0.008 | 1.53 0.14 | 2.86 0.24 |
| 6 | 2770 | 0.183 0.008 | 1.47 0.17 | 3.10 0.36 |
| 7 | 2558 | 0.186 0.009 | 1.57 0.14 | 2.99 0.30 |
| 8 | 2422 | 0.214 0.010 | 1.53 0.16 | 3.47 0.30 |
| 9 | 2298 | 0.248 0.011 | 1.57 0.13 | 3.85 0.42 |
| 10 | 2235 | 0.227 0.010 | 1.50 0.15 | 3.77 0.37 |
| 11 | 2521 | 0.221 0.010 | 1.63 0.15 | 2.16 0.30 |
4 Joint NICER and NuSTAR fit
| Model | Parameter | Value |
| Power-law | 1.98 0.01 | |
| (cm-2) ∗ | 2.701021 * | |
| Cross-normalization FPMA/FPMB | 1.06 0.03 | |
| Cross-normalization FPMA/NICER | 0.76 0.02 | |
| /dof | 1453.19/916 | |
| Log-parabola | ||
| 0.25 0.02 | ||
| (cm-2) ∗ | 2.701021 * | |
| Cross-normalization FPMA/FPMB | 1.05 0.03 | |
| Cross-normalization FPMA/NICER | 0.89 0.03 | |
| /dof | 972.44/915 | |
| Two power-laws | ||
| (cm-2) ∗ | 2.701021 * | |
| Cross-normalization FPMA/FPMB | 1.09 0.05 | |
| Cross-normalization FPMA/NICER | 0.84 0.04 | |
| /dof | 1011.70/914 | |
| Broken power-law | 2.10 0.02 | |
| (keV) | 2.67 | |
| 1.60 | ||
| (cm-2) ∗ | 2.701021 * | |
| Cross-normalization FPMA/FPMB | 1.05 0.03 | |
| Cross-normalization FPMA/NICER | 0.97 0.04 | |
| /dof | 954.69/914 | |
| Broken power-law | 2.04 | |
| (keV) | 3.01 | |
| 1.60 | ||
| (cm-2) | 2.59 1021 | |
| Cross-normalization FPMA/FPMB | 1.05 0.03 | |
| Cross-normalization FPMA/NICER | 0.96 0.04 | |
| /dof | 953.17/913 |
To investigate in detail the broad band X-ray spectrum of BL Lacertae, a joint fit to the lower energy NICER and higher energy NuSTAR data is performed. The combination of NICER and NuSTAR observations is important for characterizing the broad band spectrum and estimating the value of total hydrogen column density towards the source, not well determined so far. The NICER spectrum has a much better statistics than the Swift-XRT spectra collected on October 11 and 12 (74319 counts vs. 538 counts and 157 counts); for this reason, the XRT data are not used. The Galactic column density has been initially set to 2.701021 cm-2. A cross-normalization factor between the NICER and NuSTAR instruments has been added for taking into account differences in the absolute flux calibration and the slight offset of the observing times. A comparable median count rate is observed in the NICER light curve for the period simultaneous to the NuSTAR observation (4.94 counts s-1) and just after that (5.01 counts s-1; see Fig. 11), justifying the use of the entire NICER observation for the fitting. A simple power-law, a log-parabola, two power-laws, and a broken power-law model has been applied for the joint fitting of the NICER and NuSTAR data. The fitting results are summarized in Table 2.
The joint spectrum cannot be well represented from 0.4 to 79 keV by a simple power law with a photon index = 1.98 0.01 (/dof = 1453.19/916). A log-parabola model has been also tested, with the pivot energy fixed at 1 keV, and the fit significantly improves (/dof = 972.44/915) with a slope = 2.11 0.02 and a negative curvature = 0.25 0.02, suggesting a concave spectrum as in the case of the fit of the NICER spectrum alone. By applying an F-test, we obtain a probability of 7.010-82 that the null hypothesis is true. Using two power-law models, the quality of the fit is worse than the case of the log-parabola model (/dof = 1011.70/914), with the photon index of the second power law very hard ( = 0.87).
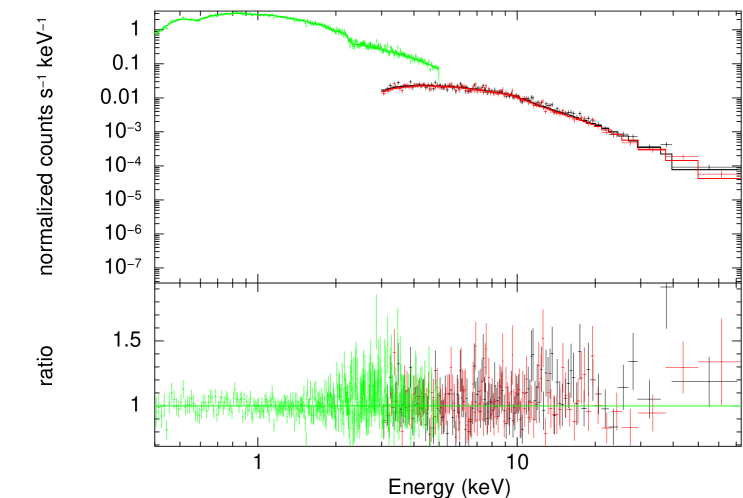
A further improvement of the fit is obtained by using a broken power-law model (/dof = 954.69/914). By applying an F-test, the improvement of the fit using a broken power law with respect to a power law is even more significant than a log-parabola model, with a probability that the null hypothesis is true of 4.110-84. We obtained photon indices of = 2.10 0.02 and = 1.60 0.03 below and above an energy break = 2.67 , respectively. The exposure of NICER and NuSTAR significantly overlapped, in agreement also with the cross-normalization obtained (0.97 0.04 between FPMA and NICER). Fig. 8 shows the joint fit to the NICER and NuSTAR data for the simultaneous observations performed on 2020 October 11–12.
Previous NuSTAR observations of the source in 2012 and 2019 have been carried out contemporaneously to Swift-XRT observations, and the value has not been left free to vary during the fitting procedure, probably due to the small number of counts collected by XRT in the low-energy part of the X-ray spectrum. Thanks to the NICER observations, we are able to test the total hydrogen column density for BL Lacertae combining the NICER and NuSTAR observations over a broad band energy range. Leaving the Galactic total absorption free to vary, the fit marginally improved (/dof = 953.17/913), with = (2.59 )1021 cm-2 (see Table 2). Fixing the spectral parameters of the broken power-law model (, , ) and leaving the Galactic total absorption free to vary, we obtained = (2.69 )1021 cm-2 with a comparable quality of the fit (/dof = 954.54/916).
5 Discussion and conclusions
Considering the large flaring activity of BL Lacertae observed from optical to -rays during 2020 August–October, that is an important possibility to study in detail the spectrum of the source at different frequencies. In this paper, we have analysed the X-ray data collected by Swift-XRT, NICER, and NuSTAR. These data allowed us to investigate the spectral and flux variability on different time-scales and to characterize in detail the broad band energy range of the source from 0.4 to 79 keV. We have reported the results of the first NICER observation of the source and, more generally, the first NICER and NuSTAR simultaneous follow-up observations of a -ray flaring blazar.
Swift-XRT monitored BL Lacertae between 2020 August 11 and October 16, observing on October 6 the historical maximum activity from this source in X-rays, with an unabsorbed flux of 6.5310-10 erg cm-2 s-1 and a corresponding luminosity of (7.86 0.08) 1045 erg s-1 in the 0.3–10 keV energy range. The estimated over the period 2020 August–October is 64.6, a factor of 10 higher than the value observed at the time of the 2012 flaring activity, clearly indicating how exceptional is the X-ray flaring activity observed in 2020 October.
Moreover, considering the Swift-XRT monitoring of other 10 bright -ray BL Lacs during 2004 December–2012 August, only Mrk 421 has shown a variability amplitude ( = 81.5; Stroh et al., 2013) larger than the value estimated in 2020 for BL Lacertae. However, Mrk 421 is an HBL with a peak of the synchrotron emission usually in the soft X-ray energy range; therefore, even assuming the same level of activity, a larger variability amplitude is expected in that energy range for Mrk 421 with respect to IBL/LBL sources, like BL Lacertae. A similar variability pattern has been observed with XRT and UVOT in optical, UV, and X-rays with less variability in optical and UV bands with respect to the X-ray one.
During the XRT monitoring of BL Lacertae, we observed a softer-when-brighter behaviour in X-rays, with the photon index ranges between 1.35 and 2.63. This behavior can be related to an increasing importance of the synchrotron emission in the X-ray part of the spectrum covered by XRT during bright states, likely due to a shift of the synchrotron and IC peaks to higher frequencies (see Fig. 4). In this context, we noticed that an X-ray photon index higher than 2.2 (see Table A1) has been estimated in the two XRT observations close to the VHE detection of the source reported by the MAGIC telescopes on 2020 August 19 (Blanch, 2020) and September 19 (Blanch, 2020, ; see the SED collected on 2020 September 21, MJD 59113, in Fig. 4), in agreement with a shift of both the SED peaks to higher frequencies in these periods. A similar softer-when-brighter behaviour has been reported in Weaver et al. (2020), when 40 XRT observations of BL Lacertae have been carried out between 2019 September 14 and 19. In that period, the fluxes were lower than the values observed in 2020 August–October [i.e. (3.110-12) – (1.810-11) erg cm-2 s-1] with the photon index ranges from 1.79 to 2.72. A strong softer-when-brighter spectral variability pattern has been observed in OJ 287 (Komossa et al., 2017, 2021), a BL Lac object classified as LSP or ISP, similarly to BL Lacertae. On the contrary, a harder-when-brighter behaviour for BL Lacertae has been reported by Wehrle et al. (2016) during the 2012 flaring activity. This can be an indication that different emission mechanisms and/or changes of distinct jet parameters are at work in the source during different flaring activities. The combination of the data analysed here with other multi-wavelength data collected during this period, in particular by Fermi-LAT and MAGIC, will be important to study in detail this behaviour.
Rapid variability in soft X-rays has been observed with both Swift-XRT and NICER in 2020 October. In particular, at the peak of the activity (October 6) a minimum variability time-scale of 60 s and a doubling time-scale of 274 s (256 s in the source rest frame) have been observed by XRT. Based on causality argument, it is possible to constrain the intrinsic size of the emitting region to be R /(1+), where is the minimum doubling time-scale observed and is the Doppler factor. Assuming a typical Doppler factor of = 15 (see e.g. Raiteri et al., 2013), we obtain R 1.11014 cm. NICER observations performed during an intermediate X-ray flux level, a few days after the peak of activity, observed a minimum variability time-scale of 240 s and a doubling time-scale of 1008 s (943 s in the source rest frame). This corresponds to an emitting region R 4.01014 cm.
The light-crossing time for a Kerr black hole is tlc = 2G MBH / = 2103 (MBH/108 M⊙) s. Assuming a black hole mass of MBH = 1.7108 M⊙ for BL Lacertae (Woo et al., 2002), we have tlc = 3400 s. After considering the relativistic Doppler effect, we have tlc/, and thus for = 15 we obtain 227 s, comparable to the minimum doubling time-scale observed by Swift-XRT on October 6 for the light curve produced with time bins of 60 s. However, a hint of shorter doubling time-scale (i.e. 50 s) has been observed inspecting the light curve produced with 15 s time bins. A Doppler factor significantly higher, i.e. 70, is needed to reconcile the light-crossing times of the black hole with such a short variability time-scale. We are in a similar situation if we assume a black hole mass of MBH 5108 M⊙, as obtained by Ghisellini et al. (2010) and Falomo et al. (2003). The rapid increase of the X-ray activity observed by XRT can indicate that in case of short time-scale variability the size of the black hole is not a hard lower limit on the physical size of the emitting region. In fact, the time-scales observed by XRT suggest that the emission is not produced by the entire jet but by compact regions within the jet. Different scenarios can explain such a small compact region: ‘jet-in-a-jet models’ including ultra-relativistic outflow of material from magnetic reconnection sites (e.g., Giannios et al., 2009) or relativistic turbulence in the jet (e.g., Narayan et al., 2012), or turbulent extreme multi-zone models (e.g., Marscher et al., 2014). In 1999 June, BeppoSAX observed that the soft X-ray flux of the source doubled on a time-scale of 20 m (Ravasio et al., 2002). Therefore, the minimum variability time-scales observed in 2020 October by Swift-XRT and NICER in the soft X-ray band are the most extreme observed from this source so far. More generally, fast X-ray variability has not been revealed in a large number of blazars (e.g., Pryal et al., 2015). This can be related to the fact that follow-up X-ray observations with different satellites are usually carried out from 1 d to a few days after the peak of the -ray flaring activity. In this way, we are usually observing the source in a high state but not at the peak of the activity when the variability would be extreme.
At hard X-rays, NuSTAR observed a significant variability between two satellite’s orbits (5.8 ks), with a doubling time-scale of 17650 s (16510 s in the source rest frame). Previous NuSTAR observations in 2019 have shown a variability time-scale significantly longer of 14.5 h (Weaver et al., 2020).
The joint NICER and NuSTAR spectrum is well described by a broken power-law model with photon indices = 2.10 0.02 and = 1.60 0.03 below and above an energy break = 2.67 , respectively. There is a significant difference of the photon index estimated in the NICER and NuSTAR observations alone, in agreement with the results obtained for the joint spectrum applying a broken power-law model. This should be related to the presence of the high-frequency end of the synchrotron emission below a few keV, and the IC component dominating the emission at higher energies. The contemporaneous NuSTAR and Swift-XRT spectra of BL Lacertae collected on 2012 December 11–12, during another flaring activity, are well described by a broken power-law model with a photon index of 3.3 and 1.88 0.01 below and above an energy break of 1.0 0.2 keV (Wehrle et al., 2016). On the contrary, during the 2019 low-activity state no statistically significant improvement has been obtained for a broken power-law model over a single power-law model (Weaver et al., 2020).
This source has been observed with several X-ray satellites in the past. Previous observations with ASCA (Sambruna et al., 1999) and BeppoSAX (Ravasio et al., 2003) have shown that a broken power law is statistically preferred over a single power-law model (Sambruna et al., 1999). In case of three XMM-Newton observations carried out in 2007–2008, a double power-law model represents better the 0.3–10 keV spectra with respect to a single power-law model (Raiteri et al., 2009). In that case, the photon indices of the two power-laws are = 2.48–2.58 and = 1.51–1.72, in agreement with the two photon indices obtained below and above the energy break of the joint fitting of the NICER and NuSTAR spectra with a broken power-law model presented here.
The shape of the X-ray spectrum of BL Lacertae also depends on the Galactic absorption assumed. The amount of absorption due to molecular hydrogen is not directly measurable, making the estimation of the total absorption along our line of sight uncertain. The Galactic atomic hydrogen column density towards BL Lacertae is = 1.751021 cm-2, as obtained by the HI4PI survey (Ben Bekhti et al., 2016). Approximately the same amount of Galactic atomic hydrogen column density has been previously estimated with the Leiden/Argentine/Bonn (LAB) survey (1.731021 cm-2; Kalberla et al., 2005). However, observations of local interstellar CO have shown the presence of a Galactic molecular cloud towards the source (e.g., Bania et al., 1991; Liszt et al., 1998). The total hydrogen column density towards BL Lacertae () is thus composed by the atomic hydrogen column density, , and the molecular column density, . The estimation of the amount of reported in literature changes significantly depending on the X-ray satellites used, from 0.51021 cm-2 using the ASCA data (Madejski et al., 1999) to 1.71021 cm-2 (Raiteri et al., 2009) using the XMM-Newton data.
According to Liszt et al. (1998), the column density of the molecular cloud is (8.48 0.78) 1014 cm-2. Assuming that the molecular hydrogen column density is usually (1–2) times the one (see e.g., Liszt, 2007), the estimation of hydrogen column density due to the molecular cloud varies between 7.71020 and 18.6 cm-2. This results in a total hydrogen column density towards BL Lacertae of (2.52–3.61)1021 cm-2. However, the CO component can provide only very approximately about the molecular component of the gas. Moreover, the value also depends on the ratio and therefore to the corresponding uncertainties. Finally, a change of 14 per cent of the equivalent width of the H2CO absorption lines along the line of sight of BL Lacertae in 2 yr has been reported by Moore et al. (1995), suggesting possible variability of the molecular column density. The best way to estimate the value of in BL Lacertae is to have an observation with a large number of counts, and covering a broad energy range. For this reason, the joint NICER and NuSTAR spectrum collected on 2020 October 11–12 is ideal for such a kind of study. Leaving the total Galactic absorption free to vary and using a broken power-law model, we obtain an = (2.59 ) 1021 cm-2.
By applying the relationship between dust-emission-derived reddening E(B-V) and hydrogen column density, = 8.3 1021 cm-2E(B-V), and using E(B-V) = 0.316 mag, we obtain 2.621021 cm-2, comparable to the value obtained by the NICER and NuSTAR joint fit.
Further X-ray observations of blazars in high-activity periods for long exposures and over a broad band energy range, as assured by the combination of NICER and NuSTAR observations, are fundamental to better characterize the X-ray spectrum of these sources and to perform searches for rapid X-ray variability. In this context, this study has shown that NICER can be also important for blazar science, even more if combined with the NuSTAR data at hard X-rays.
Acknowledgements
We thank the NuSTAR PI, Fiona Harrison, for approving the DDT request, and the NuSTAR SOC for carrying out the observation and the excellent support.
We thank the NICER PI, Keith Gendreau, and the operation team for the rapid approval and execution of the DDT request. We thank the Swift team for making these observations possible, the PI, Brad Cenko, the duty scientists, and science planners.
This research has made use of the XRT Data Analysis Software (XRTDAS). This work made use of data supplied by the UK Swift Science Data Centre at the University of Leicester. This research has made use of data obtained through the High Energy Astrophysics Science Archive Research Center Online Service, provided by the NASA/Goddard Space Flight Center. This research has made use of the NASA/IPAC Extragalactic Database (NED), which is operated by the Jet Propulsion Laboratory, California Institute of Technology, under contract with the National Aeronautics and Space Administration. We thank the second referee, Dirk Grupe, for constructive comments and suggestions.
Data Availability
The data underlying this article are available in Swift Archive Download Portal at the UK Swift Science Data Centre (https://www.swift.ac.uk/swift_portal/) and the HEASARC database (https://heasarc.gsfc.nasa.gov/docs/archive.html).
References
- Abeyesekara et al. (2018) Abeysekara, A. U., et al. 2018, ApJ, 856, 95
- Abdo et al. (2010) Abdo, A. A., et al. 2010, ApJ, 716, 30
- Acciari et al. (2019) Acciari, V. A., et al. 2019, A&A, 623, A175
- Ade et al. (2016) Ade, P. A. R., et al. 2016, A&A, 594, A13
- Ajello et al. (2020) Ajello, M., et al. 2020, ApJ, 892, 105
- Arnaud et al. (1996) Arnaud, K. A. 1996, in Jacoby G. H., Barnes J., eds, ASP Conf. Ser. Vol. 101, Astronomical Data Analysis Software and Systems V. Astron. Soc. Pac., San Francisco, p. 17
- Bach et al. (2006) Bach, U., et al. 2006, A&A, 456, 105
- Bania et al. (1991) Bania, T. M., Marscher, A. P., Barvainis, R. 1991, AJ, 101, 2147
- Bartels et al. (1939) Bartels, J., Heck, N. H., Johnston, H. F. 1939, J. Geophys. Res., 44, 411
- Barthelmy et al. (2005) Barthelmy, S. D., et al. 2005, Space Sci. Rev., 120, 143
- Ben Bekhti et al. (2016) Ben Bekhti, N., et al., 2016, A&A, 594, A116
- Blanch (2020) Blanch, O. 2020a, The Astronomer’s Telegram, 13963
- Blanch (2020) Blanch, O. 2020b, The Astronomer’s Telegram, 14032
- Breeveld et al. (2010) Breeveld, A. A., et al. 2010, MNRAS, 406, 1687
- Burrows et al. (2005) Burrows, D. N., et al. 2005, Space Sci. Rev., 120, 165
- Capetti et al. (2010) Capetti, A., Raiteri, C. M., Buttiglione, S. 2010, A&A, 516, A59
- Cardelli et al. (1989) Cardelli, J. A., Clayton, G. C., Mathis, J. S. 1989, ApJ, 345, 245
- Cash (1979) Cash, W. 1979, ApJ, 228, 939
- Catanese et al. (1997) Catanese, M., et al. 1997, ApJ, 480, 562
- D’Ammando (2020a) D’Ammando, F. 2020a, The Astronomer’s Telegram, 14065
- D’Ammando (2020b) D’Ammando, F. 2020b, The Astronomer’s Telegram, 14069
- D’Ammando (2020c) D’Ammando, F. 2020c, The Astronomer’s Telegram, 14096
- Evans et al. (2009) Evans, P. A., et al. 2009, MNRAS, 397, 1177
- Falomo et al. (2003) Falomo, R., Carangelo, N., Treves, A. 2003, MNRAS, 343, 505
- Gehrels et al. (2004) Gehrels, N., et al. 2004, ApJ, 611, 1005
- Gendreau et al. (2012) Gendreau, K. C., Arzoumanian, Z., Okajima, T. 2012, in Takahashi T., Murray S. S., Herder J.-W. A. d., eds, Proc. SPIE Conf. Ser. Vol. 8443, Space Telescopes and Instrumentation 2012: Ultraviolet to Gamma Ray. SPIE, Bellingham, p. 13
- Ghisellini et al. (2010) Ghisellini, G., et al. 2010, MNRAS, 402, 497
- Giannios et al. (2009) Giannios, D., Uzdensky, D. A., Begelman, M. C. 2009, MNRAS, 395, L29
- Harrison et al. (2013) Harrison, F. A., et al. 2013, ApJ, 770, 103
- Hill et al. (2004) Hill, J. E., et al. 2004, in Flanagan K. A., Siegmund O. H. W., eds, Proc. SPIE Conf. Ser. Vol. 5165, X-ray and Gamma-Ray Instrumentation for Astronomy XIII. SPIE, Bellingham, p. 217
- Kalberla et al. (2005) Kalberla, P. M. W., Burton, W. B., Hartmann, D., Arnal, E. M., Bajaja, E., Morras, R., Pöppel, W. G. L. 2005, AA, 440, 775
- Komossa et al. (2017) Komossa, S., et al. 2017, Proc. IAU Symp. 324, New Frontiers in Black Hole Astrophysics. Kluwer, Dordrecht, p. 168
- Komossa et al. (2021) Komossa, S., et al. 2021, MNRAS, 504, 5575
- Krimm et al. (2013) Krimm, H., et al. 2013, ApJS, 209, 14
- Liszt et al. (1998) Liszt, H. S., & Lucas, R. 1998, A&A, 339, 561
- Liszt (2007) Liszt, H. S. 2007, A&A, 476, 291
- Madsen et al. (2015) Madsen, K. K., et al. 2015, ApJS, 220, 8
- Madejski et al. (1999) Madejski, G. M., Sikora, M., Jaffe, T., Blazejowski, M., Jahoda, K., Moderski, R. 1999, ApJ, 521, 145
- Marscher et al. (2014) Marscher, A. P. 2014, ApJ, 780, 87
- Mereu (2020) Mereu, I. 2020, The Astronomer’s Telegram, 14072
- Miller & Hawley (1997) Miller, J. S., & Hawley, S. A. 1997, ApJ, 212, 47
- Moore et al. (1995) Moore, E. M., & Marscher, A. P. 1995, 452, 671
- Moretti et al. (2005) Moretti, A., et al. 2005, in Siegmund O. H. W., ed., Proc. SPIE Conf. Ser. Vol. 5898, UV, X-ray, and Gamma-Ray Space Instrumentation for Astronomy XIV. SPIE, Bellingham, p. 360
- Narayan et al. (2012) Narayan, R., & Piran, T. 2012, MNRAS, 420, 604
- Nilsson et al. (2018) Nilsson, K., et al. 2018, A&A, 620, A185
- Ojha et al. (2020) Ojha, R., & Valverde, J. 2020, The Astronomer’s Telegram, 13964
- Oh et al. (2018) Oh, K., et al. 2018, ApJS, 235, 4
- Orienti et al. (2020) Orienti, M., D’Ammando, F., Giroletti, M., Dallacasa, D., Giovannini, G., Ciprini, S. 2020, MNRAS, 491, 858
- Padovani et al. (1995) Padovani, P., & Giommi, P. 1995, ApJ, 444, 567
- Poutanen et al. (2008) Poutanen, J., Zdziarski, A. A., Ibragimov, A. 2008, MNRAS, 389, 1427
- Poole et al. (2008) Poole, T. S., et al. 2008, MNRAS, 383, 627
- Pryal et al. (2015) Pryal, M., Falcone, A., Stroh, M. 2015, ApJ, 802, 33
- Raiteri et al. (2009) Raiteri, C. M., et al. 2009, A&A, 507, 769
- Raiteri et al. (2010) Raiteri, C. M., et al. 2010, A&A, 524, A43
- Raiteri et al. (2012) Raiteri, C. M., et al. 2012, A&A, 545, A48
- Raiteri et al. (2013) Raiteri, C. M., et al. 2013, MNRAS, 436, 1530
- Ravasio et al. (2002) Ravasio, M. et al. 2002, A&A, 383, 763
- Ravasio et al. (2003) Ravasio, M., Tagliaferri, G., Ghisellini, G., Tavecchio, F., Bottcher, M., Sikora, M. 2003, A&A, 408, 479
- Remillard et al. (2021) Remillard, R. A., et al. 2021, AJ submitted [arXiv: 210509901]
- Roming et al. (2005) Roming, P. W. A., et al. 2005, Space Sci. Rev., 120, 95
- Saito et al. (2013) Saito, S., Stawarz, L., Tanaka, Y. T., Takahashi, T., Madejski, G., D’Ammando, F. 2013, ApJ, 766, L11
- Sambruna et al. (1999) Sambruna, R. M., Ghisellini, G., Hooper, E., Kollgaard, R. I., Pesce, J. E., Urry, C. M. 1999, ApJ, 515, 140
- Schlafly & Finkbeiner (2011) Schlafly, E. F., & Finkbeiner, D. P. 2011, ApJ, 737, 103
- Stickel et al. (1991) Stickel, M., Padovani, P., Urry, C. M., Fried, J. W., Kuehr, H. 1991, ApJ, 374, 431
- Stroh et al. (2013) Stroh, M. C, Falcone, A. D. 2013, ApJS, 207, 28
- Tavecchio et al. (1998) Tavecchio, F., Maraschi, L., Ghisellini, G. 1998 ApJ, 509, 608
- Tavecchio et al. (2010) Tavecchio, F., Ghisellini, G., Bonnoli, G., Ghirlanda, G. 2010, MNRAS, 405, L94
- Ulrich et al. (1997) Ulrich, M.-H., Maraschi, L., Urry, C. M. 1997, ARA&A, 35, 445
- Vaughan et al. (2003) Vaughan, S., et al. 2003, MNRAS, 345, 1271
- Vermeulen et al. (1995) Vermeulen, R. C., Ogle, P. M., Tran, H. D., Browne, I. W. A., Cohen, M. H., Readhead, A. C. S., Taylor, G. B., Goodrich, R. W. 1995, ApJ, 452, L5
- Verner et al. (1996) Verner, D. A., Ferland, G. J., Korista, K. T., Yakovlev, D. G. 1996, ApJ, 465, 487
- Villata et al. (2002) Villata, M., et al. 2002, A&A, 390, 407
- Villata et al. (2009) Villata, M., et al. 2009, A&A, 501, 455
- Wagner et al. (1995) Wagner, S., & Witzel, A. 1995, ARA&A, 33, 163
- Weaver et al. (2020) Weaver, Z. R., et al. 2020, ApJ, 900, 137
- Wehrle et al. (2016) Wehrle, A., et al. 2016, ApJ, 816, 53
- Wierzcholska et al. (2015) Wierzcholska, A., Ostrowski, M., Stawarz, L., Wagner, S., Hauser, M. 2015, A&A, 573, A69
- Wilms et al. (2000) Wilms, J., Allen, A., McCray, R. 2000, ApJ, 542, 914
- Woo et al. (2002) Woo, J.-H., & Urry, C. M. 2002, ApJ, 579, 530
Appendix A Swift results
A.1 Swift-XRT
| MJD | Date | Net exposure time | Photon index | Flux |
|---|---|---|---|---|
| (UT) | (s) | () | (10-11 erg cm-2 s-1) | |
| 59072.013301 | 2020-08-11 | 1144 | 1.95 0.15 | 2.36 0.26 |
| 59072.979057 | 2020-08-11 | 2460 | 1.73 0.12 | 1.67 0.16 |
| 59074.007524 | 2020-08-13 | 1089 | 1.78 0.18 | 1.49 0.21 |
| 59080.300875 | 2020-08-19 | 986 | 2.19 0.13 | 3.16 0.29 |
| 59081.600112 | 2020-08-20 | 974 | 1.76 0.16 | 2.20 0.29 |
| 59082.265103 | 2020-08-21 | 979 | 1.87 0.15 | 2.74 0.30 |
| 59083.054394 | 2020-08-22 | 979 | 1.87 0.14 | 3.40 0.37 |
| 59084.018388 | 2020-08-23 | 652 | 1.82 0.18 | 2.70 0.37 |
| 59085.319328 | 2020-08-24 | 1199 | 1.95 0.15 | 2.45 0.27 |
| 59086.086696 | 2020-08-25 | 854 | 2.08 0.17 | 2.32 0.27 |
| 59087.077198 | 2020-08-26 | 814 | 1.90 0.17 | 2.41 0.30 |
| 59088.073026 | 2020-08-27 | 697 | 1.88 0.19 | 2.18 0.32 |
| 59098.704090 | 2020-09-06 | 609 | 1.60 0.18 | 2.92 0.44 |
| 59104.806412 | 2020-09-12 | 922 | 1.74 0.18 | 1.96 0.31 |
| 59113.191735 | 2020-09-21 | 1983 | 2.20 0.10 | 3.27 0.22 |
| 59114.367874 | 2020-09-22 | 864 | 2.22 0.18 | 2.42 0.15 |
| 59116.151464 | 2020-09-24 | 817 | 2.25 0.15 | 3.14 0.16 |
| 59117.420004 | 2020-09-25 | 1408 | 1.95 0.16 | 1.74 0.20 |
| 59124.730783 | 2020-10-02 | 984 | 2.48 0.11 | 9.99 0.70 |
| 59125.655695 | 2020-10-03 | 989 | 1.93 0.18 | 1.76 0.23 |
| 59126.597595 | 2020-10-04 | 135 | 2.59 0.50 | 1.90 0.74 |
| 59127.638321 | 2020-10-05 | 989 | 2.37 0.12 | 16.90 1.26 |
| 59128.182674 | 2020-10-06 | 953 | 2.58 0.02 | 65.28 1.16 |
| 59128.942192 | 2020-10-06 | 1426 | 2.63 0.08 | 17.14 0.87 |
| 59129.906850 | 2020-10-07 | 237 | 2.53 0.28 | 3.38 0.56 |
| 59130.907624 | 2020-10-08 | 1558 | 2.32 0.10 | 3.60 0.25 |
| 59131.900956 | 2020-10-09 | 1483 | 2.43 0.12 | 6.83 0.53 |
| 59132.891488 | 2020-10-10 | 1463 | 2.60 0.10 | 5.35 0.31 |
| 59133.850977 | 2020-10-11 | 2934 | 1.64 0.12 | 1.19 0.12 |
| 59134.891522 | 2020-10-12 | 654 | 2.19 0.23 | 1.70 0.26 |
| 59135.835244 | 2020-10-13 | 2307 | 1.77 0.12 | 1.72 0.15 |
| 59137.660548 | 2020-10-14 | 1051 | 1.50 0.25 | 1.01 0.19 |
| 59138.269685 | 2020-10-15 | 1628 | 1.35 0.17 | 1.21 0.18 |

A.2 Swift-UVOT
| MJD | Date (UT) | ||||||
|---|---|---|---|---|---|---|---|
| 59072.013301 | 2020-08-11 | 12.75 0.04 | 13.56 0.05 | 13.08 0.05 | 13.59 0.06 | 14.23 0.06 | 14.27 0.06 |
| 59072.979057 | 2020-08-11 | 13.21 0.03 | 14.01 0.04 | 13.54 0.05 | 14.10 0.06 | 14.82 0.06 | 14.82 0.06 |
| 59074.007524 | 2020-08-13 | 13.02 0.04 | 13.82 0.05 | 13.38 0.05 | 13.96 0.06 | 14.61 0.07 | 14.63 0.06 |
| 59080.300875 | 2020-08-19 | 12.78 0.03 | 13.53 0.05 | 13.05 0.05 | 13.61 0.06 | 14.24 0.06 | 14.24 0.06 |
| 59081.600112 | 2020-08-20 | 12.58 0.04 | 13.34 0.05 | 12.86 0.05 | 13.46 0.05 | 14.15 0.15 | 14.12 0.06 |
| 59082.265103 | 2020-08-21 | - | 13.43 0.04 | 12.95 0.05 | 13.53 0.05 | - | 14.17 0.06 |
| 59083.054394 | 2020-08-22 | - | 13.34 0.04 | 12.87 0.05 | 13.42 0.05 | - | 14.10 0.06 |
| 59084.018388 | 2020-08-23 | 12.54 0.04 | 13.31 0.05 | 12.83 0.05 | 13.36 0.06 | 14.06 0.06 | 14.08 0.06 |
| 59085.319328 | 2020-08-24 | 12.70 0.04 | 13.49 0.04 | 13.01 0.05 | 13.56 0.06 | 14.23 0.06 | 14.23 0.06 |
| 59086.086696 | 2020-08-25 | 12.75 0.04 | 13.54 0.05 | 13.01 0.05 | 13.59 0.06 | 14.25 0.06 | 14.21 0.06 |
| 59087.077198 | 2020-08-26 | 12.89 0.04 | 13.68 0.05 | 13.16 0.05 | 13.74 0.06 | 14.31 0.07 | 14.33 0.06 |
| 59088.073026 | 2020-08-27 | 13.42 0.04 | 14.23 0.05 | 13.84 0.05 | 14.42 0.07 | 15.07 0.07 | 15.14 0.07 |
| 59098.704090 | 2020-09-06 | 13.04 0.05 | 13.85 0.05 | 13.42 0.05 | 14.05 0.05 | - | 14.71 0.06 |
| 59104.806412 | 2020-09-12 | 13.45 0.05 | 14.23 0.05 | 13.83 0.05 | 14.49 0.05 | 15.16 0.07 | 15.22 0.07 |
| 59113.191735 | 2020-09-21 | 13.14 0.05 | 13.89 0.04 | 13.41 0.05 | 13.95 0.06 | 14.62 0.06 | 14.61 0.06 |
| 59114.367874 | 2020-09-22 | 13.00 0.04 | 13.71 0.05 | 13.23 0.05 | 13.78 0.06 | 14.43 0.07 | 14.48 0.06 |
| 59116.151464 | 2020-09-24 | 13.02 0.04 | 13.72 0.05 | 13.22 0.05 | 13.78 0.06 | 14.31 0.07 | 14.39 0.06 |
| 59117.420004 | 2020-09-25 | 13.05 0.04 | 13.84 0.04 | 13.34 0.05 | 13.96 0.06 | 14.60 0.06 | 14.68 0.06 |
| 59124.730783 | 2020-10-02 | 12.72 0.04 | 13.46 0.04 | 12.97 0.05 | 13.51 0.06 | 14.19 0.11 | 14.19 0.06 |
| 59125.655695 | 2020-10-03 | - | 13.87 0.04 | 13.42 0.05 | 14.01 0.06 | - | 14.68 0.06 |
| 59126.597595 | 2020-10-04 | 13.23 0.07 | 13.99 0.07 | 13.53 0.07 | 14.07 0.09 | 14.93 0.15 | 14.79 0.09 |
| 59127.638321 | 2020-10-05 | 12.40 0.04 | 13.14 0.05 | 12.56 0.05 | 13.08 0.06 | 13.70 0.06 | 13.67 0.06 |
| 59128.182674 | 2020-10-06 | 12.62 0.04 | 13.30 0.05 | 12.72 0.05 | 13.19 0.06 | 13.73 0.06 | 13.76 0.06 |
| 59128.942192 | 2020-10-06 | 12.85 0.04 | 13.62 0.05 | 13.10 0.05 | 13.68 0.05 | 14.21 0.06 | 14.20 0.06 |
| 59129.906850 | 2020-10-07 | - | - | 13.32 0.06 | 13.89 0.06 | - | - |
| 59130.907624 | 2020-10-08 | 13.22 0.04 | 13.99 0.04 | 13.47 0.05 | 14.03 0.06 | 14.65 0.07 | 14.66 0.06 |
| 59131.900956 | 2020-10-09 | 12.91 0.04 | 13.61 0.04 | 13.14 0.05 | 13.67 0.06 | 14.38 0.07 | 14.31 0.06 |
| 59132.891488 | 2020-10-10 | 13.00 0.04 | 13.74 0.04 | 13.19 0.05 | 13.74 0.05 | 14.34 0.06 | 14.36 0.06 |
| 59133.850977 | 2020-10-11 | 13.32 0.04 | 14.10 0.04 | 13.63 0.05 | 14.22 0.06 | 14.89 0.06 | 14.92 0.06 |
| 59134.891522 | 2020-10-12 | - | 14.01 0.06 | 13.54 0.05 | 14.11 0.06 | - | 14.75 0.06 |
| 59135.835244 | 2020-10-13 | 13.12 0.04 | 13.95 0.04 | 13.46 0.05 | 14.06 0.06 | 14.69 0.06 | 14.77 0.06 |
| 59137.660548 | 2020-10-14 | 13.48 0.04 | 14.32 0.05 | 13.87 0.05 | 14.50 0.06 | 15.13 0.07 | 15.16 0.06 |
| 59138.269685 | 2020-10-15 | 13.61 0.04 | 14.42 0.05 | 13.92 0.05 | 14.55 0.06 | 15.30 0.06 | 15.27 0.07 |
Appendix B NuSTAR and NICER results